a parametric, preliminary structural analysis and optimization...
TRANSCRIPT

American Institute of Aeronautics and Astronautics
1
A Parametric, Preliminary Structural Analysis and
Optimization Approach with Manufacturing Cost
Considerations
Mario A. Lee1, Johanna Ceisel
2, Zhimin Liu
3, and Dimitri N. Mavris
4
Georgia Institute of Technology, Atlanta, Georgia, 30332-0150
This paper briefly describes an approach that uses preliminary design methods and
commercially available software to facilitate a coupling between structural design and
manufacturing cost estimation at the preliminary design level. The approach is illustrated
through a case study that features the structural analysis, optimization and manufacturing
cost assessment of a sub-sonic fighter wing-box. An automated, parametric modeling and
simulation environment is built and then used to provide the data required for the creation
of surrogate models as functions of high level wing geometry and performance variables.
These surrogate models are then used with a multi-objective genetic algorithm for the
purpose of providing a family of non-dominated designs that facilitate a trade-off between
weight and manufacturing cost. The approach is then generalized for application to other
assemblies within the airframe.
Nomenclature
Clb = section lift coefficient for basic lift distribution
Cla1 = section lift coefficient for additional lift distribution at a wing lift coefficient of unity
c = local chord of wing
ε = angle of twist, degrees
= average angle of twist, degrees
a = three dimensional lift slope per degree
A = aspect ratio
b = wing span
y = span-wise coordinate
Λ = sweep angle of wing quarter-chord line, degrees
ϑ = edge-velocity factor for symmetrical lift distributions
, = resultant, cross-sectional axial loads in the x and y directions, respectively
= resultant, cross-sectional in-plane shear load
, = resultant, cross-sectional bending moments about the y and x axes, respectively
= resultant, cross-sectional twisting moment
, = strains in the x and y directions, respectively
= in plane shear strain
, = mid-surface curvatures
A = extensional stiffness matrix
B = coupling stiffness matrix
D = bending stiffness matrix
____________________________ 1 Graduate Research Assistant, Aerospace Systems Design Laboratory, Daniel Guggenheim School of Aerospace Engineering,
Student Member AIAA. 2 Research Engineer II, Aerospace Systems Design Laboratory, Daniel Guggenheim School of Aerospace Engineering, Senior
Member AIAA. 3 Research Engineer II, Aerospace Systems Design Laboratory, Daniel Guggenheim School of Aerospace Engineering, Senior
Member AIAA. 4 Boeing Professor of Advanced Aerospace Systems Analysis and Director, Aerospace Systems Design Laboratory, Daniel
Guggenheim School of Aerospace Engineering, Associate Fellow AIAA.

American Institute of Aeronautics and Astronautics
2
I. Introduction
HERE is an ongoing affordability paradigm shift in industry and academia which seeks to change the way in
which complex systems are designed. Due to the competitive nature of the market, design has shifted from
design for performance to design for overall capability. This has led to a need for forecasting the economic viability
of a system with a high probability of success. In the case of the structural design of airframes, it is desirable not
only to estimate the structural weight of concepts, but also the cost of manufacturing these concepts. This is
especially the case with advanced structural materials such as advanced composites. Often, airframe weight cannot
be reliably used to predict the manufacturing cost of these structures for reasons ranging from lack of statistical data
to the dependence of manufacturing cost on other variables such as part count.
To produce structures that utilize such materials, there tend to be significantly higher manufacturing costs
relative to structures made from traditional materials such as aluminum alloys. This is due to higher material and
tooling costs, as well as longer manufacturing times. Moreover, there are various methods of manufacturing, raw
material forms etc. available to aircraft companies all with varying costs. This implies that there needs to be careful
consideration of the manufacturing costs associated with producing concepts that utilize these materials at the
preliminary design level. Such considerations may help designers to better adhere to budgetary constraints by
allowing them to quickly assess the impacts of making permutations to design variables, and then possibly trade
structural efficiency in order to obtain a more affordable design.
Furthermore, in the earlier stages of design, it is desirable to explore a variety of shapes and designs of the
structural concepts. This imposes the requirement of parametric models that seamlessly incorporate such changes
and transfer the relevant data throughout the constituent modules.
This paper addresses the creation of a parametric modeling and simulation environment which uses high level
geometric, performance, and structural design variables as inputs in order to facilitate a fully integrated structural
analysis, optimization, and manufacturing cost assessment of the wing-box of a sub-sonic fighter aircraft. The wing-
box is used as a proof of concept because it provides a variety of structural shapes, requiring various manufacturing
processes and tooling. This environment is then used to provide the requisite data for the creation of surrogate
models of wing-box weight and its associated manufacturing cost as functions of the aforementioned variables.
These surrogate models are then coupled with a simple multi-objective genetic algorithm to provide a family of non-
dominated solutions which can be used to facilitate the previously mentioned trade between structural efficiency and
affordability of the concepts being explored. A handful of designs can then be chosen subjectively for further
exploration and refinement, in order to gain even more accurate estimates of weight and manufacturing cost.
II. Methodology The modeling and simulation environment that was used for this study is presented in Figure 1. All modules
except for the External Loads and Structural-Manufacturing Data Translator modules utilize commercially available
software that are commonly used in industry for the structural design and manufacturing cost estimation of complex
systems (airplanes, launch vehicles, ships etc). They are integrated via Phoenix Ingration‟s Model Center. This
allows for the seamless transfer of data amongst the modules in a purely automated manner. This is in an effort to
carry out a fully automated linear static analysis of the wing-box model. The wing design and the constituent
modules are described in the sub-sections that follow.
Figure 1. Modeling and Simulation Environment
T

American Institute of Aeronautics and Astronautics
3
A. Wing-Box Design and Parameterization
The wing-box that is utilized in this paper is a two spar, multi-rib design based on the wing-box that was
investigated in Ref. 1. It is an advanced design that features the exclusive use of graphite-epoxy composites as the
primary structural material (Figure 2a). All of the features of this wing-box were retained for the current analysis
except for the rib design. The original design featured a rib with integral undulations in the web as opposed to
discrete stiffeners. The alternative rib design (Figure 2b) features a corrugated web with the upper and lower
intercostal/shear-tie combination joined to the web by a combination of pastebonding and damage arrestment
fasteners. It is considered that such a wing-box is ideal for investigation because it aids in identifying the economic
impact of manufacturing diverse structural parts from advanced materials.
a) b)
Figure 2a) Wing-box investigated in Ref. 1 b) Alternative rib investigated in the current study.
Over the years, major aircraft companies have adhered to certain design practices in the design of aircraft
components and sub-assemblies. As a result, there is a plethora of guidelines available for parameterizing the
structural model. An example is the position of the forward and aft spars along the wing chord in order to provide
sufficient space for the auxiliary services and high-lift devices present within and on the wing. Many similar design
practices pertaining to the positioning of major components2-3
have been applied to the geometric model in order to
facilitate the translation of the planform variables to resulting wing-box geometries. However, certain key variables
that affect structural weight and manufacturing costs have not been frozen, but were allowed to be optimized. These
include: rib spacing; stringer spacing; rib and spar stiffener spacing; and all part thicknesses.
The external shape of the overall
wing was modeled after that of the
F-86F aircraft. This aircraft was
chosen due to the availabililty of
non-proprietary data. It featured a
simple trapezoidal wing with the
NACA-0012 and NACA-0011
airfoils at the root and the tip
respectively. The internal layout of
the ribs was simplified into two
regions of independent rib spacing
with a transition point located at the
60% point outboard along the span.
This simplified wing-box is shown
in Figure 3. Figure 3. Simiplified wing-box model
B. External Loads
In order to simplify the scope of the linear static analysis of the wing-box, flexural and torsional aeroelastic effects
were not taken into consideration. Additionally, fatigue in the wing box design was not taken into consideration, nor
are any concentrated torques due to moments generated by high-lift devices and control surfaces.
The limiting load case chosen for the wing box is a 5g symmetric pull-up maneuver. For the calculation of the
take off gross weight (TOGW), Fuel Weight (FW), and Wing Empty Weight (WW), pre-existing surrogate models
for the F-86F that are functions of the wing planform and performance variables were utilized. The WW surrogate
model was scaled by a factor obtained from Ref. 4 to allow for an approximate weight reduction in an attempt to

American Institute of Aeronautics and Astronautics
4
capture the use of advanced composites as the structural material. The resulting WW is applied along the span as a
trapezoidal distribution whose local magnitude is proportional to the local chord.
For a wing that possesses aerodynamic and/ or geometric twist, the distributed lift load can be separated into two
components: basic and additional lift. The former corresponds to the lift present on the wing planform at its zero-lift
angle of attack, whereas the latter corresponds to the lift distribution that is added to the basic lift distribution for
angles of attack beyond that corresponding to zero lift. Figure 4 shows the basic lift distribution for a wing that
possesses geometric washout. The inboard portion of the wing produces positive lift whereas the outboard portion
produces negative lift. The result is zero equipollent lift load.
According to Ref. 5, the normalized basic lift distribution for wings with symmetrical twist about the aircraft
centerline may be estimated by Eq. (1):
(1)
Where:
The Cla1 distribution was estimated from curves presented in Ref. 6. These curves were created using the
Weissinger method as applied to various taper ratios, aspect ratios and sweeps at several span-wise stations. The
Weissinger method is based on the lifting line theory, but has modifications that allow for wing taper, wing sweep,
and low aspect ratios. As presented in Ref. 6, the results of this method have shown reasonable agreement with
wind-tunnel test data for several wing planforms. Both of these normalized distributions, when multiplied by the lift
required and summed, give the spanwise lift distributions at the locus of the aerodynamic center of the airfoils along
the wing.
To simulate the fuel stored in the wing, the inertia of the fuel due to the maneuver is applied to the lower wing
skin as a pressure load. Due to the wing‟s dihedral, the local magnitude of this fuel pressure is proportional to the
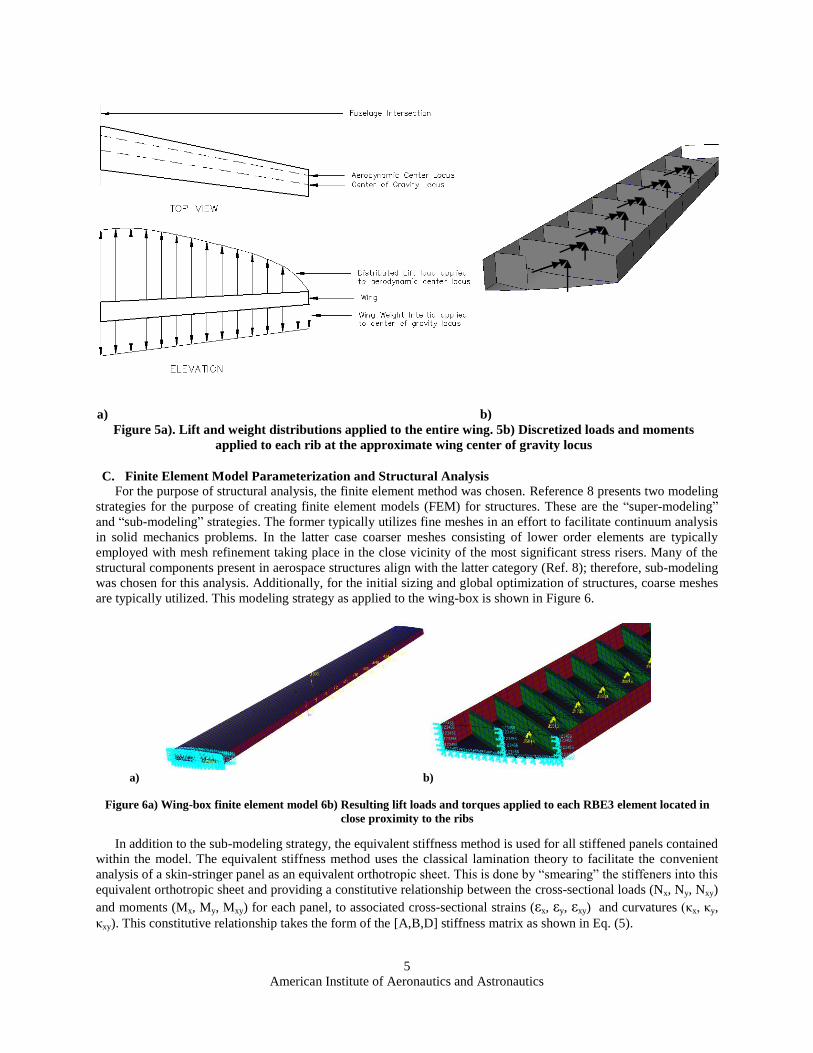
depth below the most outboard rib that bounds the fuel tank. The resultant lift load and weight inertia as applied to
the locus of the aerodynamic centers and approximate sectional center of gravity respectively along the wing span
are shown in Figure 5a. The resulting distributions are discretized and applied as equipollent loads and moments at
each rib at its intersection with the center of gravity locus (Figure 5b). Of special note is that the airfoils for the
chosen planform have negligible coefficient of moment for an exhaustive number of flight conditions and angle of
attacks as presented in Ref. 7. This explains the absence of the pitching moment distribution that typically
accompanies the distributed spanwise load along the locus of the aerodynamic center along the wing in Figure 5a.
Figure 4. Basic lift load distribution on a wing possessing wash-out
(2)
(3)
(4)
American Institute of Aeronautics and Astronautics
5
a) b)
Figure 5a). Lift and weight distributions applied to the entire wing. 5b) Discretized loads and moments
applied to each rib at the approximate wing center of gravity locus
C. Finite Element Model Parameterization and Structural Analysis
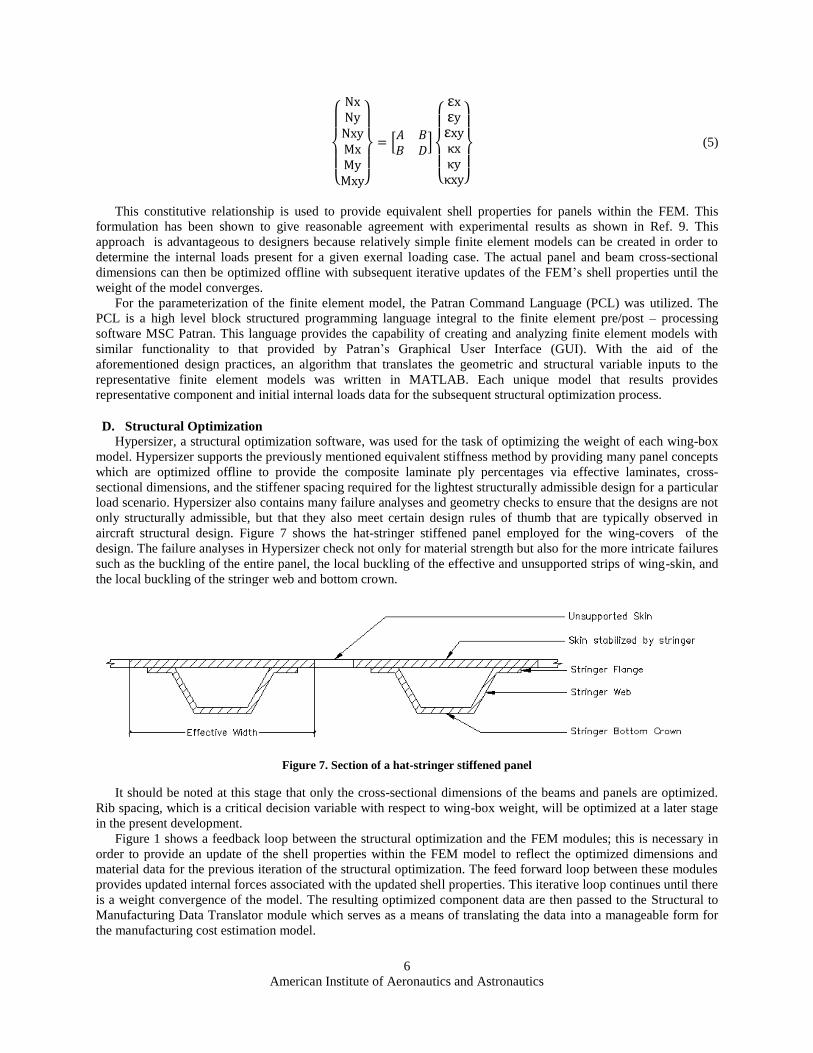
For the purpose of structural analysis, the finite element method was chosen. Reference 8 presents two modeling
strategies for the purpose of creating finite element models (FEM) for structures. These are the “super-modeling”
and “sub-modeling” strategies. The former typically utilizes fine meshes in an effort to facilitate continuum analysis
in solid mechanics problems. In the latter case coarser meshes consisting of lower order elements are typically
employed with mesh refinement taking place in the close vicinity of the most significant stress risers. Many of the
structural components present in aerospace structures align with the latter category (Ref. 8); therefore, sub-modeling
was chosen for this analysis. Additionally, for the initial sizing and global optimization of structures, coarse meshes
are typically utilized. This modeling strategy as applied to the wing-box is shown in Figure 6.
In addition to the sub-modeling strategy, the equivalent stiffness method is used for all stiffened panels contained
within the model. The equivalent stiffness method uses the classical lamination theory to facilitate the convenient
analysis of a skin-stringer panel as an equivalent orthotropic sheet. This is done by “smearing” the stiffeners into this
equivalent orthotropic sheet and providing a constitutive relationship between the cross-sectional loads (Nx, Ny, Nxy)
and moments (Mx, My, Mxy) for each panel, to associated cross-sectional strains (εx, εy, εxy) and curvatures (κx, κy,
κxy). This constitutive relationship takes the form of the [A,B,D] stiffness matrix as shown in Eq. (5).
a) b)
Figure 6a) Wing-box finite element model 6b) Resulting lift loads and torques applied to each RBE3 element located in
close proximity to the ribs
American Institute of Aeronautics and Astronautics
6
(5)
This constitutive relationship is used to provide equivalent shell properties for panels within the FEM. This
formulation has been shown to give reasonable agreement with experimental results as shown in Ref. 9. This
approach is advantageous to designers because relatively simple finite element models can be created in order to
determine the internal loads present for a given exernal loading case. The actual panel and beam cross-sectional
dimensions can then be optimized offline with subsequent iterative updates of the FEM‟s shell properties until the
weight of the model converges.
For the parameterization of the finite element model, the Patran Command Language (PCL) was utilized. The
PCL is a high level block structured programming language integral to the finite element pre/post – processing
software MSC Patran. This language provides the capability of creating and analyzing finite element models with
similar functionality to that provided by Patran‟s Graphical User Interface (GUI). With the aid of the
aforementioned design practices, an algorithm that translates the geometric and structural variable inputs to the
representative finite element models was written in MATLAB. Each unique model that results provides
representative component and initial internal loads data for the subsequent structural optimization process.
D. Structural Optimization
Hypersizer, a structural optimization software, was used for the task of optimizing the weight of each wing-box
model. Hypersizer supports the previously mentioned equivalent stiffness method by providing many panel concepts
which are optimized offline to provide the composite laminate ply percentages via effective laminates, cross-
sectional dimensions, and the stiffener spacing required for the lightest structurally admissible design for a particular
load scenario. Hypersizer also contains many failure analyses and geometry checks to ensure that the designs are not
only structurally admissible, but that they also meet certain design rules of thumb that are typically observed in
aircraft structural design. Figure 7 shows the hat-stringer stiffened panel employed for the wing-covers of the
design. The failure analyses in Hypersizer check not only for material strength but also for the more intricate failures
such as the buckling of the entire panel, the local buckling of the effective and unsupported strips of wing-skin, and
the local buckling of the stringer web and bottom crown.
Figure 7. Section of a hat-stringer stiffened panel
It should be noted at this stage that only the cross-sectional dimensions of the beams and panels are optimized.
Rib spacing, which is a critical decision variable with respect to wing-box weight, will be optimized at a later stage
in the present development.
Figure 1 shows a feedback loop between the structural optimization and the FEM modules; this is necessary in
order to provide an update of the shell properties within the FEM model to reflect the optimized dimensions and
material data for the previous iteration of the structural optimization. The feed forward loop between these modules
provides updated internal forces associated with the updated shell properties. This iterative loop continues until there
is a weight convergence of the model. The resulting optimized component data are then passed to the Structural to
Manufacturing Data Translator module which serves as a means of translating the data into a manageable form for
the manufacturing cost estimation model.
American Institute of Aeronautics and Astronautics
7
E. Manufacturing Cost Estimation
Innovative designs enabled by composite materials and advanced manufacturing processes has led to higher
design freedom and reduced weight, but typically increased manufacturing cost (Ref. 10). Design for manufacturing
has shown that there are other key cost drivers beyond weight, such as part and fastener count (Ref. 11). Further,
eighty percent of costs are locked at the end of the preliminary design level. As a result, engineers should no longer
take a strictly weight based approach to manufacturing cost estimation12,13
. Preliminary level variables need to be
taken into account to accurately estimate cost and conduct trades.
In order to assess manufacturing costs at a preliminary design level, SEER-MFG by Galorath, an empirical,
process-based cost tool was utilized. SEER-MFG contains relevant, current aerospace data, which were taken off of
ITAR restriction in 2007. SEER-MFG features a large breadth and depth of manufacturing processes that are
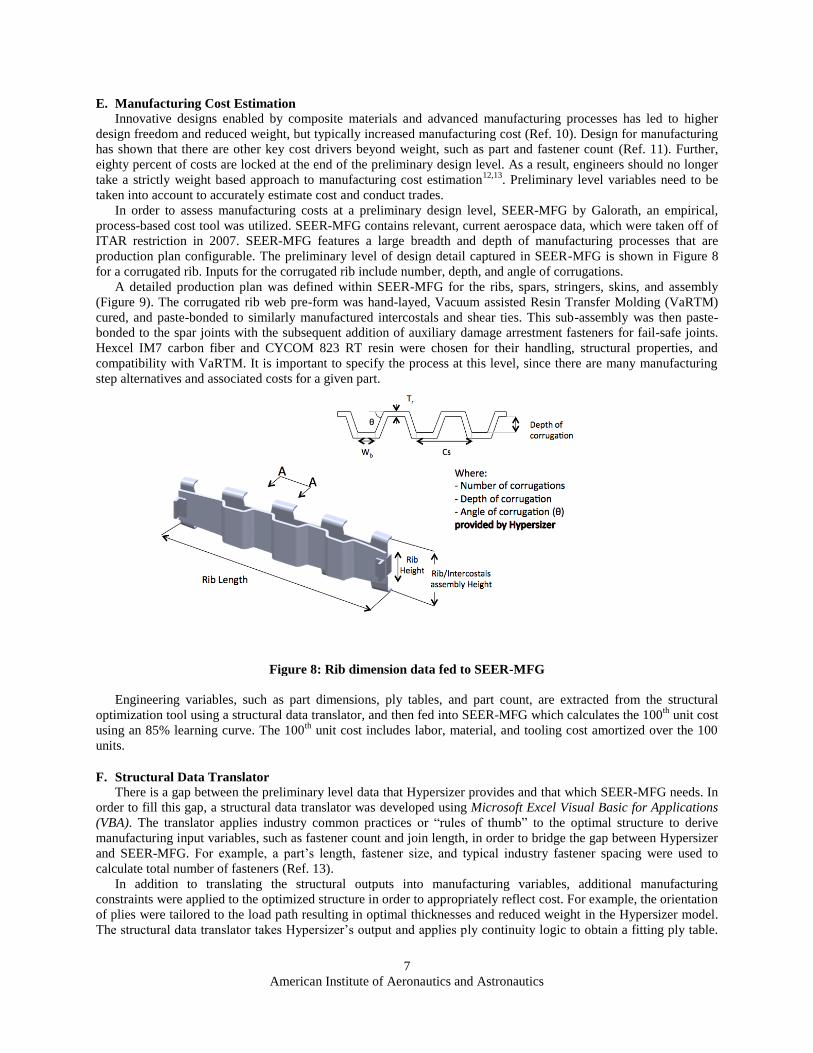
production plan configurable. The preliminary level of design detail captured in SEER-MFG is shown in Figure 8
for a corrugated rib. Inputs for the corrugated rib include number, depth, and angle of corrugations.
A detailed production plan was defined within SEER-MFG for the ribs, spars, stringers, skins, and assembly
(Figure 9). The corrugated rib web pre-form was hand-layed, Vacuum assisted Resin Transfer Molding (VaRTM)
cured, and paste-bonded to similarly manufactured intercostals and shear ties. This sub-assembly was then paste-
bonded to the spar joints with the subsequent addition of auxiliary damage arrestment fasteners for fail-safe joints.
Hexcel IM7 carbon fiber and CYCOM 823 RT resin were chosen for their handling, structural properties, and
compatibility with VaRTM. It is important to specify the process at this level, since there are many manufacturing
step alternatives and associated costs for a given part.
Figure 8: Rib dimension data fed to SEER-MFG
Engineering variables, such as part dimensions, ply tables, and part count, are extracted from the structural
optimization tool using a structural data translator, and then fed into SEER-MFG which calculates the 100th
unit cost
using an 85% learning curve. The 100th
unit cost includes labor, material, and tooling cost amortized over the 100
units.
F. Structural Data Translator
There is a gap between the preliminary level data that Hypersizer provides and that which SEER-MFG needs. In
order to fill this gap, a structural data translator was developed using Microsoft Excel Visual Basic for Applications
(VBA). The translator applies industry common practices or “rules of thumb” to the optimal structure to derive
manufacturing input variables, such as fastener count and join length, in order to bridge the gap between Hypersizer
and SEER-MFG. For example, a part‟s length, fastener size, and typical industry fastener spacing were used to
calculate total number of fasteners (Ref. 13).
In addition to translating the structural outputs into manufacturing variables, additional manufacturing
constraints were applied to the optimized structure in order to appropriately reflect cost. For example, the orientation
of plies were tailored to the load path resulting in optimal thicknesses and reduced weight in the Hypersizer model.
The structural data translator takes Hypersizer‟s output and applies ply continuity logic to obtain a fitting ply table.

American Institute of Aeronautics and Astronautics
8
This is important because ply continuity reduces manufacturing cost and stress concentration at the interfaces
between adjacent panels while increasing overall structural integrity (Ref. 14).
Figure 9. Manufacturing processes definitions for the wing-box
An example of the data translation process is the wing box skin below. In Hypersizer, a local optimization of the
ply table for each panel was performed (Figure 10a), based on the local edge loads and moments calculated for that
panel. The individual ply tables were then grouped into seven panels and then translated to seven overlapping ply
drops from the wing tip to the root (Figure 10 b-c). The reason the skins were grouped into seven larger structural
panels was to simplify the interface between Hypersizer and SEER-MFG and better reflect manufacturing costs. The
number of plies in each orientation for these larger panels was determined by the maximum number of plies in that
particular orientation amongst the constituent panels. A guide with 100% coverage of the wing box skin was then
defined at the wing tip by the ply table of the first and thinnest panel. The additional drops were evaluated as a
difference between the related panel and the guide. This guide-based approach ensures complete blending, while
producing the appropriate manufacturing lay-up costs (Ref. 15).
a) b) c)
Figure 10. Ply table data translation. a) Original structural panel distribution. b) New seven panel
distribution. c) Drops distribution to ensure blending.

American Institute of Aeronautics and Astronautics
9
In order to validate the process, the seven ply-drops method was compared to the original structural panel
distribution and a maximum, constant thickness approach for the wing-box baseline. The results are shown in Table
1. The seven ply-drops method decreased the set-up hours and material cost per unit from the original panel method.
The maximum, constant thickness method further reduced set up hours per unit but was extremely expensive in
terms of material cost and ply placement direct hour per unit. After socializing the results with subject matter
experts, the seven ply-drops method was determined to be a less complex and a preferable manufacturing definition
of the component (Ref 16). The magnitude and trends were deemed to be more practical.
Table 1. Comparison between different drop methodologies
REFERENCE:
Original Structural
Panels from
Hypersizer
OPTION 1:
Seven Ply-Drops
Method
OPTION 2: Maximum
Constant Thickness
Method
Labor Cost per Unit $ -3.65% -2.73%
Material Cost per Unit $ -0.74% 82.89%
Total Recurring Fab Cost per
Unit $ -2.16% 41.13%
Hand Layup Set-Up Hours
per Unit 17.2 -37.98% -58.44%
Ply Placement Direct Hours
per Unit 18.8 5.19% 77.61%
Total Direct Hours per Unit 33.6 7.59% 25.79%
G. Surrogate Models
As is often the case with simulations, there is a significant computational cost associated with running each
unique wing-box analysis, especially for those designs that feature many structural panels. It is for this reason that
surrogate models were created. A surrogate model is a statistical regression that provides a functional approximation
to an often more complicated simulation or experiement. By using carefully selected data points in the form of a
design of experiments, neural network surrogate models were trained for wing-box weight and average unit cost as
functions of the planform variables, mission flight range, and both independent rib spacings. These surrogate models
require significantly less computational time, but with the compromise of reduced accuracy. Care must be taken in
ensuring that surrogate models are used within the design variable ranges for which they are created. If used for
extrapolation, extremely erroneous results may occur.
II. Strategy for Rib Spacing Optimization
A. Rib Spacing Optimization
The problem of rib spacing optimization is visually represented in Figure 11. The traditional approach from a
structural optimization standpoint is to find the value(s) of rib spacing(s) required to produce the optimum
combination of the weight of the wing covers and aggregate rib weight3,17,18
.
However, consider the sensitivity plot shown in Figure 12. It shows the effect of the planform variables, mission
flight range, and rib spacings on the average unit cost of the wing-box for the ranges specified in Table 2. Notice the
significant impact that the inboard rib spacing has on the average unit cost of the wing-box. This is due to the
significant expense of producing each rib, which is mainly due to:
(i) Labor intensive manufacturing process
(ii) Tooling cost penalty incurred for introducing each unique rib (Unique due to wing taper)
(iii) Fastener and assembly costs for each additional rib
This observation implies that, provided all the other variables are held constant, fewer ribs (hence larger rib spacing)
leads to a lower unit cost for a particular wing-box. The large expenses associated with manufacturing ribs is not
atypical in wing-box production. Therefore, when affordability comes into consideration, both structural efficiency
and manufacturing cost need to be simultaneously considered in the rib spacing optimization problem.

American Institute of Aeronautics and Astronautics
10
Figure 11. Notional plot showing the behavior of wing-box weight with varying rib spacing
B. Multi-Objective Genetic Algorithm
In order to solve this multi-objective problem, wherein it is desirable to simultaneously minimize both the wing-
box weight and average unit cost, a multi-objective genetic algorithm was utilized. The genetic algorithm is a
heuristic optimization algorithm that is based on the theory of evolution, particularly natural selection. This theory
proposes that organisms that possess greater fitness have a stronger likelihood of surviving and hence passing on
their genes to the next generation by means of reproduction. The simple, multi-objective form of this algorithm has
the following steps:
(i) The generation (often random) of an initial population within a design space.
(ii) An iterative ranking process: the non-dominated candidates within the population are given the highest
rank and then removed from the population. The non-dominated solutions in the remaining population
are similarly ranked, but at a lower level and then removed. This continues until all the members of the
population are ranked.
(iii) Reproduction via cross-over and mutation: Two members of the population are chosen randomly.
Higher probabilities of selection are placed on those members of the population with greater fitness/
higher rank. Information from these two “parents” are passed onto the two resulting “children” by the
process of crossover. This process is analagous to sexual reproduction. Parts of these children may
change at random, depending on the mutation probability in the process of mutation. This is in an effort
to encourage diversity among the population members.
(iv) Step iii continues until a new population is generated
(v) Steps ii – iv are continued until the algorithm converges to the Pareto optimum set in the design space
Figure 12. Tornado plot showing the sensitivity of wing-box unit
cost to the design variables
-30 -20 -10 0 10 20 30 40 50
Span
RibSpacing1
RootChord
Sweep
FlightRange
RibSpacing2
TaperRatio
Table 2. Ranges for the design variables
Variable Lower Limit Upper Limit
Taper Ratio 0.36 0.67
RibSpacing2 (in) 8 40
FlightRange (nm) 220 1038
Sweep (deg) 24 45
RootChord (ft) 7.1 16.19
RibSpacing1 (in) 8 40
Total Wing Span (ft) 27.1 50.1
American Institute of Aeronautics and Astronautics
11
For further information on the multi-objective genetic algorithm (MOGA), please see Ref. 19. The resulting
Pareto optimum set contains a subset of the candidates in the design space with the best combination of objective
values, in this case wing-box weight and average unit cost. The process is illustrated with the following case study.
III. Case Study
A fixed wing-box planform was investigated in this case studyS. The reason for this is due to the fact that the
planform variables cannot be optimized without considering the effects on other disciplines such as aerodynamics.
For simplicity, the flight range was also fixed. These values are shown in Table 3. The optimization problem with
the introduction of side constraints on the rib-spacings is stated formally as follows:
Minimize WBW(RS1, RS2)
Minimize AUC(RS1, RS2)
Subject to:
8”≤ RS1≤ 40” and 8”≤ RS2≤ 40”
Where:
WBW: Wing-box Weight
AUC: Average Unit Cost
RS1, RS2: Rib spacing in the inboard and outboard sections of the wing, respectively
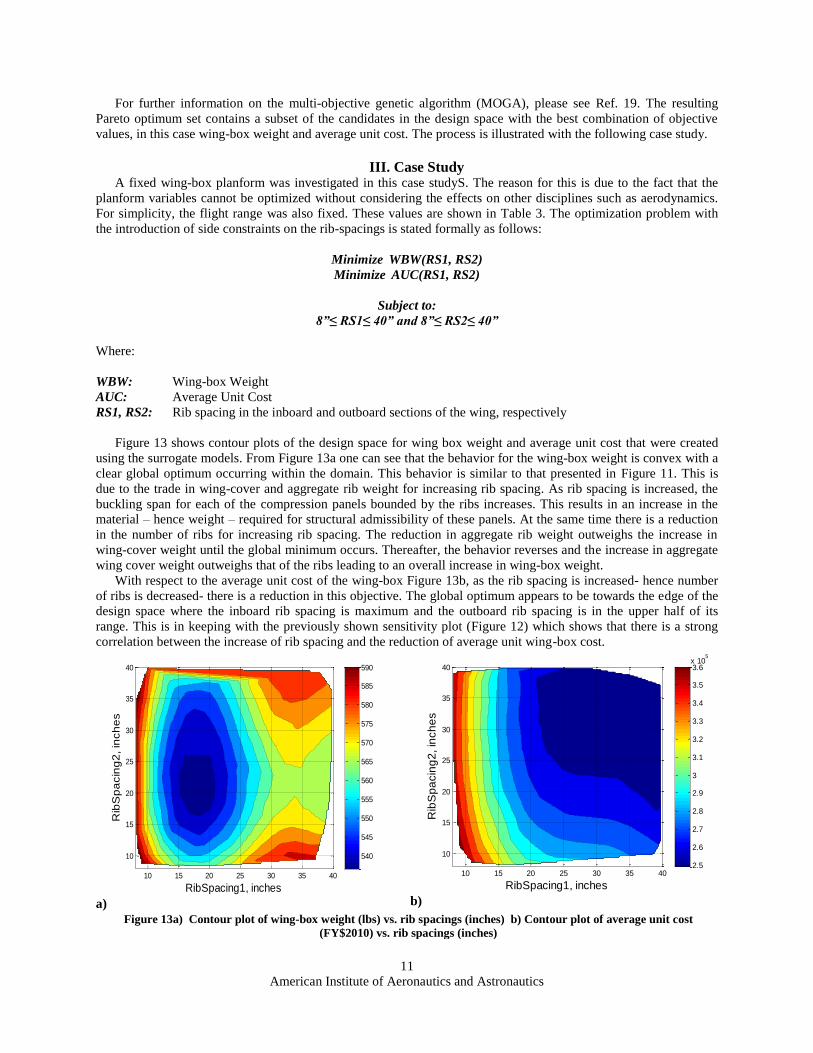
Figure 13 shows contour plots of the design space for wing box weight and average unit cost that were created
using the surrogate models. From Figure 13a one can see that the behavior for the wing-box weight is convex with a
clear global optimum occurring within the domain. This behavior is similar to that presented in Figure 11. This is
due to the trade in wing-cover and aggregate rib weight for increasing rib spacing. As rib spacing is increased, the
buckling span for each of the compression panels bounded by the ribs increases. This results in an increase in the
material – hence weight – required for structural admissibility of these panels. At the same time there is a reduction
in the number of ribs for increasing rib spacing. The reduction in aggregate rib weight outweighs the increase in
wing-cover weight until the global minimum occurs. Thereafter, the behavior reverses and the increase in aggregate
wing cover weight outweighs that of the ribs leading to an overall increase in wing-box weight.
With respect to the average unit cost of the wing-box Figure 13b, as the rib spacing is increased- hence number
of ribs is decreased- there is a reduction in this objective. The global optimum appears to be towards the edge of the
design space where the inboard rib spacing is maximum and the outboard rib spacing is in the upper half of its
range. This is in keeping with the previously shown sensitivity plot (Figure 12) which shows that there is a strong
correlation between the increase of rib spacing and the reduction of average unit wing-box cost.
a)
b)
Figure 13a) Contour plot of wing-box weight (lbs) vs. rib spacings (inches) b) Contour plot of average unit cost
(FY$2010) vs. rib spacings (inches)
RibSpacing1, inches
Rib
Sp
acin
g2
, in
ch
es
10 15 20 25 30 35 40
10
15
20
25
30
35
40
540
545
550
555
560
565
570
575
580
585
590
RibSpacing1, inches
Rib
Sp
acin
g2
, in
ch
es
10 15 20 25 30 35 40
10
15
20
25
30
35
40
2.5
2.6
2.7
2.8
2.9
3
3.1
3.2
3.3
3.4
3.5
3.6x 10
5

American Institute of Aeronautics and Astronautics
12
For this case study, MATLAB‟s built-in MOGA function was used. Two points must be noted with regards to
the usage of the MOGA for this case study. Firstly, the initial population was generated randomly so as not to favor
either objective as the algorithm proceeded. Secondly, and similarly, both objectives are equally weighted because
the assumption is made that the preferences between the objectives are not known a priori, leaving subjective
selection of candidates until after the process is completed.
An initial population consisting of 200 members was generated for the MOGA. The number of generations was
set to 1000, and the cross-over probability was set to 80%. The mutation probability was governed by MATLAB‟s
default settings which assigns a probability of mutation to each entry in the parent vector as selected from a
Gaussian distribution. This feature is dynamic in that the amount of mutation, which is proportional to the standard
deviation of the distribution, decreases with each new generation. The initial population overlaid on the contour plot
of both objectives is shown in Figure 14. It can be seen here that there is good coverage of the design space. The
algorithm was then executed, and it converged in 325 generations. The convergence criterion was that the average
change in the spread of the Pareto solutions was below the tolerance. The final Pareto frontier designs are shown on
the contour plot of each objective in Figure 15. The final set of solutions has some of its members in the optimum
region for each objective in its design space. Figure 16 shows the Pareto Front plotted in the objective space. It can
be seen that the two objectives are adversely related meaning that there has to be a trade off between weight and cost
when a design(s) is to be selected. In order to facilitate this selection, the Technique for Order Preference by
Similarity to Ideal Solution (TOPSIS) method was used. This method is a multi-criteria decision making technique
in which, based on preferences expressed, an ideal solution is generated. The solution that is closest to this solution
in terms of Euclidian distance is selected. Referece 20 provides further information on TOPSIS.
a)
b)
Figure 14a) Overlay of initial population on wing-box weight (lbs) contours. b) Overlay of initial population on average
unit cost (FY$2010) contours
RibSpacing1, inches
Rib
Sp
acin
g2
, in
ch
es
10 15 20 25 30 35 40
10
15
20
25
30
35
40
540
545
550
555
560
565
570
575
580
585
590
RibSpacing1, inches
Rib
Sp
acin
g2
, in
ch
es
10 15 20 25 30 35 40
10
15
20
25
30
35
40
2.6
2.7
2.8
2.9
3
3.1
3.2
3.3
3.4
3.5
3.6x 10
5

American Institute of Aeronautics and Astronautics
13
a)
b)
Figure 15a) Overlay of the Pareto optimum solutions on wing-box weight (lbs) contours. b) Overlay of Pareto optimum
solutions on average unit cost (FY$2010) contours
Table 3. Variable settings for the case study
Total Wing Span (ft) 50.0
Root Chord (ft) 16.0
Sweep (deg) 45.0
Taper Ratio 0.40
Flight Range (nm) 1038
Figure 16. Pareto optimum solutions in the objective space
A few scenarios involving different objective preferences are shown in Table 4. The preference/weighting for
each objective is expressed as a percentage. Please see Figure 16 for further reference.
Table 4. Selected designs based on preferences expressed between the two objectives
WBW
Preference(%)
AUC
Preference (%)
WBW
(lbs)
AUC
(FY$2010)
Percent > Min. Weight
(%)
Percent > Min. Cost
(%)
90 10 537.65 268,539 0.28 8.15
10 90 568.70 248,718 6.07 0.17
50 50 551.80 256,100 2.92 3.14
RibSpacing1, inches
Rib
Sp
acin
g2
, in
ch
es
10 15 20 25 30 35 40
10
15
20
25
30
35
40
540
545
550
555
560
565
570
575
580
585
590
RibSpacing1, inches
Rib
Sp
acin
g2
, in
ch
es
10 15 20 25 30 35 40
10
15
20
25
30
35
40
2.5
2.6
2.7
2.8
2.9
3
3.1
3.2
3.3
3.4
3.5x 10
5
535 540 545 550 555 560 565 570 5752.45
2.5
2.55
2.6
2.65
2.7
2.75
2.8x 10
5
Wing-box Weight, lbs
Ave
rag
e U
nit C
ost, F
Y$
20
10
90% - WBW; 10% - AUC
10% - WBW; 90% - AUC
50% - WBW; 50% - AUC
Pareto Optimum Designs

American Institute of Aeronautics and Astronautics
14
IV. Conclusion
A. Case study conclusions
For the purposes of structural analysis, optimization, and manufacturing cost assessment of aircraft structures,
several preliminary & detailed design level methods and software packages are available. The methods can be used
to make computer programs and the software packages can be automated to facilitate the incorporation of higher
fidelity methods into the earlier stages of design in order to reduce uncertainty. This approach was applied to a
multi-rib wing-box that featured the exclusive use of carbon fiber – epoxy resin composites. While many of the
structural variables corresponding to the dimensions of the structure were optimized by the suite of methods and
tools, rib spacing was shown to not only have an impact on weight, but also on manufacturing cost. This prompted
the use of multi-attribute optimization and selection techniques in order to select a subjective optimum design. For
the case study, single point designs were selected based on preferences expressed; however, it is advised that these
preferences be given ranges so that a group of designs may be selected. This is due to the fact that many sources of
uncertainty still remain ranging from simplifications in the analyses to factors that were not taken into consideration.
This handful of designs can be assessed with even higher levels of detail in order to attain even more accurate
estimates of structural weight and cost. However, the steps up to this point have allowed the designer to explore the
design space and then collapse it to the region of interest.
B. Generalization of approach
A similar process to that carried out for the wing-box can be used for other assemblies in the airframe with the
following general approach:
Problem definition: The problem definition involves various influencing factors, such as: interests/needs;
available resources and time; existing understanding of the problem, etc. These factors play an important
role in defining scope of work, level of fidelity, and assumptions.
Parametric, preliminary structural and costing modeling and simulation (M&S) environment: Based
on the problem definition, a set of commercial and/or in-house tools/methods can be selected to assemble a
baseline modeling and simulation flow. Upon validation of the baseline, an automated, parametric
environment can then be built. Either commercially available intergration tools (such as ModelCenter and
iSight) or customized scripts can be used to develop such an integrated parametric environment. Utilizing
the extensive aircraft design practices that are available, the parametric models can be used to translate high
level variables into resulting structural designs.
Tools that facilitate the integration of structures and manufacturing cost estimation are typically not
readily available and need to be built. This involves the usage of industry common practices in order to
bridge the gap between the output of structural optimization tools and manufacturing cost estimation
models.
Surrogate modeling: The M&S environments are typically computationally expensive; therefore, it is
often convenient to use surrogate models for the purpose of providing objective values. The requisite data
for the surrogate models can be obtained by carrying out a design of experiments on the M&S environment.
Once validated for the desired level of accuracy, the surrogate models provide a more computationally
expedient means of calculating objective values for the design variable ranges of interest.
Multi-objective optimization: Associated with the creation of surrogate models via statistical software
packages such as JMP from SAS, is the capability of generating sensitivity plots similar to the tornado plot
shown in Figure 12. These sensitivity plots can be used to identify the main weight and manufacturing cost
variability drivers in structural design as was done in the rib spacing optimization. These design variables
can then be optimized in the face of adversely related objectives by means of utilizing multi-objective
optimization methods. Candidates can then be selected subjectively via multi-objective selection
techniques.
Acknowledgments
The authors would like to thank our sponsors, John Griffith, Charley Saff, Steven Wanthal, and Keith Rupel
from the Boeing Company for their leadership and direction. The authors also would like to thank James Ainsworth
American Institute of Aeronautics and Astronautics
15
from Collier Research Corporation, Joe Falque, and Brian Glauser from Galorath Incorporated for their support and
guidance with their respective tools. Additionally, this work would not have been possible without the contributions
of the graduate research assistants on the 2012 MInD Grand Challenge team from ASDL, who developed and
contributed the manufacturing and structural data translator models, wrappers, and surrogates. Paolo Aloi, Andrew
Deschenes, and Scott Phelan were the project manager, chief engineer, and manufacturing lead respectively.
References 1Toi, Y., Harada, A., Tanaka, S., Amaoka, K., and Kikukawa, H. “Development of affordable composite wing structure,”
Advanced Composite Material, Vol. 12, No. 4, 13 May. 2003, pp. 321–329. 2Sensmeier, M D.. and Samareh, J.A.: “A Study of Vehicle Structural Layouts in Post-WWII Aircraft‟ NASA Rep. No. 1624
(2004) 3Niu, M.C.Y, Airframe Structural Design, 2nd ed., Hong Kong Conmilit Press Ltd., North Point, Hong Kong, 1999, Chaps. 3,
Chaps. 8 4Raymer, D.P, Aircraft Design: A Conceptual Approach, 4th ed., AIAA Education Series, AIAA, Virginia, 2006, Chaps. 15,
pg. 455 5DeYoung, J. and Harper, C.W.: „Theoretical Symmetric Span Loading at Subsonic Speeds for Wings Having Arbitrary plan
form.‟ NACA Rep. No. 921, (1948) 6Sivells, J.C.: „An Improved Approximate Method for Calculating Lift Distributions due to Twist.‟ NACA TN 2282, (1951) 7Ladson, C.L. and Acquilla, S.H.: „High Reynolds Number Transonic Tests of an NACA 0012 Airfoil in the Langley 0.3-
Meter Transonic Cryogenic Tunnel.‟ NACA Technical Memorandum 100527, (1987) 8Morris, A. J., Taig, I.C., and Venkayya, V. B., Practical Application of Finite Element Analysis to Aircraft Structural
Design, AGARD, 1986, pp : 3-1 to 3-18 9Wu, C.L. and Duan, S.H.: „Buckling Behaviour of Composite Laminated Corrugated Panel with Sinusoidal Profile Part
1: Equivalent Stiffness Terms.‟ Aircraft Strength Research Institute of China, Xian, 710065 China (2009) 10P.Stickler, “Composite Materials for Commercial Transport – Issues and Future Research Direction” Proceedings of the
ASC, 17th Annual Technical Conference, West Lafayette, IN, 2002 11Army Materials and Mechanics Research Center, “Military Handbook Design Guide for Producibility” (MIL-HDBK-727),
Department of Defense, Washington, D.C., 1984 12Johanna M. Ceisel, Philipp Witte, Tim Car, Satya Pogaru, Dimitri N. Mavris, “A Non-Weight Based, Manufacturing
Influenced Design (MInD) Methodology for Preliminary Design,” 28th Congress, ICAS, Brisbane, Australia, 2012 (to be
published) 13T. Gutowski, Henderson, R., and Shipp, C."Manufacturing Costs for Advanced Composites Aerospace Parts," SAMPE
Journal, Vol. 27, No. 3, 1991, pp.37-43 14Liu, D., Toropov, V. V., Zhou, M., Barton, D. C., Querin, O. M., “Optimization of Blended Composite Wing Panels Using
Smeared Stiffness Technique and Lamination Parameters” 51th AIAA/ASME/ASCE/AHS/ASC Structure, Structural Dynamics,
and Material Conference, Orlando, Florida, 12-15 April 2010. 15Seresta, O., Gurdal, Z., Adams, D.B., and Watson, L.T., “Optimal Design of Composite Wing Structures with Blended
Laminates,” Composites Part B: Engineering, Vol. 38, 2007, pp. 469-480. 16Mazumdar, S. K., Composites manufacturing: materials, product, and process engineering, CRC Press LLC, Boca Raton,
2002, Chaps. 5.4. 17Richards, D.M.., “The minimum weight design of compression structures including plasticity effects,” Ph.D. Dissertation,
College of Aeronautics., Cranfield Initute of Technology, Cranfield, United Kingdom, 1977. 18Wakayama, S., Kroo, I, “Subsonic Wing Planform Design Using Multidisciplinary Optimization,” AIAA Journal of
Aircraft, Vol. 32, No. 4, AIAA, 1995, 19Deb, Kalyanmoy, "Multi-Objective Optimization using Evolutionary Algorithms," John Wiley & Sons, Ltd, Chichester,
England, 2001. 20Lai, Y-J., Liu T-Y, Hwang C-L, “TOPSIS for MODM,” European Journal of Operational Research, Vol. 76, Issue 3, 1994,
pp. 486-500 21Berthelot, J.M., Composite Materials: Mechanical Behavior and Structural Analysis, 1st ed., Springer-Verlag New York,
Inc., 1999, Chaps. 14
.

American Institute of Aeronautics and Astronautics
16