a panel data analysis of foreign trade determinants of ... · a panel data analysis of foreign...
TRANSCRIPT

A Panel Data Analysis of Foreign Trade
Determinants of Nepal: Gravity
Model Approach
Subash Acharya
Abstract
This study aims to identify the trade (export, import and trade balance) determinants of
Nepal using extended gravity model and recommend specific trade policy to promote
foreign trade. The gravity model of international trade takes notion from Newtonian
physical science that the gravitational force between any two objects is proportional to
the product of their masses and inversely proportional to distance; similarly, the trade
between any two countries is proportional to the product of their GDPs and inversely
proportional to distance. Empirical results based on panel data set containing 21 major
trade partner countries for 6 years found that export and import of Nepal is explained by
real GDP of trade partner countries. Increase in real GDP of trade partner countries
increases both export and import; however, export increases at higher rate than import.
The trade deficit of Nepal increases if real GDP of trade partner country increases, even
though export is increasing at higher rate than import. This is because Nepal is
importing more than exporting to those countries in absolute terms. Nepal exports more
to SAFTA countries than non-SAFTA and imports less from the OECD countries than
non-OECD. As per basic idea of gravity model, distance to trade partner countries is
highly significant implying higher the distance, lower the trade. The country specific
fixed effect analysis shows that time invariant factors are also significant to determine
the trade balance of Nepal.
Key words: Foreign Trade, GDP, Gravity Model, Panel Data
JEL Classification: C23, F10, F14
Assistant Manager, Nepal Rastra Bank, Nepalgunj, Nepal. Email: [email protected]
This paper is based on thesis submitted to Ajou University in partial fulfillment of requirements for
the degree of Master of Arts in International Trade in June 2012. The earlier version of this paper
is available at www.nrb.org.np under NRB Working Paper Series, NRB-WP-13, 2012
Acknowledgement: I would like to express my sincere gratitude to Prof. Kim, Dong Geun for his
valuable comments and guidance to bring the thesis work into a right track. I would also like to
thank all others for their constructive remarks.

NRB ECONOMIC REVIEW 2
I. INTRODUCTION
The previous studies conducted to analyze the direction and pattern of trade generally
agree that the countries involved in trade and exchange mutually gain. Such gain from
international trade is, however, not uniform and equal to all the countries, depending
upon several country specific factors. The international trade related studies done with
some extension in an established model including country specific factors can specify the
model correctly to explain the variation in international trade. The United National
Conference on Trade and Development (UNCTAD) has revealed that in 2011 out of
$69.72 trillion world GDP, $18.20 trillion was traded across the countries. Based on the
data, the share of international trade on world GDP accounts for 26.10 percent, which
reflects growing importance of international trade in the world economy.
Nepal has shown mixed economic performance since the last decade. The average GDP
growth rate during 2000-2010 is recorded as 3.88 percent. The GDP growth for Fiscal
Year (FY) 2011-12 stood at 4.6 percent whereas it was 3.8 percent in FY 2010-11. The
sectoral contribution to GDP is estimated at 50.31 percent by tertiary sector, 35.68
percent by primary sector and 14.02 percent by secondary sector in the FY 2011-12,
while the share of export in GDP reached 9.8 percent and that of import in GDP stood at
32.6 percent during the same period.1
Based on open economic principle, liberalization and privatization policy has been
adopted in Nepal since 1980s with the aim to maximize net economic benefit, that opened
up international trade activities in the country. The basic notion for open economic policy
was to achieve economic development and growth by attracting domestic and foreign
investment, generating employment opportunity and alleviating poverty. The process of
opening the economy accelerated further after the restoration of democracy in 1990 by
introducing new policies and amending existing policies in order to make them
compatible with outward oriented regime. Some of these policies include Industrial
Policy 1992, Trade Policy 1992, Privatization Policy 1994 (GONMOF and ADB, 2010).
The main objective of this study is to test the extended gravity model of international
trade in the context of Nepal. The reason for the name is the analogy to Newton's law of
gravity: just as the gravitational attraction between any two objects is proportional to the
product of their masses and diminishes with distance, the trade between any two countries
is, other things being equal, proportional to the product of their GDPs and diminishes
with distance (Krugman and Obstfeld, 2009, p.14). It uses panel data set to analyze
international trade pattern of Nepal using different dependent variables. It identifies and
measures export value determining factors of Nepal with major trade partners in gravity
model. Similarly, this study examines the gravity model as determinant for import and
trade balance as well. Based on the regression result with gravity model, the study finally
1 The figures are derived from web site of UNCTAD and Economic Survey 2011/12.

A Panel Data Analysis of Foreign Trade Determinants of Nepal: Gravity Model Approach
3
recommends specific trade policies to increase net economic benefit from the
international trade of Nepal with major trade partners.
II. OVERVIEW OF FOREIGN TRADE OF NEPAL
Nepal signed first trade and transit treaty with India, the largest trade partner, in 1950;
therefore, the treaty has been renewed several times and in March 2007, Nepal and India
entered into bilateral trade treaty. After adopting liberalization policy since mid-1980’s
Nepal opened up border for international trade and moved forward from inward-looking
strategy to outward-looking strategy. As a result of open economic policy, Nepal has
entered into several bilateral, regional and multilateral trade agreements. Nepal is member
of two major regional trade agreements- South Asian Free Trade Area (SAFTA) since
2004 and Bay of Bengal Initiative for Multi-sectoral Trade and Economic Cooperation
(BIMSTEC) since 2004. Similarly, Nepal is the first least developed country (LDC) to
become member of World Trade Organization (WTO) in 2004 by negotiation. All these
initiations indicate Nepal’s move towards open economic policy and commitment
towards international trade and global competition.
The GDP growth rate of Nepal has never been consistent since the last few decade. Nepal
secured highest growth of 8.2 percent in 1994 and lowest growth of 0.12 percent in 2002.
The shares of agriculture and non-agriculture sectors to GDP in FY 2011/12 are estimated
at 35.1 percent and 64.9 percent respectively. The low growth of Nepal is due to high
dependency of agriculture output on monsoon and poor industrial base. Basic
infrastructure development is therefore essential for sustainable economic growth of
Nepal. It is important to attract domestic and foreign investment and increase
employment opportunity for overall economic welfare. Kafle (2006) conducted a study to
identify the effectiveness of existing trade policy of Nepal, realizing the fact that foreign
trade is an appropriate means for economic development. The study concluded that
Nepal's external sector policy should focus on infrastructure development and
establishment of industries that utilizes local resources.
External sector of Nepal is historically weak with perpetually increasing trade deficit. In
the external sector, exports continued to surge in the recent years and imports remained
volatile. Although the growth rate of exports outplaced that of imports, trade deficit
widened mainly due to relative larger volume of imports (Khatiwada and Sharma, 2002).
The import substitution industries and export-oriented industries may help the country to
come out of the continuous unbalanced trade. Trade deficit has been mainly financed by
remittance inflows, therefore the volume and sign of current account is largely
determined by volumes of imports and remittance from abroad.
The economic growth performance of Nepal has not only remained slow but, in relation
to the level of investment in the economy, also modest. It may be worth mentioning that,
for attaining economic development objectives in an environment of smooth and stable
macro economy, saving and investments must be productive. Wide gap between exports

NRB ECONOMIC REVIEW 4
and imports should be sustainably narrowed. Toward these ends, excessive consumption
and unnecessary imports should be discouraged. Sound framework and incentives should
be built to ensure that the resources are productively utilized. The government policies
and arrangements should help ensure such a framework (Basyal, 2011).
The share of India in Nepal's total trade has reached at 65.1 percent in FY 2011/12.
During same period, out of total export, 66.80 percent has been exported to India and out
of total import, 64.80 percent is imported from India.2 Nepal has signed different trade
and transit related agreements with 17 different countries.3 Nepal, a small land locked
country, has an intensive trade network around the world. However, the statistics of trade
shows that trade of Nepal is not balanced and facing continuous trade deficit situation.
Lack of strong industrial base, limited market access and narrow export product line are
considered as major problems for Nepalese economy. Developing industrial infrastructure
with capacity development based on competitive advantage can help Nepal to improve
from large trade deficit.
III. METHODOLOGY
The Gravity Model
The gravity model of international trade takes notion from Newtonian physical science.
The Universal Law of gravity states that the gravitational force is proportional to the
product of two masses and inversely proportional to the square of distance between them.
The relation can be expressed as;
= ………. (1)
where, is gravitation force between masses a and b. is product of two
masses. is square of distance between two masses and A is a constant of the
equation.
The gravity model was first applied in international trade by Tinbergen (1962), where
is replaced by trade volume 4, and by GDP of origin country i, and
GDP of destination country j, and is replaced by the physical distance between
2 Refer to Current Macroeconomic Situation of Nepal (based on annual data of FY 2011/12)
published by NRB.
3 Refer to the web site of Trade and Export Promotion Center of Nepal (TEPC) for details;
www.tecp.gov.np
4 The trade volume is presented as dependent variable to review the gravity model; however,
this study uses trade components such as export, import and trade balance as dependent
variables with same independent variables.

A Panel Data Analysis of Foreign Trade Determinants of Nepal: Gravity Model Approach
5
countries i and j, from a point of reference. Then the gravity model of international
trade can be expressed as;
= A ………. (2)
For the estimation purpose this relationship can be expressed as;
= ………. (3)
where, , , and are the parameters to be estimated. Using natural logarithm,
the interpretation of parameter is coefficient of elasticity of trade volume with regard to
the explanatory variable. The linear equation can be expressed as;
= ………. (4)
where, is the error term of the model. In general, , > 0 and < 0; as per
gravity theory.
Anderson (1979) specified the extended gravity model using population of either country
as explanatory variable. The population is regarded as a part of the mass in equation (1)
and trade volume is expected to be proportionate to the population. The linear equation
further can be expressed as;
= ………. (5)
where, and represents natural log of population of country i and country j
respectively. The population of the trade partner countries can be proxy to the market size
and therefore they can be positively related to trade components, i.e. and 0. On
the other hand, if we see as increase in population decreases per capita GDP then the
population can have negative relation to trade components, i.e. and 0.
There is strong empirical relationship between the size of a country’s economy and the
volume of both its imports and its exports (Krugman et al., 2009). The idea of the gravity
model is that the larger economies consume more and produce or sell more. Two larger
economies relatively involve in larger amount of trade compared to two smaller
economies because of their larger spending on consumption. However, the relationship is
constrained by the trade related barriers such as physical distance between countries that
can be proxy to transportation costs and other related variables. The size of economy is
generally given by its size of total GDP value and market size by population. The gravity
model is a natural way to determine the expected trade volume between trade partners;

NRB ECONOMIC REVIEW 6
however, extension of the model with country or region specific factors can increase
accuracy of estimation.
Data Description
The data set for this study are from various government and non-government agencies
and we constructed a panel data set containing 21 trade partner countries of 6 years from
2005 to 2010. Those 21 trade partner countries are largest partner in terms of imports and
exports. There are no missing values; hence the data set is balanced panel with total 126
observations over a period of 6 years. The trade data are collected from Trade and Export
Promotion Center of Nepal (TEPC) and data of real GDP and population are collected
from UNCTAD. All the data are collected online from the web sites of the related
organizations that are free to use. The physical distance is taken from
www.timeanddate.com. The nominal export and import values expressed in Nepalese
currency are obtained from the TEPC and converted into real terms using real exchange
rate5. Period end selling exchange rate of USD is used as nominal exchange rate that is
derived from NRB. All currency units are in thousands of USD. The distance between
Nepal and its trading partner is measured in kilometers as the theoretical air distance
between capital cities of both countries. Population count unit is in 1000s of number. The
economic freedom index6 of Nepal is based on 0 to 100 scale, where 100 represents
maximum freedom. The index is mainly developed out of business, trade, fiscal,
government, monetary, investment, financial, property rights, corruption and labor
freedom. The overall score from all these indices is the economic freedom index that is
the weighted average of all 10 indices weighted equally. This index in the model is
expected to capture to what extent Nepal trades with economically free country.
Data Analysis Procedure and Instrument
We estimate the gravity model of international trade by using a panel data set. Panel data
approach is preferred for this study because there exist several advantages of using panel
data analysis. First, it allows to measure impact of particular period or group on the
dependent variable. Second, this approach is useful when estimation model is likely to
have time constant individual heterogeneity and need to control for the variables that are
unobserved. Third, policy analysis is generally effective with panel data set because it can
carry out the study with short time period and among heterogeneous groups. The
econometric model used in this study can be easily extended by using more policy
variables for policy analysis.
5 The real exchange rate is calculated by multiplying nominal exchange rate (NRS/USD) by the
ratio of CPI of Nepal to CPI of USA and real value of export and import are calculated by
dividing nominal values by real exchange rate.
6 The index is derived from the website of the Heritage Foundation, visit www.heritage.org for
detail.
A Panel Data Analysis of Foreign Trade Determinants of Nepal: Gravity Model Approach
7
It is well known that ordinary least square (OLS) is not an appropriate estimation device
when panel data are used, however we start with the OLS for comparison purpose.
Thenafter, we estimate the model by the two basic panel data regression models: the fixed
effect (FE) and random effect (RE) models. The fixed effect model wipes out all
unobserved and time constant factors that might be correlated with error term to avoid
endogenous problem. Thus, it is a good idea to rely on FE when researcher thinks that
unobserved factors are correlated to the independent variables. The RE model is
appropriate to estimate the impact of time constant as well as time variant factors. It
consistently assumes that time constant variables are not correlated with independent
variables and they are important to include in the estimation. Therefore, critical difference
between FE and RE model is that the FE model allows correlation between unobserved
effect and the explanatory variable whereas the RE requires no correlation between them.
It is fairly common to see researchers apply both RE and FE and then formally test for
statistically significant differences in the coefficient on the time varying explanatory
variables (Wooldridge, 2009, p.493).
Hausman (1978) proposed a test to decide estimation between fixed effect and random
effect. It tests against null hypothesis that the unobserved effect is uncorrelated with the
explanatory variables i.e. RE is consistent. If the test fails to reject the null hypothesis
then this means the RE and FE estimates are similar and RE model estimators are more
efficiently than FE model.
Econometric Models Specification The traditional gravity model is expressed in equation (5). In this study, we consider three
different types of trade values to investigate the multilateral aspects of Nepalese trade
pattern. The dependent variables are export, import, and trade balance (export - import) of
Nepal with same independent variables. Hence, we have three different models to
estimate specified in equation (6) through (8).
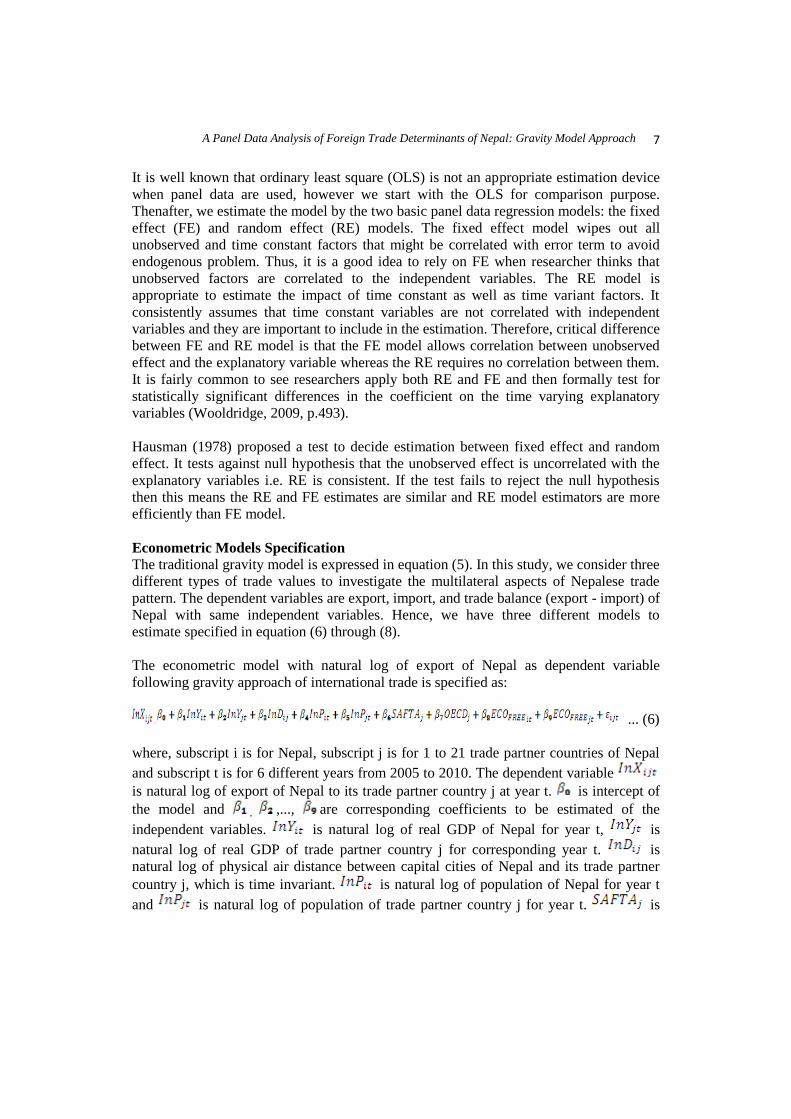
The econometric model with natural log of export of Nepal as dependent variable
following gravity approach of international trade is specified as:
= ... (6)
where, subscript i is for Nepal, subscript j is for 1 to 21 trade partner countries of Nepal
and subscript t is for 6 different years from 2005 to 2010. The dependent variable
is natural log of export of Nepal to its trade partner country j at year t. is intercept of
the model and , ,..., are corresponding coefficients to be estimated of the
independent variables. is natural log of real GDP of Nepal for year t, is
natural log of real GDP of trade partner country j for corresponding year t. is
natural log of physical air distance between capital cities of Nepal and its trade partner
country j, which is time invariant. is natural log of population of Nepal for year t
and is natural log of population of trade partner country j for year t. is
NRB ECONOMIC REVIEW 8
dummy variable equal to 1 if the trade partner country j is member of SAFTA, otherwise
0. Similarly, is dummy variable equal to 1 if the trade partner country j is member
of OECD, otherwise 0. is economic freedom index of Nepal and
is economic freedom index of partner country j for year t. is error term of the model
that represents all unobserved factors that explain the dependent variable .
The econometric model with natural log of import of Nepal as dependent variable
following gravity approach of international trade is specified as the following:
= …(7)
where, is natural log of import of Nepal from trade partner j, for year t.
Similarly, the gravity approach is also used to develop the model for trade balance of
Nepal. The trade balance is given by in value and it is specified as;
= … (8)
where, is trade balance of Nepal with country j for year t. Note that the dependent
variable is not transformed into natural log because in many cases Nepal has had
negative trade balance or trade deficit i.e. < 0.
.
IV. EMPIRICAL RESULTS
We estimate the models in equation (6) through (8) by using 3 different methods; pooled
OLS, RE and FE. To choose between RE and FE, Hausman's (1978) specification test is
conducted7. Failing to reject null hypothesis through Hausman test suggests that the RE
estimators are consistent, otherwise FE estimators are consistent for interpretation.
Panel data analysis is based on strong assumption of no heteroskedasticity and no serial
correlation. Therefore, estimation model with panel data assumes that regression
disturbances are homoskedasticity with same variance across time and individuals. This
may be restrictive assumption for panels, where the cross-sectional units may be varying
in size and as a result may exhibit different variation. Similarly, ignoring serial
correlation when it is present results in consistency but inefficient estimates of the
regression coefficient and biased standard errors (Baltagi, 2008). However, the issue of
serial correlation is easily dissolved by various testing methodologies.
7 Hausman tests is carried out against null hypothesis H0: E( / )=0, i.e. contemporous
correlation between error term and independent variables is zero, which is also a basic
assumption of RE model.

A Panel Data Analysis of Foreign Trade Determinants of Nepal: Gravity Model Approach
9
In case of RE model, a joint Lagrange Multiplier (LM) test for the error component
model is applied to detect the heteroskedasticity and serial correlation. If detected, then
generalized least square (GLS) approach is followed to get the estimators robust to
heteroskedasticity and serial correlation. In case of FE model, modified Wald test is
conducted for groupwise heteroskedasticity and Wooldridge test is done for serial
correlation. Based on the detection of either heteroskedasticity or serial correlation or
both the robust standard errors are estimated to get the efficient estimators for FE model.
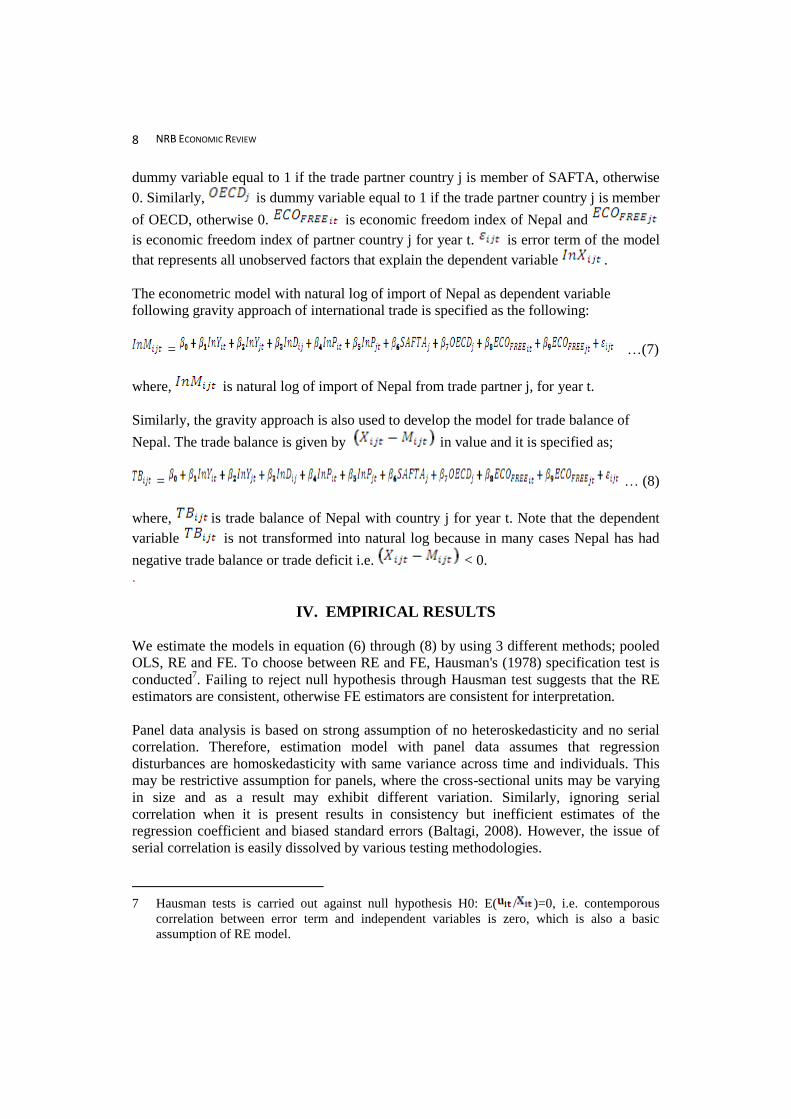
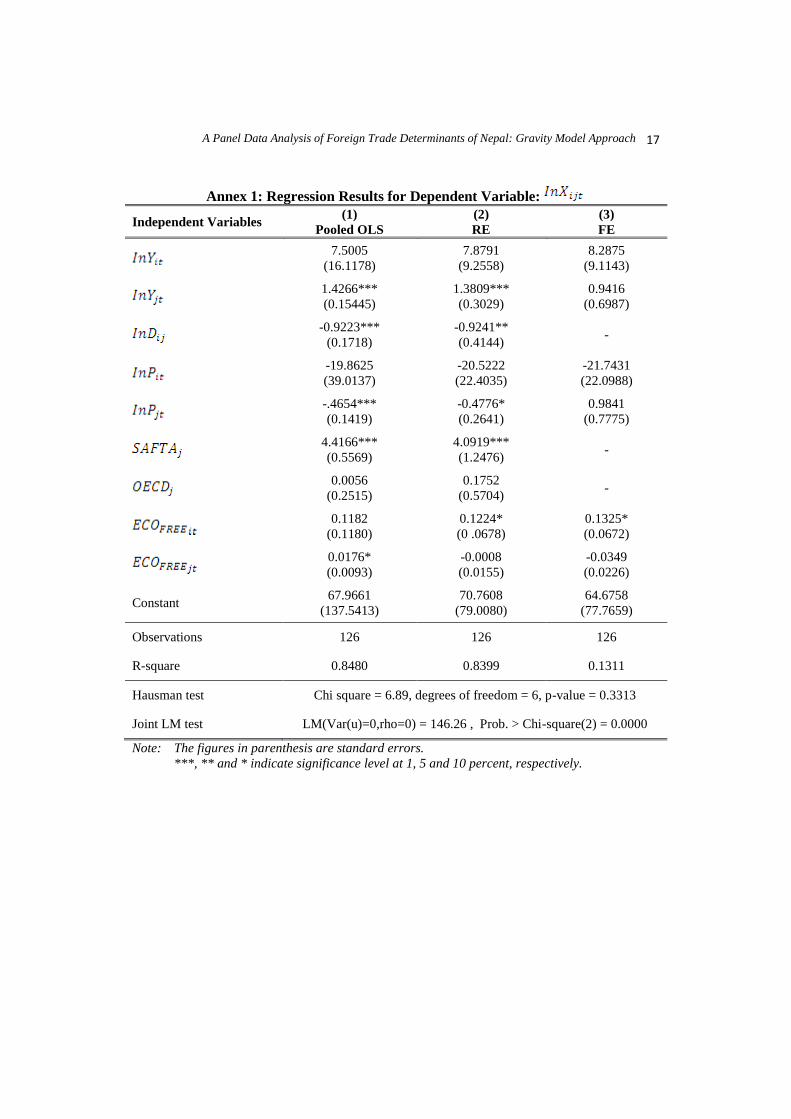
Annex 1, 2 and 3 presents pooled OLS, RE and FE regression results for the models (6),
(7) and (8) respectively. Hausman tests suggest that RE is preferred for models (6) and
(7) and FE is preferred for model (8). The joint LM test for heteroskedasticity and serial
correlation shows the presence of heteroskedasticity and serial correlation in the RE
models (6) and (7). Table 1 presents results robust to heteroskedasticity and serial
correlation for RE models (6) and (7) in column (1) and (2) using GLS approach.
Modified Wald test for groupwise heteroskedasticity and Wooldridge test for
autocorrelation is applied to detect heteroskedasticity and serial correlation in FE model
(8). Modified Wald test shows heteroskedasticity in the FE model, whereas Wooldridge
test for Autocorrelation shows no serial correlation. Therefore, the FE model with robust
to heteroskedasticity is presented in column (3) of Table 1 as a final result for
interpretation.

NRB ECONOMIC REVIEW 10
Table 1: Final Regression results for Dependent Variables: , and
1 2 3
Dependent Variables
Independent Variables Robust RE Robust RE Robust FE
7.5005
(15.4650)
-9.1691
(24.5360)
923887.9
(979475.4)
1.4266***
(0.1482)
0.5744**
(0.2351)
-931074**
(376558.7)
-0.9223***
(0.1648)
-0.9935***
(0.2615) -
-19.8625
(37.4335)
24.2167
(59.3901)
-1791611
(2347783)
-0.4654***
(0.1362)
0.1595
(0.2160)
-133514.3
(192237.7)
4.4166***
(0.5344)
-0.2077
(0.8478) -
0.0056
(0.2413)
-1.0599***
(0.3828) -
0.1182
(0.1133)
0.0530
(0.1797)
18414.01
(15650.31)
0.0176**
(0.0089)
0.0392***
(0.0141)
-6434.056
(4188.672)
Constant 67.9661
(131.9705)
-101.2826
(209.3777)
23400000**
(11400000)
Observations 126 126 126
Wald Chi-square 702.80 124.24 -
Prob. > Chi-square 0.0000 0.0000 -
Note: The figures in parenthesis are standard errors.
***, ** and * indicate significance level at 1, 5 and 10 percent, respectively.
Based on GLS result presented in Table 1, real GDP of Nepal has positive relation with
dependent variable log of export of Nepal; however, the estimator has no statistical
significance. The coefficient of is statistically significant at 1 percent which implies
that export of Nepal increases by 1.43 percent as real GDP of partner country increases
by 1 percent. As expected, distance is negatively related to export and statistically
significant at 1 percent level. If distance with trade partner country is higher by 1 percent,
then the export of Nepal to the country decreases by 0.92 percent. The population of
Nepal and trade partner country is negatively related with the export however, population
of trade partner country is only statistically significant. It is quite logical to see a negative
relationship between population and export. Increase in population decreases the per
capita GDP and hence reduces demand for consumption. If population of trade partner
country increases by 1 percent, the export will decrease by 0.46 percent, it shows
statistical significance at 1 percent level. The dummy variable of SAFTA is positively
related to export at 1 percent level of significance. The result suggests that export is
increased by 441.66 percent to the country if it is SAFTA member country, which is very
high and has policy significance. The co-efficient for dummy variable of OECD is very

A Panel Data Analysis of Foreign Trade Determinants of Nepal: Gravity Model Approach
11
small and statistically insignificant. The coefficient of economic freedom index is quite
big for Nepal but statistically insignificant, whereas that of trade partner country is small
but statistically significant at 5 percent. The result suggests that the export to trade partner
country will increase by 1.76 percent if economic freedom index of the country increases
by 1 point. Based on RE model, 83.99 percent variation on dependent variable is
explained by independent variables of the model.
The GLS result in Table 1 for dependent variable shows that real GDP of Nepal
has negative relation with import; however, it is statistically insignificant. Real GDP of
trade partner country is statistically significant at 5 percent level of significance. If real
GDP of a partner country increases by 1 percent, the import of Nepal from the country
increases by 0.57 percent. Distance between Nepal and trade partner country is also
statistically significant at 1 percent level of significance. If distance between trade partner
countries is higher by 1 percent, then import from the country goes down by 0.99 percent.
The population coefficient of Nepal as well as partner countries show positive relation,
but statistically insignificant. Dummy variable for SAFTA shows negative relation to
import of Nepal but no statistical significance, whereas dummy variable for OECD is
significance at 1 percent level and result shows that import of Nepal for the country
decreases by 105.99 percent if the country is member of OECD. Economic freedom
indices of both Nepal and partner countries show positive relation with import of Nepal;
however, economic freedom of trade partner country is only statistically significant. The
result shows that if economic freedom index of trade partner country increases by 1 point
then import from the country increases by 3.92 percent. Based on RE model 48.73
percent of variation in dependent variable is explained by independent variables.
Based on FE robust result real GDP of Nepal is positively related to dependent variable
trade balance but there is no sign of statistical significance, whereas real GDP of trade
partner county is negatively related to trade balance of Nepal with statistical significance
at 5 percent level. The result implies that if real GDP of partner countries increase by 1
percent, the trade balance decreases by 9310.74 thousands of USD. Nepal imports more
and exports less as real GDP of trade partner country increases. Khan and Hossain (2010)
investigated bilateral trade balance of Bangladesh and found similar result as of Nepal,
that the coefficient of relative GDP is negative i.e. -2.29 and highly significant implying
trade balance of Bangladesh deteriorates when GDP of partner countries increases
relatively more than that of Bangladesh. The population of Nepal and trade partner is
negative related to trade balance with no statistical significance. Economic freedom of
Nepal is positively related whereas economic freedom of partner country is negatively
related, but both show no statistical significance.
Country Specific Fixed Effects on Trade Balance
The country specific fixed effect takes account of unobserved factor that may be
important to understand the relationship between country specific time invariant factors
and the dependent variable. The country specific time invariant variables such as religion,

NRB ECONOMIC REVIEW 12
culture, race, language, access to seaport, level of economic development, endowment of
natural resources, structure of political economy, physical size and location of the country
etc. cannot be estimated with fixed effect model reported in Table 1, however those
variables may be important unobserved factors to explain the dependent variable, .
Country specific effect allows to know the impact of country fixed variable on the
dependent variable. The country specific fixed effects can be estimated by including
country dummy variables on the equation (8). The estimation equation is expressed as;
= .. (9)
where, is the coefficient for correspondent country dummy variable
for N-1 countries.
Australia is chosen as base group or benchmark group by default; hence, country
comparison is made against Australia. The country specific fixed effect for Australia
cannot be estimated based on above model. In order to calculate the country specific fixed
effect for Australia, expectation rule approach is followed8. Based on the approach the
country specific fixed effect for Australia is calculated as 135,711 thousands of USD.
This figure allows to know the exact amount of country specific fixed effect for each
country from the estimation result of dummy variable model (9). The accurate amount of
country specific effect is calculated by adding country fixed effect value of Australia i.e.
135,711 on the each country effect coefficient estimated from the dummy variable model
equation (9). The dummy variable model is preferred to report over expectation rule
approach, even though both provide identical results, because dummy variable model
estimates standard error for each country dummies that allows to determine the statistical
significance for interpretation. The country specific fixed effect for 20 countries except
Australia based on dummy variable model (9) is presented below in Table 2;
8 The country fixed effects for all partner countries are also calculated based on expectation
rule. The model for country effect based on expectation rule and calculated values are
presented in Annex 4: Estimation of Country Fixed Effect Based on Expectation Rule.

A Panel Data Analysis of Foreign Trade Determinants of Nepal: Gravity Model Approach
13
Table 2: Country Specific Fixed Effect on Trade Balance9
Country Country Fixed Effect
Bangladesh -2237299***
(656982.2)
Brazil 321554
(441055.3)
Canada 394271.8***
(111591.1)
China 1288082
(802133.7)
Denmark -1250157***
(312542.7)
France 966815.6***
(266791.4)
Germany 1306320***
(318539.9)
Hongkong -1409984***
(305616.4)
India -869253.7
(782841.8)
Italy 764568.4***
(242556.2)
Japan 1758077***
(421922.3)
Malaysia -1654185***
(335402.5)
Netherlands -207485.8**
(79055.14)
New Zealand -2010763***
(427864.1)
Singapore -1804301***
(388398.7)
Switzerland -808695.9***
(227072.6)
Taiwan -717365.2***
(160804.3)
UAE -1678409***
(356004.5)
UK 1102093***
(257286.9)
USA 2960144***
(652071.8)
Observations 126
Degrees of freedom 99
R-square 0.9347
Adjusted R-square 0.9176
Note: The figures in parenthesis are standard errors.
***, ** and * indicate significance level at 1, 5 and 10 percent, respectively.
9 The result is based on pooled OLS and the coefficients of other independent variables of
equation (8) are same as the fixed effect model equation (9) presented in Table 1.

NRB ECONOMIC REVIEW 14
The country specific fixed effects on trade balance of Nepal indicate the amount of trade
balance due to country specific time invariant variables. The estimated result from the
above table shows that except Brazil, China and India all the country specific fixed
effects are statistically significant. Among 20 trade partner countries, 11 countries have
negative country specific effect, whereas 9 countries have positive country specific effect
on trade balance of Nepal. Negative country specific effect indicates increase in trade
deficit due to correspondent country's time invariant variables, whereas positive country
specific effect indicates decrease in trade deficit due to correspondent country's time
invariant variables. Thus, policy concern can be to increase trade with the countries that
have positive country specific fixed effects on trade balance because that will improve
trade balance by increasing export and decreasing import; at the same time impact of
other time variant factors also should be considered to have positive net impact.
Among the 20 countries, Bangladesh has highest negative fixed effect whereas USA has
highest positive fixed effect. The country fixed effect for Bangladesh is estimated at
-22,37,299 that is significant at 1 percent level, indicating that time invariant factors of
Bangladesh is expected to increase trade deficit of Nepal by 22,37,299 thousands of USD
than that of Australia. In other words, trade deficit of Nepal increases by 2,101,58810
thousands of USD due to fixed factors of Bangladesh. Similarly, the country fixed effect
for USA is estimated as 2,960,144 that is also significant at 1percent level, indicates that
time invariant factors of USA is expected to increase trade balance of Nepal by 2,960,144
thousands of USD than that of Australia. In other words, trade balance of Nepal increases
by 3,095,85511
thousands of USD due to fixed factors of USA. In the cases of country
fixed effect of Bangladesh and USA, trade with Bangladesh deteriorates the trade balance
whereas trade with USA improves. Thus, country fixed effect gives indication for proper
trade policy to improve trade position of Nepal.
V. SUMMARY AND CONCLUSIONS
International trade has become crucial for economic development of every country. As a
result, improving trade position is always the concern. Continuous trade deficit situation
of Nepal with most of the partner countries has become a serious issue. This study aims to
identify the international trade determinants of Nepal based on gravity model and
recommend specific trade policy to maximize gain from the trade. There is clear
indication from the empirical results of the gravity model that the export and import of
Nepal are explained by the real GDP of trade partner country. Higher the real GDP of
trade partner country higher will be the export as well as import. The rate of increase in
export is higher than import due to real GDP of partner country. Nepal exports more to
SAFTA countries than non-SAFTA and import less from the OECD countries than non-
OECD countries. Extending the export market to non-SAFTA countries and increasing
trade with OECD countries can increase exports and limit imports thereby improving
overall trade position of Nepal.
10 (-2,237,299 + 135,711)
11 (2,960,144 + 135,711)

A Panel Data Analysis of Foreign Trade Determinants of Nepal: Gravity Model Approach
15
As per basic idea of gravity model, distance to trade partner county of Nepal is highly
significant implying that higher the distance lower the trade. The distance can be proxy to
transportation cost and cultural differences. The positive relation of economic freedom of
trade partner country to export as well as import implies that comparatively Nepal is
involved in trade with economically free countries than otherwise. The trade deficit of
Nepal increases if real GDP of trade partner country increases. It is because increase of
import in volume is higher than the export as economy of partner countries grows. The
country specific fixed effect analysis shows that time invariant factors are also significant
in determining the trade balance of Nepal.

NRB ECONOMIC REVIEW 16
REFERENCES
Anderson, J. E. 1979. "A Theoretical Foundation for the Gravity Equation. "American Economic
Review, 69(1), 106-116.
Baltagi B. H. 2008. "Econometric Analysis of Panel Data.4th Edition." John Wiley & Sons Ltd.
Basyal, T. R. 2011. "Nepal's Economic Growth in the contest of Absorption, Trade, Imbalance and
the Fixed Exchange Rate. "Banking Journal Vol. I, Issue 1.
GONMOF and ADB (2010). "Promoting Nepal's Trade in the Perspective of Bilateral and
Multilateral Trade. "Economic Policy Network II, GONMOF and ADB.
GONMOF. 2012. "Economic Survey 20010/11."Ministry of Finance, Kathmandu.
Hausman, J. A. 1978. "Specification Tests in Econometrics. "Econometrica. 46: 1251–1272.
Kafle, S.D. 2006. "Effectiveness of Trade Policy in Nepal. "Economic Journal of Nepal Vol.
29(1).
Khan, M. Z .S. and Hossain.M .I. 2010. "Model of Bilateral Trade Balance: Extension and
Empirical Tests. "Economic Analysis & Policy, Vol.40 No.3.
Khatiwada, Y. R. and Sharma, S. K. 2002. "Nepal: Country Study Report (Global Research
Project). "Institute for Integrated Development Studies (IIDS), Kathmandu.
Krugman, P. R. and Obstfeld, M. 2009. "International Economics: Theory & Policy."8th Edition.
Boston: Pearson Addison Wesley.
Tinbergen J.1962. "Shaping the World Economy. "The Twentieth Century Fund. New York.
Wooldridge J. M. 2009. "Introductory Econometrics: A Modern Approach." 4th
Edition. South-
Western Cengage Learning.
A Panel Data Analysis of Foreign Trade Determinants of Nepal: Gravity Model Approach
17
Annex 1: Regression Results for Dependent Variable:
Independent Variables (1)
Pooled OLS
(2)
RE
(3)
FE
7.5005
(16.1178)
7.8791
(9.2558)
8.2875
(9.1143)
1.4266***
(0.15445)
1.3809***
(0.3029)
0.9416
(0.6987)
-0.9223***
(0.1718)
-0.9241**
(0.4144) -
-19.8625
(39.0137)
-20.5222
(22.4035)
-21.7431
(22.0988)
-.4654***
(0.1419)
-0.4776*
(0.2641)
0.9841
(0.7775)
4.4166***
(0.5569)
4.0919***
(1.2476) -
0.0056
(0.2515)
0.1752
(0.5704) -
0.1182
(0.1180)
0.1224*
(0 .0678)
0.1325*
(0.0672)
0.0176*
(0.0093)
-0.0008
(0.0155)
-0.0349
(0.0226)
Constant 67.9661
(137.5413)
70.7608
(79.0080)
64.6758
(77.7659)
Observations 126 126 126
R-square 0.8480 0.8399 0.1311
Hausman test Chi square = 6.89, degrees of freedom = 6, p-value = 0.3313
Joint LM test LM(Var(u)=0,rho=0) = 146.26 , Prob. > Chi-square(2) = 0.0000
Note: The figures in parenthesis are standard errors.
***, ** and * indicate significance level at 1, 5 and 10 percent, respectively.

NRB ECONOMIC REVIEW 18
Annex 2: Regression Results for Dependent Variable:
Independent Variables (1)
Pooled OLS
(2)
RE
(3)
FE
-9.1691
(25.5717)
-9.7201
(11.74516)
-9.5809
(11.5750)
0.5744**
(0.2450)
0.2910
(0.4642)
1.0550
(0.8873)
-0.9935***
(0.2725)
-1.1447
(0.7017) -
24.2167
(61.8972)
25.4712
(28.4296)
22.3887
(28.0651)
0.1595
(0.2251)
0.5038
(0.3979)
2.6673***
(0.9874)
-0.2077
(0.8836)
-1.1410
(2.0407) -
-1.0599***
(0.3990)
-0.7473
(0.9355) -
0.0530
(0.1873)
0.0518
(0.0861)
0.0419
(0.0854)
0.0392***
(0.0147)
0.0567**
(0.0221)
0.0609**
(0.0287)
Constant -101.2827
(218.2161)
-103.179
(100.3179)
-122.4085
(98.7611)
Observations 126 126 126
R-square 0.4965 0.4873 0.2374
Hausman test Chi square = 6.61, degrees of freedom = 6, p-value = 0.3582
Joint LM test LM(Var(u)=0,rho=0) = 198.11 , Prob. > Chi-square(2) = 0.0000
Note: The figures in parenthesis are standard errors.
***, ** and * indicate significance level at 1, 5 and 10 percent, respectively.
A Panel Data Analysis of Foreign Trade Determinants of Nepal: Gravity Model Approach
19
Annex 3: Regression Results for Dependent Variable:
Independent
Variables
(1)
Pooled OLS
(2)
RE
(3)
FE
1231850
(5649668)
1085742
(2376625)
923887.9
(2232283)
-152242.2***
(54138.11)
-355101.6***
(102394.1)
-931074***
(171118.4)
18701.41
(60208.68)
-15173.62
(164589.9) -
-3734178
(13830288.89)
-3242068
(5752860)
-1791611
(5412461)
50027.1
(49740.9)
191369.4**
(87202.76)
-133514.3
(190419.3)
-840019.4***
(195210.8)
-1310766***
(468933.6) -
253551.5***
(88142.31)
500928.7**
(215166.3) -
10042.36
(41372.97)
11577.47
(17429.35)
18414.01
(16464.37)
-2831.511
(3255.086)
-1387.045
(4703.085)
-6434.056
(5540.991)
Constant 20500000
(48200000)
20400000
(20300000)
23400000
(19000000)
Observations 126 126 126
R-square 0.5083 0.4653 0.3106
Hausman test Chi square = 19.54, dof = 6, p-value = 0.0033
Modified Wald Test for
groupwise Heteroskedasticity Chi-square = 34968.92; Prob.>Chi-square = 0.0000
Wooldridge Test for
Autocorrelation F-value = 2.881; Prob. > F=0.1051
Note: The figures in parenthesis are standard errors.
***, ** and * indicate significance level at 1, 5 and 10 percent, respectively.

NRB ECONOMIC REVIEW 20
Annex 4: Estimation of Country Fixed Effect Based on Expectation Rule
The model is specified as;
= + + + ………. (11)
= - - ………. (12)
Or, = - - ………. (13)
where, is estimated country specific time invariant factors, expectation of
dependent variable for every country, is expectation of independent variables for the
countries and is estimated coefficient of the independent variables and is
intercept with FE model.12
Based on equation (12) and (13) the country specific effects on
trade balance of Nepal are estimated and presented below;
Country Expected Trade Balance Country Fixed Effect
Australia -24508.93 135711 Bangladesh 26754.06 -2101587
Brazil -9469.25 457267
Canada -6069.41 529985
China -313373.20 1423793
Denmark -4331.76 -1114439
France -1388.62 1102527
Germany -105.16 1442032
Hongkong -15057.08 -1274268
India -1459018.00 -733537
Italy 388.94 900282
Japan -48216.00 1893790
Malaysia -44973.00 -1518467
Netherlands -4240.95 -71770
New Zealand -11074.08 -1875051
Singapore -56698.52 -1668590
Switzerland -12628.17 -672978
Taiwan -13529.06 -581652
UAE -109310.70 -1542691
UK -23649.40 1237809
USA 17197.21 3095856
12 Refer to Table 1 for the estimated coefficients in FE model when dependent variable is