a novel wireless acoustic emission sensor system for ... · features an arm processor of stm32f407...
TRANSCRIPT

International Journal of InnovativeComputing, Information and Control ICIC International c©2017 ISSN 1349-4198Volume 13, Number 4, August 2017 pp. 1289–1306
A NOVEL WIRELESS ACOUSTIC EMISSION SENSOR SYSTEM
FOR DISTRIBUTED WOODEN STRUCTURAL
HEALTH MONITORING
Yin Wu1, Wenbo Liu2 and Kaiyu Li2
1College of Information Science and TechnologyNanjing Forestry University
No. 159, Longpan Road, Nanjing 210037, P. R. [email protected]
2College of AutomationNanjing University of Aeronautics and Astronautics
No. 29, Jiangjun Avenue, Nanjing 211106, P. R. China{wenboliu; LKY 401 }@nuaa.edu.cn
Received December 2016; revised April 2017
Abstract. This paper presents the development of a novel wireless acoustic emission(AE) sensor platform designed for distributed large-scale wooden structure health moni-toring. A set of AE sensors is deployed at the surface of the wooden components, and theproposed wireless AE network is continuously monitoring and inspecting the AE propa-gation characteristics within the structure to identify damages. The proposed platformfeatures an ARM processor of STM32F407 with real-time data sampling rate up to 5Mspsand an improved IEEE 802.11 b/g/n wireless data transceiver CC3200 with up to 6Mbpsdata rate. Besides, embedded signal sampling and data processing algorithms to extractAE signal features are also introduced, especially a simplified difference encoding datacompression algorithm is used to reduce the data transmission amount whilst maintainsthe high sensitivity and reliability. Then damage identification running in the base sta-tion analyzes the AE signals’ distinctions in the pressure injury of wooden component.At last, the sensor performance, in terms of data sampling and fault detection, has beenanalyzed by means of experimental results.Keywords: Acoustic emission, Wireless sensor network, Wooden structure, Structuralhealth monitoring, Signal processing, Data compression
1. Introduction. Wood has been used as a structural material since ancient times. Tim-ber building members are an integral part of almost all historic buildings, serving partic-ularly as columns, beams and roof structures in China [1]. Their condition has a greatinfluence on the working life of the entire building; therefore, it is important to continuallymonitor it and timely capture any negative changes. Given the historical value of manywooden buildings, the methods required for the investigation of their current conditionshould not unnecessarily interfere with the existing structures. So far, visual assessmenthas primarily been used. However, to determine the internal condition of a structure,or to quantify its physical and mechanical properties, more precise methods are needed.Among them, the most commonly used technique is acoustic emissions [2-4].
Acoustic emissions (AE) are the stress waves produced by the sudden internal stressredistribution of the materials caused by the changes in the internal structure. Possiblecauses are crack initiation and growth, crack opening and closure, dislocation movement,twinning, and phase transformation in monolithic materials and fiber breakage and fiber-matrix deboning in composites [5]. Monitoring systems listen to AE signal and perform
1289

1290 Y. WU, W. LIU AND K. LI
frequency/time domain signal processing to identify fault pattern in the early stage ofsurface/subsurface crack formation. Most of the sources of AE are damage-related; thus,the detection and monitoring of these emissions are commonly used to predict materialfailure. This technique has been widely applied in materials testing, structure healthmonitoring (SHM): such as bridges, towers, and pavilions [6-9]. However, as the trans-mission of AE signals needs cables for common commercial AE instruments, it is veryinconvenient for the AE testing and monitoring of large scale structures. So in order tosatisfy the requirement of AE testing and monitoring for timber construction, we havedeveloped an advanced multichannel wireless AE system with large transmitting rate andsynchronous clock based on the Wi-Fi and real time clock (RTC) mechanisms. This paperreports the details of the developed wireless AE system.
Recently, some researches have focused on the wireless AE technique for damage iden-tification or impact localization for SHM. A. Ledeczi et al. [10] presented a prototypewireless AE system for the detection of active fatigue cracks in aging railways bridges,the node has 4 channels with maximum sampling rate 3MHz, but the transmitting ratewas only 250 kbps. O. M. Bouzid et al. [11,12] developed a wireless AE system forwind turbine blades, it was comprised of MICAz motes equipped with the sensor board(MTS310), and it ran a content-based AE signal features extraction algorithm, whichleads to a low sampling rate much lower than the Nyquist rate. Results showed that itcould locate AE events precisely with its localization model. M. D. Prieto et al. [13]introduced a novel self powered wireless sensor applied to condition monitoring of gearsby means of AE analysis, and 3 AE channels were connected to a 14-bit analog to digital(AD) converter. A fixed sampling frequency of 2MHz during time windows of 10ms wasapplied, resulting in 280Kbits of data, and a spectral resolution of 100Hz. On the otherhand, as for the nondestructive testing of wooden structures, J. V. Oliver-Villanueva andM. A. Abian-Perez [14] designed a wireless sensor which could be installed in the woodcomponent to collect the temperature, humidity and illuminance of its circumstance, andalso it could be used to pre-warn the activity of termites and other insect pests. WhileY. Fujii et al. have studied the AE signal feature of termite in the wood since 2007 [15-17], and their research indicates that AE method shows great performance in terms ofcollecting waves of termite activity. However, as far as we know, there has no wireless AEsensor designed for wooden structure monitoring to date, and the main challenges are: thedamage modes of wooden component in the historic building can be composed of manytypes, such as matrix cracking, delamination, fiber breakage and debonding. Each has itsown special acoustic property and apparently these different damages map with differentcorresponding AE signals. However, in reality, damages always show up in a combinationform with overlapping characteristics of different types; in addition, due to the anisotropicpropagation nature of wood and the ever-present multi-source noise pollution, all makethe AE signal acquisition and identification in wooden component a highly difficult task.
As a result of the work discussed above, we can figure that conventional design ofwireless sensor node is not suitable for nondestructive sensing in SHM, where the AEsignal to be detected always has a high frequency (perhaps even reach several hundredKHZ). Therefore, these requirements are needed.
(i) High sampling rate and communication rate. When AE events occur, the sensornode should acquire the raw wave data as much as possible. After then, it should trans-mit the data to a center server that carries out centralized data processing and damageidentification algorithms as soon as possible. However, due to the complexity of AE sig-nal in wooden structure [18], the existing wireless sensor mote (such as MicaZ, TelosB)and wireless communication protocol (such as IEEE 802.15.4) cannot afford such highsampling rate and communication rate.

A NOVEL WIRELESS ACOUSTIC EMISSION SENSOR SYSTEM 1291
(ii) Efficient data flow management and data compression algorithm. When lots ofAE wave data arrive, the node should decide whether transmitting it directly to thecenter server or holding on for next analysis if necessary. Besides in the view of economicoperation: reducing the data traffic, saving the energy of the node and prolonging networklifetime, we should compress the data awaiting transmission as much as possible.
(iii) Precise time synchronization. When an AE wave is detected, the absolute arrivingtime is always different between sensors mounted in different area, so we could locate theAE source by using the time-of-flight (TOF) algorithm [19]. The accuracy of AE signalarrival time and the resolution of damage localization are greatly influenced by the errorsin time synchronization.
So to address the challenges of these requirements, we have developed a new wirelessAE sensor platform. It features an ARM based STM32F407 processor with up to 5Mspssampling rate and an IEEE 802.11 b/g/n based wireless data transmitter CC3200 with upto 6Mbps data rate. Each node supports up to 2 AE channels. Furthermore, embeddeddata acquisition and processing frame is presented, especially the simplified differenceencoding data compression algorithm which reduces the wireless transmission payload by50%. As well fracture feature analysis program running in the center server is also ableto identify the status of damage and locate the AE source.
This paper is organized as follows. Next section will present a detailed description of thesensor node requirements and design. Then, an overview of the overall system architectureand operation is presented, and then followed by a summary of the experiment resultsand offline data evaluation methodology. At last the paper concludes with shortcomingsand our planned future work.
2. Sensor Node Architecture and Operation.
2.1. Sensor node hardware schematic. The prototype design is illustrated in Figure1. The wireless AE node mainly consists of two parts, namely, ARM base board, andradio board. In base board, one outstanding feature of the microcontroller STM32F407is the capability of high speed data sampling. The direct memory access (DMA) unit onSTM32F407 allows the wireless AE node to collect sensor data at 5Msps. On the otherhand, the radio board contains microcontroller CC3200, RTC chip DS3232M.
(i) Base board. A wireless AE sensor node always runs embedded computation intensiveprograms, e.g., high speed sampling procedure. So the base board should be designed onthe basis of these requirements: high frequency microcontroller, certain memory cache,DMA controller, SPI and IIC interface. For our platform, we choose the ARM CortexM4 core chip because of its low cost and low power.
The base board is a four-layer PCB roughly with the size of 9.7cm by 6.6cm. Itadopts an ST microcontroller STM32F407VGT6 (features a floating point unit) workingat 168MHz. Thus, on-board high-sampling data acquisition and processing are entirelypossible. In this board, the SPI1 interface is used to communicate with radio board, andPC2 analog interface is used for acquiring sensor data, respectively.
(ii) Radio board. A Texas Instrument microcontroller CC3200 is chosen. It is madeup of an ARM Cortex M4 core and an ultra low power Wi-Fi network processor CC3100.This chip is operating at a maximum frequency of 80MH with a maximum data rate of6Mbps.
The radio board uses SPI bus (P05, P06, P07, and P45) to receive sensor data fromthe base board. It is also a four-layer PCB and the size is 9.4cm×5.8cm roughly. Intransmitting state, the radio board consumes 755mW of power (229mA of power at 3.3V)but less than 200mW of power (59mA of power at 3.3V) in receiving mode.

1292 Y. WU, W. LIU AND K. LI
Figure 1. Block diagram of the sensor node
Figure 2. Prototype of the sensor node

A NOVEL WIRELESS ACOUSTIC EMISSION SENSOR SYSTEM 1293
Another task of the radio module is time synchronization. Here we use DS3232Mas node’s clock source; it is an extremely accurate RTC with ±5ppm. The CC3200on radio board only takes wireless communication and time synchronization task, whilethe STM32F407 on base board takes the computation-intensive data processing task.Only this dual-core architecture can guarantee the effective and efficient working of bothcontrollers because lots of interrupts exist; thus a precise time synchronization can beachieved. The prototype of our sensor node is shown in Figure 2.
2.2. Sensor node software architecture. The process diagram illustrates the mainworking stages of wireless AE node, as shown in Figure 3. It begins with the data
Figure 3. Operating cycle carried out by the node

1294 Y. WU, W. LIU AND K. LI
acquisition of AE signal after receiving the “START” command from control center. Atthis stage, data about the sensing signal is collected from the AE sensor. Then, diagnosisalgorithm is executed to compute the AE event features. If the activity and intensityshow in a normal range, the node will enter “normal checking” workflow, it will extractthe data characteristics and compress it to save transmission payload, and only after this,the wireless communication from node to the control center will begin; however, if in anabnormal state, the node will enter “closely monitoring” stage, the acquired raw datawill be transferred directly to the control center as soon as possible, and there is no datacompression procedure here. Then the following process is operated in control center. Inhere, the characteristics are recovered and recorded for next operation or the signal iscalculated for advanced analysis. Finally, feature extraction and damage localization arecarried out to compute the health status of whole structure.
The specification of our simplified difference encoding data compression algorithm isintroduced as follows.
As for most normal checking stage, the AE signal amplitudes are small even close tozero. In fact, they remain steady most of the time until turning into the closely monitoringstage when emergencies happen. So it is unnecessary to transfer all the extracted valueseach time, while just need to transfer the difference between current value and the lastvalue. With regard to our wireless AE sensor network, the extracted characteristic valuesare amplitude, rise time, duration, ring count, hit count and power (see part 4.1 for detail),and thus the format of data package should be as follows.
Table 1. The format of data package without compression
Package No Amplitude Rise time Duration Ring Count Hit Count Power Checksum1 byte 2 byte 2 byte 2 byte 2 byte 2 byte 2 byte 1 byte
However, after adopting difference encoding algorithm, the format is like this.
Table 2. The format of data package with compression
PackageNo
Flagbyte
AmplitudeRisetime
DurationRingCount
HitCount
Power Checksum
1 byte 1 byte 1 byte 1 byte 1 byte 1 byte 1 byte 1 byte 1 byte
The flag byte represents whether to transmit amplitude, rise time, duration, ring count,hit count and power’s data or not. If the difference between current value and the lastvalue is zero, then we will not forward the data, and just set the corresponding bit inthe flag to zero. For example, suppose the difference is amplitude: 5.0, rise time: 2.2,duration: 4.0, ring count: 0.0, hit count: 0.0 and power: 5.9, then the transmissionpackage is shown as follows.
Table 3. The example format of data package with compression
Package No Flag byte Amplitude Rise time Duration Power Checksum1 byte 000100111 1 byte 1 byte 1 byte 1 byte 1 byte
The above compressed package has only 7 byte; apparently the expected data com-pression effect is achieved. In this difference encoding algorithm, the minimum packagenumber is 3 byte, the maximum number is 9 byte, that is to say, the max compression ra-tio is 78.6% and the min is 35.7%. And after all, it is a lossless style without any data

A NOVEL WIRELESS ACOUSTIC EMISSION SENSOR SYSTEM 1295
loss. For the recover port, it could easily recognize the data meaning in regards to thepackage length.
As soon as radio board gets the above acquired data from base board by SPI interface,it will fill these data into the payload format. Then all the network address, MAC address,and application payload are packaged inside the standard IEEE 802.11 data frame. Oncethe payload has been filled to the full, wireless packet will be sent to the control center.
3. System Architecture and Management. Different from the traditional SHM sys-tem which is based on Fiber Bragg Grating sensors, wireless AE sensor network for SHMhas three advantages: (i) the energy used for detection comes from the structure itself;(ii) highly-sensitive to the structural deficiency; (iii) saving the trouble of signal wirearrangement.
The framework diagram of our wireless AE sensor network is illustrated in Figure 4(a).It mainly includes the following units: (i) AE sensors to transform the responding elasticAE waves into an electrical signal; (ii) wireless AE node. Each node is able to connectto two AE sensors; it always runs distributed data processing program for informationextraction and analysis; also each node should keep time synchronization for improving thedamage localization accuracy; then all nodes form a network and send data to the controlcenter (base station); (iii) control center. It is in charge of establishing and maintaining theWi-Fi network, collecting each node’s transmission data, launching time synchronizationmechanism, processing and analyzing damage identifications. Thus, the proposed wirelessAE sensor network allows an autonomous and continuous onsite monitoring and diagnosisof wooden structures.
Figure 4(b) shows an installation diagram of wireless AE WSN in a wooden temple.
(a) (b)
Figure 4. (a) Framework diagram of the wireless AE sensor network; (b)installation diagram in wooden temple: black dot represents wireless AEnode, pentagram represents control center (base station)
1296 Y. WU, W. LIU AND K. LI
As soon as the wireless communication network has been established, time synchro-nization procedure should be carried out to ensure that all wireless AE nodes are wellsynchronized and a standard time has been achieved. Once the network is set up and allnodes are online, the control center first broadcasts the start time to all nodes. And thenodes should write the time data into their RTC chip simultaneously to keep alive. Aftersending start time, the control center waits for receiving data from all nodes. So uponreceiving the start time from control center, nodes will switch from listening state to apre-working state, when the RTC task is completed, nodes would send an “OK” messageback to control center. After that, a “START” command will broadcast to all nodes.Then all the wireless AE nodes start data acquisition of AE signals.
4. Proof-of-Concept Tests and Performance Evaluation. For purpose of assessingthe performance of the proposed wireless AE sensor node, several proof-of-concept labtests have been implemented and the results are given subsequently. As continuous onlinemonitoring obviously is required, the use of wireless sensing systems requires approachesfor decentralized data processing (i.e., the on-board wireless units). In this case, firstly,we want to test that important AE features can be locally extracted from the raw dataand only those features to be sent to the control center. Next, the transmission of raw AEwaves is verified, including normal and high sampling rate. At last, we want to distinguishAE signal characteristics in different fracture stages.
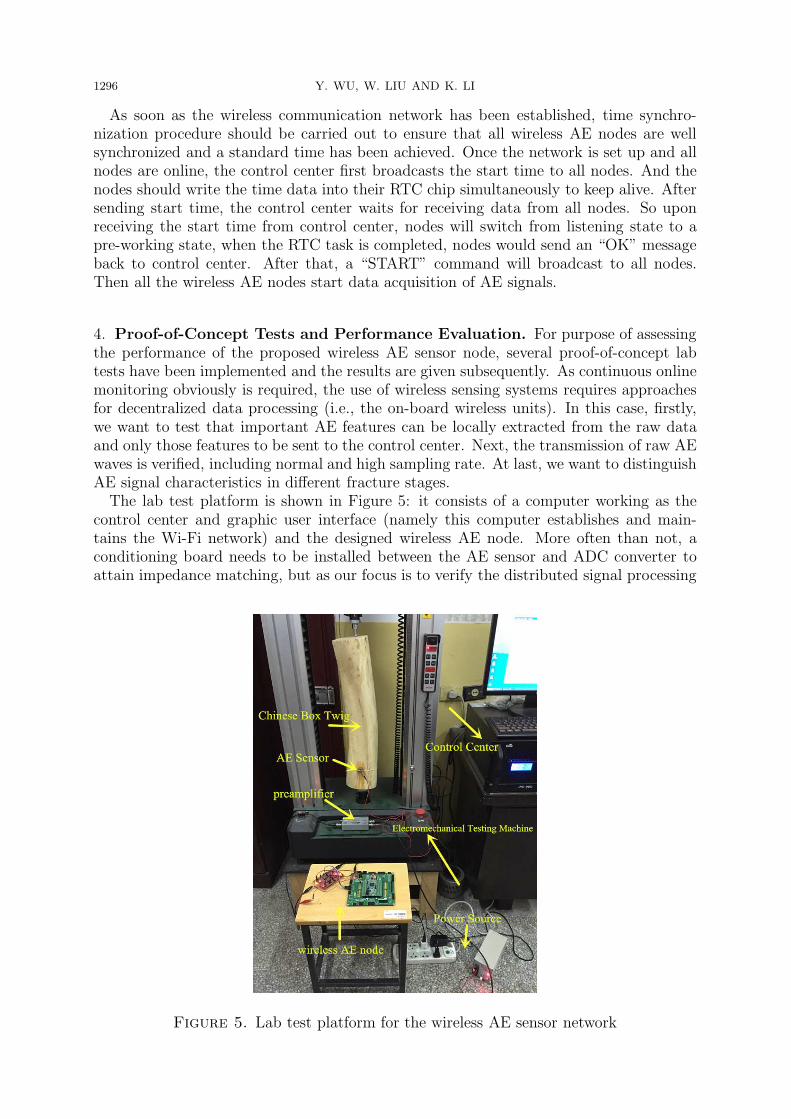
The lab test platform is shown in Figure 5: it consists of a computer working as thecontrol center and graphic user interface (namely this computer establishes and main-tains the Wi-Fi network) and the designed wireless AE node. More often than not, aconditioning board needs to be installed between the AE sensor and ADC converter toattain impedance matching, but as our focus is to verify the distributed signal processing
Figure 5. Lab test platform for the wireless AE sensor network

A NOVEL WIRELESS ACOUSTIC EMISSION SENSOR SYSTEM 1297
and wireless transmission, we replace it with a voltage preamplifier from “Physical Acous-tics Inc. [20]” in this lab test. At last one AE sensor R15a is attached to the surface ofa boxwood specimen (80cm high, 15cm diameter), and mounted on an electromechanicaluniversal testing machine together. Once if a strike acts on the boxwood specimen, weshould receive AE data on the control center immediately.
4.1. AE feature extraction. As it is known, AE waves are abnormal and transientactivities, which are affected by the characteristics of the induced stress field. Thesewaves can be converted into a number of useful AE parameters or features, as shown inFigure 6, which can then be used to identify these events. Some of these parameters areas follows [21].
(i) Amplitude, A, is the maximum amplitude which is usually measured in decibels(dB).
(ii) Rise time, R, is the time interval between the first threshold crossing and the timewhen the AE signal reaches its amplitude.
(iii) Duration, D, represents the time difference between the first and the last crossingsof the threshold value.
(iv) Ring count, RN, refers to the number of times the signal crosses the thresholdvalue.
(v) Hit count, HN, refers to the number obtained by counting each discerned AE eventonce.
(vi) Power, P , is the area under the curve or the summation of the squared samplevalues.
Figure 6. Definition of simplified waveform parameters of AE signal
Then we set the AE sensor with these parameters (sampling frequency 1M HZ, sam-pling number 1k, threshold voltage 30dB) and set the electromechanical universal testingmachine with parameters (5mm/min, 10KN) to carry out a wood hardness testing, simul-taneously the feature extraction results can be found out on the control center, and partof it is shown in Table 4.
Figure 7 provides the curves of loading and cumulative hit counts changing in time, wecan see that the two present similar variation trend. And it shows that our node is highlysensitive to the response of boxwood specimen under press testing.

1298 Y. WU, W. LIU AND K. LI
Table 4. Part of AE feature extraction results
NO A (dB) R (µs) D (µs) RN P (mv*ms)Time (year/month/dateclock
/minute/secondnum)31 30.2 49 113 2 0.3 20160721-135012-062138 98.5 50 4687 9 5607.2 20160721-135015-599227 32.5 11 33 5 0.1 20160721-135018-185294 65.5 55 4668 12 3836.9 20160721-135019-605
(a)
(b)
Figure 7. (a) Loading variation over distance, (b) the cumulative numberof hit counts over time

A NOVEL WIRELESS ACOUSTIC EMISSION SENSOR SYSTEM 1299
4.2. Wave sampling and transmission. In this phase, we set the AE sensor withthese parameters (sampling frequency 1M/5M HZ, sampling number 1k, threshold voltage30dB), and make it transmit all the waves it has captured. Then we use a joiner hammerto knock at the front end of the boxwood specimen several times, and the AE wavesreceived are shown in Figure 8.
Obviously, Figure 9 shows more specific details of waves than Figure 8, so we mainlyuse this sampling approach in closely monitoring state. However, it is also notable thatthe energy consumption is much higher than normal sampling approach.
(a)
(b)
Figure 8. (a) All the 5 hits waves when sampling at 1MHZ, (b) the secondhit wave

1300 Y. WU, W. LIU AND K. LI
(a)
(b)
Figure 9. (a) All the 2 hits waves when sampling at 5MHZ, (b) the first hit wave
After these experiments, we connect two AE sensors on the wireless node; one ismounted near the front end, while the other near the bottom end, then we knock theboxwood specimen on the front end several times again, and the waves received are shownin Figure 10. And from Figure 11 it is evident that the two AW waves arrive at differenttime, so we can calculate TOF accurately.
At the end of this phase, we have a comparison of our wireless sensor with a standardproduct (PCI-2 AE system from Physical Acoustics Inc. [22]). For convenience of analysis,we place two sensors close to each other near the front end of specimen, and wired withthe two different systems individually, then we carry out a hit on the specimen and the

A NOVEL WIRELESS ACOUSTIC EMISSION SENSOR SYSTEM 1301
(a) (b)
Figure 10. AE waves detected by two sensors: left figure is mounted ontop, while right bottom
recording result is shown in Figure 12. We can see that two waves are nearly identicalin time and amplitude, except for a little difference which may caused by anisotropicconductivity of wood.
4.3. Damage identification. In this phase a 10KN load of hardness testing is appliedto the specimen, and we set the AE sensor with these parameters (sampling frequency 5MHZ, sampling number 1k, threshold voltage 30dB), and make it transmit all the wavesit has captured. Boxwood specimen is subjected to constant pressure until the elasticmodule of the material is reached and a fracture appears. The experiment results areshown in Figure 13.
Generally speaking, during the experiment process, the acoustic activity (number ofAE events that overpass an amplitude threshold) of wood can be classified into threedifferent stages: 1) crack initiation; 2) crack incubation; and 3) crack propagation [23].Figure 13 shows the evolution of the AE activity during this hardness testing, where thetransformation of three crack stages can be easily identified. This result indicates thatthere are three different AE patterns to be analyzed to characterize each damage stage.
The power spectrums of three stages from this experiment are shown in Figure 14. Instage 1, the amplitudes of AE signals show a maximum around 50kHz [Figure 14(a)].In stage 2, AE signals have higher amplitudes than in stage 1 and the frequency reaches500-550kHz [Figure 14(b)]. In stage 3, the amplitudes of AE signals keep almost the same,but the frequency substantially extends to near 1000kHz [Figure 14(c)]. In the light of[24,25], and the results of these experiments, we can conclude that it is entirely possible

1302 Y. WU, W. LIU AND K. LI
(a) (b)
Figure 11. The forth hit waves after magnified
to identify detailed damage status of wooden structure member by using the proposedsystem.
5. Conclusions. The paper presents a prototype wireless two-channel acoustic emissionsensor node that supports high sampling rate and high transmission rate, and hence,enables the detection and accurate localization of fracture cracks. The proposed systemintegrates three different key technologies in a unique sensor device, namely, Wi-Fi com-munication, difference encoding algorithm, and two-branch dataflow management. It hasbeen demonstrated that this wireless AE sensor system can effectively collect and trans-mit the AE signal data to control center, also the proposed embedded diagnosis algorithmcould make a good use of the spectral content of AE signal, since the different fracturestages analyzed during the experiments show characteristic spectral contents.
Being a first-generation prototype, the current system does have some shortcomings.The energy consumption of the node has not been deeply studied yet. Clearly, for long-term deployment, some form of energy harvesting will be an absolute necessity. The mostwidely used approach, solar power, has limited applicability here, since the AE sensorsare placed in architecture which are completely shaded areas quite frequently. The mostpromising approach in this domain is to utilize RF energy harvesting. This, however,needs further research. And time synchronization among those wireless nodes in thesame network should also be addressed in future.
Acknowledgment. This work is partially supported by the Natural Science Foundationof Jiangsu Province, China (BK20150880). The authors also gratefully acknowledge thehelpful comments and suggestions of the reviewers, which have improved the presentation.

A NOVEL WIRELESS ACOUSTIC EMISSION SENSOR SYSTEM 1303
(a) (b)
Figure 12. (a) Result of PCI-2 AE system, (b) result of the proposedwireless AE sensor
Figure 13. AE results in terms of AE voltage versus duration of the hard-ness test

1304 Y. WU, W. LIU AND K. LI
(a)
(b)
(c)
Figure 14. Three stages of damage development: (a) crack initiation, (b)crack incubation, (c) crack propagation

A NOVEL WIRELESS ACOUSTIC EMISSION SENSOR SYSTEM 1305
REFERENCES
[1] J. Posta and J. Dolejs, Non destructive assessment of timber elements with an emphasis on radiom-etry, International Journal of Architectural Heritage, vol.9, no.6, pp.655-664, 2015.
[2] L. Girard, J. Beutel, S. Gruber, J. Hunziker, R. Lim and S. Weber, A custom acoustic emissionmonitoring system for harsh environments: Application to freezing-induced damage in alpine rockwalls, Geoscientific Instrumentation Methods and Data Systems, no.1, pp.155-167, 2012.
[3] B. V. Hieu, S. Choi, Y. U. Kim, Y. Park and T. Jeong, Wireless transmission of acoustic emissionsignals for real-time monitoring of leakage in underground pipes, KSCE Journal of Civil Engineering,vol.15, no.5, pp.805-812, 2011.
[4] Y. Jin, H. Yang, H. Yang, F. Zhang, Z. Liu, P. Wang and Y. Yang, Nondestructive detection ofvalves using acoustic emission technique, Advances in Materials Science and Engineering, vol.2015,pp.1-9, 2015.
[5] J. Bohse, Acoustic emission, Handbook of Technical Diagnostics, pp.137-160, 2013.[6] B. Aygun and V. C. Gungor, Wireless sensor networks for structure health monitoring: Recent
advances and future research directions, Sensor Review, vol.31, no.3, pp.261-276, 2011.[7] C. H. R. Martins, P. R. Aguiar, A. Frech and E. C. Bianchi, Tool condition monitoring of single-
point dresser using acoustic emission and neural networks models, IEEE Trans. Instrumentation andMeasurement, vol.63, no.3, pp.667-679, 2014.
[8] A. Ukil, M. Zlatanski and M. Hochlehnert, Monitoring of HV generator circuit breaker contactablation based on acoustic emission, IEEE Trans. Instrumentation and Measurement, vol.62, no.10,pp.2683-2693, 2013.
[9] J.-H. Zhou, C. K. Pang, Z.-W. Zhong and F. L. Lewis, Tool wear monitoring using acoustic emissionsby dominant-feature identification, IEEE Trans. Instrumentation and Measurement, vol.60, no.2,pp.547-559, 2011.
[10] A. Ledeczi, T. Hay, P. Volgyesi, D. R. Hay, A. Nadas and S. Jayaraman, Wireless acoustic emissionsensor network for structural monitoring, Sensors Journal IEEE, vol.9, no.11, pp.1370-1377, 2009.
[11] O. M. Bouzid, G. Y. Tian, J. Neasham and B. Sharif, Envelope and wavelet transform for soundlocalization at low sampling rates in wireless sensor networks, Journal of Sensors, Article ID 680383,pp.1-9, 2012.
[12] O. M. Bouzid, G. Y. Tian, J. Neasham and B. Sharif, Investigation of sampling frequency require-ments for acoustic source localization using wireless sensor networks, Applied Acoustics, vol.74, no.2,pp.269-274, 2013.
[13] M. D. Prieto, D. Z. Milan, W. Wang, A. M. Ortiz, J. A. O. Redondo and L. R. Martinez, Self-poweredwireless sensor applied to gear diagnosis based on acoustic emission, IEEE Trans. Instrumentationand Measurement, vol.65, no.1, pp.15-24, 2016.
[14] J. V. Oliver-Villanueva and M. A. Abian-Perez, Advanced wireless sensors for termite detection inwood constructions, Wood Science and Technology, vol.47, no.2, pp.269-280, 2013.
[15] Y. Fujii, K. Narahara, Y. Fujiwara, T. Ngatsuma, Y. Yanase, T. Yoshimura, S. Okumura and Y.Imamura, Nondestructive detection of termites using a millimeter-wave imaging technique, ForestProducts Journal, vol.57, no.10, pp.75-79, 2007.
[16] Y. Yanase, Y. Fujii, S. Okumura and T. Yoshimura, Detection of metabolic gas emitted by termitesusing semiconductor gas sensors, Forest Products Journal, vol.62, no.7/8, pp.579-583, 2012.
[17] Y. Yanase, M. Miura, Y. Fujii, S. Okumura and T. Yoshimura, Evaluation of the concentrationsof hydrogen and methane emitted by termite using a semiconductor gas sensor, Journal of WoodScience, vol.59, no.3, pp.243-248, 2013.
[18] Y. Wu, Z. P. Shao, F. Wang and G. L. Tian, Acoustic emission characteristics and felicity effect ofwood fracture perpendicular to the grain, Journal of Tropical Forest Science, vol.26, no.4, pp.522-531, 2014.
[19] B. Kusy, P. Dutta, P. Levis, M. Maroti, A. Ledeczi and D. Culler, Elapsed time on arrival: A simple,versatile, and scalable primitive for canonical time synchronization services, International Journalof Ad Hoc and Ubiquitous Computing, pp.239-251, 2006.
[20] C. Yang, X. Zhang, F. Tao and D. C. Lam, A study of the sound transmission mechanisms of a finitethickness opening without or with an acoustic seal, Applied Acoustics, vol.122, pp.156-166, 2017.
[21] O. M. Bouzid, G. Y. Tian, K. Cumanan and D. Moore, Structural health monitoring of wind turbineblades: Acoustic source localization using wireless sensor networks, Journal of Sensors, vol.2015,Article ID 139695, 2015.
[22] http://www.physicalacoustics.com/by-product/pci-2/.

1306 Y. WU, W. LIU AND K. LI
[23] Z. Shi, J. Jarzynski, S. Hurlebaus and L. J. Jacobs, Characterization of acoustic emission signalsfrom fatigue fracture, Proc. of Inst. Mech. Eng. C, J. Mech. Eng., vol.214, no.9, pp.1141-1149, 2000.
[24] Z. Chen, B. Gabbitas and D. Hunt, Monitoring the fracture of wood in torsion using acousticemission, Journal of Materials Science, vol.41, pp.3645-3655, 2006.
[25] A. Reiter, S. E. Stanzl-Tschegg and E. K. Tschegg, Mode I fracture and acoustic emission of softwoodand hardwood, Wood Science and Technology, vol.34, pp.417-430, 2000.