a novel traffic shaping algorithm for sdn-sliced networks
TRANSCRIPT
(IJACSA) International Journal of Advanced Computer Science and Applications,
Vol. 12, No. 1, 2021
1 | P a g e
www.ijacsa.thesai.org
A Novel Traffic Shaping Algorithm for SDN-Sliced
Networks using a New WFQ Technique
Ronak Al-Haddad1, Dr. Erika Sanchez Velazquez2, Dr. Arooj Fatima3, Adrian Winckles4
Computing and Technology Department
Anglia Ruskin University, Cambridge
United Kingdom
Abstract—Managing traditional networks comes with number
of challenges due to their limitations, in particular, because there
is no central control. Software-Defined Networking (SDN) is a
relatively new idea in networking, which enables networks to be
centrally controlled or programmed using software applications.
Novel traffic shaping (TS) algorithms are proposed for the
implementation of a Quality of Service (QoS) bandwidth
management technique to optimise performance and solve
network congestion problems. Specifically, two algorithms,
namely “Packet tagging, Queueing and Forwarding to Queues”
and “Allocating Bandwidth”, are proposed for implementing a
Weighted Fair Queuing (WFQ) technique, as a new methodology
in an SDN-sliced testbed to reduce congestion and facilitate a
smooth traffic flow. This methodology aimed at improving QoS
that does two things simultaneously, first, making traffic conform
to an individual rate using WFQ to make the appropriate queue
for each packet. Second, the methodology is combined with
buffer management, which decides whether to put the packet into
the queue according to the proposed algorithm defined for this
purpose. In this way, the latency and congestion remain in check,
thus meeting the requirements of real-time services. The
Differentiated Service (DiffServ) protocol is used to define classes
in order to make network traffic patterns more sensitive to the
video, audio and data traffic classes, by specifying precedence for
each traffic type. SDN networks are controlled by floodlight
controller(s) and FlowVisor, the slicing controller, which
characterise the behaviour of such networks. Then, the network
topology is modelled and simulated via the Mininet Testbed
emulator platform. To achieve the highest level of accuracy, The
SPSS statistical package Analysis of Variance (ANOVA) is used
to analyse particular traffic measures, namely throughput, delay
and jitter as separate performance indices, all of which
contribute to QoS. The results show that the TS algorithms do,
indeed, permit more advanced allocation of bandwidth, and that
they reduce critical delays compared to the standard FIFO
queueing in SDN.
Keywords—Network congestion; SDN; slicing; QoS; queueing;
OpenFlow (OF); Weighted Fair Queuing (WFQ); SPSS Analysis of
Variance (ANOVA)
I. INTRODUCTION
Traditional computer networks are implemented using various hardware devices, including switches, routers, and different middleboxes that implement several complex algorithms and protocols [1]. Middleboxes are networking devices that can alter network traffic for purposes other than packet forwarding. Typically, network administrators need to configure network policies to deal with different situations.
Often, the administrators need to accomplish their goals using limited essential resources, while ensuring that the devices have sufficient flexibility to address inconsistent conditions. They need to configure devices individually often using low-level commands, which can lead to a high error rate. Because of the complexity of traditional networks, network maintenance, reconfiguring and reorienting processes continue to be problematic. Moreover, traditional networking components do not have the dynamic characteristics for addressing the various types of packets or their different content. As noted by [2], this results owing to the rigidity of the routing protocols that do not allow for any adaptability. This results in significant restrictions for the traditional network operations that cannot be easily reprogrammed or re-tasked [3].
Software-Defined Network (SDN) technology [4] has emerged as an effective way for programming networking devices as well as providing higher scalability by distinguishing the control plane from the data forwarding plane. The new separation concept means that the control plane can reside outside the networking device and can be developed from one or multiple controllers, where their number can be defined by the user to establish the network size. Furthermore, this separation would allow for them to treat network protocols and services as software. The data plane aims to receive information and requests from the control plane and implement them in the hardware as needed [5] [6].
In this paper, a new model for SDN networks is proposed that introduces two Traffic Shaping (TS) algorithms. The main purpose of the proposed model is to provide good quality of service (QoS). To achieve this purpose, we introduce a new system, to handle network traffic aimed at improving the network throughput, reducing end-to-end delay and dealing with traffic issues, such as bottlenecks and congestion. We present statistical results to show the accuracy of the proposed system.
The rest of this paper describes the proposed system and demonstrates its effectiveness. Initially, Section II discusses related work and then, Section III presents the proposed methodologies and TS algorithms. Section IV provides analysis and results. Finally, the conclusion is presented in Section V along with suggested avenues for future work.

(IJACSA) International Journal of Advanced Computer Science and Applications,
Vol. 12, No. 1, 2021
2 | P a g e
www.ijacsa.thesai.org
II. RELATED WORK
A. Quality of Service (QoS) in SDN
Ensuring QoS has been a persistent issue in traditional networks due to their limitations. This can lead to additional operational expenses as well as the risk of degraded network performance, consequently providing unreliable quality to the end-users [7]. Commercial systems, such as Cisco [8], provide adequate overall QoS, i.e. taking all different types of traffic into account and implementing higher priority for specific traffic flows. However, there are still scalability and congestion issues in these systems. There have been numerous research studies proposing different congestion-management methods, e.g. Priority Queueing (PQ), Custom Queuing (CQ), Weighted Fair Queueing (WFQ), and Class-Based Weighted Fair Queueing (CBWFQ) [9] [10]. In theory, most of these methods can manage the delivery of packets when there is the need for more bandwidth than a link can handle. But in practice, they need re-evaluation and validation within the new expanded network systems, such as SDN. It is possible for SDN to address various network QoS issues by providing complete network visibility to collect and analyse flows of traffic so as to ensure that networking devices are programmable.
QoS in basic switching systems is increasingly being investigated and one method to ensure a high level is to utilise advanced queuing algorithms. Regarding which, First In First Out (FIFO) standard queueing in traditional and SDN networks is limited. The limitations of FIFO affect the QoS when there is more than one type of traffic involved. SDN systems (control planes and data planes) are independent of FIFO, managing the FIFO queueing between the controllers and the switches via the communications protocol OpenFlow (OF). The general behaviour of the FIFO algorithm in the SDN framework is derived from the limited queueing property in FIFO (outbound) [11]. The first packet to enter is the first to leave. In other words, there is no prioritisation of traffic and hence, no attention is paid to the Quality of Service (QoS) aims and criteria. FIFO is an ordinary queuing algorithm that has been widely adopted and used by researchers in order to evaluate network characteristics or behaviour of SDN and QoS frameworks. Accordingly, it has been used to establish the baseline condition for quantitative performance in this research so as to compare it with our proposed TS algorithms in terms of performance.
B. Analysis of Approaches to Network Performance in
Software-Defined Networks
QoS illustrates the network's ability to deliver improved services to selected traffic across a range of IP, LAN and WAN technologies. There are several factors involved in network performance measurement rules that affect QoS, i.e. bandwidth, network congestion, latency (delay), packet delay variation (PDV) / jitter, and error rate. Researchers have analysed the protocols available for traditional networks and suggested new solutions to support a broad range of applications, including voice, video and file transfers. Their solutions involve combining traditional protocols with the latest technologies, such as, virtualisation, SDN's latest
paradigms and slicing mechanisms. Below is the summary of the most relevant works.
The authors in [12] propose a system for monitoring queues at each link through SDN. Their system extends the Floodlight controller, which uses OpenFlow as a southbound protocol. The proposed system is also built into the network controller, which allows the QoS and other traffic monitoring/engineering applications to access and use device reports to manage traffic. The bandwidth of the available queue is monitored using network switch polling queue statistics. The difference between two transmitted byte readings is determined by using a queue bandwidth over the time frame. The limitation in their study is the lack of extensive bandwidth management evaluation.
In [13], CORONET is introduced, which is a device that evaluates network congestion and is extremely fast in responding to errors. Due to the VLAN components attached to its local switches, it is very suitable for large and extensive networks. The benefit of CORONET is that it can rebound with a minimum downtime. It is also compatible with dynamic networks, which can be changed. It uses multi-path routine strategies, if necessary and can be combined with virtually any form of network topology. CORONET is characterised by a set of modules designed to map routes, traffic control, exploration of topology, and to find the best (fastest) packet path. One of the key elements in CORONET modules is the use of VLANs, for this is an efficient means of standardising packet movement that does not over-complicate processes. They also help monitor the volume of flow controls and promote the maintenance of a completely adaptable and scalable system.
Another approach, as proposed by [14], involves deriving a model of queue delay from network parameters, i.e. queue buffer size, queue bandwidth, number of flows, and the tested mini-net propagation delay. Approximate queue time is ascertained from the model and used to monitor the delay of end-to-end traffic. Their study shows that a flow may be shifted into a separate queue when an upper delay limit reaches a specific delay level. The most interesting part of this work is the end-to-end delay control application, which helps to retain control by monitoring the parameters used in the model and switches flows to a suitable queue, when needed. Injecting sample packets earlier when no traffic occurs, will estimate the propagation delay on a network connection. The authors believe that the delay in a queue is the primary explanation for the latency of the network, since packet processing is negligible, and propagation is constant.
OpenNetMon [15] is a POX OpenFlow controller module that helps to monitor per-flow throughput, packet loss and delay metrics. It enables fine-grained traffic engineering for reducing overhead and improve throughput: The tool tracks statistics from the ingress-and-go to measure the byte number transmitted during the flow. Other research by [16] proposes monitoring methods for SDN controllers using the OpenFlow protocol. Their method involves collecting statistics and calculating the throughput of the traffic, with the key goals being to cut total costs and increase accuracy. They measure the current transmission rate of each link by counting bytes
(IJACSA) International Journal of Advanced Computer Science and Applications,
Vol. 12, No. 1, 2021
3 | P a g e
www.ijacsa.thesai.org
that move through the link over time. These determined values are used by the monitoring module to manage loads when a new connection is made. When connection usage reaches 80%, a different path is selected instead of the shortest one, to prevent packet loss [16, 17]. A survey on managing QoS in SDN Networks [17] involved reviewing various methods to monitor and manage QoS. The authors concluded that there is a lack of extensive analysis on the network performance parameters, including delay, throughput and jitter, particularly when dealing with variety of network applications, such as video, audio, and data, in one testbed framework.
During the SDN era, DiffServ protocol has been tested by several scientists within various contexts. For instance, authors in [18] used queue-based classification strategies to provide QoS support for floodlight-controlled SDN networks. They used DifServ DSCP and common queuing techniques in Open vSwitch to approach topology management and software-defined QoS. The authors identified various groups of services (e.g. Expedited Forwarding and Best Effort) along with rate-limiting paths. They introduced a QoS module inside a floodlight controller, which covers packet matching, classification, and flow operations, such as input and deletion. This module allows just two types of policies, i.e. Queuing Policy and a ToS/DSCP Policy. The other main part of the architecture is the QoSPath application, which allows the addition of both policies using a "circuitpusher" based application. The authors hold that to measure QoS metrics, their work requires extensive assessment and evaluation.
III. PROPOSED METHODOLOGIES AND ITS ALGORITHMS
We propose a new model as a bandwidth management technique aimed a improving Quality of Service (QoS). The model utilises the FIFO queuing technique as the baseline condition. We introduce two new Traffic Shaping algorithms called Algorithm I and Algorithm II.
A. FIFO Model Implementation
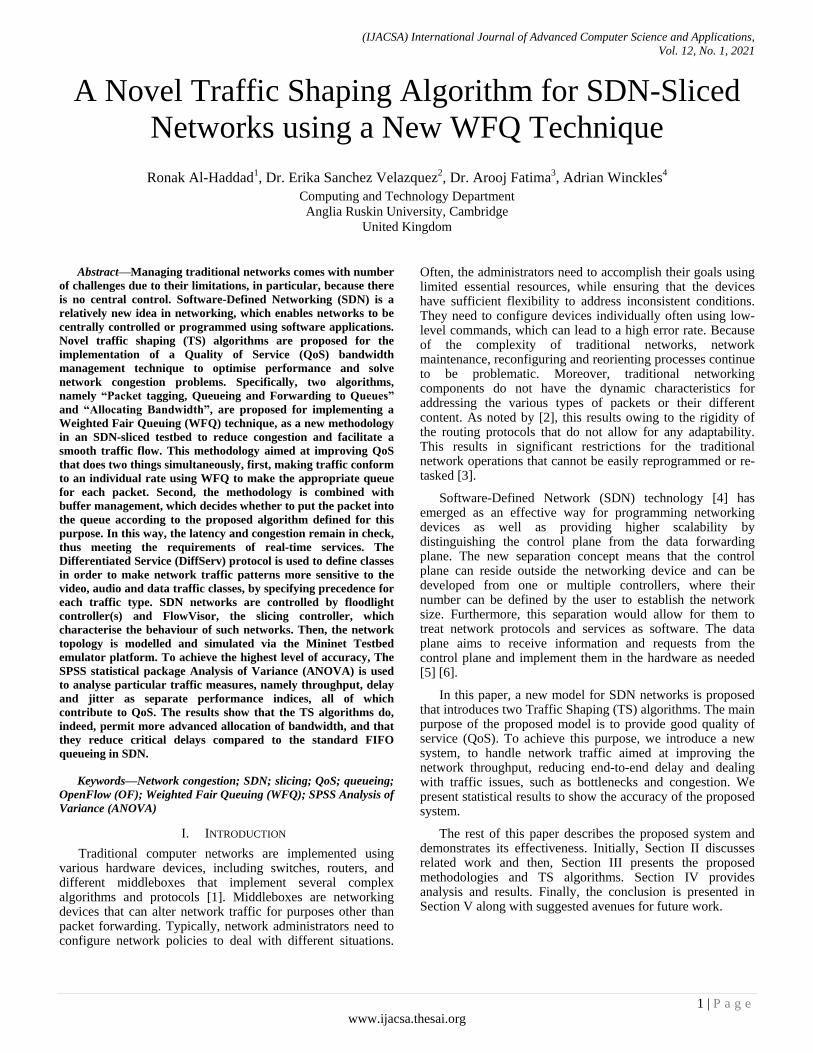
Fig. 1 presents the proposed system, which utilises an SDN FIFO queuing model. A Mininet Testbed emulator was used to control the virtual environment represented by the virtual machine with virtual switches using Floodlight and FlowVisor controllers (to control slices) as well as OpenFlow (OF) switches, which is characteristic behaviour of SDN [19]. As shown in Fig. 1, the input flows from each host (H1, H2, H3) are aggregated after each packet is transmitted through the switch (S1). This switch is configured specifically to decide the packet routing towards the switches S2, S3 and S5 in predefined paths in the custom topology. The different flow types (represented as X1, X2, X3) are queued as a result of the aggregation and propagation functions of the traffic flows through the proposed SDN model. S1 and S4 function as pipeline-based switches, while S2, S3 and S5 serve as forwarding plane-based OpenFlow protocol specifications. S1 performs the routing management as an ingress bound interface to decide what to do with the arriving packets by looking up in the flow table the information needed to determine the routing path, which it then sends to the outbound interface (S4) passing through S2, S3 and S5. In this model, the FIFO algorithm can be configured in two ways to set the queue length, i.e. by choosing between (i) “Packet
FIFO”, which is based on the number of packets or (ii) “Byte FIFO”, which is based on the number of bytes in the FIFO scheduler. To implement the FIFO algorithm in a sliced-template SDN, “Byte FIFO” is adopted as the FIFO scheduler, since it is less complex and compatible with the slice configuration [20]. FIFO describes the conditions used in this evaluation study, where the output traffic flows are converted into capacity units (bytes) and stored in a FIFO Queue (FQ) with a capacity of k bytes. It defines various capacities for output channels for three different test scenarios. The servers process the queued data at a rate of 40, 70 and 100 (b/s) as the limiting speed of the outbound interface. In the experimental system used for the study, the flow (Y) leaving the queueing system can be divided into m output traffic flows, based on the testing scripts created for this purpose, to allow for configuring the proportion of traffic to be forwarded to every single output. Flow separation is computed according to (a) the designed slicing mechanism in the SDN system, (b) the measured magnitude of every input flow and (c) the output configuration. Finally, the queueing modules store traces of the traffic flows, measured at every single input and output in the database, with time granularity. The data is stored separately for different types of files, i.e. video, audio and data.
The performance of the network is continuously monitored for analysis purposes using the D-ITG tool [21]. The differentiated service code point protocol (DiffServ) (DSCP) [22] has been used to assign classes to each queue within the slices. It also provides soft and dynamic QoS guarantees by the use of queueing, which enables the routers to classify packets. The packets are classified using the Differentiated Services Code Point (DSCP), which assigns the value of the best-effort to the packet headers.
Three flows (i.e. video, audio, and data) are directed to switch S4, where they compete for the maximum resources available in the bottleneck link between this switch and the hosts, due to the limited queueing under FIFO. Video, which requires the highest channel capacity (bandwidth), will suffer most degradation over the long term, although exceptions are seen where it has arrived first. So, control over the switches (S2, S3, S5) is manipulated to ensure that the principles of limited FIFO queueing are followed. The simulation was run for different timescale parameters across the defined stress test conditions 1, 5 and 15 minutes for 10 replicates each. The mean results for 10 trials in each combination of design variables were pre-extracted for each of the three performance measures: throughput, delay, and jitter.
Fig. 1. The Data Plane for the FIFO Queueing SDN Model.

(IJACSA) International Journal of Advanced Computer Science and Applications,
Vol. 12, No. 1, 2021
4 | P a g e
www.ijacsa.thesai.org
B. Traffic Shaping Algorithms based the New WFQ Model
A novel Traffic Shaping (TS) algorithm is proposed to tackle the single queueing limitation in the FIFO algorithm, which is aimed at solving congestion problems, and providing multimedia applications a reasonable QoS level using WFQ disciplines in an SDN-sliced context, especially when large flows fill the buffer quickly and cause packet dropping in other flows. We developed the experimental system for the TS algorithm using multiple weighted queues as demonstrated in Algorithm 1 below. The proposed algorithm performs packet tagging, queueing and forwarding.
----------------------------------------------------------------------- Algorithm 1: Packet Tagging and Forwarding
-----------------------------------------------------------------------
Input:
P: packets received from the hosts
Bandwidth: maximum bandwidth for the queue
Output:
SP: sorted list of packets
EF_q: list of EF packets
AF_q: list of AF packets
BE_q: list of BE packets
while P ≠ ∅
for each packet pi in P do
SP→weight:= 0
SP→port:= 0
Ip←getPacketInfo(pi)
SP→ID = Ip→ID
if Ip→type == video then
SP→weight = 46
SP→port = 9999
SP→tag = video
SP→device = S3
SP→length = Ip→length
add_to_queue (pi, EF_q)
sort_queue (EF_q, DSC)
else if Ip→type == audio then
SP→weight = 18
SP→port = 8888
SP→tag = audio
SP→device = S5
SP→length = Ip→length
add_to_queue (pi, AF_q)
sort_queue (AF_q, DSC)
else
SP→weight = 0
SP→port = 1111
SP→tag = data
SP→device = S2
SP→length = Ip→length
add_to_queue (pi, BE_q)
sort_queue (BE_q, DSC)
end if
store_in_DB(SP)
forward_packet(SP, Bandwidth)
end for
end while
---------------------------------------------------------------
The model utilises Algorithm 1 to create three different queues, each with a specific weight assigned to it, such that delay-sensitive classes of traffic are taken into consideration.
In order to provide high QoS, the TS algorithm enforces an assignment of weights to each flow and queues the resources using WFQ techniques. It defines three queues for each type of traffic, i.e. AF (Assured Forwarding), EF (Expedite forwarding) and BE (Best Effort). BE is given weight=0, EF is given a weight=46 and AF is given a weight=18. The customised model topology uses five switches, as shown in Fig. 2.
Open vSwitch
FlowVisor
Video Slice Flow
Audio SliceFlow
Other=Data Slice flow
Floodlight Controller
Floodlight Controller
Floodlight Controller
H1
H2
H5
H3
H4
H6
S2
S3
S5
S1 S4
Q1, Q2, Q
3
Q1, Q2, Q3
Q1, Q2, Q3
Best effo
rtBest effort
Expedited Forwarding
Assured Forwarding Assured Forwarding
Clients Servers
Fig. 2. Traffic-Shaping Algorithm: Template Design Linking the Data and
Control Planes.
Fig. 2 represents the specific setup of the SDN system implemented for this study. Below is description of the various modules built into the model.
Topology Links: The links in the three different colours are intended to show the three flows that have been previously configured. The figure shows the different packets arriving from different ports to the switch (S1), which will handle the flow rule actions and hence, the flow statistics to match the packets.
Matching: The matching and routing process is based on the port numbers. Port 9999 is set up for video flow, whilst port 8888 is used for audio and the data flow is listed on port 1111. Each host (H1, H2, H5) in the network edge works as a client, sending a mixture of flow packets of video, audio and data. The packets arrive at the switch (S1), where these are forwarded by the class selector [23], according to Per-Hop-Behaviour (PHB).
Buffer and Access Permission: The arriving packet is buffered and the packet header is checked each time against the rules in the flow table for matching purposes. The access permission for each slice in the flow space is assigned based on the permission number (7-bitmask value) between FlowVisor and the switches, whilst the bitmasked-set is used to select metadata updates [24]. The individual permissions are READ, WRITE, AND DELEGATE (2+4+1=7, respectively). Based upon the configurations between the switches and controllers, these permissions allow the controllers to read, write and delegate slices in the flow space.
Forwarding: Packet forwarding can be done according to these rules for the slices that belong to the flow. If it does not match, the packet will either be dropped or it will be sent to the Floodlight controller for processing, according to the flow rules. The Floodlight controller will send the packet to the switch. The action for the scenario will be stored in the flow
(IJACSA) International Journal of Advanced Computer Science and Applications,
Vol. 12, No. 1, 2021
5 | P a g e
www.ijacsa.thesai.org
table to be used again. The stored actions in the flow table are used for similar packets in the future without needing to pass the packet to the Floodlight controller for a decision [25].
Routing: The switch S1 decides the routing, depending upon the predefined routing paths for the port number for each arriving flow, and this is based on their OpenFlow specification. Data flows between S1-S2-S4 as the routing path, while the video flow is assigned between S1-S3-S4, and finally, the audio flow between S1-S5-S4.
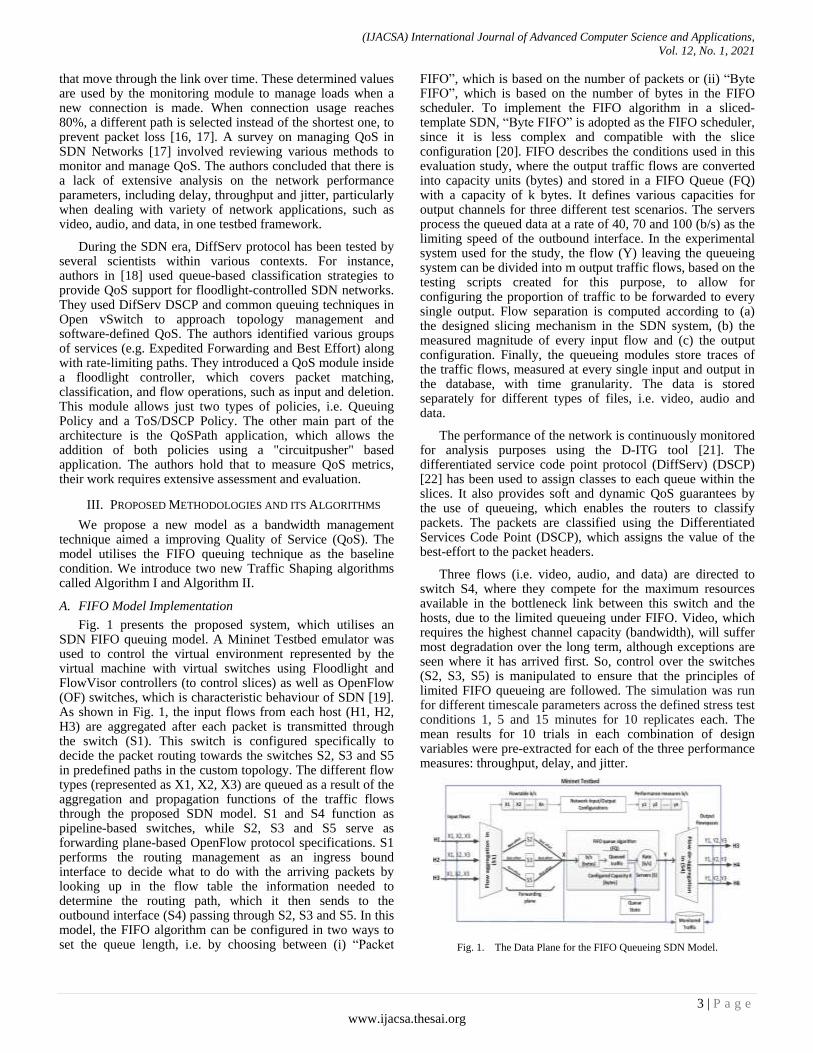
Queueing: To implement minimal queue management, a minimum buffering rate is defined for each queue. In switch S4 three queues for each output interface between S4 and the three hosts H3, H4 and H6 are configured. Algorithm 2 proposes implementation of a WFQ variant that is used on the three slices, with weights configured proportional to the allocated bandwidth for each slice. EF traffic receives higher bit weight by giving the highest bandwidth allocation to video and then, AF receives the second highest bit weight, with the BE flow being allocated the lowest Hence, the scheme works according to a ratio principle, the ratio of 20 Mega/2Mega/200Kilo bytes being used for a 40Mbps link capacity. Similarly, for 70Mbps the ratio is 45 Mega /4.5 Mega /450Kilo, while for 100Mbps, it is 50Mega/5Mega/500Kilo.
--------------------------------------------------------------------------------
Algorithm 2: Allocate Bandwidth
--------------------------------------------------------------------------------
Input:
QT: queue type
Bandwidth: maximum bandwidth for the queue
Output:
Allocated_bandwidth: bandwidth in Bs (bits)
if Bandwidth == 40 then
if QT == video then
Allocated_bandwidth = 20000000
else if QT == audio then
Allocated_bandwidth = 2000000
else if QT == data then
Allocated_bandwidth = 200
end if
else if Bandwidth == 70 then
if QT == video then
Allocated_bandwidth = 45000000
else if QT == audio then
Allocated_bandwidth = 4500000
else if QT == data then
Allocated_bandwidth = 450000
end if
else if QT == video then
Allocated_bandwidth = 50000000
else if QT == audio then
Allocated_bandwidth = 5000000
else if QT == data then
Allocated_bandwidth = 500000
end if
end if
return Allocated_bandwidth
---------------------------------------------------------------
The objective of TS algorithms (1 and 2) is to measure the delay for a video slice (EF flow) without specifying any particular priority scheme. In other words, the EF flow will experience less delay than AF and BE, with the queuing delay being distributed, while the bandwidth allocation remains fixed. This scheme works as a conservation (sparing) scheme, whereby the AF flow can use the remaining bandwidth that is left from the EF flow, as long as the traffic is within the maximum capacity of the link. One of the technical contributions of this study is the devised set of measurements (parameters) for each algorithm. To evaluate the parameters‟ performance, a testbed was developed as a proof of concept that implements the algorithms and records the test results. The results have been used for statistical analysis using SPSS software.
C. Managing Queueing Time at the Network Nodes
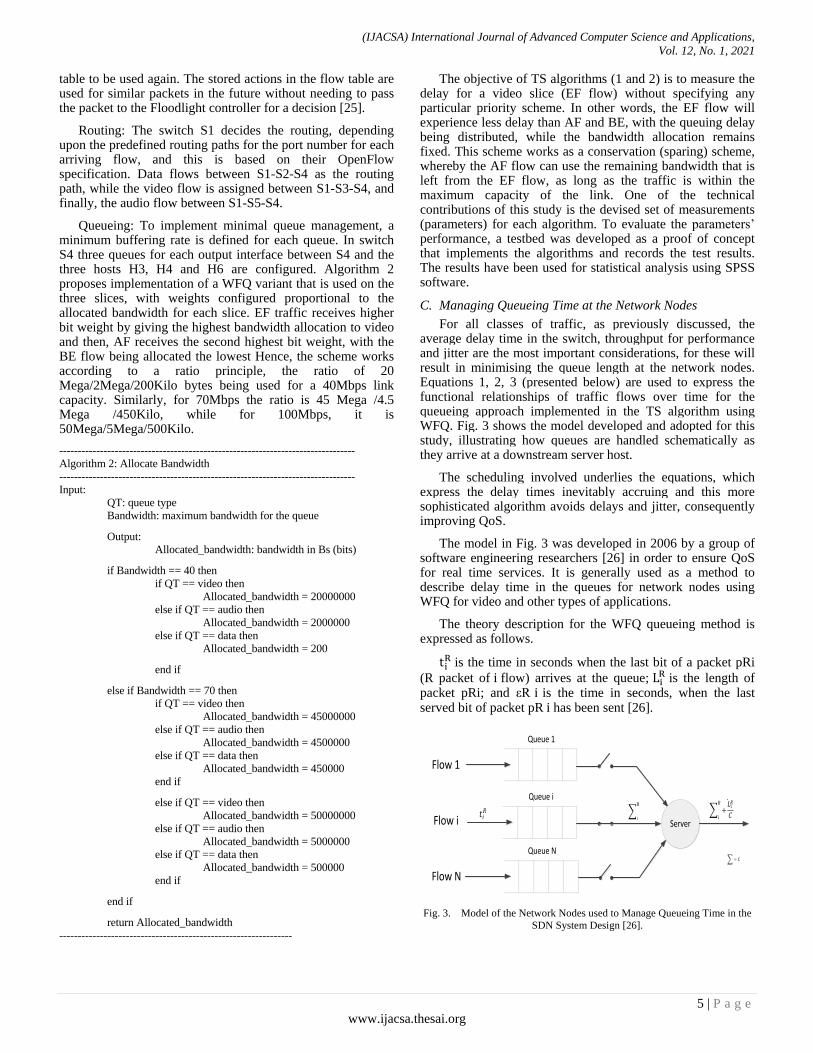
For all classes of traffic, as previously discussed, the average delay time in the switch, throughput for performance and jitter are the most important considerations, for these will result in minimising the queue length at the network nodes. Equations 1, 2, 3 (presented below) are used to express the functional relationships of traffic flows over time for the queueing approach implemented in the TS algorithm using WFQ. Fig. 3 shows the model developed and adopted for this study, illustrating how queues are handled schematically as they arrive at a downstream server host.
The scheduling involved underlies the equations, which express the delay times inevitably accruing and this more sophisticated algorithm avoids delays and jitter, consequently improving QoS.
The model in Fig. 3 was developed in 2006 by a group of software engineering researchers [26] in order to ensure QoS for real time services. It is generally used as a method to describe delay time in the queues for network nodes using WFQ for video and other types of applications.
The theory description for the WFQ queueing method is expressed as follows.
is the time in seconds when the last bit of a packet pRi
(R packet of flow) arrives at the queue; is the length of
packet pRi; and εR is the time in seconds, when the last served bit of packet pR has been sent [26].
Flow N
Queue N
Flow i
Queue i
Flow 1
Queue 1
Server
+𝐿𝑖𝑅
𝐶
𝑅
𝑖
𝑅
𝑖 𝑡𝑖
𝑅
= 𝐶
Fig. 3. Model of the Network Nodes used to Manage Queueing Time in the
SDN System Design [26].

(IJACSA) International Journal of Advanced Computer Science and Applications,
Vol. 12, No. 1, 2021
6 | P a g e
www.ijacsa.thesai.org
In this case, the queueing time of packet pRi can be expressed as:
∑
(1)
Depending on the queueing scheduling discipline, the delay time in the whole system of packets from flow [EF, AF, BE] can be expressed by:
( ) ∑
∫(
) (2)
here: δ( ) – Dirac„s delta function [27]. Then, the function of the common queueing time in the network node is:
( ) ∫ ( ) ( )
(3)
IV. ANALYSIS AND RESULTS
To achieve the highest level of accuracy, a novel comparative approach for evaluating FIFO queueing and TS systems in packet switching in SDN has been proposed. The SPSS statistical package Analysis of Variance (ANOVA) [28] was used to perform the first level of analysis of the data with various tests of hypotheses. The analyses involve the means of 10 repeated measures (replicates) for three levels of stress test durations of 15, 5 and 1 minutes, three bandwidth levels of 40, 70 and 100 Mbps, and three traffic types, namely video, audio, and data, all of them defined as independent variables, while the performance indices throughput, delay and jitter are defined as dependent variables. The interaction terms all have * in their tables‟ row titles. For this study, pairwise comparisons involve the computation of a p-value of < 0.05 for each pair of the compared groups.
A. Throughput Results Analysis
1) Throughput analysis for test duration 15 minutes: In
Table I, it can be seen that the relative throughput of audio and
video is pretty similar, with a slight influence of bandwidth on
this traffic class (Traffic Type) effect; it is about 2- fold at
both 40 and 70 Mbps, but about 4-fold at 100 Mbps. This
pattern discussed because the bandwidth* traffic type
interaction is significant (P= 0.005 in the Table) for Between-
Subjects Effects.
In Table II, the interaction between traffic type and algorithms is significant, with a p-value = 0.001, whilst the throughput of audio, data and video is similar for FIFO to that for the TS algorithm. This is a direct consequence of the algorithms being programmed with the bit rate weight policy higher for audio than for data in TS.
2) Throughput analysis for test duration 5 minutes: In
Table III, the interaction between traffic type and algorithms is
also significant, with a p-value =0.001. The entry for data
traffic type in the TS algorithm appears substantially out of
line with the corresponding adjusted mean entries in the
separate tables for the longer and shorter durations, having a
value of 25733.105, which is because of the properties of TS
using WFQ.
3) Throughput analysis for test duration 1 minute: From
Table IV, it can be seen that the Traffic Type * Algorithm
interaction is similar in form at 1 minute to what is seen at the
other durations, but it is somewhat stronger and distinctive in
form (p-value = 0.001) for the mean throughput measure.
TABLE I. RESULTS OF THROUGHPUT IN MEGABITS PER SECOND (MBPS)
MEASURES OF BANDWIDTH*TYPE OF TRAFFIC FOR 15 MINUTES DURATION
Dependent Variable: Throughput traffic averaged across 10 tests
Bandwidth Traffic
Type
Mean
Throughput
Std.
Error
95% Confidence
Interval
Lower
Bound
Upper
Bound
40
Video 23087.984 4655.968 12943.501 33232.466
Audio 11914.602 4655.968 1770.119 22059.084
Data 5092.873 4655.968 -5051.609 15237.356
70
Video 35017.427 4655.968 24872.944 45161.909
Audio 16520.710 4655.968 6376.228 26665.193
Data 10223.169 4655.968 78.687 20367.651
100
Video 66591.740 4655.968 56447.258 76736.223
Audio 16837.987 4655.968 6693.504 26982.469
Data 9887.850 4655.968 -256.633 20032.332
TABLE II. RESULTS OF THROUGHPUT IN MEGABITS PER SECOND (MBPS)
MEASURES OF TRAFFIC TYPE*ALGORITHM FOR 15 MINUTES DURATION
Dependent Variable: Throughput traffic averaged across 10 tests
Traffic
type Algorithm
Mean
throughput
Std.
Error
95% Confidence
Interval
Lower
Bound
Upper
Bound
Video
FIFO 21847.142 4655.968 11702.659 31991.624
Traffic
Shaping 46375.872 4655.968 36231.389 56520.354
Audio
FIFO 20697.995 4655.968 10553.513 30842.477
Traffic
Shaping 17043.173 4655.968 6898.691 27187.656
Data
FIFO 20532.508 4655.968 10388.026 30676.990
Traffic
Shaping 3245.114 4655.968 -6899.369 13389.596
TABLE III. RESULTS OF THROUGHPUT IN MEGABITS PER SECOND (MBPS)
MEASURES OF TRAFFIC TYPE*ALGORITHM FOR 5 MINUTES DURATION
Dependent Variable: Throughput
Traffic
type Algorithm
Mean
Throughput
Std.
Error
95% Confidence
Interval
Lower
Bound
Upper
Bound
Video
FIFO 16536.844 7375.332 901.838 32171.850
Traffic
Shaping 34465.388 7375.332 18830.383 50100.394
Audio
FIFO 17434.975 7375.332 1799.969 33069.981
Traffic
Shaping 20498.615 7375.332 4863.609 36133.621
Data
FIFO 17998.648 7375.332 2363.643 33633.654
Traffic
Shaping 25733.105 7375.332 10098.099 41368.110

(IJACSA) International Journal of Advanced Computer Science and Applications,
Vol. 12, No. 1, 2021
7 | P a g e
www.ijacsa.thesai.org
TABLE IV. RESULTS OF THROUGHPUT IN MEGABITS PER SECOND (MBPS)
MEASURES OF TRAFFIC TYPE*ALGORITHM FOR 1 MINUTE DURATION
Dependent Variable: Throughput
Traffic
type Algorithm
Mean
Throughput
Std.
Error
95% Confidence
Interval
Lower
Bound
Upper
Bound
Video
FIFO 21815.346 4015.542 13302.778 30327.915
Traffic
Shaping 38837.933 4015.542 30325.364 47350.501
Audio
FIFO 21606.774 4015.542 13094.206 30119.343
Traffic
Shaping 20899.601 4015.542 12387.032 29412.170
Data
FIFO 21728.523 4015.542 13215.954 30241.091
Traffic
Shaping 6608.666 4015.542 -1903.903 15121.235
B. Delay Results Analysis
1) Delay analysis for test duration 15 minutes: In
Table V, the overall difference between bandwidth levels in
the transmission delay experienced is significant (p-value =
0.002) and it is apparently non-monotonic. Regarding the
Standard Error (SE), only the difference between BW 100 and
the other two 40 and 70 Mbps is shown to be significant.
These findings are unsurprising and represent the natures of
all the algorithms that have been implemented.
2) Delay analysis for test duration 5 minutes: In Table VI, at test duration 5 minutes, the overall effect of the algorithms
on transmission delay is significant (p-value = 0.008) and the
effect is significantly clear between the FIFO and TS
algorithms.
In Table VII, the delay of the bandwidth overall effects is significant, with a p-value = 0.002 at duration 5 minutes.
3) Delay analysis for test duration 1 minute: Table VIII
shows Traffic type*Algorithm largely independent of
bandwidth, with a significant p-value = 0.001 as the overall
effect.
TABLE V. RESULTS OF DELAY IN MILLISECONDS (MS) MEASURES OF
BANDWIDTH FOR 15 MINUTES DURATION
Dependent Variable: Delay traffic averaged across 10 tests
Bandwidth Mean
delay Std. Error
95% Confidence Interval
Lower Bound Upper Bound
40 6.194 11.938 -18.444 30.833
70 0.164 11.938 -24.475 24.802
100 43.809 11.938 19.171 68.448
TABLE VI. RESULTS IN MILLISECONDS (MS) FOR DELAY MEASURES OF THE
ALGORITHMS FOR 5 MINUTES DURATION
Dependent Variable: Delay
Algorithm Mean
delay Std. Error
95% Confidence Interval
Lower Bound Upper Bound
FIFO 5.731 2.596 0.348 11.114
Traffic Shaping 0.845 2.596 -4.538 6.228
TABLE VII. RESULTS OF DELAY IN MILLISECONDS (MS), FOR THE
DIFFERENT BANDWIDTHS AT 5 MINUTES DURATION. THE IDENTITY OF THE
STANDARD ERROR (SE) TO THAT IN THE PREVIOUS TABLE IS NOT A MISTAKE, BUT RATHER, A COINCIDENCE FAVOURED BY THE PRESENCE OF LOW VALUES
AND THE LIMITED DISTRIBUTION OF ERRORS
Dependent Variable: Delay
Bandwidth Mean
delay Std. Error
95% Confidence Interval
Lower Bound Upper Bound
40 2.969 2.596 -2.414 8.352
70 1.508 2.596 -3.875 6.891
100 13.656 2.596 8.273 19.039
TABLE VIII. RESULTS FOR DELAY IN MILLISECONDS (MS) MEASURES
EXPRESSING TRAFFIC TYPE*ALGORITHM INTERACTION FOR 1-MINUTE
DURATION
Dependent Variable: Delay
Traffic
type Algorithm
Mean
delay
Std.
Error
95% Confidence Interval
Lower
Bound
Upper
Bound
Video
FIFO 0.002 0.114 -0.237 0.241
Traffic
Shaping 0.001 0.114 -0.239 0.240
Audio
FIFO 0.002 0.114 -0.237 0.241
Traffic
Shaping 0.004 0.114 -0.235 0.243
Data
FIFO 0.002 0.114 -0.237 0.241
Traffic
Shaping 0.322 0.114 0.083 0.561
C. Jitter Results Analysis
1) Jitter analysis for test duration 15 minutes: In
Table IX, the results for jitter in milliseconds (ms) are largely
independent of traffic type. The Bandwidth*Algorithm
interaction deleted at (p-value = 0.969). With an interaction so
far from significant it is not meaningful to state its effect size.
This is the result aggregated across all traffic types and there
is very little jitter overall. The effect of the algorithms is seen
only at the widest bandwidth, but the other bandwidths have
values so low that they do not emerge from the error. The
reason for this is that the ordinal predictions for jitter from the
FIFO algorithm are limited, as the patterns of jitter are being
driven primarily by the partly random properties of the input.
All types of traffic compete for the available bandwidth and
the average waiting times will be longer as the process is the
same for all traffic types within the repeated traffic samples. 2) Jitter analysis for test duration 5 minutes: In Table X,
the bandwidth*algorithm interaction is significant. The jitter
values are variable and the differences among them below
2SE, except that at bandwidths 70 and 100 FIFO stands out
from TS algorithm, and at 100 bandwidth the jitter is greater
overall with (5.451 ms) mean jitter.
3) Jitter analysis for test duration 1 minute: In Table XI,
for 1-minute duration and jitter as the dependent variable, the
interaction Bandwidth*Traffic Type (p-value = 0.005) and
(petasq= 0.685) shows that the jitter suffered under any
algorithm depends on the bandwidth available.

(IJACSA) International Journal of Advanced Computer Science and Applications,
Vol. 12, No. 1, 2021
8 | P a g e
www.ijacsa.thesai.org
TABLE IX. RESULTS OF JITTER IN MILLISECONDS (MS) MEASURES OF
BANDWIDTH*ALGORITHM FOR 15 MINUTES DURATION
Dependent Variable: Jitter traffic averaged across 10 tests
Bandwidth Algorithm Mean
jitter
Std.
Error
95% Confidence Interval
Lower
Bound
Upper
Bound
40
FIFO 0.000 1.925 -4.045 4.046
Traffic
Shaping 0.001 1.925 -4.044 4.047
70
FIFO 0.000 1.925 -4.045 4.045
Traffic
Shaping 0.001 1.925 -4.045 4.046
100
FIFO 11.593 1.925 7.548 15.639
Traffic
Shaping 0.015 1.925 -4.030 4.060
TABLE X. RESULTS OF JITTER IN MILLISECONDS (MS) MEASURES OF
BANDWIDTH*ALGORITHM FOR 5 MINUTES DURATION
Dependent Variable: Jitter
Bandwidth Algorithm Mean
jitter
Std.
Error
95% Confidence Interval
Lower
Bound
Upper
Bound
40
FIFO 0.070 0.147 -0.251 0.391
Traffic
Shaping 0.001 0.147 -0.320 0.322
70
FIFO 0.485 0.147 0.164 0.806
Traffic
Shaping 0.071 0.147 -0.250 0.392
100
FIFO 5.451 0.147 5.130 5.772
Traffic
Shaping 0.657 0.147 0.336 0.978
TABLE XI. RESULTS OF JITTER IN MILLISECONDS (MS) MEASURES OF
BANDWIDTH*TRAFFIC TYPE FOR 1 MINUTE DURATION
Dependent Variable: Jitter
Bandwidth Traffic
type
Mean
jitter
Std.
Error
95% Confidence Interval
Lower
Bound
Upper
Bound
40
Video 0.002 0.147 -0.319 0.323
Audio 0.002 0.147 -0.319 0.323
Data 0.076 0.147 -0.245 0.397
70
Video 0.295 0.147 -0.026 0.616
Audio 0.261 0.147 -0.060 0.582
Data 0.002 0.147 -0.319 0.323
100
Video 1.593 0.147 1.272 1.914
Audio 1.820 0.147 1.499 2.141
Data 3.056 0.147 2.735 3.377
V. CONCLUSION AND FUTURE WORK
In this paper, a novel Traffic Shaping (TS) algorithm has been proposed as a new contribution for the implementation of a Quality of Service (QoS) bandwidth management technique to optimise performance in an SDN-sliced network. Two algorithms, namely “Packet Tagging, Queueing, Forwarding
to Queues” and “Allocating Bandwidth” have been proposed for implementing a Weighted Fair Queuing (WFQ) technique as a new methodology in an SDN-sliced testbed to reduce congestion problem and facilitate smooth traffic flow. The proposed methodology contributes to improving QoS by performing two actions: (i) making traffic conform to an individual rate using WFQ to make the appropriate queue for each packet; and (ii) combining the methodology with buffer management, which decides the queue the packet should be assigned to. In this way, the latency and congestion remain in check, thus meeting the requirements of real-time services. The Differentiated Service (DiffServ) protocol is used to define classes, in order to make network traffic patterns more sensitive to traffic classes by specifying precedence for each traffic type, i.e. video, audio and data. The proposed SDN model utilises floodlight controllers, FlowVisor controller and OpenFlow (OF) switches. It has been modelled and simulated via the Mininet Testbed emulator platform.
To validate the proposed approach, a FIFO has been implemented and tested to establish the baseline condition for quantitative performance. In this research, the result obtained from FIFO is used to compare it with our proposed TS algorithms to show a characteristic qualitative pattern of performance. To achieve the highest level of accuracy, The SPSS statistical package has been used to analyse and evaluate the traffic measures of throughput, delay and jitter. These parameters are used as metrics to evaluate the QoS for each switch. We evaluated the proposed TS algorithms against FIFO queuing model. These algorithms permit the more advanced allocation of bandwidth, and reduce critical delays significantly, specifically for delay sensitive traffic, such as video and audio, as compared with data traffic. Up until the early 2020, the deficiencies in package switching for audio, video and data were largely unknown. This changed when the COVID-19 pandemic occurred. As social distancing increased, people needed to find new ways to communicate, for instance, through video chat, as every school child needed communication technologies, like Skype for classes (also, Zoom, Slack and Cisco Webex Teams, and other apps). During this process, users experienced significant failures and video asynchronies, leading to user frustration. In addition, big institutions like the NHS also rely on patient video calls. Universities, business and non-governmental organisations (NGOs) also require these technologies. The pandemic disrupted all previous expectations and projections, changing how traffic generation and distribution impact on existing networks, consequently detrimentally affecting application performance. Hence, there is a real need for improved QoS and new systems to handle network traffic with statistical results that enhance network throughput and (or) reduce end-to-end delay, whilst also dealing with traffic issues like bottlenecks and congestion.
To conclude, this research demonstrates that the implemented algorithms not only minimises the delay and traffic congestion, but also, improves network performance by overcoming the limitations of the FIFO model. A new more advanced queueing agent based on the Packet Tagging and Forwarding, with the proposal of a comparative evaluation with TS and FIFO will be the subject of future work, another

(IJACSA) International Journal of Advanced Computer Science and Applications,
Vol. 12, No. 1, 2021
9 | P a g e
www.ijacsa.thesai.org
significant research path that requires serious investigation is Machine Learning (ML) for the SDN-based traffic classification system. Classification of traffic requires encrypted flow packets that mask flow features. For this classification, advanced deep-learning methods are required to generate patterns using large quantities of training data and to predict the host's bandwidth behaviour.
REFERENCES
[1] Nunes, B.A.A., Mendonca, M., Nguyen, X.N., Obraczka, K. and Turletti, T., (2014). A survey of software-defined networking: Past, present, and future of programmable networks. IEEE Communications Surveys & Tutorials, 16(3), pp.1617-1634.
[2] Kim, H. and Feamster, N., (2013). Improving network management with software defined networking. IEEE Communications Magazine, 51(2), pp.114-119.
[3] Bakshi, K., (2013), March. Considerations for software defined networking (SDN): Approaches and use cases. In 2013 IEEE Aerospace Conference (pp. 1-9). IEEE.
[4] Bakhshi, T., (2017). State of the art and recent research advances in software defined networking. Wireless Communications and Mobile Computing .
[5] Rowshanrad, S., Namvarasl, S., Abdi, V., Hajizadeh, M. and Keshtgary, M., (2014). A survey on SDN, the future of networking. Journal of Advanced Computer Science & Technology, 3(2), pp.232-248.
[6] Al-Haddad, R. and Velazquez, E.S., (2018), July. A Survey of Quality of Service (QoS) Protocols and Software-Defined Networks (SDN). In Science and Information Conference (pp. 527-545). Springer, Cham.
[7] Jarraya, Y., Madi, T. and Debbabi, M., (2014). A survey and a layered taxonomyofsoftware-defined networking. Communications Surveys & Tutorials,IEEE,16(4),pp.1955-1980.
[8] Szilágyi, S. and Almási, B., (2012). A review of congestion management algorithms on cisco routers. Journal of Computer Science and Control Systems, 5(1), p.103.
[9] Thakur, S. and Shukla, A., (2013). A Survey on Quality of Service and Congestion Control. International Journal of Computer Science & Engineering Technology (IJCSET).
[10] Szilágyi, S. and Almási, B., (2012). A review of congestion management algorithms on cisco routers. Journal of Computer Science and Control Systems, 5(1), p.103.
[11] Englert, M. and Westermann, M., (2009). Lower and upper bounds on FIFO buffer management in QoS switches. Algorithmica, 53(4), pp.523-548.
[12] Rowshanrad, S., Namvarasl, S. and Keshtgari, M., (2017). A queue monitoring system in openflow software defined networks. Journal of Telecommunications and Information Technology.
[13] Kim, H., Schlansker, M., Santos, J.R., Tourrilhes, J., Turner, Y. and Feamster, N., (2012), October. Coronet: Fault tolerance for software defined networks. In 2012 20th IEEE international conference on network protocols (ICNP) (pp. 1-2). IEEE.
[14] Haiyan, M., Jinyao, Y.A.N., Georgopoulos, P. and Plattner, B., (2016). Towards SDN based queuing delay estimation. China Communications, 13(3), pp.27-36.
[15] Van Adrichem, N.L., Doerr, C. and Kuipers, F.A., (2014), May. Opennetmon: Network monitoring in openflow software-defined networks. In 2014 IEEE Network Operations and Management Symposium (NOMS) (pp. 1-8). IEEE.
[16] Luong, D.H., Outtagarts, A. and Hebbar, A., (2016), June. Traffic monitoring in software defined networks using opendaylight controller. In International Conference on Mobile, Secure, and Programmable Networking (pp. 38-48). Springer, Cham.
[17] Binsahaq, A., Sheltami, T.R. and Salah, K., (2019). A survey on autonomic provisioning and management of QoS in SDN networks. IEEE Access, 7, pp.73384-73435.
[18] Wallner, R. and Cannistra, R., (2013). An SDN approach: quality of service using big switch‟s floodlight open-source controller. Proceedings of the Asia-Pacific Advanced Network, 35(14-19), pp.10-7125.
[19] Maugendre, M., (2015). Development of a performance measurement tool for SDN (Master's thesis, Universitat Politècnica de Catalunya).
[20] Ishimori, A., Farias, F., Cerqueira, E. and Abelém, A., (2013), October. Control of multiple packet schedulers for improving QoS on OpenFlow/SDN networking. In 2013 Second European Workshop on Software Defined Networks (pp. 81-86). IEEE.
[21] Ruiz, M., Coltraro, F. and Velasco, L., (2018). CURSA-SQ: a methodology for service-centric traffic flow analysis. Journal of Optical Communications and Networking, 10(9), pp.773-784.
[22] Baker, F., Black, D., Blake, S. and Nichols, K., (1998). Definition of the Differentiated Services Field (DS field) in the IPv4 and IPv6 headers. RFC 2474, Dec.
[23] Kulhari, A. and Pandey, A.C., (2016), February. Traffic shaping at differentiated services enabled edge router using adaptive packet allocation to router input queue. In 2016 Second International Conference on Computational Intelligence & Communication Technology (CICT) (pp. 242-247). IEEE.
[24] Bosshart, P., Gibb, G., Kim, H.S., Varghese, G., McKeown, N., Izzard, M., Mujica, F. and Horowitz, M., (2013). Forwarding metamorphosis: Fast programmable match-action processing in hardware for SDN. ACM SIGCOMM Computer Communication Review, 43(4), pp.99-110.
[25] Kuźniar, M., Perešíni, P. and Kostić, D., (2015), March. What you need to know about SDN flow tables. In International Conference on Passive and Active Network Measurement (pp. 347-359). Springer, Cham.
[26] Dekeris, B., Adomkus, T. and Budnikas, A., (2006), June. Analysis of QoS assurance using weighted fair queueing (WQF) scheduling discipline with low latency queue (LLQ). In 28th International Conference on Information Technology Interfaces, 2006. (pp. 507-512). IEEE.
[27] Khuri, A.I., (2004). Applications of Dirac's delta function in statistics. International Journal of Mathematical Education in Science and Technology, 35(2), pp.185-195.
[28] Rutherford, A., (2001). Introducing ANOVA and ANCOVA: a GLM approach. Sage.