a novel systems biology approach to evaluate mouse models
TRANSCRIPT

METHODOLOGY Open Access
A novel systems biology approach toevaluate mouse models of late-onsetAlzheimer’s diseaseChristoph Preuss1†, Ravi Pandey1†, Erin Piazza2, Alexander Fine1, Asli Uyar1, Thanneer Perumal2, Dylan Garceau1,Kevin P. Kotredes1, Harriet Williams1, Lara M. Mangravite3, Bruce T. Lamb4, Adrian L. Oblak4, Gareth R. Howell1,Michael Sasner1, Benjamin A. Logsdon3, the MODEL-AD Consortium and Gregory W. Carter1*
Abstract
Background: Late-onset Alzheimer’s disease (LOAD) is the most common form of dementia worldwide. To date,animal models of Alzheimer’s have focused on rare familial mutations, due to a lack of frank neuropathology frommodels based on common disease genes. Recent multi-cohort studies of postmortem human brain transcriptomeshave identified a set of 30 gene co-expression modules associated with LOAD, providing a molecular catalog ofrelevant endophenotypes.
Results: This resource enables precise gene-based alignment between new animal models and human molecularsignatures of disease. Here, we describe a new resource to efficiently screen mouse models for LOAD relevance. Anew NanoString nCounter® Mouse AD panel was designed to correlate key human disease processes and pathwayswith mRNA from mouse brains. Analysis of the 5xFAD mouse, a widely used amyloid pathology model, and threemouse models based on LOAD genetics carrying APOE4 and TREM2*R47H alleles demonstrated overlaps withdistinct human AD modules that, in turn, were functionally enriched in key disease-associated pathways.Comprehensive comparison with full transcriptome data from same-sample RNA-Seq showed strong correlationbetween gene expression changes independent of experimental platform.
Conclusions: Taken together, we show that the nCounter Mouse AD panel offers a rapid, cost-effective and highlyreproducible approach to assess disease relevance of potential LOAD mouse models.
BackgroundLate-onset Alzheimer’s disease (LOAD) is the mostcommon cause of dementia worldwide [1]. LOAD presentsas a heterogenous disease with highly variable outcomes.Recent efforts have been made to molecularly characterizeLOAD using large cohorts of post-mortem human braintranscriptomic data [2]. Systems-level analysis of theselarge human data sets has revealed key drivers and molecu-lar pathways that reflect specific changes resulting from
disease [2, 3]. These studies have been primarily driven bygene co-expression analyses that reduce transcriptomes tomodules representing specific disease processes or celltypes across heterogenous tissue samples [2, 4–6]. Similarapproaches have been used to characterize mouse modelsof neurodegenerative disease [7]. Detailed cross-speciesanalysis reveals a translational gap between animal modelsand human disease, as no existing models fully recapitulatepathologies associated with LOAD [8–11]. New platformsto rapidly assess the translational relevance of new animalmodels of LOAD will allow efficient identification of themost promising preclinical models.
© The Author(s). 2020 Open Access This article is licensed under a Creative Commons Attribution 4.0 International License,which permits use, sharing, adaptation, distribution and reproduction in any medium or format, as long as you giveappropriate credit to the original author(s) and the source, provide a link to the Creative Commons licence, and indicate ifchanges were made. The images or other third party material in this article are included in the article's Creative Commonslicence, unless indicated otherwise in a credit line to the material. If material is not included in the article's Creative Commonslicence and your intended use is not permitted by statutory regulation or exceeds the permitted use, you will need to obtainpermission directly from the copyright holder. To view a copy of this licence, visit http://creativecommons.org/licenses/by/4.0/.The Creative Commons Public Domain Dedication waiver (http://creativecommons.org/publicdomain/zero/1.0/) applies to thedata made available in this article, unless otherwise stated in a credit line to the data.
* Correspondence: [email protected]†Christoph Preuss and Ravi Pandey contributed equally to this work.1The Jackson Laboratory, Bar Harbor, ME 04609, USAFull list of author information is available at the end of the article
Preuss et al. Molecular Neurodegeneration (2020) 15:67 https://doi.org/10.1186/s13024-020-00412-5

In this study, we describe a novel gene expressionpanel to assess LOAD-relevance of mouse models basedon expression of key genes in the brain. We used arecent human molecular disease catalog based onharmonized co-expression data from three independentpost mortem brain cohorts (ROSMAP, Mayo, MountSinai Brain bank) [12–14] and seven brain regions thatdefine 30 human co-expression modules and five consen-sus clusters derived from the overlap of those modules [9].These modules were used to design a mouse gene expres-sion panel to assess the molecular overlap between humandisease states and mouse models. This nCounter MouseAD panel was piloted with samples from three novelmouse models of LOAD. Same-sample comparison be-tween NanoString and RNA-Seq data demonstrated highper-gene correlation and overall concordance when
separately compared to human disease co-expressionmodules. Taken together, the rapid screening of mousemodels in the course of different life stages will allowbetter characterization of models based on alignment withspecific human molecular pathologies.
ResultsHuman-mouse co-expression module conservation andprobe coverage across 30 LOAD associated modulesAn overview of the Mouse AD panel design for translatingthe 30 human AMP-AD co-expression modules from threecohorts and seven brain regions is depicted in Fig. 1. Mouseto human gene prioritization resulted in the selection of760 key mouse genes targeting a subset of highly co-expressed human genes plus 10 housekeeping genes, whichexplained a significant proportion of the observed variance
Fig. 1 Overview of the nCounter Mouse AD panel design. The novel Mouse AD panel measures expression of genes from a set of 30 human co-expression modules from three human LOAD cohorts, including seven distinct brain regions. Human genes central to each of the humanexpression modules were prioritized for the Mouse AD panel to select conserved signatures of LOAD associated pathways
Preuss et al. Molecular Neurodegeneration (2020) 15:67 Page 2 of 16
across the 30 human AMP-AD modules (Methods). Co-expression modules were grouped into functionally distinctconsensus clusters as previously described by Wan, et al.(see also Table S1) [9]. These consensus clusters containexpression modules from different brain regions and inde-pendent studies that share a high overlap in gene contentand similar expression characteristics. Consensus clusterswere annotated based on Reactome pathway enrichmentanalysis for the corresponding genes within each function-ally distinct cluster (Methods, Table S1). Since consensusclusters showed an enrichment of multiple biological path-ways, the highest rank and non-overlapping Reactomepathway was used to refer to each cluster (Table S2). Inorder to assess the conservation of sequence and gene ex-pression levels between human and mouse genes for eachof the 30 human co-expression modules, dN/dS valueswere correlated with the overall overlap in expression inbrains from six-month-old C57BL/6 J (B6) mice (Fig. 2a).The fraction of orthologous genes expressed in the mousebrain, based on the presence or absence of transcripts at de-tectable levels, was very highly correlated with the overallmodule conservation (p < 2.2 × 10− 16, Pearson’s correlationcoefficient: − 0.96). Module conservation was based on themedian dN/dS statistics measuring the rate of divergence inthe coding sequence for all genes within a given module be-tween both species (Figure S1). Notably, human co-expression modules of Consensus Cluster C, associatedwith the neuronal system and neurotransmission, showedthe lowest degree of sequence divergence with a high pro-portion of human genes (64–72%) expressed in six-month-old B6 mice. In contrast to the highly conserved neuronalmodules, immune modules of Consensus Cluster B con-tained genes that recently diverged on the sequence leveland acquired a higher number of destabilizing missensevariants. These modules showed the highest median dN/dS values and the lowest fraction of genes (27–46%)expressed in the mouse brain across all testedmodules. The remaining human co-expression mod-ules, associated with different functional categories(Fig. 2a, Table S1), had intermediate overlap inexpression levels between human and mice. Each ofthe 30 human co-expression modules was covered withan average of 148 NanoString mouse probes (SD = 50probes), where a single mouse probe can map to multiplehuman modules from different study cohorts and acrossseveral brain regions. Overall, mouse probe coverage forhuman co-expression modules ranged between 4 and 19%,depending on the size and level of conservation of thetargeted human module (Fig. 2b and c, Tables S2 and S3).For three of the largest human co-expression modulesharboring over 4000 transcripts, the probe coveragewas slightly below the targeted 5% coverage threshold.However, these large modules are predominantly asso-ciated with neuronal function and show a high degree
of expression and sequence conservation between humanand mouse (Figs. 2a). Immune modules, containing genesthat recently diverged on the coding sequence level, arewell covered with a median coverage of 10% (Fig. 2c). Acomplete annotation of mouse probes to human tran-scripts for each human co-expression module is providedin Table S3. In addition, we compared our novel panel tothe existing nCounter Mouse Neuropathology panel de-signed to assess expression changes in multiple neurode-generative diseases. We observed an overlap of 105 probes(7%) between both panels, highlighting that most of ourselected probe content is novel and specific to LOADassociated disease processes and pathways.
Prioritized subset of key genes shows a higher degree ofsequence conservation and expression level acrossmodulesIn order to assess the level of sequence divergence andexpression for the prioritized subset of genes on thenovel panel, the selected subset of genes was comparedto all genes across the 30 human co-expression modules.The 760 key genes, explaining a significant proportion ofthe observed variance in each human module, showedan overall lower level of sequence divergence (mediandN/dS values) when compared to all other genes in themodules (Fig. 3, Figure S1). Furthermore, the selectedkey genes on the Mouse AD panel also displayed ahigher average level of gene expression in brains of six-month-old B6 mice compared to the remaining genesfor each of the 30 modules (Fig. 3). This highlights thatour formal prioritization procedure resulted in the selec-tion of a subset of highly expressed key genes, which arealso more conserved between human and mouse facili-tating the translation of co-expression profiles acrossspecies.
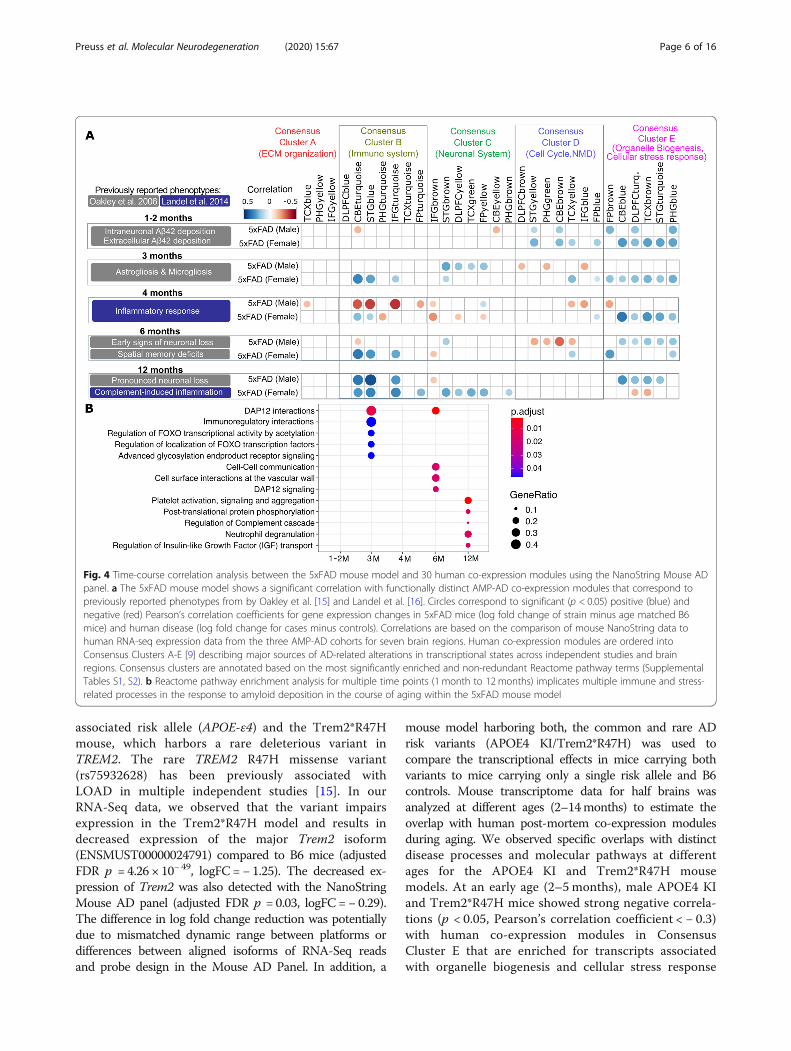
5xFAD mouse co-expression modules correlate with AMP-AD modules enriched for inflammatory and stressresponse pathwaysTo validate our novel Mouse AD panel, a time-courseanalysis was performed to correlate human AMP-ADco-expression modules with the 5xFAD mouse modelcarrying a transgenic insertion with five familial muta-tions in APP and PSEN1. The 5xFAD strain is a com-monly used model of neurodegenerative disease forwhich neuropathology, histological as well as behavioraldata are readily available (Fig. 4a). We analyzed mouseNanoString data from brain hemispheres from 1 to 12months old mice in order to identify an overlap with hu-man post-mortem co-expression modules in the courseof amyloid deposition and aging. 5xFAD mice have beenshown to accumulate high levels of intraneuronal Aβ42at around 1.5 months of age and extracellular amyloid ataround 2months of age in the subiculum and cortex
Preuss et al. Molecular Neurodegeneration (2020) 15:67 Page 3 of 16

(Fig. 4a) [15]. Amyloid deposition in 5xFAD mice in-duced rising oxidative stress in surrounding cells andtissues and led to subsequent cell dysfunction and eleva-tion of apoptosis markers. This is reflected in the transcrip-tomic response of one to 2 months old 5xFAD mice whichshowed a significant positive correlation (p < 0.05,
Pearson’s correlation coefficient > 0.25) with multiple hu-man AMP-AD modules enriched for pathways linked tothe cellular stress response in Consensus Cluster E (Fig.4a). The 5XFAD strain also exhibited neuroinflammationafter 2months of age, as previously demonstrated by an in-crease in astrogliosis and microgliosis after initial plaque
Fig. 2 Human to mouse comparison and probe coverage summary statistics. a Human-mouse sequence divergence (median dN/dS values) isinversely correlated (Pearson’s correlation coefficient: − 0.96) with the fraction of genes being expressed in B6 mouse brain for each of the humanco-expression modules. b Coverage of the 770 selected mouse NanoString probes for the 30 human co-expression modules associated with fivefunctional consensus clusters. The size and number of human co-expression modules differs for the three post-mortem brain cohorts (ROSMAP,Mayo, Mount Sinai Brain Bank) and across the seven included brain regions. c This results in a varying degree of probe coverage for each modulewith a number of disease associated consensus clusters (a-e), reflecting disease related pathways and processes
Preuss et al. Molecular Neurodegeneration (2020) 15:67 Page 4 of 16

deposition [15]. This is in line with our 5xFAD data fromthe Mouse AD panel which showed an increased correl-ation between 3 and 4months with several human mod-ules in Consensus Cluster B enriched for immune relatedpathways. Furthermore, we observed an increased correl-ation with inflammatory AMP-AD co-expression modulesafter 4months of age, where older mice at (6–12months)showed a highly significant overlap with human immunemodules in the cerebellum, superior temporal gyrus andinferior frontal gyrus (p < 0.05, Pearson’s correlation coeffi-cient > 0.35). This clear shift in inflammatory gene expres-sion signatures after 3months of age is a hallmark of the5xFAD model in response to aggressive amyloid depositionin the brain and corresponded with previous findingsfrom a transcriptomic survey of 5xFAD mice [16].Reactome pathway analysis in 5xFAD mice comparedto age-matched B6 controls supported the results fromour correlation analysis (Fig. 4b). At a young age (3months), several stress and immune related pathways wereenriched in 5xFAD mice when compared to B6 mice.These pathways, including the activation of FOXO tran-scription factors pathway, are well known to mediate acellular stress response to Aβ42 [17]. In older micebetween the ages of 6 to 12months, pathways linked tomicroglia and complement activation, such as the DAP12signaling pathway, were enriched in 5xFAD mice which isin line with a previous study (Fig. 4b) [16]. Moreover, weobserved a positive correlation with human AMP-AD
modules enriched for neuronal pathways in ConsensusCluster C. This transcriptional response occurred afterearly amyloid deposition in male mice at 3 months(p < 0.05, Pearson’s correlation coefficient > 0.15) andafter the onset of neuronal loss in female mice at 12months. Taken together, our novel approach identifiedseveral transcriptomic signatures in responses to amyl-oid deposition in the 5xFAD model that correlatedwith human post-mortem data from different brainregions. Despite the overlap with several key diseaseprocesses on the transcriptome level across species,the 5xFAD strain does not fully recapitulate LOADpathologies. In addition, the highly penetrant nature ofthe early-onset familial variants expressed on the 5xFADbackground made it difficult to identify disease related pro-cesses independent of amyloid pathology. For this reason,we used our approach to elucidate the role of additionalAD risk variants in a set of novel mouse models .
Novel mouse models harboring LOAD associated riskvariants correlate with distinct AMP-AD modules in abrain region- and pathway-specific mannerThree novel mouse models, harboring two LOAD riskalleles, (Table S4) were used to translate co-expressionprofiles between human and mouse brain transcrip-tome data using our novel Mouse AD panel. Transcrip-tome analysis was performed for the APOE4 KI mouse,carrying a humanized version of the strongest LOAD
Fig. 3 NanoString Mouse AD probe genes are strongly conserved and show high expression levels in the mouse brain. Comparison betweengene-level sequence divergence and transcript abundances in 6 months old B6 mouse brains for all genes (red) in human co-expression modulesand the subset of 770 genes covered by NanoString probes on the Mouse AD panel (green). Human transcripts within AMP-AD co-expressionmodules targeted by selected mouse NanoString probes highlighted in green showed higher levels of sequence conservation and transcriptabundance across species when compared to unselected genes within modules
Preuss et al. Molecular Neurodegeneration (2020) 15:67 Page 5 of 16
associated risk allele (APOE-ε4) and the Trem2*R47Hmouse, which harbors a rare deleterious variant inTREM2. The rare TREM2 R47H missense variant(rs75932628) has been previously associated withLOAD in multiple independent studies [15]. In ourRNA-Seq data, we observed that the variant impairsexpression in the Trem2*R47H model and results indecreased expression of the major Trem2 isoform(ENSMUST00000024791) compared to B6 mice (adjustedFDR p = 4.26 × 10− 49, logFC = − 1.25). The decreased ex-pression of Trem2 was also detected with the NanoStringMouse AD panel (adjusted FDR p = 0.03, logFC = − 0.29).The difference in log fold change reduction was potentiallydue to mismatched dynamic range between platforms ordifferences between aligned isoforms of RNA-Seq readsand probe design in the Mouse AD Panel. In addition, a
mouse model harboring both, the common and rare ADrisk variants (APOE4 KI/Trem2*R47H) was used tocompare the transcriptional effects in mice carrying bothvariants to mice carrying only a single risk allele and B6controls. Mouse transcriptome data for half brains wasanalyzed at different ages (2–14months) to estimate theoverlap with human post-mortem co-expression modulesduring aging. We observed specific overlaps with distinctdisease processes and molecular pathways at differentages for the APOE4 KI and Trem2*R47H mousemodels. At an early age (2–5 months), male APOE4 KIand Trem2*R47H mice showed strong negative correla-tions (p < 0.05, Pearson’s correlation coefficient < − 0.3)with human co-expression modules in ConsensusCluster E that are enriched for transcripts associatedwith organelle biogenesis and cellular stress response
Fig. 4 Time-course correlation analysis between the 5xFAD mouse model and 30 human co-expression modules using the NanoString Mouse ADpanel. a The 5xFAD mouse model shows a significant correlation with functionally distinct AMP-AD co-expression modules that correspond topreviously reported phenotypes from by Oakley et al. [15] and Landel et al. [16]. Circles correspond to significant (p < 0.05) positive (blue) andnegative (red) Pearson’s correlation coefficients for gene expression changes in 5xFAD mice (log fold change of strain minus age matched B6mice) and human disease (log fold change for cases minus controls). Correlations are based on the comparison of mouse NanoString data tohuman RNA-seq expression data from the three AMP-AD cohorts for seven brain regions. Human co-expression modules are ordered intoConsensus Clusters A-E [9] describing major sources of AD-related alterations in transcriptional states across independent studies and brainregions. Consensus clusters are annotated based on the most significantly enriched and non-redundant Reactome pathway terms (SupplementalTables S1, S2). b Reactome pathway enrichment analysis for multiple time points (1 month to 12 months) implicates multiple immune and stress-related processes in the response to amyloid deposition in the course of aging within the 5xFAD mouse model
Preuss et al. Molecular Neurodegeneration (2020) 15:67 Page 6 of 16
pathways in multiple brain regions (Fig. 5a). Further-more, Trem2*R47H male mice showed a significantlynegative association (p < 0.05, Pearson’s correlation co-efficient < − 0.2) with immune related human modulesin the superiortemporal gyrus, the inferiorfrontal gyrus,cerebellum and prefrontal cortex (Fig. 5a). This effectbecomes more pronounced later in development, betweensix and 14months, when the negative correlation with hu-man immune modules is also observed in Trem2*R47Hfemale mice. During mid-life, (6–9months old age group),we observed an age-dependent effect for the APOE4 KImouse in which human neuronal modules in ConsensusCluster C start to become positively correlated with thecorresponding human expression modules (Fig. 5a). Inter-estingly, neuronal co-expression modules which areassociated with synaptic signaling appear to be positivelycorrelated with APOE4 KI, but not Trem2*R47H mice inan age dependent manner. This up-regulation of genesassociated with synaptic signaling and a decrease oftranscripts enriched for cell cycle, RNA non-mediateddecay, myelination and glial development in aged micewas consistent for multiple brain regions and across threeindependent human AD cohorts. When compared toAPOE4 KI mice, Trem2*R47H mice showed an agedependent decrease in genes associated with the immuneresponse in several AMP-AD modules which is not ob-served for APOE4 KI mice (Fig. 5a). Notably, the APOE4KI/Trem2*R47H mice showed characteristics of both sin-gle variant mouse models. At an early age, an overlap withboth neuronal and immune associated human modules isobserved and becomes more pronounced during aging.
Differential expression and gene set enrichment analysisIn order to relate the human co-expression modules todisease associated genes and pathways, we performeddifferential expression (DE) analysis for the three novelmouse models and the 5xFAD mouse. Each mousemodel was compared to the B6 control to assess theoverall transcriptomic response and the differences inDE genes across models. Both the APOE4 KI and theAPOE4 KI/Trem2*R47H models showed a moderatenumber of DE genes compared to B6 mice (< 100) atmid-life (6–9 months) while the number of DE is smaller(< 20) late in life. Early in life (2–5months), only onegene was found to be DE in both the humanized APOE4KI and the APOE4 KI/Trem2*R47H model (Tables S5,S6). We observed a significant decrease of the mouseApoe gene (adjusted FDR p = 1.78 × 10− 69, logFC > −3.5) reflecting that it was replaced by the human version.The Trem2*R47H model shows mostly down-regulatedgenes across all age groups, many of which are up-regulated in 5xFAD mice. While microglia related genes,including Tyrobp, Trem2, and complement componentsC1qa, C1qb, C1qc are highly up-regulated in 5xFAD mice,
these genes are down-regulated in the Trem2*R47H model(Table S6). To elucidate the role of these immune relateddisease genes on the pathway level, gene set enrichmentanalysis (GSEA) was performed for the four mouse modelsand resulting pathways were compared to the humanAMP-AD data. GSEA revealed multiple immune associ-ated pathways up-regulated in 5xFAD mice when com-pared to B6 mice. The strongest association was observedin aged mice (10–14months) where three immune relatedpathways (phagosome, Chagas disease, osteoclast differen-tiation) are significantly up-regulated (adjusted Benjamini-Hochberg p < 0.05) in the 5xFAD model. These pathways,which were also up-regulated in multiple brain regionsfrom independent AMP-AD cohorts (cerebellum, superiortemporal gyrus, temporal cortex), were down-regulated inthe Trem2*R47H model (Figure S2). Notably, this neuro-protective effect of the Trem2*R47H allele was dampenedin the presence of APOE4 on the APOE4 KI/Trem2*R47Hbackground, which did not show any significant associa-tions with immune pathways (Figure S2). To follow up onthis antagonistic effect, pathway enrichment analysis fordifferentially expressed genes between APOE4 KI andTrem2*R47H mice was performed using both the Reac-tome [18] and WikiPathway knowledge pathway databases.Multiple pathways linked to immune function and specific-ally complement activation were significantly enriched(FDR adjusted p < 0.05) for genes showing opposite expres-sion patterns in both mouse models late in life (10–14months) (Fig. 5b). Among the genes that contribute signifi-cantly to this pathway enrichment were three members ofthe complement complex 1q (C1q), namely C1qa, C1qb,and C1qc that were also found to be up-regulated in theamyloidogenic 5xFAD model. These genes encode for theC1q complex and were significantly decreased in both theTrem2*R47H and APOE4 KI/Trem2*R47H model whencompared to the APOE4 KI model (Fig. 5c, Table S7).This is in line with a recent study that linked thedecrease in synaptic damage and vulnerability in ahumanized Trem2*R47H tauopathy mouse model to re-duced C1q expression [19]. Moreover, C1q accumula-tion had been shown to be drastically increased insynapses of APOE4 KI mice, when compared to APOE3KI mice suggesting an important role of C1q in enhan-cing synaptic vulnerability to classical-complement-cascade mediated neurodegeneration [20]. Furthermore,expression of the C1q complex is critical for microgliafunction. Immune pathways up-regulated in 5xFADmice and down-regulated in our Trem2*R47H modelharbor multiple important genes (Tyrobp, Trem2, Ctss,and Apoe) linked to the activation of disease associatedmicroglia (DAM). In order to further characterize therole of DAM genes, we compared DAM expressionsignatures based on recently published data single-celltranscriptomic data [21] (Figure S3). The expression
Preuss et al. Molecular Neurodegeneration (2020) 15:67 Page 7 of 16

Fig. 5 (See legend on next page.)
Preuss et al. Molecular Neurodegeneration (2020) 15:67 Page 8 of 16

signatures of 21 DAM associated genes on the Nano-String panel supported an increased expression ofDAM associated genes in the 5xFAD mice compared toB6 late in life (10-14months) (Figure S3). This increasedexpression of DAM genes was absent in the APOE4 andTrem2 models when compared to age-matched B6 mice.
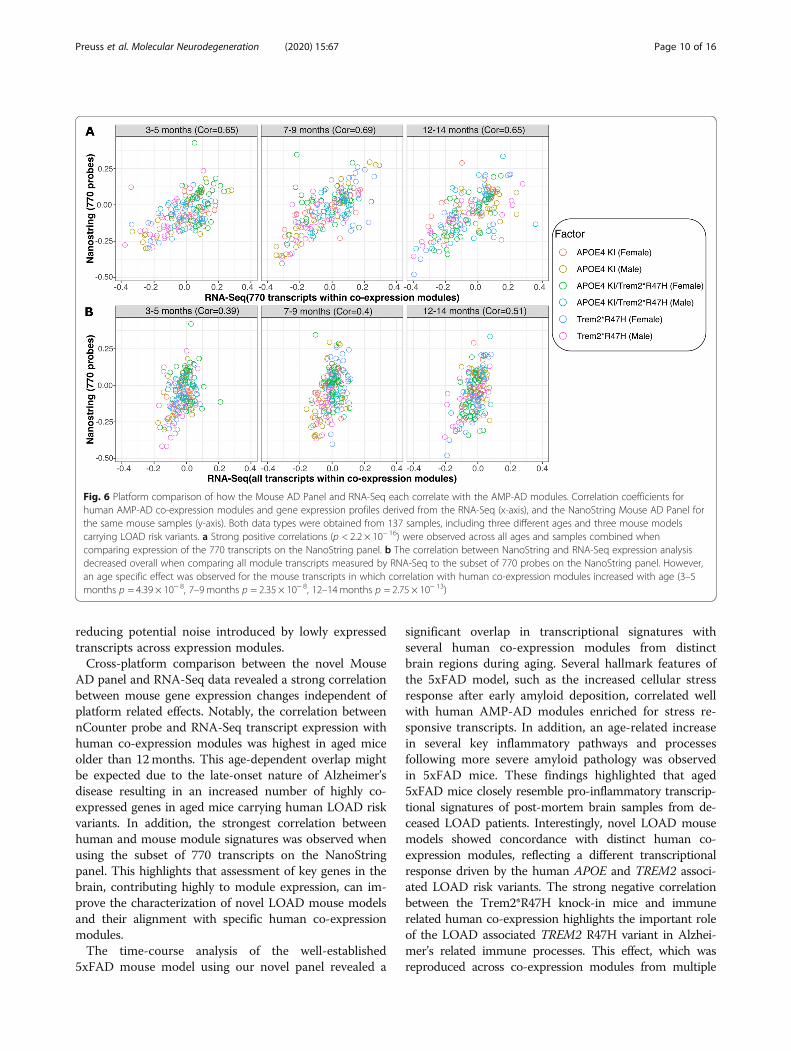
Comparison between nCounter mouse AD panel andRNA-Seq dataTo assess the validity of the novel Mouse AD panelacross transcriptomic platforms, we compared theresults from the nCounter platform to RNA-Seq data forthe same 137 mouse brain samples from three novelLOAD models carrying APOE4 and TREM2*R47Halleles for which both RNA-Seq and NanoString datawas available. A correlation analysis was performed tocompare the expression of the 770 NanoString probesacross co-expression modules with RNA-Seq transcriptexpression for all ages, highlighting the different LOADmouse models as independent variables (Fig. 6). For thedirect comparison, between the 770 NanoString probeswith corresponding RNA-Seq transcripts, a similar rangeof correlation coefficients between human data and thethree mouse models was observed (Fig. 6a). Overall, thecorrelation between the RNA-Seq and NanoString plat-forms were high across all age groups (Pearson’s correl-ation coefficients: 0.65–0.69) when comparing the subsetof 760 key transcripts and 10 housekeeping transcriptsacross platforms. This demonstrates that the novelNanoString panel, despite the limited number of keycustom probes, can achieve similar results when com-pared to high-throughput RNA-Seq data. Furthermore,the alignment of human and mouse modules based onthe expression of all genes within each modules showeda weaker range of correlations when compared to tran-scripts covered by the 770 NanoString probes (Fig. 6b).Overall, we found strong and significant correlationsbetween the results. Notably, these correlations generallyincreased with mouse age, suggesting that the humanrelevance of the models is increasing with age and thatthis relevance is captured well by both the NanoStringand RNA-Seq platforms (Fig. 6b). A mild correlation ataround 3 months of age (Pearson’s correlation coeffi-cient: 0.39) increased to a moderate correlation at 12
months of age (Pearson’s correlation coefficient: 0.51).Furthermore, we observed a high correlation of logcount values for the majority of NanoString probes whencompared to log TPM transcript ratios from RNA-Seqdata. The majority of the 770 measured NanoStringprobes (716/770 probes, 93%) were positively correlatedwith RNA-Seq transcripts (Figure S4). In order to testwhether noise introduced by highly variable transcriptsaffects the correlation between NanoString probes andRNA-Seq transcripts, Pearson’s correlation coefficientsand variance in RNA-Seq expression across 137 sampleswere compared. There was no significant trend indicat-ing an effect of highly variable transcripts on the overallcorrelation coefficients between transcripts measured byRNA-Seq and NanoString (Figure S4).
DiscussionHere, we describe a novel systems biology approach torapidly assess disease relevance for three novel mousemodels carrying two human risk variants, stronglyassociated with LOAD. The nCounter Mouse AD geneexpression panel was designed to align human braintranscriptome data covering 30 co-expression modules.Cross-species comparison of human and mouse revealedthat immune associated co-expression modules whichharbor genes that have recently diverged in sequencewere more likely to be lowly expressed or absent at thetranscript level in brains from 6months old B6 mice. Incontrast, neuronal modules containing genes with alower degree of sequence divergence between both spe-cies were more likely to be highly and constitutivelyexpressed in the mouse brain when compared to theremaining co-expression modules. This is in line withevidence from multiple studies highlighting that con-served neuronal process in the brain are under strongpurifying selection while immune related genes are morelikely to diverge in function and expression patternsacross species [22, 23]. By using our prioritizationapproach, we selected for key mouse genes targeting asubset of highly co-expressed human genes. This subsetof genes on the NanoString panel showed overall lowerlevels of sequence divergence compared to human genesand higher expression levels in the mouse brain,
(See figure on previous page.)Fig. 5 Correlation analysis between three novel LOAD mouse models and human co-expression modules reveals age-related changes in immunefunction. a Correlation analysis highlights age-related changes in Trem2*R47H, APOE4 KI and APOE4 KI/Trem2*R47H mice. Circles correspond tosignificant (p < 0.05) positive (blue) and negative (red) Pearson’s correlation coefficients for gene expression changes in mice associated withdistinct human co-expression modules. This includes multiple modules linked to immune function (Consensus Cluster B) and stress response(Consensus Cluster E). b Pathway analysis for the Reactome and WikiPathway resources highlights a significant enrichment (FDR adjusted p <0.05) of pathways involved in complement activation in both older (10–14 months) APOE4 KI and Trem2*R47H mice. c Genes encoding forcomplement component C1q show an antagonistic transcriptional effect between the Trem2*R47H and APOE4 KI/Trem2*R47H mice whencompared to the humanized APOE4 knock-in model (*denotes FDR adjusted p < 0.05)
Preuss et al. Molecular Neurodegeneration (2020) 15:67 Page 9 of 16
reducing potential noise introduced by lowly expressedtranscripts across expression modules.Cross-platform comparison between the novel Mouse
AD panel and RNA-Seq data revealed a strong correlationbetween mouse gene expression changes independent ofplatform related effects. Notably, the correlation betweennCounter probe and RNA-Seq transcript expression withhuman co-expression modules was highest in aged miceolder than 12months. This age-dependent overlap mightbe expected due to the late-onset nature of Alzheimer’sdisease resulting in an increased number of highly co-expressed genes in aged mice carrying human LOAD riskvariants. In addition, the strongest correlation betweenhuman and mouse module signatures was observed whenusing the subset of 770 transcripts on the NanoStringpanel. This highlights that assessment of key genes in thebrain, contributing highly to module expression, can im-prove the characterization of novel LOAD mouse modelsand their alignment with specific human co-expressionmodules.The time-course analysis of the well-established
5xFAD mouse model using our novel panel revealed a
significant overlap in transcriptional signatures withseveral human co-expression modules from distinctbrain regions during aging. Several hallmark features ofthe 5xFAD model, such as the increased cellular stressresponse after early amyloid deposition, correlated wellwith human AMP-AD modules enriched for stress re-sponsive transcripts. In addition, an age-related increasein several key inflammatory pathways and processesfollowing more severe amyloid pathology was observedin 5xFAD mice. These findings highlighted that aged5xFAD mice closely resemble pro-inflammatory transcrip-tional signatures of post-mortem brain samples from de-ceased LOAD patients. Interestingly, novel LOAD mousemodels showed concordance with distinct human co-expression modules, reflecting a different transcriptionalresponse driven by the human APOE and TREM2 associ-ated LOAD risk variants. The strong negative correlationbetween the Trem2*R47H knock-in mice and immunerelated human co-expression highlights the important roleof the LOAD associated TREM2 R47H variant in Alzhei-mer’s related immune processes. This effect, which wasreproduced across co-expression modules from multiple
Fig. 6 Platform comparison of how the Mouse AD Panel and RNA-Seq each correlate with the AMP-AD modules. Correlation coefficients forhuman AMP-AD co-expression modules and gene expression profiles derived from the RNA-Seq (x-axis), and the NanoString Mouse AD Panel forthe same mouse samples (y-axis). Both data types were obtained from 137 samples, including three different ages and three mouse modelscarrying LOAD risk variants. a Strong positive correlations (p < 2.2 × 10− 16) were observed across all ages and samples combined whencomparing expression of the 770 transcripts on the NanoString panel. b The correlation between NanoString and RNA-Seq expression analysisdecreased overall when comparing all module transcripts measured by RNA-Seq to the subset of 770 probes on the NanoString panel. However,an age specific effect was observed for the mouse transcripts in which correlation with human co-expression modules increased with age (3–5months p = 4.39 × 10− 8, 7–9 months p = 2.35 × 10− 8, 12–14months p = 2.75 × 10− 13)
Preuss et al. Molecular Neurodegeneration (2020) 15:67 Page 10 of 16

human brain regions (cerebellum, frontal cortex, temporalgyrus, frontal gyrus, frontal pole), was inverted in thepresence of a high amyloid burden in the 5xFAD model.Immune related pathways containing genes linked tomicroglia activation were significantly increased in 5xFADmice and decreased in Trem2*R47H mice. Interestingly,this inflammatory response was partially restored in thepresence of APOE4 allele on the APOE4 KI/Trem2*R47Hbackground suggesting an interaction between the twoLOAD risk alleles. Pathway and differential gene expres-sion analysis revealed antagonistic expression signaturesbetween APOE4 KI and Trem2*R47H mice linked to theactivation of the classical complement component throughC1q members (C1qa, C1qb, C1qc). C1q protein accumu-lates at senescent synapses in the course of normal brainaging making them more vulnerable to complementmediated neurodegeneration. A recent study showed thatexpressing the R47H risk allele in a humanized Trem2mouse model lowers the expression of C1q at synapseswhich in turn protects them from damage in the setting ofa tauopathy mouse model [19]. This is in line with multiplestudies which showed that the profound loss of synapses atthe early stages of AD can be prevented by blocking activa-tion of the complement cascade through C1q depletion inthe mouse [24, 25]. In contrast, the APOE4 isoform in-creases C1q accumulation at synapses making them morevulnerable to degeneration when compared to the APOE2and APOE3 isoforms in a set of APOE KI models [20].However, C1q accumulation at synapses alone might notbe sufficient to trigger synaptic loss in the aging brain.Other factors mediated by the Trem2 R47H and APOE4risk alleles may activate the neuroinflammatory cascadethat leads to age-related neurodegeneration which willrequire further studies in these novel LOAD models.Furthermore, a strong negative correlation between co-expression modules associated with cell cycle and DNA re-pair was observed for the mouse APOE4 KI model. Thisoverlap with human late-onset co-expression signaturesearly in life was observed for a number of different brainregions and is absent in Trem2*R47H knock-in mice. Fur-thermore, aged APOE4 KI mice show a strong overlap withseveral human neuronal co-expression modules enrichedfor genes that play an important role in synaptic signalingand myelination. Although, APOE4 KI mice lack a clearneurodegenerative phenotype, this age dependent shiftin co-expression patterns associated with core LOADpathologies points to an increased susceptibility tocognitive decline in aged mice. This is in line with sev-eral studies which have shown that cognitive deficits inAPOE4 transgenic mice develop late in life [26, 27].Taken together, these results suggest that correlatinggene expression signatures in LOAD and FAD mousemodels to disease-associated AMP-AD modules canidentify transcriptional disruptions relevant to human
disease, even when the models are insufficiently ad-vanced to exhibit full LOAD pathology. Assessing theeffects of individual and combinations of LOAD variantsin mouse models in this way can potentially separate thecausal co-expression modules that drive LOAD pathologythrough genetic risk factors from modules that respond toestablished pathology. Furthermore, staging such in vivomodels over a lifetime can determine the order ofevents, including microglia activation and, ultimately,neuronal loss observed in LOAD patients. The MouseAD Panel described here provides an efficient plat-form to detect these events.
Limitations of the approachAlbeit being an excellent resource for characterizing mo-lecular pathways and key drivers of disease, co-expressionmodules based on human post-mortem brain data haveseveral limitations. As end stage measures, they might notreflect changes that occur early in disease pathogenesis. Forthis reason, we were unable to devise age-specific mousepanels that could be most informative at specific diseasestages. However, as mouse models improve and are charac-terized at multiple ages, early transcriptomic indicators ofLOAD might motivate additional panels correspond-ing to stages of pathogenesis. In addition, although ahigh concordance was observed across brain regionsfor the 30 modules, they might not cover individualor region-specific differences in patients in responseto amyloid and tau pathology [9]. Furthermore, weused brain homogenates from our mouse models forthe transcript comparison with different human brainregions in this study. Dissection of mouse brain re-gions to match the human studies might further improvethe observed co-expression module correlations.
MethodsAMP-AD post-mortem brain cohorts and gene co-expression modulesData on the 30 human AMP-AD co-expression moduleswas obtained from the Synapse data repository (https://www.synapse.org/#!Synapse:syn11932957/tables/; Synap-seID: syn11932957). The modules derive from three inde-pendent LOAD cohorts, including 700 samples from theROSMAP cohort, 300 samples from the Mount Sinai Brainbank and 270 samples from the Mayo cohort. Details onpost-mortem brain sample collection, tissue and RNApreparation, sequencing, and sample QC can be found inpreviously published work related to each cohort [12–14].A detailed description on how co-expression modules wereidentified can be found in the recent study that identifiedthe harmonized human co-expression modules as part oftranscriptome wide ADmeta-analysis [9]. Briefly, Wan, et al.performed library normalization and covariate adjustmentsfor each human study separately using fixed/mixed effects
Preuss et al. Molecular Neurodegeneration (2020) 15:67 Page 11 of 16

modeling to account for batch effects. Among the 2978AMP-AD modules identified across all tissues (DOI:https://doi.org/10.7303/syn10309369.1), 660 moduleswere selected by Wan, et al. which showed an enrich-ment for at least one AD-specific differential expressedgene set from the meta-analysis (DOI:https://doi.org/10.7303/syn11914606) in cases compared to controls. Lastly,the edge betweenness graph clustering method was appliedto identify 30 aggregate modules that are not only differen-tially expressed but are also replicated across multiple inde-pendent co-expression module algorithms [9]. Among the30 aggregate co-expression modules, five consensus clus-ters have been described by Wan, et al. [9]. These consen-sus clusters consist of a subset of modules which areassociated with similar AD related changes across the mul-tiple studies and brain regions. Here, we used Reactomepathway (https://reactome.org/) enrichment analysis toidentify specific biological themes across these five consen-sus clusters. A hypergeometric model, implemented in theclusterProfiler R package [28], was used to assess whetherthe number of selected genes associated within each set ofAMP-AD modules defining a consensus cluster was largerthan expected. All p-values were calculated based thehypergeometric model [29]. Pathways were ranked basedon their Bonferroni corrected p-values to account for mul-tiple testing. Finally, consensus clusters were annotatedbased on the highest ranked and non-overlapping term foreach functionally distinct cluster.
Selection of NanoString probes for the nCounter mouseAD panelSince NanoString gene expression panels are comprised of770 probes with the option to customize 30 additionalprobes, we developed a formal prioritization procedure toidentify the most representative genes and ensure broadestcoverage across all modules (Fig. 1). Expression and tran-script annotations for the 30 human co-expression moduleswere obtained via the AMP-AD knowledge portal (www.synapse.org/#!Synapse:syn11870970/tables/). To prioritizeprobe targets for the novel Mouse AD panel, human geneswere ranked within each of the human AMP-AD co-expression modules based on their percentage of variationexplaining the overall module behavior. First, we calculateda gene ranking score by multiplying correlations of tran-scripts with the percentage of variation explained by thefirst five principal components within each of the aggre-gated human AMP-AD modules. Secondly, the sums of theresulting gene scores for the first five principal componentswere calculated and converted to absolute values in orderto rank highly positive or negative correlated transcriptswithin each human co-expression module. As a next step,only human transcripts with corresponding one-to-onemouse orthologous genes that are expressed in whole-braintissue samples from six-month-old B6 mice were retained
for downstream prioritization. While this filter risks exclud-ing very few genes (6/760, < 1%) that may only be expressedat an advanced age, we maintained high representation ofeach human LOAD module. Disease-relevant effects aretherefore robustly captured even if a few specific genes areomitted, as no module was determined to have more thanfive unexpressed genes in six-month-old mice. Further-more, we included information on drug targets for LOADfrom the AMP-AD Agora platform (agora.ampadportal.org), as nominated by members of the AMP-AD consor-tium (https://doi.org/10.7303/syn2580853). A total of 30AMP-AD drug discovery targets that were highly ranked inour gene ranking approach and nominated by multipleAMP-AD groups were included on the panel (Table S3).Finally, ten housekeeping genes (AARS, ASB7, CCDC127,CNOT10, CSNK2A2, FAM104A, LARS, MTO1, SUPT7L,TADA2B) were included on the panel as internal standardreferences for probe normalization. This resulted in a totalof 770 proposed NanoString probes, targeting the top5% of ranked genes for each human AMP-AD expres-sion module.
nCounter mouse AD panel probe designThe probe design process breaks a transcript’s sequencedown into 100 nucleotide (nt) windows to profile forprobe characteristics, with the final goal of choosing theoptimal pair of adjacent probes to profile any giventarget. Each window is profiled for intrinsic sequencemakeup – non-canonical bases, G/C content, invertedand direct repeat regions, runs of poly-nucleotides, aswell as the predicted melting temperature (Tm) for eachpotential probe-to-target interaction. The window isthen divided in half to generate a probe pair, whereineach probe is thermodynamically tuned to determine theoptimal probe length (ranging in size from 35 to 50 nt)within the 100 nt target region. Next, a cross-hybridizationscore is calculated for each probe region, using BLAST [30]to identify potential off-target interactions. In addition to across-hybridization score, a splice isoform coverage scorewas generated to identify transcripts that are isoforms ofthe gene intended to be targeted by the probe in question.Once all of this information is compiled, the final probeis then selected by identifying the candidate with theoptimal splice form coverage, cross-hybridization score,and thermodynamic profile.
In-silico panel QC for intramolecular interactionsTo ensure that there are no potential intramolecularprobe-probe interactions that could cause elevated back-ground for any individual probe pair, a stringent inter-molecular screen is run on every collection of probesassembled into a panel. A sensitive algorithm was usedthat calculates both the Tm and the free energy potentialof interactions between every possible pair of probes in
Preuss et al. Molecular Neurodegeneration (2020) 15:67 Page 12 of 16

the project. If two probes conflict in a way that wouldlikely cause background based on this calculation, analternative probe is selected for one of the targets andthe screening is re-run until there are no known conflicts.
Mouse modelsAll experiments involving mice (Supplemental Table S5)were conducted in accordance with policies and proce-dures described in the Guide for the Care and Use ofLaboratory Animals of the National Institutes of Healthand were approved by the Institutional Animal Care andUse Committee at The Jackson Laboratory. All micewere bred and housed in a 12/12 h light/dark cycle. Allexperiments were performed on a unified genetic back-ground (C57BL/6 J).
Whole-genome sequencingWhole-genome sequencing was performed by Novogenein Bejing, China for three founders of the APOE4 KI/Trem2*R47H strain to exclude potential off-target effectsin loci that were not targeted. Briefly, DNA was extractedfrom spleen and library preparation was performed usingthe KAPA HyperPrep sample preparation kit (KAPA Bio-systems, Wilmington, MA, USA). Libraries were analyzedusing a 2100 Bioanalyzer (Agilent Technologies, SantaClara, CA, USA), with the DNA 2100 kit. Sequencing wasperformed on a HiSeq X sequencer according to the man-ufacturer’s guidelines using 2x150bp paired-end reads.Reads were quality trimmed and filtered using the NGSQC toolkit. The resulting high-quality reads were alignedto the mm10 release of the mouse reference genome usingBWA v0.5.10 [31]. SNPs and indels were called using theGATK tool suite v2.7 [32]. Finally, all variants were anno-tated using the SnpEff software [33]. All variants with apotential deleterious effect (missense, nonsense, splice-site, frame-shift) on the protein level are listed in Table S8for three founders of the APOE4 KI/Trem2*R47H. FigureS5 gives an overview of deleterious variants shared acrossthese three founders. Only three genes of which two areannotated as predicted genes (Gm11168, Gm10717) andone as an olfactory receptor (Vmn2r115) were identifiedthat share private, deleterious variants in our models.Expression levels of these genes in the brain were belowour cut-off criteria of 1 transcript per million reads.
Mouse brain sample collectionUpon arrival at the terminal endpoint for each aged mousecohort, individual animals were weighed prior to intraperi-toneal administration of ketamine (100mg/kg) and xylazine(10mg/kg). First confirming deep anesthetization via toepinch, an incision was made along the midline to exposethe thorax and abdomen followed by removal of the lateralborders of the diaphragm and ribcage revealed the heart. Asmall cut was placed in the right atrium to relieve pressure
from the vascular system before transcardially perfusing theanimal with 1XPBS via injection into the left ventricle. Withthe vascular system cleared, the entire brain was carefullyremoved and weighed before hemisecting along themidsagittal plane. Hemispheres were immediately placed ina cryovial and snap-frozen on dry ice. Brain samples werestored at − 80 °C until RNA extraction was performed.
RNA sample preparationRNA was isolated from tissue using the MagMAXmirVana Total RNA Isolation Kit (ThermoFisher) andthe KingFisher Flex purification system (ThermoFisher,Waltham, MA). Brain hemispheres were thawed to 0 °Cand were lysed and homogenized in TRIzol Reagent(ThermoFisher). After the addition of chloroform, theRNA-containing aqueous layer was removed for RNAisolation according to the manufacturer’s protocol, be-ginning with the RNA bead binding step. RNA concen-tration and quality were assessed using the Nanodrop2000 spectrophotometer (Thermo Scientific) and theRNA Total RNA Nano assay (Agilent Technologies,Santa Clara, CA).
RNAseq library preparation and data collectionSequencing libraries were constructed using TruSeqDNA V2 (Illumina, San Diego, CA) sample prep kits andquantified using qPCR (Kapa Biosystems, Wilmington,MA). The mRNA was fragmented, and double-strandedcDNA was generated by random priming. The ends ofthe fragmented DNA were converted into phosphory-lated blunt ends. An ‘A’ base was added to the 3′ ends.Illumina®-specific adaptors were ligated to the DNAfragments. Using magnetic bead technology, the ligatedfragments were size-selected and then a final PCR wasperformed to enrich the adapter-modified DNA fragments,since only the DNA fragments with adaptors at both endswill amplify. Libraries were pooled and sequenced by theGenome Technologies core facility at The Jackson Labora-tory. Samples were sequenced on Illumina HiSeq 4000using HiSeq 3000/4000 SBS Kit reagents (Illumina), target-ing 30 million read pairs per sample. Samples were splitacross multiple lanes when being run on the IlluminaHiSeq, once the data was received the samples wereconcatenated to have a single file for paired-end analysis.
NanoString gene expression panel and data collectionThe NanoString Mouse AD gene expression panel wasused for gene expression profiling on the nCounterplatform (NanoString, Seattle, WA) as described by themanufacturer. nSolver software was used for analysis ofNanoString gene expression values. Normalized logintensity and raw gene expression data can be accessedvia NCBI GEO (Accession Number: GSE141509).
Preuss et al. Molecular Neurodegeneration (2020) 15:67 Page 13 of 16
Normalization of NanoString dataNormalization was done by dividing counts within a laneby geometric mean of the housekeeping genes from thesame lane. For the downstream analysis, counts werelog-transformed from normalized count values.
Mouse-human expression comparisonFirst, we performed differential gene expression analysisfor each mouse model and sex using the voom-limma[34] package in R. Secondly, we computed correlationbetween changes in expression (log fold change) for eachgene in a given module with each mouse model, sex andage. Correlation coefficients were computed using cor.t-est function built in R as:
cor:test LogFC hð Þ;LogFC mð Þð Þ ð1Þ
where LogFC(h) is the log fold change in transcriptexpression of human AD patients compared to controlpatients and LogFC(m) is the log fold change in expres-sion of mouse transcripts compare to control mousemodels. LogFC values for human transcripts were ob-tained via the AMP-AD knowledge portal (https://www.synapse.org/#!Synapse:syn11180450).
Differential expression, Gene set and pathway enrichmentanalysisDifferential gene expression analysis was performedusing the limma package in the R software environment[34] for all analyzed mouse strains. Each model at eachindividual time point was compared to age-matched B6wild type mice. In order to identify significantly enrichedpathways across mouse models and human brainregions, gene set enrichment analysis was used based onthe method proposed by Subramanian, et. al [35] as im-planted in the clusterProfiler package for the KEGGpathway library. Briefly, human data with expression logfold changes for the seven AMP-AD brain regions weredownloaded from Synapse (https://www.synapse.org/#!Synapse:syn14237651). We filtered to orthologousgenes on the NanoString Mouse AD panel and KEGGpathway enrichment was performed for each brain regionindependently to identify significantly up and down-regulated gene sets. For the mouse data, differential ex-pression analysis between each mouse model and B6controls was performed to obtain a list of fold changeshighlighting genes that are either up or down-regulated inthe presence of the genetic risk variant. Enrichment scoresfor all significantly associated KEGG pathways were com-puted to compare relative expression on the pathway levelbetween post-mortem brain samples and the four mousemodels. Biological pathway enrichment analysis was per-formed using the clusterprofiler [28] package within the Rsoftware envirionment for the Reactome [18] and
WikiPathways (wikipathways.org) knowledge bases. Path-ways were determined to be significant after multiple test-ing correction (FDR adjusted p < 0.05).
Quality control of RNA-Seq data and read alignmentSequence quality of reads was assessed using FastQC(v0.11.3, Babraham). Low-quality bases were trimmedfrom sequencing reads using Trimmomatic (v0.33) [36].After trimming, reads of length longer than 36 baseswere retained. The average quality score at each baseposition was greater than 30 and sequencing depth werein range of 60–120 million reads. All RNA-Seq sampleswere mapped to the mouse genome (mm10 reference,build 38, ENSEMBL) using ultrafast RNA-Seq alignerSTAR [37] (v2.5.3). The genes annotated for mm10(GRCm38) were quantified in two ways: Transcripts permillion (TPM) using RSEM (v1.2.31) and raw readcounts using HTSeq-count (v0.8.0).
Mouse-human co-expression module conservationGenomic information on orthologous groups was obtainedvia the latest ENSEMBL build for human genome versionGRCh38. All orthologous relationships were downloaded viaBioMart [38] (biomart.org). dN/dS statistics were retrievedfor all orthologous gene pairs with a one-to-one relationshipbetween human and mouse. dN/dS values are calculated asthe ratio of nonsynonymous substitutions to the number ofsynonymous substitutions in protein coding genes. The dN/dS values in ENSEMBL were calculated based on the latestversion of the codeml (http://abacus.gene.ucl.ac.uk/software/paml.html) package using standard parameters (ensembl.org/info/genome/compara/homology_method.html) [39].
ConclusionsTaken together, we show that the novel nCounter MouseAD gene expression panel offers a rapid and cost-effectiveapproach to assess disease relevance of novel LOADmouse models. Furthermore, this approach based on geneco-expression signatures offers a high level of reproduci-bility and will supplement methods solely based on differ-ential expression analysis. Ultimately, this will help us tobetter understand the relevance of novel LOAD mousemodels in regard to specific pathways and processes con-tributing to late-onset Alzheimer’s disease.
Supplementary informationSupplementary information accompanies this paper at https://doi.org/10.1186/s13024-020-00412-5.
Additional file 1.
AbbreviationsAD: Alzheimer’s disease; LOAD: Late-onset Alzheimer’s disease; B6: C57BL/6 Jmice; RNA-Seq: RNA sequencing; AMP-AD: Accelerating Medicines
Preuss et al. Molecular Neurodegeneration (2020) 15:67 Page 14 of 16

Partnership for Alzheimer’s Disease; ROSMAP: Religious Orders Study/Memoryand Aging Project; DAM: Disease associated microglia (DAM)
AcknowledgmentsWe thank the many institutions and their staff that provided support for thisstudy and who were involved in this collaboration. We would like toacknowledge Jamie Kuhar for her critically reading of the manuscript.
Authors’ contributionsCP designed the novel transcriptome panel and performed bioinformaticsanalyses. RP, AF, AU, TP performed the gene-expression analyses in humanand mouse brain tissue. EP designed the NanoString probes and guided thecreation of the novel NanoString panel. BAL and LM curated human braindata. DG, GRH and MS performed mouse experiments. GWC and MSsupervised and designed the project. CP, GWC and RP wrote the manuscript.All authors read and approved the final manuscript.
FundingThis study was supported by the National Institutes of Health grant U54 AG054345.
Availability of data and materialsThe results published here are in whole or in part based on data obtainedfrom the AMP-AD Knowledge Portal (doi:https://doi.org/10.7303/syn2580853).ROSMAP Study data were provided by the Rush Alzheimer’s Disease Center,Rush University Medical Center, Chicago. Data collection was supportedthrough funding by NIA grants P30AG10161, R01AG15819, R01AG17917,R01AG30146, R01AG36836, U01AG32984, U01AG46152, the IllinoisDepartment of Public Health, and the Translational Genomics ResearchInstitute. Mayo RNA-Seq Study data were provided by the following sources:The Mayo ClinicAlzheimer’s Disease Genetic Studies, led by Dr. NiluferErtekin-Taner and Dr. Steven G. Younkin, Mayo Clinic, Jacksonville, FL usingsamples from the Mayo Clinic Study of Aging, the Mayo Clinic Alzheimer’sDisease Research Center, and the Mayo Clinic Brain Bank. Data collection wassupported through funding by NIA grants P50 AG016574, R01 AG032990,U01 AG046139, R01 AG018023, U01 AG006576, U01 AG006786, R01AG025711, R01 AG017216, R01 AG003949, NINDS grant R01 NS080820,CurePSP Foundation, and support from Mayo Foundation. Study dataincludes samples collected through the Sun Health Research Institute Brainand Body Donation Program of Sun City, Arizona. The Brain and BodyDonation Program is supported by the National Institute of NeurologicalDisorders and Stroke (U24 NS072026 National Brain and Tissue Resource forParkinson’s Disease and Related Disorders), the National Institute on Aging(P30 AG19610 Arizona Alzheimer’s Disease CoreCenter), the ArizonaDepartment of Health Services (contract 211002, Arizona Alzheimer’sResearch Center), the Arizona Biomedical Research Commission (contracts4001, 0011, 05–901 and 1001 to the Arizona Parkinson’s Disease Consortium)and the Michael J. Fox Foundation for Parkinson’s Research. MSBB data weregenerated from postmortem brain tissue collected through the Mount SinaiVA MedicalCenter Brain Bank and were provided by Dr. Eric Schadt fromMount Sinai School of Medicine. Mouse RNA-Seq data from the MODEL-ADconsortium is available through Synapse via the AMP-AD knowledge portal(www.synapse.org/#!Synapse:syn17095980).
Ethics approvalAll experiments involving mice were conducted in accordance with policiesand procedures described in the Guide for the Care and Use of LaboratoryAnimals of the National Institutes of Health and were approved by theInstitutional Animal Care and Use Committee at The Jackson Laboratory.
Consent for publicationAll authors have approved of the manuscript and agree with its submission.
Competing interestsNot applicable
Author details1The Jackson Laboratory, Bar Harbor, ME 04609, USA. 2NanoStringTechnologies, Seattle, WA 98109, USA. 3Sage Bionetworks, Seattle, WA 98121,USA. 4Stark Neurosciences Research Institute, Indiana University School ofMedicine, Indianapolis, IN 46202, USA.
Received: 5 December 2019 Accepted: 17 October 2020
References1. Mayeux R, Stern Y. Epidemiology of Alzheimer disease. Cold Spring Harb
Perspect Med [Internet]. 2012 Aug 1 [cited 2019 Jan 14];2(8). Available from:http://www.ncbi.nlm.nih.gov/pubmed/22908189.
2. Zhang B, Gaiteri C, Bodea L-G, Wang Z, McElwee J, Podtelezhnikov AA, et al.Integrated systems approach identifies genetic nodes and networks in late-onset Alzheimer’s disease. Cell [Internet]. 2013;153(3):707–20 [cited 2019 Jan14] Available from: http://www.ncbi.nlm.nih.gov/pubmed/23622250.
3. Heuer SE, Neuner SM, Hadad N, O'Connell KMS, Williams RW, Philip VM,Gaiteri C, Kaczorowski CC. Identifying the molecular systems that influencecognitive resilience to Alzheimer's disease in genetically diverse mice. LearnMem. 2020 27(9):355-371. Available from: https://doi.org/10.1101/lm.051839.120.
4. Seyfried NT, Dammer EB, Swarup V, Nandakumar D, Duong DM, Yin L, et al.A multi-network approach identifies protein-specific co-expression inasymptomatic and symptomatic Alzheimer’s disease. Cell Syst [Internet].2017;4(1):60–72 e4. Available from: http://www.ncbi.nlm.nih.gov/pubmed/27989508.
5. Miller JA, Woltjer RL, Goodenbour JM, Horvath S, Geschwind DH. Genes andpathways underlying regional and cell type changes in Alzheimer’s disease.Genome Med [Internet]. 2013;5, 48(5) [cited 2019 Jan 17] Available from:http://www.ncbi.nlm.nih.gov/pubmed/23705665.
6. Milind N, Preuss C, Haber A, Ananda G, Mukherjee S, John C, et al.Transcriptomic stratification of late-onset Alzheimer’s cases reveals novelgenetic modifiers of disease pathology. Barsh GS. PLOS Genet [Internet].2020;16(6):e1008775. [cited 2020 Sep 28] Available from:. https://doi.org/10.1371/journal.pgen.1008775.
7. Matarin M, Salih DA, Yasvoina M, Cummings DM, Guelfi S, Liu W, et al. AGenome-wide Gene-Expression Analysis and Database in Transgenic Miceduring Development of Amyloid or Tau Pathology. Cell Rep [Internet]. 2015Feb 3 [cited 2019 Jan 14];10(4):633–44. Available from: http://www.ncbi.nlm.nih.gov/pubmed/25620700.
8. Onos KD, Sukoff Rizzo SJ, Howell GR, Sasner M. Toward more predictive geneticmouse models of Alzheimer’s disease. Brain Res Bull. 2016;122:1–11 [cited 2019Jan 14] Available from: http://www.ncbi.nlm.nih.gov/pubmed/26708939.
9. Wan Y-W, Al-Ouran R, Mangleburg CG, Perumal TM, Lee TV, Allison K, et al.Meta-Analysis of the Alzheimer's Disease Human Brain Transcriptome andFunctional Dissection in Mouse Models. Cell Rep. 2020;32(2):107908.Available from: https://doi.org/10.1016/j.celrep.2020.107908.
10. Onos KD, Uyar A, Keezer KJ, Jackson HM, Preuss C, Acklin CJ, et al.Enhancing face validity of mouse models of Alzheimer’s disease withnatural genetic variation. Frankel WN, editor. PLOS Genet [Internet]. 2019May 31 [cited 2020 Sep 22];15(5):e1008155. Available from: https://dx.plos.org/10.1371/journal.pgen.1008155.
11. Pandey RS, Graham L, Uyar A, Preuss C, Howell GR, Carter GW. Geneticperturbations of disease risk genes in mice capture transcriptomicsignatures of late-onset Alzheimer’s disease. Mol Neurodegener[Internet]. 2019 Dec 26 [cited 2020 Sep 24];14(1):50. Available from:https://molecularneurodegeneration.biomedcentral.com/articles/10.1186/s13024-019-0351-3.
12. Allen M, Carrasquillo MM, Funk C, Heavner BD, Zou F, Younkin CS, et al.Human whole genome genotype and transcriptome data for Alzheimer’sand other neurodegenerative diseases. Sci Data. 2016 3:160089. Availablefrom: https://doi.org/10.1038/sdata.2016.89.
13. De Jager PL, Ma Y, McCabe C, Xu J, Vardarajan BN, Felsky D, et al. A multi-omic atlas of the human frontal cortex for aging and Alzheimer’s diseaseresearch. Sci Data. 2018;5:180142. Available from: https://doi.org/10.1038/sdata.2018.142.
14. Wang M, Beckmann ND, Roussos P, Wang E, Zhou X, Wang Q, et al. TheMount Sinai cohort of large-scale genomic, transcriptomic and proteomicdata in Alzheimer’s disease. Sci Data. 2018 Sep;5:180185.
15. Oakley H, Cole SL, Logan S, Maus E, Shao P, Craft J, et al. Intraneuronal β-amyloid aggregates, Neurodegeneration, and Neuron loss in transgenicMice with five familial Alzheimer’s disease mutations: potential factors inamyloid plaque formation. J Neurosci [Internet]. 2006;26(40):10129–40Available from: http://www.jneurosci.org/content/26/40/10129.abstract.
16. Landel V, Baranger K, Virard I, Loriod B, Khrestchatisky M, Rivera S, et al.Temporal gene profiling of the 5XFAD transgenic mouse model highlights
Preuss et al. Molecular Neurodegeneration (2020) 15:67 Page 15 of 16
the importance of microglial activation in Alzheimer’s disease. MolNeurodegener [Internet]. 2014 Sep 11 [cited 2020 Sep 22];9(1):33. Availablefrom: /pmc/articles/PMC4237952/?report=abstract.
17. Maiese K. Forkhead transcription factors: new considerations for alzheimer’sdisease and dementia. J Transl Sci [Internet]. 2016 [cited 2020 Sep 22];2(4):241–7. Available from: /pmc/articles/PMC4932907/?report=abstract.
18. Fabregat A, Sidiropoulos K, Garapati P, Gillespie M, Hausmann K, Haw R,et al. The reactome pathway knowledgebase. Nucleic Acids Res. 2016;44(D1):D481–7.
19. Gratuze M, Leyns CE, Sauerbeck AD, St-Pierre MK, Xiong M, Kim N, et al.Impact of TREM2R47H variant on tau pathology-induced gliosis andneurodegeneration. J Clin Invest. 2020;130(9):4954–68. Available from.https://doi.org/10.1172/JCI138179.
20. Chung WS, Verghese PB, Chakraborty C, Joung J, Hyman BT, Ulrich JD, et al.Novel allele-dependent role for APOE in controlling the rate of synapsepruning by astrocytes. Proc Natl Acad Sci U S A [Internet]. 2016 Sep 6 [cited2020 Sep 21];113(36):10186–91. Available from: /pmc/articles/PMC5018780/?report=abstract.
21. Keren-Shaul H, Spinrad A, Weiner A, Matcovitch-Natan O, Dvir-Szternfeld R,Ulland TK, et al. A unique microglia type associated with restrictingdevelopment of Alzheimer’s disease. Cell [Internet]. 2017;169(7):1276–90[cited 2019 Nov 27]e17. Available from: http://www.ncbi.nlm.nih.gov/pubmed/28602351.
22. Geschwind DH, Rakic P. Cortical evolution: judge the brain by its cover.Neuron [Internet]. 2013;80(3):633–47 [cited 2019 Apr 10]Available from:http://www.ncbi.nlm.nih.gov/pubmed/24183016.
23. Bauernfeind AL, Soderblom EJ, Turner ME, Moseley MA, Ely JJ, Hof PR, et al.Evolutionary Divergence of Gene and Protein Expression in the Brains ofHumans and Chimpanzees. Genome Biol Evol [Internet]. 2015;7(8):2276–88[cited 2019 Apr 10] Available from: http://www.ncbi.nlm.nih.gov/pubmed/26163674.
24. Fonseca MI, Zhou J, Botto M, Tenner AJ. Absence of C1q leads to lessneuropathology in transgenic mouse models of Alzheimer’s disease. JNeurosci [Internet]. 2004 Jul 21 [cited 2020 Sep 21];24(29):6457–65. Availablefrom: https://www.jneurosci.org/content/24/29/6457.
25. Hong S, Beja-Glasser VF, Nfonoyim BM, Frouin A, Li S, Ramakrishnan S, et al.Complement and microglia mediate early synapse loss in Alzheimer mousemodels. Science (80- ) [Internet]. 2016 May 6 [cited 2020 Sep 21];352(6286):712–6. Available from: https://pubmed.ncbi.nlm.nih.gov/27033548/.
26. Rijpma A, Jansen D, Arnoldussen IAC, Fang XT, Wiesmann M, Mutsaers MPC,et al. Sex Differences in Presynaptic Density and Neurogenesis in Middle-Aged ApoE4 and ApoE Knockout Mice. J Neurodegener Dis [Internet]. 2013;2013:531326 [cited 2019 Jan 17] Available from: http://www.ncbi.nlm.nih.gov/pubmed/26316992.
27. Siegel JA, Haley GE, Raber J. Apolipoprotein E isoform-dependent effects onanxiety and cognition in female TR mice. Neurobiol Aging [Internet]. 2012;33(2):345–58 [cited 2019 Jan 17] Available from: http://www.ncbi.nlm.nih.gov/pubmed/20400205.
28. Yu G, Wang L-G, Han Y, He Q-Y. clusterProfiler: an R package for comparingbiological themes among gene clusters. OMICS [Internet]. 2012 May [cited2019 Jun 3];16(5):284–7. Available from: http://www.ncbi.nlm.nih.gov/pubmed/22455463.
29. Boyle EI, Weng S, Gollub J, Jin H, Botstein D, Cherry JM, et al. GO::TermFinder--open source software for accessing Gene Ontologyinformation and finding significantly enriched Gene Ontology termsassociated with a list of genes. Bioinformatics [Internet]. 2004 Dec 12 [cited2019 Jun 3];20(18):3710–5. Available from: https://academic.oup.com/bioinformatics/article-lookup/doi/10.1093/bioinformatics/bth456.
30. Altshcul SF, Gish W, Miller W, Myers EW, Lipman DJ. Basic local alignmentsearch tool. J Mol Biol [Internet]. 1990;215(3):403–10 Available from: http://www.ncbi.nlm.nih.gov/pubmed/2231712.
31. Li H, Durbin R. Fast and accurate short read alignment with Burrows-Wheeler transform. Bioinformatics [Internet]. 2009 Jul 15 [cited 2013 Aug 6];25(14):1754–60. Available from: http://www.pubmedcentral.nih.gov/articlerender.fcgi?artid=2705234&tool=pmcentrez&rendertype=abstract.
32. McKenna A, Hanna M, Banks E, Sivachenko A, Cibulskis K, Kernytsky A,et al. The genome analysis toolkit: A MapReduce framework foranalyzing next-generation DNA sequencing data. Genome Res. 2010;20(9):1297–303.
33. Cingolani P, Platts A, Wang LL, Coon M, Nguyen T, Wang L, et al. A programfor annotating and predicting the effects of single nucleotide
polymorphisms, SnpEff. Fly (Austin) [Internet]. 2012;6(2):80–92 Availablefrom: http://www.tandfonline.com/doi/abs/10.4161/fly.19695.
34. Ritchie ME, Phipson B, Wu D, Hu Y, Law CW, Shi W, et al. limma powersdifferential expression analyses for RNA-sequencing and microarray studies.Nucleic Acids Res [Internet]. 2015;43(7):e47 [cited 2019 Aug 21] Availablefrom: http://www.ncbi.nlm.nih.gov/pubmed/25605792.
35. Subramanian A, Tamayo P, Mootha VK, Mukherjee S, Ebert BL, Gillette MA,et al. Gene set enrichment analysis: a knowledge-based approach forinterpreting genome-wide expression profiles. Proc Natl Acad Sci U S A[Internet]. 2005;102(43):15545–50 [cited 2014 Jul 10] Available from: http://www.pnas.org/content/102/43/15545.abstract.
36. Bolger AM, Lohse M, Usadel B. Trimmomatic: a flexible trimmer for Illuminasequence data. Bioinformatics [Internet]. 2014;30(15):2114–20 [cited 2019Jan 17] Available from: http://www.ncbi.nlm.nih.gov/pubmed/24695404.
37. Dobin A, Davis CA, Schlesinger F, Drenkow J, Zaleski C, Jha S, et al. STAR:ultrafast universal RNA-seq aligner. Bioinformatics [Internet]. 2013;29(1):15–21 [cited 2019 Jan 17] Available from: http://www.ncbi.nlm.nih.gov/pubmed/23104886.
38. Durinck S, Moreau Y, Kasprzyk A, Davis S, De Moor B, Brazma A, et al.BioMart and bioconductor: a powerful link between biological databasesand microarray data analysis. Bioinformatics [Internet]. 2005;21(16):3439–40.Available from:. https://doi.org/10.1093/bioinformatics/bti525.
39. Vilella AJ, Severin J, Ureta-Vidal A, Heng L, Durbin R, Birney E.EnsemblCompara GeneTrees: complete, duplication-aware phylogenetictrees in vertebrates. Genome Res [Internet]. 2009;19(2):327–35 Availablefrom: http://www.ncbi.nlm.nih.gov/pubmed/19029536.
Publisher’s NoteSpringer Nature remains neutral with regard to jurisdictional claims inpublished maps and institutional affiliations.
Preuss et al. Molecular Neurodegeneration (2020) 15:67 Page 16 of 16