a novel process for direct production of acetone–butanol–ethanol from native starches using...
TRANSCRIPT
A Novel Process for Direct Productionof Acetone–Butanol–Ethanol from NativeStarches Using Granular Starch Hydrolyzing Enzymeby Clostridium saccharoperbutylacetonicum N1-4
Vu Hong Thang & Genta Kobayashi
Received: 10 July 2013 /Accepted: 30 October 2013 /Published online: 26 November 2013# Springer Science+Business Media New York 2013
Abstract In this work, a new approach for acetone–butanol–ethanol (ABE) production has beenproposed. Direct fermentation of native starches (uncooked process) was investigated by usinggranular starch hydrolyzing enzyme (GSHE) and Clostridium saccharoperbutylacetonicum N1-4. Even the process was carried out under suboptimal condition for activity of GSHE, theproduction of ABE was similar with that observed in conventional process or cooked processin terms of final solvent concentration (21.3±0.4 to 22.4±0.4 g/L), butanol concentration (17.5±0.4 to 17.8±0.3 g/L) and butanol yield (0.33 to 0.37 g/g). The production of solvents wassignificantly dependent on the source of starches. Among investigated starches, corn starch wasmore susceptible to GSHE while cassava starch was the most resistant to this enzyme. Fermen-tation using native corn starch resulted in the solvent productivity of 0.47 g/L h, which was about15 % higher than that achieved in cooked process. On the contrary, uncooked process usingcassava and wheat starch resulted in the solvent productivity of 0.30 and 0.37 g/L h, which wererespectively about 30 % lower than those obtained in cooked process. No contamination wasobserved during all trials even fermentationmedia were prepared without sterilization. During thefermentation using native starches, no formation of foam is observed. This uncooked process doesnot require cooking starchy material; therefore, the thermal energy consumption for solventproduction would remarkably be reduced in comparison with cooked process.
Keywords Granular starch hydrolyzing enzyme . Native starch . Acetone . Butanol . Ethanolfermentation .Clostridium saccharoperbutylacetonicumN1-4 . Uncooked process
Introduction
Almost 30 percent of the world’s total delivered energy is used for transportation and most of itis liquid fuels [1]. Until now, the production of liquid fuel is fully dependent on the running outfossil fuel resources. Therefore, finding alternative fuels for transportation is the most
Appl Biochem Biotechnol (2014) 172:1818–1831DOI 10.1007/s12010-013-0620-5
V. H. Thang : G. Kobayashi (*)Laboratory of Applied Microbiology, Department of Applied Biochemistry and Food Science, Faculty ofAgriculture, Saga University, Honjo-cho 1, Saga 840-8502, Japane-mail: [email protected]
important issue in future trends. Currently, liquid fuels derived from biomass have beenforeseen as the only alternative to the petroleum products. Although bioethanol at this timedominates the biofuels market, it has some limitations as a primary transportation fuel [2]. Inaddition, butanol has many advantages over ethanol for use as biofuel such as better blendingability, better compatibility to combustion engines, less volatile, less hygroscopic and moreenergy density that is closer to gasoline [3].
Butanol has superior properties that make it a promising candidate for next generationbiofuels. Butanol can be synthesized via petrochemical and biological processes. Unfortunate-ly, butanol production via fermentation is still economically unfavorable due to the relativelyhigh production cost. High energy consumption is one of the main drawbacks for economicproduction of butanol. The ABE fermentation has once been the second largest fermentationindustry in the world [4] but became no longer economical and came to a decline in the 1960s[5] due to the cheaper production of butanol and acetone via petrochemical processes.However, ABE fermentation has recently regained many interests due to the environmentalconcerns and the running out of fossil oil. In order to make butanol fuel economically viable,significant technical advances in various fields are needed to lower the production cost to alevel that competes economically with gasoline. Reduction of energy consumption would be arealistic way to make the process economically feasible.
Conventionally, ABE fermentation was done by using fermentable carbohydrates in cookedmashes derived from grains. Unlike ethanol fermentation by yeast, the solventogenic Clos-tridia can utilize directly gelatinized starches to produce solvents without prior enzymaticpretreatments of starches since they have amylolytic enzymes [6]. However, the starchysubstrates must be well cooked at high pressure since these enzymes cannot digest nativestarches. Conventional biotechnological production of ABE from starchy materials requirespretreatment by gelatinization of materials, which was usually cooked at 130 to 133 °C for 60to 90 min [4, 7]. Thus, cooking starch slurries has resulted in a remarkable cost in the totalproduction cost. Wu et al. [8] calculated the thermal energy consumption in biobutanol plantbased on corn and reported that the energy requirement for cooking step is about 15 % of thetotal thermal energy consumption.
Recently, novel enzyme systems (GSHE) have been developed that are capable ofconverting granular starch to fermentable sugars at acidic media (pH 3.8 to 4.3) and attemperature below 48 °C in simultaneous saccharification fermentation of ethanol. UsingGSHE does not require high temperatures for cooking and liquefaction. Therefore, the GSHEpotentially reduces energy requirements and improves the net energy consumption [9].Robertson et al. [10] estimated the reduction in energy consumption achieved by using GSHEin ethanol production is from 10 to 20 %. Moreover, glucose concentration in the medium isalways kept at very low level during fermentation because the glucose produced is utilizedimmediately by yeast. Since this process was conducted at low pH, this technology reducessignificantly the risks of contamination during fermentation.
The successful demonstration in ethanol production has inspired us to establish a similarconcept for ABE production. However, while in ethanol fermentation the working pH (3.8 to4.3) is optimum for both activity of enzyme and yeast growth, while in ABE fermentationClostridia growth and produce solvents at the pH above 4.5 [11]. In industry, the initial pH ofthe fermentation medium is about 6.0. During the initial phase of the fermentation the pHdecreased to about 5.2 at the breakpoint, after which it increased, reaching about 5.8 at the endof the fermentation [4]. However, this pH value may not be suitable for GSHE activity. TheGSHE has maximal activity at pH 4.2 and at pH 6.0 its activity decreases to 5 % [12]. Thus,the idea of producing solvents in ABE fermentation from native starches using GSHE isquestionable.
Appl Biochem Biotechnol (2014) 172:1818–1831 1819

To our best knowledge, it is the first time this kind of investigation has been conducted forABE fermentation. A combined process of converting native starch to glucose with GSHE andglucose to solvent by Clostridia would be expected to decrease the capital and operating costs.In this work, ABE fermentation using native starches (uncooked process) was investigated.Fermentation performance was compared between uncooked process and cooked process.
Materials and Methods
Bacterial Strain
C. saccharoperbutylacetonicum N1-4 (ATCC 13564) was used in this study. The culture wasmaintained in the form of spores in fresh potato–glucose medium (PG medium) at 4 °C. Toprepare the seed culture, 1 mL of spore suspension was aseptically transferred into 9 mL of PGmedium. Then, this mixture was subjected to heat shock by placing it in boiling water for1 min and was subsequently cultivated at 30 °C for 24 h.
Starches
Cassava starch was kindly supplied by a local factory in Vietnam. Corn and wheat starch werepurchased from Wako Pure Chemicals Ltd., Japan.
Granular Starch Hydrolyzing Enzyme (GSHE)
GSHE (Stargen 001) was a gift from Genencor International (Palo Alto, CA). The enzymecontained α-amylase from A. kawachi and glucoamylase from A. niger and had an activity of≥456 GSHU/g (GSHU; granular starch hydrolyzing units). Glucoamylase (Gluczyme) and α-amylase (Kleistase T10S) were kindly supplied by Amano Enzyme Inc. (Nagoya, Japan).
Preparation of Medium
The fresh potato medium (PG medium) contained the following substances per liter of distilledwater [13]: 150 g grated fresh potato, 10 g glucose, 0.5 g (NH4)2SO4 and 3 g CaCO3. Aftermixing the above substances, the medium was incubated in boiling water for 1 h with mixingevery 10 min. After that, the medium was filtered through gauze and sterilized at 121 °C for1 h.
Tryptone–yeast extract–acetate medium (TYA medium) was used for the pre-culture [14].The medium per liter of distilled water consisted of 20 g glucose, 2 g yeast extract (DifcoLaboratories, Detroit, MI, USA), 6 g tryptone (Difco Laboratories), 3 g CH3COONH4, 0.3 gMgSO4⋅7H2O, 0.5 g KH2PO4 and 10 mg FeSO4⋅7H2O. The medium was sterilized at 115 °Cfor 15 min.
Procedure for ABE Fermentation Using Native Starches
Batch fermentation was performed in 1 L stirred tank fermenter with a working volume of0.45 L. The empty fermenter was autoclaved before starting the fermentation. Uncooked starch(native starch) was mixed with tap water to obtain slurry with final concentration of 65 g/L onthe basis of starch. The pH was adjusted to 4.2 using 5 M sulfuric acid solution. One hundredmicroliter GSHE (Stargen 001) was added. Slurry temperature was increased to 45 °C for the
1820 Appl Biochem Biotechnol (2014) 172:1818–1831
incubation and maintained for 1 h at 120 rpm. After incubation, the slurry was cooled down to30 °C. A 10-fold concentrated solution containing yeast extract (20 g/L), tryptone (60 g/L),ammonium acetate (30 g/L), MgSO4⋅7H2O (3 g/L), KH2PO4 (5 g/L) and FeSO4⋅7H2O(100 mg/L) was added directly without sterilization to the starch slurry.
ABE fermentation of native starches was initiated by inoculating a 10 % (v/v) activelygrowing cell suspension, which was 16 h of vegetative culture grown in the test tubes. Theinitial pH was adjusted to 4.5. After inoculation, nitrogen gas was sparged and then terminatedas soon as the cells started to produce the fermentation gases.
Analytical Procedures
ABE and organic acids (acetic and butyric) were measured using a gas chromatography(7890A GC-System, Agilent Technologies, Palo Alto, CA, USA) equipped with a flameionization detector and a 15 m capillary column (Innowax; i.d. 0.53 mm; 19095N-121; AgilentTechnologies). The oven temperature was programmed to increase from 50 to 170 °C at therate of 10 °C/min. The injector and detector temperatures were set at 250 °C. Helium was usedas the carrier gas and was set at a flow rate of 3.7 mL/min.
Maltose and glucose concentration in the fermentation broth was determined by using ahigh-performance liquid chromatography (HPLC) (LaChrom Elite, Hitachi High Technolo-gies, USA) equipped with a SUGAR SH 1011 column (Shodex, Tokyo, Japan). A 3-mMHClO4 was used as the mobile phase at flow rate of 1.0 mL/min and 50 °C.
Starch concentration of the samples was determined using a modified method of Holm et al.[15]. A portion of 20 μL Kleistase T10S was added to 1 mL of culture medium and thenincubated at 90 °C for 3 h to hydrolyze starch in the medium to soluble dextrin. Afterthat, 8,880 μL of 0.1 M acetate buffer pH 4.5 and 100 μL of Gluczyme were addedto the solution and then incubated at 58 °C for 4 h. The solution was allowed to cooldown until at room temperature and then transferred to a 10-mL volumetric flask followed byfilling it with distilled water to the volume. Glucose concentration of this solution wasdetermined using HPLC method. Starch concentration in fermentation broth was calculatedas follows:
S ¼ G� 10a � 10b
where S is starch concentration (g/L), G is glucose concentration (g/L), and a and b are,respectively, the dilution factor and correction factor for glucose to starch.
Results and Discussions
Production of ABE from Native Cassava Starch Versus from Cooked Cassava Starch
Production of ABE from cooked cassava starch by C. saccharoperbutylacetonicum N1-4 wasreported previously [16]. It was a typical ABE production where fermentation could be dividedinto two phases, the acidogenic phase and the solventogenic phase. It can be seen in Fig. 1athat the acidogenic phase has lasted about 12 h in which the decreasing pH of medium from6.2 to 5.3 was observed. In this time period butyric acid was produced vigorously up to amaximum concentration of 1.6 g/L. In this period, foam was formed vigorously and reachedthe top of the fermenter. After reaching the lowest point (5.3), pH increased gradually to 5.8and the fermentation has entered the solventogenic phase. In this phase, the metabolism of
Appl Biochem Biotechnol (2014) 172:1818–1831 1821

cells undergoes a shift to produce solvent by reassimilation of organic acid. During thissolventogenic phase, acetic and butyric acid were consumed quickly and at the end offermentation, their concentration was around 0.4 to 0.5 g/L for each. Fermentation wasactually finished at 48 h, when the concentration of the solvent as well as butanol reachedmaximum. At this moment, concentration of starch was 14.1±0.9 g/L while glucose andmaltose residues were 1.3±0.2 and 0.9±0.1 g/L, respectively. After 48 h of fermentation, thestrain produced 20.5±0.3 g/L total solvent including 16.2±0.4 g/L butanol, 3.5±0.3 g/Lacetone and 0.8±0.2 g/L ethanol, which resulted in a solvent productivity of 0.43 g/L h. Asolvent yield of 0.38 g/g and a butanol yield of 0.30 g/g, based on the basis of potential glucosepresent in the medium, were observed.
4
5
6
7
0
20
40
60
0 20 40 60 80
pH
Sta
rch
and
tota
l AB
E, g
/L
Time, h
Total ABE Starch pH
A B
4
5
6
7
0
20
40
60
0 20 40 60 80 100
pH
Sta
rch
and
tota
l AB
E, g
/L
Time, h
Total ABE Starch pH
0
2
4
6
8
10
0
1
2
3
0 20 40 60 80
Sug
ars,
g/L
Org
anic
aci
ds, g
/L
Time, h
Acetic acid Butyric acid
Maltose Glucose
0
5
10
15
20
0 20 40 60 80 100
Sol
vent
s, g
/L
Time, h
Butanol Acetone Ethanol
0
5
10
15
20
0 20 40 60 80
Sol
vent
s, g
/L
Time, h
Butanol Acetone Ethanol
0
2
4
6
8
10
0
1
2
3
0 20 40 60 80 100
Sug
ars,
g/L
Org
anic
aci
ds,
g/L
Time, h
Maltose Acetic acid
Butyric acid Glucose
Fig. 1 ABE production using cooked cassava starch (a) and native cassava starch (b)
1822 Appl Biochem Biotechnol (2014) 172:1818–1831
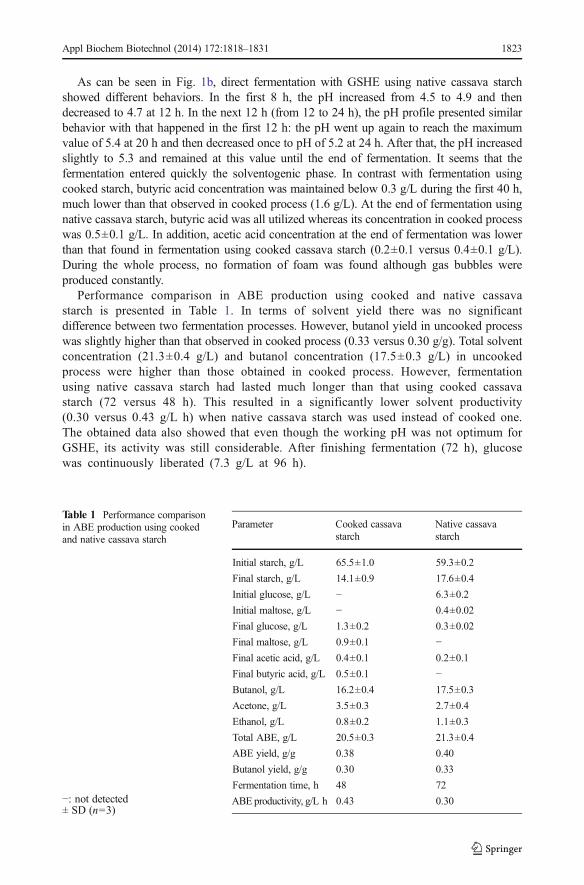
As can be seen in Fig. 1b, direct fermentation with GSHE using native cassava starchshowed different behaviors. In the first 8 h, the pH increased from 4.5 to 4.9 and thendecreased to 4.7 at 12 h. In the next 12 h (from 12 to 24 h), the pH profile presented similarbehavior with that happened in the first 12 h: the pH went up again to reach the maximumvalue of 5.4 at 20 h and then decreased once to pH of 5.2 at 24 h. After that, the pH increasedslightly to 5.3 and remained at this value until the end of fermentation. It seems that thefermentation entered quickly the solventogenic phase. In contrast with fermentation usingcooked starch, butyric acid concentration was maintained below 0.3 g/L during the first 40 h,much lower than that observed in cooked process (1.6 g/L). At the end of fermentation usingnative cassava starch, butyric acid was all utilized whereas its concentration in cooked processwas 0.5±0.1 g/L. In addition, acetic acid concentration at the end of fermentation was lowerthan that found in fermentation using cooked cassava starch (0.2±0.1 versus 0.4±0.1 g/L).During the whole process, no formation of foam was found although gas bubbles wereproduced constantly.
Performance comparison in ABE production using cooked and native cassavastarch is presented in Table 1. In terms of solvent yield there was no significantdifference between two fermentation processes. However, butanol yield in uncooked processwas slightly higher than that observed in cooked process (0.33 versus 0.30 g/g). Total solventconcentration (21.3±0.4 g/L) and butanol concentration (17.5±0.3 g/L) in uncookedprocess were higher than those obtained in cooked process. However, fermentationusing native cassava starch had lasted much longer than that using cooked cassavastarch (72 versus 48 h). This resulted in a significantly lower solvent productivity(0.30 versus 0.43 g/L h) when native cassava starch was used instead of cooked one.The obtained data also showed that even though the working pH was not optimum forGSHE, its activity was still considerable. After finishing fermentation (72 h), glucosewas continuously liberated (7.3 g/L at 96 h).
Table 1 Performance comparisonin ABE production using cookedand native cassava starch
−: not detected± SD (n=3)
Parameter Cooked cassavastarch
Native cassavastarch
Initial starch, g/L 65.5±1.0 59.3±0.2
Final starch, g/L 14.1±0.9 17.6±0.4
Initial glucose, g/L − 6.3±0.2
Initial maltose, g/L − 0.4±0.02
Final glucose, g/L 1.3±0.2 0.3±0.02
Final maltose, g/L 0.9±0.1 −Final acetic acid, g/L 0.4±0.1 0.2±0.1
Final butyric acid, g/L 0.5±0.1 −Butanol, g/L 16.2±0.4 17.5±0.3
Acetone, g/L 3.5±0.3 2.7±0.4
Ethanol, g/L 0.8±0.2 1.1±0.3
Total ABE, g/L 20.5±0.3 21.3±0.4
ABE yield, g/g 0.38 0.40
Butanol yield, g/g 0.30 0.33
Fermentation time, h 48 72
ABE productivity, g/L h 0.43 0.30
Appl Biochem Biotechnol (2014) 172:1818–1831 1823

Production of ABE from Native Corn Starch Versus from Cooked Corn Starch
As can be seen in Fig. 2a, production of ABE from cooked corn starch by C.saccharoperbutylacetonicumN1-4 has similar tendency like that observed in fermentation usingcooked cassava starch. The acidogenic phase was about 8 h, where pH decreased from 6.5 to 5.2.In this time period butyric acid was produced vigorously up to maximum concentration of2.1 g/L and foam was formed vigorously. The fermentation entered solventogenic phase withgradually increasing of pH up to 6.0. At the end of fermentation, acetic and butyric concentration
4
5
6
7
0
20
40
60
0 20 40 60 80
pH
Sta
rch
and
tota
l AB
E, g
/L
Time, h
Total ABE Starch pH
BA
0
20
40
60
0 20 40 60 80
Time, h
Sta
rch
and
tota
l AB
E, g
/L
4
5
6
7
pH
Total ABE Starch pH
0
5
10
15
20
0 20 40 60 80
Time, h
Sol
vent
s, g
/L
Butanol Acetone Ethanol
0
5
10
15
20
0 20 40 60 80
Time, h
Sol
vent
s, g
/L
Acetone Butanol Ethanol
0
1
2
3
0 20 40 60 80
Time, h
Org
anic
aci
ds, g
/L
0
2
4
6
8
10
Sug
ars,
g/L
Maltose Acetic acid
Butyric acid Glucose
0
1
2
3
0 20 40 60 80
Time, h
Org
anic
aci
ds, g
/L
0
2
4
6
8
10
Sug
ars,
g/L
Acetic acid Butyric acid
Maltose Glucose
Fig. 2 ABE production using cooked corn starch (a) and native corn starch (b)
1824 Appl Biochem Biotechnol (2014) 172:1818–1831
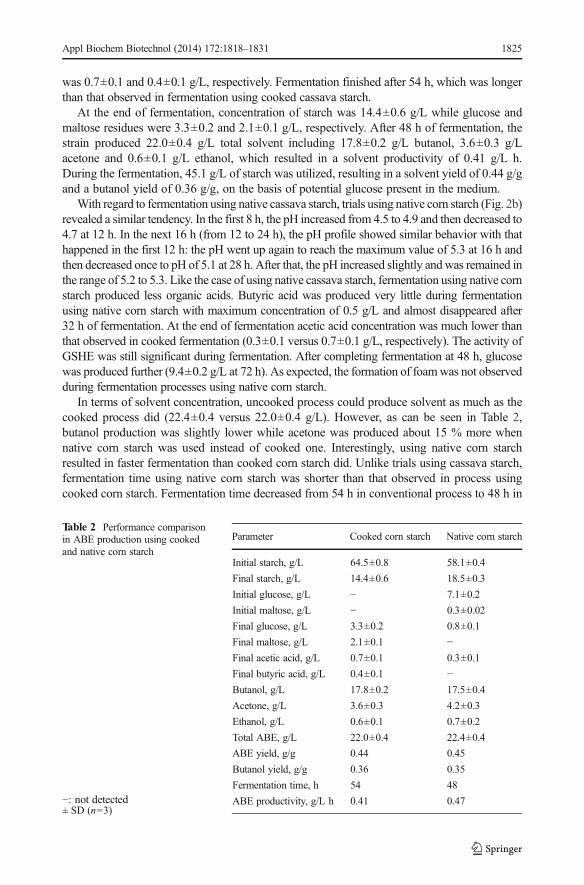
was 0.7±0.1 and 0.4±0.1 g/L, respectively. Fermentation finished after 54 h, which was longerthan that observed in fermentation using cooked cassava starch.
At the end of fermentation, concentration of starch was 14.4±0.6 g/L while glucose andmaltose residues were 3.3±0.2 and 2.1±0.1 g/L, respectively. After 48 h of fermentation, thestrain produced 22.0±0.4 g/L total solvent including 17.8±0.2 g/L butanol, 3.6±0.3 g/Lacetone and 0.6±0.1 g/L ethanol, which resulted in a solvent productivity of 0.41 g/L h.During the fermentation, 45.1 g/L of starch was utilized, resulting in a solvent yield of 0.44 g/gand a butanol yield of 0.36 g/g, on the basis of potential glucose present in the medium.
With regard to fermentation using native cassava starch, trials using native corn starch (Fig. 2b)revealed a similar tendency. In the first 8 h, the pH increased from 4.5 to 4.9 and then decreased to4.7 at 12 h. In the next 16 h (from 12 to 24 h), the pH profile showed similar behavior with thathappened in the first 12 h: the pH went up again to reach the maximum value of 5.3 at 16 h andthen decreased once to pH of 5.1 at 28 h. After that, the pH increased slightly andwas remained inthe range of 5.2 to 5.3. Like the case of using native cassava starch, fermentation using native cornstarch produced less organic acids. Butyric acid was produced very little during fermentationusing native corn starch with maximum concentration of 0.5 g/L and almost disappeared after32 h of fermentation. At the end of fermentation acetic acid concentration was much lower thanthat observed in cooked fermentation (0.3±0.1 versus 0.7±0.1 g/L, respectively). The activity ofGSHE was still significant during fermentation. After completing fermentation at 48 h, glucosewas produced further (9.4±0.2 g/L at 72 h). As expected, the formation of foamwas not observedduring fermentation processes using native corn starch.
In terms of solvent concentration, uncooked process could produce solvent as much as thecooked process did (22.4±0.4 versus 22.0±0.4 g/L). However, as can be seen in Table 2,butanol production was slightly lower while acetone was produced about 15 % more whennative corn starch was used instead of cooked one. Interestingly, using native corn starchresulted in faster fermentation than cooked corn starch did. Unlike trials using cassava starch,fermentation time using native corn starch was shorter than that observed in process usingcooked corn starch. Fermentation time decreased from 54 h in conventional process to 48 h in
Table 2 Performance comparisonin ABE production using cookedand native corn starch
−: not detected± SD (n=3)
Parameter Cooked corn starch Native corn starch
Initial starch, g/L 64.5±0.8 58.1±0.4
Final starch, g/L 14.4±0.6 18.5±0.3
Initial glucose, g/L − 7.1±0.2
Initial maltose, g/L − 0.3±0.02
Final glucose, g/L 3.3±0.2 0.8±0.1
Final maltose, g/L 2.1±0.1 −Final acetic acid, g/L 0.7±0.1 0.3±0.1
Final butyric acid, g/L 0.4±0.1 −Butanol, g/L 17.8±0.2 17.5±0.4
Acetone, g/L 3.6±0.3 4.2±0.3
Ethanol, g/L 0.6±0.1 0.7±0.2
Total ABE, g/L 22.0±0.4 22.4±0.4
ABE yield, g/g 0.44 0.45
Butanol yield, g/g 0.36 0.35
Fermentation time, h 54 48
ABE productivity, g/L h 0.41 0.47
Appl Biochem Biotechnol (2014) 172:1818–1831 1825

uncooked process. This resulted in an improvement of 15 % in the solvent productivity (0.47versus 0.41 g/L h).
Production of ABE from Native Wheat Starch Versus from Cooked Wheat Starch
Figure 3 shows fermentation profiles using native and cooked wheat starch. In fermentationusing native wheat starch, pH increased faster than that did in fermentations using nativecassava and corn starch. Instead of 8 h, pH increased from 4.5 to 4.8 after 4 h of fermentationbefore decreasing once to 4.6 after 8 h. In the next 8 h (from 12 to 20 h), the pH profile
0
20
40
60
0 20 40 60 80
Time, h
Sta
rch
and
tota
l AB
E, g
/L
4
5
6
7
pH
Total ABE Starch pH
0
5
10
15
20
0 20 40 60 80
Time, h
Sol
vent
s, g
/L
Butanol Acetone Ethanol
0
20
40
60
0 20 40 60 80
Time, h
Sta
rch
and
tota
l AB
E, g
/L
4
5
6
7
pH
Total ABE Starch pH
A B
0
5
10
15
20
0 20 40 60 80
Time, h
Sol
vent
s, g
/L
Butanol Acetone Ethanol
0
1
2
3
0 20 40 60 80
Time, h
Org
anic
aci
ds, g
/L
0
2
4
6
8
10
Sug
ars,
g/L
Maltose Acetic acid
Butyric acid Glucose
0
1
2
3
0 20 40 60 80
Time, h
Org
anic
aci
ds, g
/L
0
2
4
6
8
10
Sug
ars,
g/L
Acetic acid Butyric acid
Glucose Maltose
Fig. 3 ABE production in using cooked wheat starch (a) and native wheat starch (b)
1826 Appl Biochem Biotechnol (2014) 172:1818–1831

presented similar tendency with those in the fermentation using native cassava and corn starch:the pH went up again to reach the maximum value of 5.5 at 20 h and then decreased once topH of 5.0 at 28. After that, the pH increased gradually to 5.3 and remained at this value untilthe end of fermentation. In uncooked process, butyric acid was remained at low concentrationduring fermentation (maximal concentration of 0.7 g/L versus maximal concentration of1.4 g/L in cooked process). At the end of fermentation, total organic acids (acetic and butyricacids) were much lower than that found in conventional process (0.8±0.1 versus 1.5±0.2 g/L).
Performance comparison in ABE production using cooked and native wheat starch ispresented in Table 3. Regarding solvent production, maximal solvent concentration andbutanol concentration were similar in both processes. However, due to longer fermentationtime, uncooked process resulted in much lower solvent productivity (0.37 g/L h) in compar-ison with that of 0.53 g/L h in cooked process.
Interestingly, unlike trials using cassava starch and corn starch, fermentation time usingcooked wheat starch was quite fast (42 h). It should be noted that fermentation using glucose assubstrate completes after 36 h [16]. However, fermentation using native wheat starch resultedin unexpectedly a longer fermentation time in comparison with that in fermentation usingnative corn starch.
Similarly to trials using cassava and corn starches, no formation of foam was observed infermentation using native wheat starch while foam was formed vigorously in the first 16 h offermentation using cooked wheat starch.
Comparison of ABE Fermentation Using Different Native Starches
It has been reported in the previous worked that the nature of starchy materials affectedconventional ABE fermentation [16]. While fermentation using cooked wheat starch wasfinished at 42 h, fermentation using cooked corn and cassava starch was terminated at 54 and72 h, respectively. The obtained result showed that among investigated starches, cooked wheatstarch was the most susceptible to the amylolytic enzymes of C. saccharoperbutylacetonicum.
Table 3 Performance comparisonin ABE production using cookedand native wheat starch
−: not detected± SD (n=3)
Parameter Cooked wheat starch Native wheat starch
Initial starch, g/L 63.5±0.9 56.5±0.4
Final starch, g/L 13.3±0.8 16.3±0.3
Initial glucose, g/L − 8.2±0.2
Initial maltose, g/L − 0.3±0.05
Final glucose, g/L 2.5±0.1 4.2±0.1
Final maltose, g/L 1.9±0.1 −Final acetic acid, g/L 0.6±0.1 0.5±0.1
Final butyric acid, g/L 0.9±0.2 0.3±0.1
Butanol, g/L 17.9±0.3 17.8±0.3
Acetone, g/L 3.7±0.4 3.3±0.4
Ethanol, g/L 0.5±0.1 0.9±0.2
Total ABE, g/L 22.1±0.4 22.0±0.4
ABE yield, g/g 0.44 0.45
Butanol yield, g/g 0.35 0.37
Fermentation time, h 42 60
ABE productivity, g/L h 0.53 0.37
Appl Biochem Biotechnol (2014) 172:1818–1831 1827
It has been reported that high amylose content is associated with reduced digestibility whilegelatinization will increase susceptibility for starch. In addition, fat and protein may act asphysical barriers to digestion [17]. Normal wheat starch has amylose content in the range of 25to 34 %, slightly higher than that of 25 % in corn starch [18], while cassava starch has relativelylower amylose content, which is in the range of 16 to 24 % [19, 20].
The intermediate accumulation of butyric and acetic acids in uncooked process was verylow, compared with those in cooked process. This result was similar to that reported previ-ously, where batch cultures of C. saccharoperbutylacetonicum in glucose-based media stan-dard media were carried out at different pH [21]. In the first 12–16 h, microorganism utilizedmainly existing glucose, which was liberated during the pretreatment of starches. Glucoseconcentration was approximately from 6.3 to 8.2 g/L when fermentation started. Glucoseconcentration decreased quickly to null after 16 h and was kept at this level until the end offermentation. After that, glucose concentration increased gradually since solvent concentrationreached the inhibition level for bacteria. It was possibly that in these trials, glucose productionrate produced by GSHE still not corresponded to glucose consumption rate of C.saccharoperbutylacetonicum N1-4. An optimization for using GSHE is necessary for the nextstep. Conversely, in cooked process glucose and maltose concentration increased continuouslywith an increase of solvent concentration during the whole fermentation. This showed thatglucose production rate produced by amylolytic enzymes of C. saccharoperbutylacetonicumexceeded their glucose consumption rate.
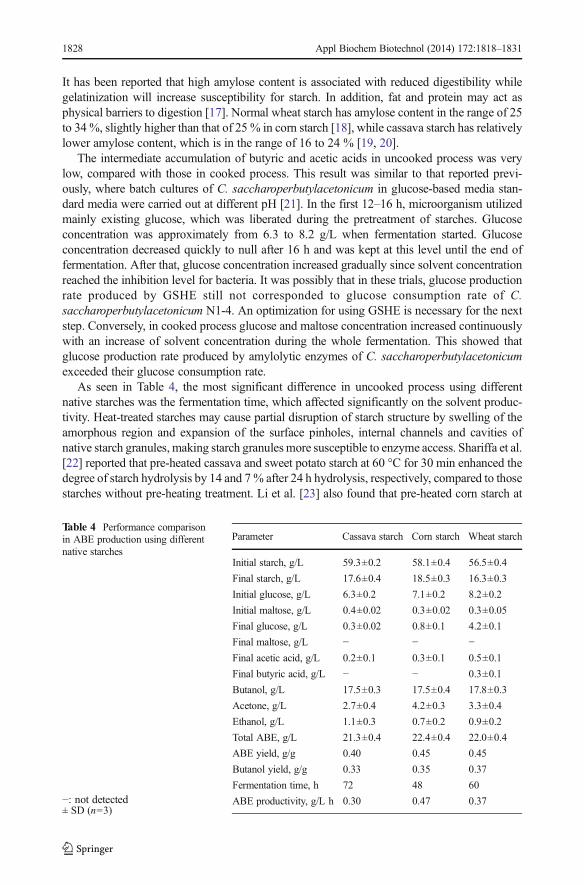
As seen in Table 4, the most significant difference in uncooked process using differentnative starches was the fermentation time, which affected significantly on the solvent produc-tivity. Heat-treated starches may cause partial disruption of starch structure by swelling of theamorphous region and expansion of the surface pinholes, internal channels and cavities ofnative starch granules, making starch granulesmore susceptible to enzyme access. Shariffa et al.[22] reported that pre-heated cassava and sweet potato starch at 60 °C for 30 min enhanced thedegree of starch hydrolysis by 14 and 7% after 24 h hydrolysis, respectively, compared to thosestarches without pre-heating treatment. Li et al. [23] also found that pre-heated corn starch at
Table 4 Performance comparisonin ABE production using differentnative starches
−: not detected± SD (n=3)
Parameter Cassava starch Corn starch Wheat starch
Initial starch, g/L 59.3±0.2 58.1±0.4 56.5±0.4
Final starch, g/L 17.6±0.4 18.5±0.3 16.3±0.3
Initial glucose, g/L 6.3±0.2 7.1±0.2 8.2±0.2
Initial maltose, g/L 0.4±0.02 0.3±0.02 0.3±0.05
Final glucose, g/L 0.3±0.02 0.8±0.1 4.2±0.1
Final maltose, g/L − − −Final acetic acid, g/L 0.2±0.1 0.3±0.1 0.5±0.1
Final butyric acid, g/L − − 0.3±0.1
Butanol, g/L 17.5±0.3 17.5±0.4 17.8±0.3
Acetone, g/L 2.7±0.4 4.2±0.3 3.3±0.4
Ethanol, g/L 1.1±0.3 0.7±0.2 0.9±0.2
Total ABE, g/L 21.3±0.4 22.4±0.4 22.0±0.4
ABE yield, g/g 0.40 0.45 0.45
Butanol yield, g/g 0.33 0.35 0.37
Fermentation time, h 72 48 60
ABE productivity, g/L h 0.30 0.47 0.37
1828 Appl Biochem Biotechnol (2014) 172:1818–1831

61 °C for 30 min resulted in an increase of degree of starch hydrolysis by 9 % after 8 hhydrolysis, compared to corn starch without pre-heating treatment.
The obtained results showed that among investigated starches, native corn starch was themost susceptible by GSHE, while native cassava starch was the most resistant to this enzyme.This result was consistent with the findings in previous studies, where it has been reported thatraw cereal starches are more completely and rapidly hydrolyzed than those from tubers or rootswhen digested by single, purified enzymes [24–26]. Obviously, the difference in physico-chemical properties of starches may cause this phenomenon. Corn and wheat starches have anaverage granule size in the range 9 to 10 μm [27], while the average granule size of cassavastarch is from 13 to 15 μm [28, 29]. The smaller granule sizes improve the digestibility byenzymes because smaller granules have a greater surface area and are more rapidly digested byamylases. However, the efficient conversion of native starch into sugars using GSHE primarilydepends on starch composition, morphology, and molecular and granular structural featureswhich have been shown to influence the rate and extent of amylolysis [30]. The influence ofstructure and physicochemical properties of starches such as granule size, granule ultrastruc-ture, amylose/amylopectin ratio, granule porosity and amylose-lipid complex on in vitrohydrolysis has been reported previously [24, 27, 28, 31–35].
During the fermentation using native starches, no formation of foam was observed,although gas bubbles were produced mildly. This phenomenon could be explained by lowviscosity of fermentation broth. Foam is a thermodynamically unstable system comprised bygas bubbles trapped by a liquid film. They are formed when gas bubbles are dispersed in aliquid phase [36]. The foam stability is strongly affected by the viscosity of the solution [37].The higher the viscosity of the solution, the more stability of foams, since gas bubbles in thesolution were limited in their movement and therefore the drainage of liquid from the filmthrough the Plateau borders becomes more difficulty, making the foam thicker and more stable[36]. In uncooked process, particles of native starches did not cause an increase of viscosity offermentation broth. On the contrary, the viscosity of cooked starch solution was high,especially at the beginning of fermentation. This resulted in a significant accumulation offoam during the first 24 h of fermentation, when the concentration of gelatinized starch wasstill high. The viscosity of fermentation broth decreased with a decrease in concentration ofgelatinized starch and the foam practically disappeared at the end of fermentation.
It should be mentioned in this work that the working volume of fermenter in cooked processwas only 40 % (antifoam was not used). Obviously, the more foam formation, the greater the riskfor contamination becomes. The obtained data show clearly that working volume of fermentercould be increased remarkably in uncooked process. In addition, no contamination was observed.
Surprisingly, two breakpoints were observed in uncooked process. First, pH increased from4.5 to 4.8 and then went down to the first breakpoint (pH 4.6). After that, pH increased again to5.3–5.5 before going down to the second breakpoint 5.1–5.2. At the end of fermentation, pHwas maintained at 5.2–5.3. It should be noted that in conventional ABE fermentation there isonly one breakpoint (pH from 5.2 to 5.5) in pH profile.
It has been reported that good solvent production of industrial strains can be obtainedwithin the pH range of 5.0 to 6.5 and when the pH decreases 4.5 or below, growth andmetabolism of the cells were inhibited and no solvents were produced [2, 38]. However, theobtained results in this work showed that the solvent production was not affected negatively incomparison with conventional process. In this work, C. saccharoperbutylacetonicum producessolvents in a quite broad range of pH (from 4.5 to 5.5). This observation was consistent withthe findings, where it has been reported that C. saccharoperbutylacetonicum has a broader pH(from 4.5 to 5.5) for effective solvent production. The maximum butanol yield was observed5.5, but at pH 4.5 this yield was still 93 % of the maximum butanol yield [21].
Appl Biochem Biotechnol (2014) 172:1818–1831 1829

Conclusions
The obtained results demonstrated the feasibility of producing of solvents from native starches.The obtained results in this work showed obviously that the cooking step can be ignored andconsequently, a significant amount of thermal energy consumption can be saved. The fermen-tation has been well performed even under not-optimal conditions for both the activity ofGSHE and growth of microorganism. In terms of solvent concentration and solvent yield, therewas no significant difference between conventional process (using cooked starches) and newuncooked process (using native starches and GSHE). When native starches were used, butyricacid was kept at very low level and not detected at the end of fermentation. This phenomenoncould be due to low pH fermentation, and therefore the production of solvent entered quicklythe solventogenesis phase. It is found in this work that low initial pH has no negative effects onsolvent production. The final solvent concentration was at least as high as that obtained inconventional process using corresponding starches. However, the fermentation performancedepended strongly on the nature of starchy materials. Corn starch was easily utilized inuncooked process while cassava starch was utilized more difficulty. A specific GSHE foreach type of starch could be a solution for process using native starches. Another advantage ofthe uncooked process is that there was no formation of foam in the process. Consequently, noantifoam is required and the working volume of fermenter is significantly increasable.
Acknowledgments This work was financed by the Japan Society for Promotion of Science (JSPS), grantnumber P08102. The authors would like to thank Genencor International (Palo Alto, CA) for giving GSHE(Stargen 001) as a gift.
References
1. EIA, U.S. Energy Information Administration (2011), International Energy Outlook 2011.2. Wen, F., Nair, U. N., & Zhao, H. (2009). Current Opinion in Biotechnology, 20, 412–419.3. Dürre, P. (2007). Biotechnology Journal, 2, 1525–1534.4. Jones, D. T., & Woods, D. R. (1986). Microbiology Reviews, 50, 484–524.5. Dürre, P. (1998). Applied Microbiology and Biotechnology, 49, 639–648.6. Mitchell, W. J. (1998). Advance Microbiology Physiological, 39, 31–130.7. Beesch, S. C. (1953). Applied Microbiology, 1, 85–96.8. Wu, M., Wang, M., Liu, J. & Huo, H. (2007). Report ANL/ESD/07-10, Argonne National Laboratory, U.S.
Department of Energy.9. Wang, P., Singh, V., Xue, H., Johnston, D. B., Rausch, K. D., & Tumbleson, M. E. (2007). Cereal Chemistry
Journal, 84, 10–14.10. Robertson, G. H., Wong, D. W. S., Lee, C. C., Wagschal, K., Smith, M. R., & Orts, W. J. (2006). Journal of
Agricultural and Food Chemistry, 54, 353–365.11. Lee, S. Y., Park, J. H., Jang, S. H., Nielsen, L. K., Kim, J., & Jung, K. S. (2008). Biotechnology and
Bioengineering, 101, 209–228.12. Patent US20080199927A1, 200813. Lee, T. M., Ishizaki, A., Yoshino, S., & Furukawa, K. (1995). Biotechnological Letters, 17, 649–654.14. Tashiro, Y., Takeda, K., Kobayashi, G., Sonomoto, K., Ishizaki, A., & Yoshino, S. (2004). Journal of
Bioscience and Bioengineering, 98, 263–268.15. Holm, J., Björck, I., Drews, A., & Asp, N. G. (1986). Starch-Starke, 38, 224–226.16. Thang, V. H., Kanda, K., & Kobayashi, G. (2010). Applied Biochemistry and Biotechnology, 161, 157–170.17. Svihus, B., Uhlenb, A. K., & Harstad, O. M. (2005). Animal Feed Science and Technology, 122, 303–320.18. Chinnaswamy, R., & Hanna, M. A. (1988). Cereal Chemistry, 65, 138–143.19. Charles, A. L., Chang, Y. H., Ko, W. C., Sriroth, K., & Huang, T. C. (2005). Journal of Agricultural and
Food Chemistry, 53, 2717–2725.20. Defloor, I., Dehing, I., & Delcour, J. A. (1998). Starch-Starke, 50, 58–64.
1830 Appl Biochem Biotechnol (2014) 172:1818–1831

21. Biebl, H. (1999). Journal of Industrial Microbiology and Biotechnology, 22, 115–120.22. Shariffa, Y. N., Karim, A. A., Fazilah, A., & Zaidul, I. S. M. (2009). Food Hydrocolloids, 23, 434–4440.23. Li, J., Vasanthan, T., & Bressler, D. C. (2012). Carbohydrate Polymers, 87, 1649–1656.24. Uthumporn, U., Zaidul, I. S. M., & Karim, A. A. (2010). Food Bioproducts Process, 88, 47–54.25. Robertson, G. H., Wong, D. W. S., Lee, C. C., Wagschal, K., Smith, M. R., & Orts, W. J. (2006). Journal of
Agricultural and Food Chemistry, 54, 353–365.26. Oates, C. G. (1997). Trends in Food Science and Technology, 8, 375–382.27. Naguleswaran, S., Li, J., Vasanthan, T., Bressler, D., & Hoover, R. (2012). Carbohydrate Polymers, 88, 864–
874.28. Rao, M. A., & Tattiyakul, J. (1999). Carbohydrate Polymers, 38, 123–132.29. Yuan, Y., Zhang, L., Dai, Y., & Yu, J. (2007). Journal of Food Engineering, 82, 436–442.30. Naguleswaran, S., Vasanthan, T., Hoover, R., & Bressler, D. (2013). Food Research International, 51, 771–
782.31. Asare, E. K., Jaiswal, S., Maley, J., Baga, M., Sammynaiken, R., Rossnagel, B. G., et al. (2011). Journal of
Agricultural and Food Chemistry, 59, 4743–4754.32. Dhital, S., Shrestha, A. K., & Gidley, M. J. (2010). Carbohydrate Polymers, 82, 480–488.33. Salman, H., Blazek, J., Lopez-Rubio, A., Gilbert, E. P., Hanley, T., & Copeland, L. (2009). Carbohydrate
Polymers, 75, 420–427.34. Sharma, V., Rausch, K. D., Tumbleson, M. E., & Singh, V. (2007). Starch-Starke, 59, 549–556.35. Zhang, G., Ao, Z., & Hamaker, B. R. (2006). Slow digestion property of native cereal starches.
Biomacromolecules, 7, 3252–3258.36. Cervantes-Martínez, A., Saint-Jalmes, A., Maldonado, A., & Langevin, D. (2005). Journal of Colloid
Interface Sciences, 292, 544–547.37. Holden, T. F., Aceto, N. C., & Schoppet, E. F. (1964). Journal of Dairy Science, 47, 359–364.38. Bryant, D. L., & Blaschek, H. P. (1988). Journal of Industrial Microbiology, 3, 49–55.
Appl Biochem Biotechnol (2014) 172:1818–1831 1831