a novel flow cytometry based methodology for rapid, …
TRANSCRIPT

A NOVEL FLOW CYTOMETRY BASED METHODOLOGY FOR RAPID, HIGH-
THROUGHPUT CHARACTERIZATION OF MICROBIOME DYNAMICS IN
ANAEROBIC SYSTEMS
BY
ABHISHEK S. DHOBLE
DISSERTATION
Submitted in partial fulfillment of the requirements
for the degree of Doctor of Philosophy in Agricultural and Biological Engineering
in the Graduate College of the
University of Illinois at Urbana-Champaign, 2016
Urbana, Illinois
Doctoral Committee:
Associate Professor Kaustubh D. Bhalerao, Chair and Director of Research
Associate Professor Michael J. Miller
Associate Professor Kris N. Lambert
Assistant Professor Girish Chowdhary

ii
ABSTRACT
A key challenge in studying complex microbial communities in natural, controlled and
engineered environments is the development of a label-free, high throughput technique to
enable rapid, in-line monitoring of the structure and function of microbiomes sensitive to
perturbations. Here, a novel multidimensional flow cytometry based method has been
demonstrated to monitor and rapidly characterize the dynamics of the complex anaerobic
microbiome associated with perturbations in external environmental factors.
The present study indicates that an autocorrelation analysis between diverging
microbial communities is a simple and rapid tool to monitor perturbations in anaerobic
systems due to addition of various carbon sources. Exploiting multiple measurable
dimensions in flow cytometry such as cell size (FSC or forward scatter), cell
granularity/morphology (SSC or side scatter) and autofluorescence (corresponding to the
same excitation/emission wavelength as in AmCyan standard dye), it is possible to monitor
and rapidly characterize the dynamics of the complex anaerobic microbiome associated with
perturbations in external environmental factors. Further, it is also possible to quantitatively
discriminate between divergent microbiomes, in a manner analogous to community
fingerprinting techniques using automated ribosomal intergenic spacer analysis (ARISA).
While ARISA measures diversity at the genomic level and flow cytometry measures diversity
at the morphological level, there was an observed correspondence between the two measures
at the phylum-level.
The present study also suggests that machine learning algorithms can be fruitful in the
classification of cytometric fingerprints. With a limited dataset from the carbon source

iii
perturbed anaerobic microbiome, several machine learning algorithms were found to be fast
and comparable in accuracy to traditional microbial ecology statistical analysis. A comparison
between different algorithms based on predictive capabilities suggested that Deep Learning
(DL) was best at predicting overall community but Distributed Random Forest (DRF) was
best for predicting the most important putative microbial group(s) in the anaerobic digesters
viz. Methanogens. The utility of flow cytometry based method has also been demonstrated in
a fully functional industry scale anaerobic digester to distinguish between microbiome
compositions caused by varying the hydraulic retention time (HRT). Potential utility of the
proposed methodology has been demonstrated for monitoring the syntrophic resilience of the
anaerobic microbiome perturbed under nanotoxicity.

iv
ACKNOWLEDGEMENTS
I wish to thank my advisor, Dr. Kaustubh D. Bhalerao, for introducing me to great
fields of flow cytometry and machine learning which would be the founding pillars for my
career. I’d like to extend my sincere thanks to Dr. Bhalerao for believing in me and for
providing the best advice at the most challenging times. I thank Dr. Bhalerao for teaching me
the best lesson of my life – the lesson of humility – for which I am forever indebted to him. I
am grateful for his continued intellectual support, patience, unrestricted time and bountiful
reservoir of inspiration during my PhD. Greater than the satisfaction of having achieved the
important milestone in academia, it was my pleasure to know and work closely with
confident, cheerful, down-to-earth personality like Dr. Bhalerao, to whom I extend my
deepest respect and affection.
I am greatly appreciative of having a fantastic, helpful committee. I’d like to express
my deep sense of gratitude to Dr. Michael J. Miller for his valuable support and guidance with
microbiology, for teaching me the functional aspects of food and industrial microbiology in
his class, and for helpful suggestions in the committee meetings. I am equally indebted to Dr.
Kris N. Lambert for his support with ARISA experiments and for lending me use his facilities,
expertise, patience and time. I had a great time serving as his teaching assistant for Genetic
Engineering lab and I thank him for giving me the opportunity. I sincerely thank Dr. Girish
Chowdhary for serving on my committee, providing invaluable suggestions and guiding me
with his expertise in machine learning. I am grateful to Dr. Angela Kent for her cogent
suggestions during the inceptive phase of this dissertation.

v
I am also thankful to the Roy J. Carver Biotechnology Center (CBC)’s Flow
Cytometry Facility for their services, equipment and resources to carry out this work. I
specially want to thank the director of the flow ctyometry facility - Dr. Barbara Pilas who
made this work possible. The present work is supported by NSF award 0749028 and
independent grant from the Institute of Sustainability, Energy, and Environment. I’d also like
to extend my sincere thanks to the Post-Doctoral Researchers from my lab - Dr. Chinmay
Soman, Dr. Sadia Bekal and outside the lab – Dr. Christine Xiaoji Liu, Dr. Sujit Jagtap, Dr.
Deepak Kumar Garg, Dr. Kamaljit Banger, for mentoring my progress.
I would like to thank Dr. Chester Brown and J. P. Swigart from The School of
Molecular and Cellular Biology (MCB) for offering teaching assistantship and for their
support in completing the graduate teacher certification and teacher scholar certificate. I
appreciate the time and efforts of cheerful ABE staff with paper work, travel and PhD
examinations. A special thanks to our head Dr. K. C. Ting for the incredible leadership and
his system-based thinking, which percolated down to each student in this department.
I would like to thank my lab mates Pratik Lahiri, Xiaofeng Ban, Seokchan Yoo, Nico
Hawley-Weld, Farhan Syed, Safyre Andersen, Allante Whitmore, Xiaolun Chen, Xiaowen
Lin and ABE friends Harshal Maske, Vaskar Dahal, Andres Prada, Michael Stablein, Ana
Martin-Ryals, Wan-Ting Chen, Ranjeet Kumar Jha, Chih-Ting Kuo, Dr. Ravi Challa, Robert
Reis, Dr. Liangcheng Yang, Dr. Siddhartha Varma, Dr. Ming-Hsu Chen and Dr. Haibo
Huang. Thank you for your friendship and support.
Finally I would like to thank my family who believed in me!

vi
TABLE OF CONTENTS
1. INTRODUCTION .................................................................................................................... 1
1.1. Microbiomes rule the world! ............................................................................................ 1
1.2. The anaerobic microbiome ............................................................................................... 2
1.3. Need for a microbiome characterization tool for anaerobic digesters ........................... 3
1.4. Overview and goals of this work ..................................................................................... 4
1.5. Organization of this work ................................................................................................. 6
2. LITERATURE REVIEW ........................................................................................................ 7
2.1. Background ....................................................................................................................... 7
2.2. Molecular microbial ecology methods for microbial community structure analysis ... 7
2.3. Molecular microbial ecology methods for microbial community function analysis .. 12
2.4. Future prospects .............................................................................................................. 14
3. RAPID CHARACTERIZATION OF MICROBIOME DYNAMICS USING FLOW
CYTOMETRY ....................................................................................................................... 16
3.1. Background ..................................................................................................................... 16
3.2. Materials and methods .................................................................................................... 18
3.3. Results and discussion .................................................................................................... 22
3.4. Conclusion and future research directions .................................................................... 29
4. COMPARISON OF FLOW CYTOMETRY TO TRADITIONAL CULTURE-
INDEPENDENT TECHNIQUE LIKE ARISA ................................................................... 31
4.1. Background ..................................................................................................................... 31
4.2. Materials and methods .................................................................................................... 33
4.3. Results and discussion .................................................................................................... 35
4.4. Conclusion and future research directions .................................................................... 41
5. MACHINE LEARNING ANALYSIS OF FLOW CYTOMETRY DATA USING
H2O.AI.................................................................................................................................... 43
5.1. Background .................................................................................................................. 43
5.2 Approach ....................................................................................................................... 44
5.3 Results and discussion .................................................................................................. 46
5.4 Conclusions and future research directions ................................................................. 53
6. APPLICATIONS OF THE PROPOSED FLOW CYTOMETRY BASED
METHODOLOGY ................................................................................................................. 54
6.1. Applications in monitoring community dynamics in operational municipal anaerobic
digester ....................................................................................................................... 54
6.2. Applications in evaluating microbiome resilience ....................................................... 59

vii
6.3. Applications in the proposed campus anaerobic digester............................................. 66
7. CONCLUSIONS AND FUTURE WORK ........................................................................... 70
7.1. Major conclusion of this work ....................................................................................... 70
7.2. Future research goals ...................................................................................................... 71
7.3. Last words ....................................................................................................................... 76
LITERATURE CITED.................................................................................................................. 77
APPENDIX A: ADDITIONAL EXPERIMENTAL RESULTS AND OUTPUT OF MODEL
RUNS ...................................................................................................................................... 88
A.1. FSC-SSC plots for all flow cytometry samples showing percentages of cells in the
prominent blobs. ........................................................................................................ 88
A.2. Live vs Dead cells in UCSD digester ........................................................................... 89
A.3. E. coli HB 101 growth curves ....................................................................................... 90
A.4. Flavin autofluorescence for UCSD samples ................................................................ 91
A.5. Predictive model run output for UCSD samples .......................................................... 92

1
1. INTRODUCTION
1.1. Microbiomes rule the world!
The microbiome plays an important role in maintaining health and wellness in plants
(Chaparro et al., 2012), animals (Henderson et al., 2015) and humans (Balskus, 2016). To
achieve foundational changes in our understanding of health and wellness, and agricultural
and environmental sustainability, there is a recognized need to advance our understanding of
the key players in our ecosystems, viz. microbial communities (Tilman et al., 2011).
Perturbations in the structure and function of a microbiome are now recognized as an
important step in the etiology of infectious disease (Balskus, 2016; Stappenbeck and Virgin,
2016). The role of soil microbes in bio-geo-chemical nutrient cycling (Faure et al., 2009;
Hirsch and Fujishige, 2012) and the disruption of ecosystem functionality due to changes in
the soil microbiota has been well recognized (Q. Li et al., 2016). In the sphere of animal
agriculture, ruminant animals are vital component of our food systems, and the rumen
microbiome plays a vital role in controlling effective conversion of animal feed to animal
protein (El Akkad et al., 1966; Henderson et al., 2015). Last, but not the least, many disease
states caused by microbes like C. difficile (Lyerly et al., 1985) and P. aeruginosa (Stieritz and
Holder, 1975) in human health have their etiology in perturbations of the native, commensal
microbiome. Since a resilient microbiome is considered an integral part of environmental,
agricultural and human ecosystems, there is a need to enhance our understanding of it’s basic
biological mechanisms and principles.

2
1.2. The anaerobic microbiome
In today’s era of sustainable energy sources, production of energy from wastes is an
essential component (Angenent et al., 2004). Anaerobic bioreactors are a prominent source of
bioenergy (Pandit et al., 2015) commonly employed for the treatment of wastewaters, the
stabilization of sludges, and the treatment of hazardous and solid waste streams (Dhoble and
Pullammanappallil, 2014). A healthy and functioning microbiome is considered crucial to the
stability and performance of anaerobic bioreactors and their functional stability is governed by
dynamic interaction within these microbial communities (Jeffrey J Werner et al., 2011).
Anaerobic digestion is a process in which syntrophic consortia of microorganisms break down
organic material in the absence of oxygen to produce biogas, a mixture of methane and carbon
dioxide (Manyi-Loh et al., 2013). The digestion process begins with bacterial hydrolysis of
the input materials in order to break down insoluble organic polymers such as carbohydrates
and make them available for utilization by microbial consortia. Higher in the hierarchy, large
organic chain molecules such as cellulose and starch are broken down into simpler sugars and
monomers by hydrolyzers. Acidogenic bacteria then convert the sugars and amino acids into
carbon dioxide, hydrogen, ammonia, and organic acids. Acetogenic bacteria then convert
these resulting organic acids into acetic acid, along with additional ammonia, hydrogen, and
carbon dioxide as shown in Figure 1-1 (Dhoble, 2009). In the absence of methanogens,
fermentation products, volatile organic acids and hydrogen build-up. This build-up retards the
overall degradative process causing a decrease in pH which inhibits growth and stops
fermentation. The overall role of methanogenesis in the biosphere is to complete the
degradation process by removal of inhibitory fermentation products (Boone et al., 1993).

3
Figure 1-1. Anaerobic digestion process (Jeffrey J Werner et al., 2011).
1.3. Need for a microbiome characterization tool for anaerobic digesters
There is no simple, in-line, cost effective method available to distinguish between the
bioreactors that perform well from those that perform inadequately (Leitão et al., 2006).
Because of this there is a general perception that anaerobic bioreactors are unreliable or
unstable (Amani et al., 2010). In order to monitor and characterize perturbations in the
structure and function of a microbiome, there is a need to develop tools that measure
microbiome features beyond genomic or functional diversity (Müller and Nebe-von-Caron,
2010). The strict anaerobic requirements are an impediment to culture based studies of
underlying microbial communities (Koch et al., 2014c). It has been demonstrated previously
that microbial communities in anaerobic bioreactors can be characterized using molecular
probes (Raskin et al., 1995). However the complexity arising from probe design,
characterization and availability of rRNA sequences make this approach difficult to

4
implement in an online monitoring system. There is a demand for the quick, simple and
effective method for monitoring the structure and function of the bioreactor microbial
communities (Kinet et al., 2016).
Low cost next generation sequencing (NGS) is not high throughput enough to resolve
dynamic changes in the structure of the microbiome over time (Yu et al., 2015). Flow
cytometry can provide this information in a high throughput manner since its fast, inline,
automated, permits sample labeling, and requires small sample volumes and minimal sample
preparation (Müller and Nebe-von-Caron, 2010). It also requires low capital investment, has
low per sample cost, produces rich high-dimensional information and is capable of sorting and
classifying a sample (Koch et al., 2014d).
1.4. Overview and goals of this work
Here, a novel methodology has been demonstrated using multiple flow cytometry
signals: cell size (FSC or forward scatter), cell granularity/morphology (SSC or side scatter)
and autofluorescence (corresponding to the same excitation/emission wavelength as in
AmCyan standard dye) towards a high-throughput tool to assess microbial community
structure and dynamics. This approach has the potential to open the door for rapid, label free
monitoring and characterizing dynamics of the microbial communities in natural as well as
engineered environments.
The central hypothesis of this work is that flow cytometry can classify microbial
consortia based on characteristics such as viability, metabolic activity, and morphology. The
rationale for the proposed methodology is that the combinations of these characteristics form
unique ‘cytometric fingerprints’ (Koch et al., 2014c) that can complement existing

5
technologies (Park et al., 2005) and may facilitate rapid characterization of the dynamics of
microbial communities. The goal of this study is to demonstrate the potential usefulness and
sensitivity of a novel multi-dimensional flow cytometry based method to allow rapid high-
throughput characterization of the dynamics of microbial community evolution and
intracommunity dynamics. Using anaerobic microbial consortia perturbed with controlled
addition of carbon sources (Owen et al., 1979), the microbial diversity information obtained
from established culture-independent technique like ARISA (Fisher and Triplett, 1999) has
been demonstrated to be comparable with flow cytometry based analysis. Furthermore, the
flow cytometry along with non-invasive autofluorescence based method has been
demonstrated to potentially detect and classify (type) microbial consortia in an industrial scale
anaerobic digester operated at varying HRTs, which can provide high throughput
microbiological bioprocess evaluation and appropriate in-line as well as off-line intervention
strategies in bioprocess industries.
Objectives of this study were to:
1. Create controlled perturbation in model ecosystem and determine if flow cytometry
can facilitate rapid characterization of dynamics of complex microbiome.
2. Compare flow cytometry to traditional culture-independent techniques like ARISA.
3. Determine if machine learning can be fruitful in the classification of flow cytometry
samples.
4. Demonstrating applications of proposed methodology in detectecting changes in the
microbial community at different HRTs in industrial biodigeters, evaluating
nanotoxicity and bioprocess design.

6
1.5. Organization of this work
The work that resulted from these objectives is presented in several sections. In Chapter 2,
overview of the existing microbiome characterization technologies has been discussed. In
Chapter 3, the specific methodology used for the experiments and analysis has been presented.
The results of these studies and its comparison with tradition culture independent technique
have been discussed in Chapter 4. Some of the aspects of Chapter 3 and 4 have been
published in the Bioresource Technology, Volume 220, November 2016, Pages 566–571.
Chapter 5 explores the applications of machine learning in flow cytometry data analysis. The
applications of the proposed methodology have been demonstrated in Chapter 6. Finally in
Chpater 7, an overall evaluation of the research and suggestions for its extension has been
offered.

7
2. LITERATURE REVIEW
2.1. Background
Anaerobic digestion is a microbial process in which syntrophic consortia of
microorganisms break down organic material in the absence of oxygen to produce biogas a
mixture of methane and carbon dioxide (Boone et al., 1993). Traditional methods of microbial
analysis include culture-type techniques such as microscopy, plating and counting etc.
However the strict anaerobic requirements are an impediment to culture based studies of
underlying microbial communities in the anaerobic bioreactors (Raskin et al., 1995). There is
a need for an ideal tool to monitor the structure and function of the anaerobic bioreactor
microbial communities that will be a real time method that is quick, simple and effective.
Owing to the fact that most of the microorganisms are not cultivatable in the lab with
current cultivation methods, a small portion of the microbial communities are known, and the
ecology information revealed by cultivation-based methods is restricted. On the other hand,
molecular techniques that can measure cell DNA and RNA are more direct and robust and can
furnish useful information about the structure (who they are), function (what they do), and
dynamics (how they change through space and time).
2.2. Molecular microbial ecology methods for microbial community structure analysis
Even though most of the contemporary techniques and technologies analyze marker
genes, 16S ribosomal RNA (rRNA) gene has been almost exclusively used as marker gene in
studies of microbial communities, either community composition or population dynamics,
microbial community profiling is also commonly used to evaluate and compare different
microbiomes. The ones that have been used include terminal restriction fragment length
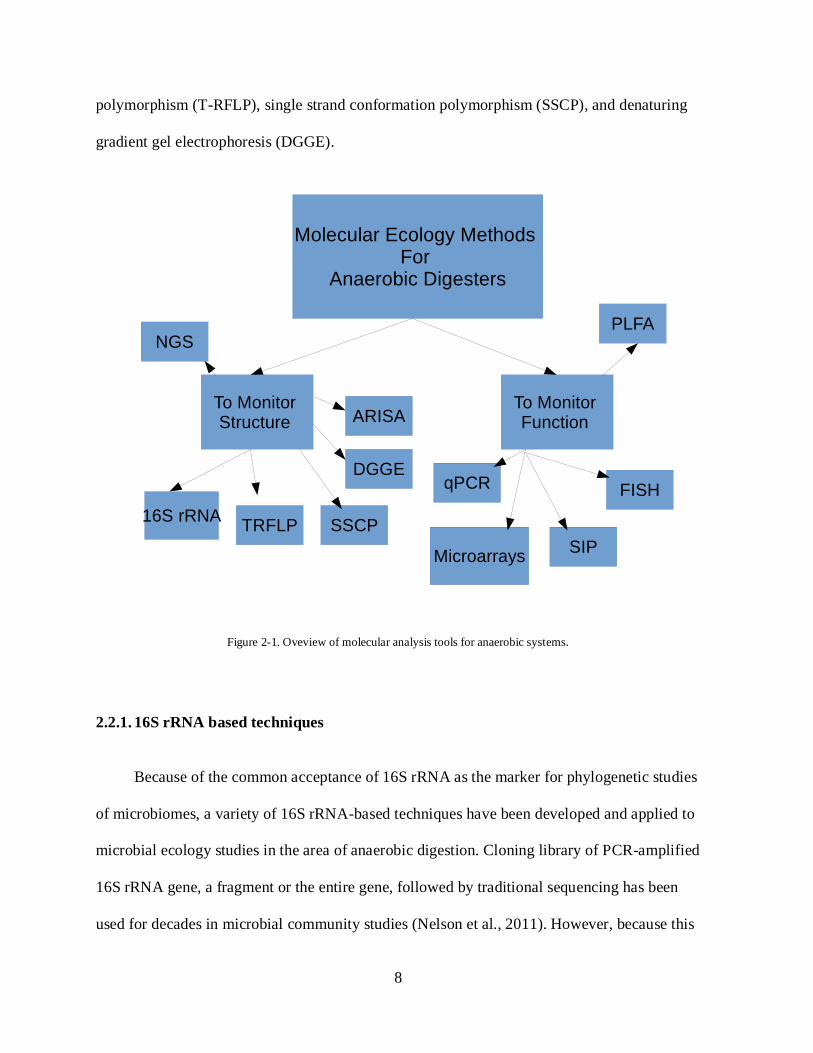
8
polymorphism (T-RFLP), single strand conformation polymorphism (SSCP), and denaturing
gradient gel electrophoresis (DGGE).
Figure 2-1. Oveview of molecular analysis tools for anaerobic systems.
2.2.1. 16S rRNA based techniques
Because of the common acceptance of 16S rRNA as the marker for phylogenetic studies
of microbiomes, a variety of 16S rRNA-based techniques have been developed and applied to
microbial ecology studies in the area of anaerobic digestion. Cloning library of PCR-amplified
16S rRNA gene, a fragment or the entire gene, followed by traditional sequencing has been
used for decades in microbial community studies (Nelson et al., 2011). However, because this
8
polymorphism (T-RFLP), single strand conformation polymorphism (SSCP), and denaturing
gradient gel electrophoresis (DGGE).
Figure 2-1. Oveview of molecular analysis tools for anaerobic systems.
2.2.1 16S rRNA Based Techniques
Because of the common acceptance of 16S rRNA as the marker for phylogenetic studies
of microbiomes, a variety of 16S rRNA-based techniques have been developed and applied to
microbial ecology studies in the area of anaerobic digestion. Cloning library of PCR-amplified
16S rRNA gene, a fragment or the entire gene, followed by traditional sequencing has been
used for decades in microbial community studies (Nelson et al., 2011). However, because this
Molecular Ecology Methods For
Anaerobic Digesters
To Monitor Structure
To Monitor Function
16S rRNA
DGGE
SSCPTRFLP
ARISA
NGS
qPCR
PLFA
SIP
FISH
Microarrays

9
traditional sequencing approach sequences individual clones one by one, which is costly and
time consuming, it does not support detailed analysis to reveal the true microbial composition
and diversity, especially when multiple samples are analyzed. Recent advancement and
decreasing cost of the next-generation sequencing technologies made this method quite
obsolete.
2.2.2. Terminal restriction fragment length polymorphism (T-RFLP)
T-RFLP entails amplification of a region of the 16S rRNA gene using primers labeled
with a fluorescent dye at 5’ end, digestion using one or two restriction endonuclease, and
sizing one or both terminal restriction fragments using Sanger sequencers. T-RFLP has been
successfully used to investigate both the archaeal (Yang et al., 2013b) and bacterial
communities ((Westerholm et al., 2011)) in different anaerobic digestion systems. The
terminal restriction fragments can be quantified based on the intensity of the fluorescence
signal, but such quantification is not accurate because of PCR bias.
2.2.3. Single strand conformation polymorphism (SSCP)
SSCP is another method to profile microbial community. It is based on the principle that
single-strand DNA fragments of the same length but different sequences can form different
secondary structures, which affect migration during gel electrophoresis and allow separation
of different fragments (Orita et al., 1989). SSCP has been used to investigate the
methanogenic community in several anaerobic digestion systems (Leclerc et al., 2004), but it
is not used as commonly as DGGE (Hori et al., 2006).

10
2.2.4. Denaturing gradient gel electrophoresis (DGGE)
Like SSCP, DGGE is also based on migration differences among 16S rRNA gene
amplicons of the same length but different sequences. Different from SSCP, DGGE analyzes
double stranded DNA fragments. It possible to combine samples that were extracted at
different times within one gel and hence it is an extremely effective tool for assessing the
ways in which microbial communities change over a given period of time (Turker et al.,
2016a). DGGE is one of the commonly used techniques to screen clone libraries DGGE has
been widely used for microbial community studies in anaerobic digestion systems because of
its simplicity and rapidness, even after NGS technologies are increasingly affordable
(Zamanzadehn et al., 2013). It should also be noted that a recent study showed that DGGE
profiles concurred with the detailed community profiles of microbial communities in several
digesters that were determined using 454 pyrosequencing (Nelson, 2011). In studies that
involve a large number of samples, DGGE can be a useful tool to profile all the samples to
identify representative samples to be further analyzed by deep sequencing (Nelson, 2011).
Even though the band excision is a powerful feature of DGGE, a band will consist of 150–
200-bp DNA, which makes it challenging for a phylogenetic analysis. Furthermore, co-
migration of bands also will give a poor identification in the sequencing (Aydin et al., 2015).
2.2.5. Automated ribosomal intergenic spacer analysis (ARISA)
ARISA constitutes an elegant tool to study microbial diversity. There are very few
studies on anaerobic bioreactors with direct utilization of ARISA. The changes in δ13CH4
and archaeal community structure have been monitored during mesophilic methanization of
municipal solid waste indicating shifts in archaeal communities (Qu et al., 2009a). Recently
Limam et al., 2013 have utilized ARISA in evaluation of biodegradability of phenol and

11
bisphenol-A during mesophilic and thermophilic municipal solid waste anaerobic digestion
using 13C-labeled contaminants. However both of these studies has mentioned about the
biases that ARISA may introduce in their conclusions due to under or over estimation of
diversity.
2.2.6. Limitations of traditional culture independent techniques
The major limitation of SSCP, T-RFLP, DGGE and ARISA lies in the difficulty to
obtain sequence information of the 16S rRNA gene fragments. Nevertheless, despite of their
limitations, these three profiling methods can be still useful to obtain a snapshot of the
microbial communities from large number of samples.
2.2.7. Next generation sequencing
The development of the so-called next-generation sequencing (NGS) technologies
makes it possible to reveal ‘who’s there? in anaerobic bioreactors by employing massive
parallel sequencing. NGS technologies can produces millions of sequencing reads in a single
instrument run. The two most popular NGS technologies in use are 454 pyrosequencing and
the Illumina sequencing on HiSeq and MiSeq platforms (Illumina). Although differing in
sequencing principle, a recent study suggested that both methods were suitable in quantitative
analysis of microbial communities and produced similar results on the same microbial
community (Luo et al., 2012). By directly comparing the sequencing datasets obtained from
these two sequencing methods on the same microbial community, the authors reported that the
results obtained from the two platform agreed on over 90% of the assembled countings and
89% of the unassembled reads as well as on the estimated gene and genome abundance in the

12
samples (Luo et al., 2012). The major reported disadvantages of these techniques are that they
are very expensive.
2.3. Molecular microbial ecology methods for microbial community function analysis
Although SSCP, DGGE, T-RFLP, ARISA and NGS are useful tools in profiling the
microbial community in the anaerobic bioreactors, they do not support accurate quantification
of individual populations. Hence in an effort to answer the question “how many are there?”
investigators have employed various other techniques as described below:
2.3.1. Quantitative real-time PCR
Quantitative Real-Time PCR (qPCR) is used to quantify genes, which can help in the
evaluation of microbial structure as well as function. Order-specific primers have been
demonstrated for commonly witnessed methanogens in anaerobic digestion (Yu et al., 2005),
or genera-specific primers for methanoculleus, methanosarcina, and methanothermobacter
(Franke-Whittle et al., 2009). Genus-specific primers targeting 16S rRNA of hydrolytic
bacteria clostridium and syntrophic acetogen syntrophomonas were also used in qPCR to
investigate the spatial distribution of these genera in different compartments of a plug flow
digester (Talbot et al., 2010). While this technique can be used to quantify abundance or
expression of gene of interest, it has been argued to not give any information on identity of
organism being quantified.
2.3.2. Microarrays
Microarrays have been proven to be used as a biosensor (Burja et al., 2003). They have
been shown to enhance the understanding of the microbial communities in regard to structure,

13
function and dynamics to enhance methane production. While they are good for quickly
determining the presence and relative abundance of genes of interest, it’s reported to be quite
expensive to analyze.
2.3.3. Stable isotope probing (SIP)
Stable isotope probing (SIP) has been shown to recover the labeled DNA fraction from
methane and methanol assimilation (Radajewski et al., 2000). The technique allows for
functional detection of microbial groups. The major reported advantage for this technique is
that it can be used concurrently with FISH for detecting ammonia oxidation in anaerobic
sludges (Wanger and Loy 2002).
2.3.4. Fluorescence in situ hybridization (FISH)
Fluorescence in situ hybridization (FISH) is a useful molecular technique to
quantitatively identify a microbial community. The technique involves rapid fixation of
samples post extraction in order to preserve the cell morphology of the microbial communities
involved. After extraction, samples are washed and hybridized using oligonucleotide probes
that are specific to the gene sequences of the cells involved. Fluorescent dye is used to label
the oligonucleotide probes so that they can be observed under a fluorescence microscope
(Turker et al., 2016a) . FISH has been used to observe the spatial distribution of archaeal and
bacterial cells in anaerobic digesters (Angenent et al., 2004; Yamada et al., 2005). A
combination of FISH and microautoradiography (FISH-MAR), FISH-SIP and microarrays
have been used to evaluate microbial structure and function (Ariesyady et al., 2007; Ho et al.,
2013). The main claimed advantage of FISH is its ability to localize the specific group of
interest.
14
2.3.5. Phospholipid fatty acid (PLFA)
Phospholipid fatty acid (PLFA) profiling has been used in other habitats, but its
application to the microbial communities in biodigesters has not explored much in the
literature. Only one study has been reported in the literature that investigated changes of
microbial community under different operation conditions in anaerobic digestion
(Schwarzenauer and Illmer, 2012). One of the important reason could be archaea cannot be
detected with PLFA. Since methanogenic archaea plays a crucial role in anaerobic
bioreactors, PLFA would definitely underestimate the diversity in this system.
2.4. Future prospects
The future work in this area will primarily be concentrated along the development of a
real time, quick, simple and effective method for monitoring the structure and function of the
anaerobic bioreactor using the direct detection of specific genes or gene products within single
microbial cells by advanced FISH techniques. To the best of my knowledge such a
comprehensive study on single cell identification of microbes by detecting signature regions
in their rRNA molecules using Flow-FISH and comparison of microbial community
morphology obtained from flow cytometry with microbial diversity information obtained
from ARISA does not exist for anaerobic digesters. The methodology also is novel to such
studies, and has the potential to yield informative models for understanding and engineering
the function of other complex microbial communities, such as in the human gut, soils and
oceans.

15
Figure 2-2. Comparison of processing timeline for NGS (~14 h) vs flow cytometry (~1 h) indicating NGS is not high
throughput enough to resolve dynamic changes in the structure of the microbiome over time while flow cytometry can provide this information in a high throughput manner.

16
3. Rapid characterization of microbiome dynamics using flow cytometry
In this section, a multidimensional, multi-parameter flow cytometry based method has
been demonstrated using anaerobic microbial consortia perturbed with the controlled addition
of various carbon sources. Utility of autocorrelation function commonly seen in time series
data has been demonstrated using multiple flow cytometry signals towards a high-throughput
tool to assess microbial community structure and dynamics. A novel methodology presented
here has a potential to benefit research community in various fields of life sciences and
microbial ecology.
3.1. Background
The model microbial community used here is from the operational anaerobic digesters
in the wastewater treatment plant. The rationale behind selecting this as a model ecosystem is
because it’s an active, interactive community rather than just a combination of different
microbes. Performance of anaerobic bioreactors and their functional stability is governed by
dynamic interaction within these microbial communities. The metabolic process of anaerobic
digestion can be divided into four sequential steps: hydrolysis, acidogenesis, acetogenesis, and
methanogenesis (Christy et al., 2014). Additional pathways are involved in nutrient removal
(i.e. the formation of inorganic nitrogenous and sulfurous species such as ammonia and
hydrogen sulfide) which compete for the intermediates of methane production (i.e. volatile
fatty acids) (Volmer et al., 2015). The controlled perturbations can be created by addition of
various microbiome preferred carbon sources at each stage of anaerobic digestion
(Gunaseelan, 1997). The first step of anaerobic digestion is hydrolysis, which depicts the
breakdown of large organic particulates and macromolecules like cellulose into soluble

17
macromolecular compounds like glucose (Siegert and Banks, 2005). The second step of
anaerobic digestion is acidogenesis: the further breakdown of soluble organics into volatile
fatty acids (VFAs) by various bacterial species (Chen, 2010). The hydrolysis step can be
depicted with controlled addition of glucose as demonstrated previously (Akunna et al., 1993).
Through acetogenesis, which can be depicted with controlled addition of butyric acid or
propionic acid, various intermediate volatile fatty acid compounds are converted into acetic
acid and other single-carbon compounds (Akunna et al., 1993). Finally, in the methanogenesis
step, acetoclastic methanogens convert acetic acid into methane and carbon dioxide by acetate
decarboxylation, while other methanogens convert hydrogen and carbon dioxide into methane
(Daniels, 1984). The acetoclastic methanogenesis can be depicted with the controlled addition
of acetic acid (Chen, 2010). The microbial communities that perform each of these four steps
of anaerobic digestion can be highly transient, and can vary considerably with minor shifts in
operating conditions; hence there is a need for a promising routine on-site methodology
suitable for the detection of stability/variation/disturbance of complex microbial communities
involved in anaerobic digesters (Kinet et al., 2016).
For analyzing microbial community dyanamics in anaerobic systems using cytometric
fingerprinting, four tools have been proposed thus far: Dalmatian Plot (Bombach et al., 2011),
Cytometric Histogram Image Comparison (CHIC) (Koch et al., 2013a), Cytometric Barcoding
(CyBar) (Koch et al., 2014c), and FlowFP (Rogers and Holyst, 2009). The Dalmatian Plot
have been shown to be most sensitive to operator impact but still considered useful for
providing an overview on community shifts. CHIC, CyBar, and FlowFP showed less operator
dependence and gave highly resolved information on community structure variation on
different detection levels (Koch et al., 2014c). All these tools are based on 2 dimensional

18
cytometric fingerprints. The methodology proposed in this section is addressed ‘novel’
because it is based on 3 dimensional flow cytometry signals viz. cell size (FSC or forward
scatter), cell granularity/morphology (SSC or side scatter) and autofluorescence
(corresponding to the same excitation/emission wavelength as in AmCyan standard dye).
3.2. Materials and methods
3.2.1. Source of anaerobic culture and controlled perturbations
Samples of the anaerobic microbial communities were collected from the mesosphilic
anaerobic digester of Urbana and Champaign Sanitary District (UCSD), Urbana, IL as shown
in the Figure 3-1. Laboratory cultures were setup to enrich the community with different
carbon sources to introduce biases in the underlying microbial communities. The cultures
were incubated in Corning No.1460, 250 ml serum bottles. In each serum bottle, 100 ml of
inoculum and the corresponding nutrient solution was added. Each bottle was fed with 2000
mg/L COD of glucose (GLUC), cellulose (CELL), propionate (PROP), butyrate (BUTY),
acetate (ACET) and waste activated sludge (SLUD).

19
Figure 3-1. Arial view of UCSD's wastewater treatment plant showing source of anaerobic culture.
Figure 3-2. Experimental set-up showing biogas assays.
The contents of the bottles were sparged with nitrogen gas for about five minutes before
sealing. Bottles were sealed with butyl rubber serum caps and crimped with aluminum seals of
appropriate size. The sealed bottles were incubated at 35±2oC. Each experiment was

20
conducted in triplicate accompanied with controls containing only inoculated medium. In all
cases, biogas production was measured every 24 h using a water displacement column. After
gas measurement the reactors were shaken once a day manually. Moisture content, total and
particulate volatile solids, soluble chemical oxygen demand and pH were measured according
to Standard Methods for the Examination of Water and Wastewater (APHA, 1998). The peak
day samples correspond to the maximum biogas production observed as shown in the Figures
3-5, 3-6, and 3-7. Samples with no additional carbon sources were represented as NONE_0
for the zero day sample and NONE_2 and NONE_5 for peak biogas day and fifth day samples
respectively. The experimental design has been shown in the Figure 3-3.
3.2.2. Flow cytometric analysis
Samples of the anaerobic microbial communities were collected from each serum bottle
via a syringe with a 18 gauge needle every 24 h following a biogas measurement. Initial
sample (NONE_0) was the same for all the assays, which was the fresh inoculum collected
from UCSD. 750 μL of sample from each serum bottle was strained prior to flow cytometry
using BD Falcon 12x75 mm Tube with Cell Strainer Cap having a 35 um nylon mesh
(Catalog No. 352235). The strained samples were suspended in PBS-1X. Analyses were
performed immediately on a Bio-sciences LSR II Flow Cytometry Analyzer. The excitation
laser was tuned for 405-nm. Autofluorescence was measured as light passing a 450/50 PMT B
band pass filter with no long pass dichroic mirror. Signals were amplified with a 4-decade log
amplifier and collected at a rate of approximately 1000-events/s. Total numbers of events
collected were 100,000 for each sample.

21
Figure 3-3. Experimental design.
3.2.3. Statistical analysis
For the analysis of flow cytometry data, the .fcs files obtained from a Biosciences LSR
II Flow Cytometry Analyzer were imported and the various distance matrices were calculated
using Root Mean Square Distance (RMSD) analysis. A 3D structure based on the FSC-A,
SSC-A and Autofluorescence-A data was created and a bin number of 50 were defined along
each dimension as shown in the Figure 3-4. Data visualization and ordination analyses were
conducted using R programming language. The data from six equally spaced time points was
utilized to do an autocorrelation analysis on the flow cytometry data. A vector that consists of

22
the distances from the NONE_0 sample was assembled all the way through the 5d samples for
every carbon source, for each replicate. For a given carbon source, the matrix containing the
time series data was obtained for that particular replicate.
Figure 3-4. RMSD 3D visualization showing binning strategy along each dimension.
3.3. Results and discussion
3.3.1. Trends in biogas production depicting controlled perturbations
The cumulative and differential biogas productions of putative hydrolyzers and
acidogens fed with CELL and GLUC, respectively, have been shown in the Figure 3-5.

23
Putative hydrolyzers reached the peak biogas production of 271.33 mL of 430 mL cumulative
on day 2 while putative acidogens reached the peak biogas production of 146.33 mL on day 1
itself; cumulative biogas production over 5 days was 264.17 mL. The delay in reaching the
peak biogas production for putative hydrolyzers compared to putative aciodgens can be
attributed to the fact that hydrolysis is generally considered having a slow reaction rates and is
therefore considered as the rate-limiting step of anaerobic digestion (Brummeler et al., 2007).
Hydrolysis rates are dependent upon biomass concentration, extracellular enzyme production,
substrate concentration, and the substrate’s specific surface area and difficulties with
hydrolysis can be partly attributed to a feed material’s large particle size (Siegert and Banks,
2005). Acidogenesis on the other hand represents breakdown of easily soluble organics like
glucose into butyric acid, propionic acid, and acetic acid by various bacterial species of
Clostridium, Enterobacter, Syntrophobacter, and others (Chen, 2010). Figure 3-6 shows the
cumulative and differential biogas productions for putative acetogens. PROP reached the peak
biogas production of 114.67 mL on day 2 while BUTY took 4 days to reach its biogas
production of 47.33 mL. The cumulative biogas production for BUTY (121.33 mL) was also
less than that of PROP (252 mL). These results demonstrate that the community might favor
propionate-utilizing acetogens (genera Smithllela, Syntrophobacter, and Pelotomaculum) over
butyrate utilizing acetogens (genera Syntrophus and Syntrophomonas). Genomic analysis of
total community data might resolve this divergence.

24
Figure 3-5. Cumulative (top) and differential (bottom) biogas production for putative hydrolyzers and acidogens.

25
Figure 3-6. Cumulative (top) and differential (bottom) biogas production for putative acetogens.

26
Figure 3-7. Cumulative (top) and differential (bottom) biogas production for putative methanogens.

27
Cumulative and differential biogas productions for putative methanogens have been
shown in the Figure 3-7. SLUD reached the peak biogas production of 34.33 mL on day 2
while ACET took 4 days to reach the peak biogas production of 30 mL. The cumulative
biogas production for SLUD and ACET were 97 mL and 62.67 mL respectively. Surprisingly,
the total biogas production for the ACET (62.67 mL) is less than that of negative control
sample NONE (74.67 mL). Aceticlastic methanogens convert acetic acid into methane and
carbon dioxide by acetate decarboxylation, while other methanogens convert hydrogen and
carbon dioxide into methane (Daniels, 1984). Acetoclastic methanogens are slow growers
compared to hydrogenotropic methanogens (Christgen et al., 2015). Since the NONE samples
might have a traces of sludge left in them and since the ability of microbial community to eat
one another in order to keep the steady biogas production, it may have been possible that the
experimental time for ACET sample might not be adequate enough to show the true acetate
decarboxylation capability.
3.3.2. Perturbations monitoring with autocorrelation between divergent microbiome
Figure 3-8 shows the autocorrelation analysis at delays of 1-4 d of flow cytometry data
with six equally spaced time periods. Under controlled perturbations, each culture spiked by
specific carbon sources diverges as evidenced by the increasing dissimilarity with time and
hence depicts the continuous evolution of culture over time. The dissimilarity for samples is
smallest for a time delay of 1d, and as the delay increases the dissimilarity increases
proportionally. An autocorrelation function commonly seen in time series data (Wei, 1990)
would be a close analogue of the analysis presented here. GLUC exhibits the increased
distance with delay suggesting it’s a divergent culture, on the contrary PROP and BUTY are

28
somewhat stable. There is an observed similarity with the behavior of ACET and the controls
(NONE, SLUD) since they all were increasing sharply for a delay of 4.
Day-to-day changes over time plotted as a function of the day with respect to which the
day is measured with the delay=1 is shown in the Figure 3-9. The point corresponding to
minimum change portrays a stable extremum in the colony structure. The greatest
dissimilarity is observed between days 1 and 2, which can be interpreted as the time at which
the greatest perturbation was observed. The extremum in the distance can be interpreted as the
time at which the phenotype reaches a stable point under perturbation.
Figure 3-8. Autocorrelation analysis on flow cytometry data with six equally spaced time periods.
Figure 3-9. Autocorrelation analysis on flow cytometry data with day-to-day changes.

29
When anaerobic systems were subjected to substrate shock loadings, the recovery periods
could last from a few days to weeks as shown in the previous perturbation experiments
(McCarty and Mosey, 1991). The magnitude of the perturbation decides how much time an
anaerobic community would take to return to its fully functional condition (Cohen et al.,
1982). As shown in the Figures 3-8 and 3-9, ACET along with controls NONE and SLUD
showed sharp increases for a delay of 4. There are evidences pointing to the fact that,
subdominant communities that take part in the reactive capacity of the digester ecosystem
help face perturbations and foster functional stability (Alsouleman et al., 2016; Y.-F. Li et al.,
2016; Turker et al., 2016b; Venkiteshwaran et al., 2015). Certain communities can even grow
and remain in the digester at subdominant levels and yet be capable of immediate and
significant responses to environmental changes (Blasco et al., 2014; Ito et al., 2012; Nelson et
al., 2011). In the presented autocorrelation function based approach, the salubrious cytometric
fingerprints based on morphology (FSC), granularity/internal complexity (SSC) and metabolic
activity (Autofluorescence) have been exploited to capture the microbiome dynamics ranging
from active to subdominant communities. This demonstrates that the usefulness of the flow
cytometry as a reliable, high throughput tool to resolve dynamic changes in the stable vs
perturbed microbiome dynamics over time.
3.4. Conclusion and future research directions
The present study demonstrates the possibility of quantitative discrimination between
divergent microbiome using anaerobic microbial consortia perturbed with the controlled
addition of various carbon sources. Exploiting the three dimensional flow cytometry signals
namely cell size (FSC or forward scatter), cell granularity/morphology (SSC or side scatter)
and autofluorescence (corresponding to the same excitation/emission wavelength as in

30
AmCyan standard dye), it is possible to monitor and rapidly characterize the dynamics of the
complex anaerobic microbiome associated with perturbations in external environmental
factors.
Further, depending on the availability of species-specific antibody, flow cytometry
technique can be used for differential detection and quantification of microbiome to the
species level. Fluorescent antibodies can be applied to the identification of single cells in the
environment. Some regions of the rRNAs have remained essentially unchanged in all
sequenced species; these can be used as targets for the proposed rRNA probes which would
prove to be a sensitive analytical technique and a high-throughput method that can rapidly
detect changes in the composition of a complex microbiota. Flow cytometry coupled with
live/dead differential staining dyes SYBR Green I (SGI) and Propidium Iodide (PI) may also
be used to quantify and study other essential characteristics of the microbiome.
In order to develop a promising, routine on-site monitoring tool suitable for the
detection of stability/variation/disturbance of complex microbial communities involved in
anaerobic digesters or any other bioprocess, the proposed methodology can be expanded to
multiple parameters beyond those used in the present study. Total DNA content (DAPI
staining), metabolic activity, and fluorescence in-situ hybridization (FISH) rRNA probes are
some of the parameters that can easily be integrated into the existing RMSD based tool. In
addition to the reliable, rapid, high-throughput, routine characterization tool for bioprocess
monitoring, the presented methodology has a potential to benefit research community in
various fields of life sciences and microbial ecology.

31
4. Comparison of flow cytometry to traditional culture-independent
technique like ARISA
In order to monitor and characterize perturbations in the structure and function of a
microbiome, there is a need to develop tools that measure microbiome features beyond
genomic or functional diversity. However any new microbiome characterization methodology
will always be evaluated within the context of the status quo of genomics-based approaches.
Hence, possibility of quantitative discrimination between divergent microbiome analogous to
community fingerprinting techniques using automated ribosomal intergenic spacer analysis
(ARISA) has been evaluated here and compared with flow cytometry in the broader context of
monitoring and rapidly characterizing the dynamics of the complex anaerobic microbiome
associated with perturbations in external environmental factors.
4.1. Background
While sequencing-based approaches can provide very large amounts of information, the
labor required to process the samples (e.g. to amplify genomic regions and to label them with
barcodes) prior to characterization limits its throughput for resolving dynamic changes in the
structure of the microbiome making them not high throughput enough to resolve dynamic
changes in the structure of the microbiome over time (Ong et al., 2013). Flow cytometry can
provide this information in a high throughput manner since its fast, inline, automated, permits
sample labeling, and requires small sample volumes and minimal sample preparation (Müller
and Nebe-von-Caron, 2010). It also requires low capital investment, has low per sample cost,
produces rich high-dimensional information and is capable of sorting and classifying a sample
(Koch et al., 2014c).

32
Since flow cytometry based methodology does not rely on traditional species or
subtype-level enumeration of microbial species within a consortium to derive a classification
scheme, making it somewhat challenging to defend within the context of the status quo of
genomics-based approaches (Günther et al., 2016; Koch et al., 2014a, 2014c, 2014d, 2013a,
2013b; Melzer et al., 2015). Flow cytometry is still perceived to be a tool and database
development activity with the potential to impact the methodology of microbial ecology
studies, rather than a specific system-level hypothesis pertaining to microbial ecosystems
(Amann et al., 1990; Kinet et al., 2016; Saeys et al., 2016; Xue et al., 2016). The goal of this
exercise is to establish the proposed methodology in (i) increasing the accuracy and
throughput of exciting phenotypic and microbial data acquisition and classification, (ii)
potentially transforming the genomic-based analysis pipeline by serving as a preliminary
screening step, and (iii) leading to a complementary approach to genomics-based methods
with the inherent capability of addressing detection / identification / classification problems in
the science of microbiomes characterization.
The rationale for choosing ARISA for the comparison purpose is that it’s a proven
community fingerprinting technique of microbial community analysis that provides a means
of comparing differing environments or treatment impacts without the bias imposed by culture
dependent approaches (Fisher and Triplett, 1999). ARISA has also been successfully explored
for evaluating community dynamics in the model ecosystem proposed here. It has been used
to observe the microbial community dynamics in the context of evaluation of biodegradability
during mesophilic and thermophilic municipal solid waste anaerobic digestion (Limam et al.,
2014). It has also been used to explore succession of microbial community in the study
methanogenic pathway during thermophilic anaerobic digestion, where the archaeal and

33
bacterial community structures along the incubation have shown to be analyzed by ARISA
and the number, position and density of the bands on the ARISA profile have been used to
explore microbial dynamics (Lin et al., 2013). While ARISA measures diversity at the
genomic level and flow cytometry measures diversity at the morphological level, the
comparison between the two will be a stepping stone towards a potential complementarity and
integration into routine bioprocess monitoring pipeline.
4.2. Materials and methods
4.2.1. ARISA analysis
Samples for DNA isolation were collected accompanying the flow cytometry sampling.
Total genomic DNA was extracted from 1.5 mL of leachates from each assay using the
MoBio PowerFecal DNA Isolation Kit (MoBio Laborataries, Inc., Carlsbad, CA) following
manufacturer’s instructions. Purity of the extracted DNA was determined by measuring the
260/280 nm absorbance ratios. The extracted DNA samples were stored at -20oC before
analysis. ARISA was conducted as described by Fisher and Triplett (1999) with the following
modifications: DNA in the range of 15 to 250 ng was used for ARISA analysis. Each PCR
reaction contained 10 pmoles of each primer pair; five primer pairs were tested for each DNA
sample, and 4 µl of Taq 5X mix (New England BioLabs) in a total volume of 20 µl. The
reaction was run on a thermocycler using touchdown PCR at 95oC (30 s), [95
oC (30 s), 65
oC
(30 s)-0.5oC/cycle, 68
oC (1:00 min) x 20 cycles], [95
oC (30 s), 55
oC (30 s), 68
oC (1:00 min) x
16 cycles], 68oC (7 m). The resulting PCR products were confirmed by agarose gel
electrophoresis, then diluted three fold and sent for fragment analysis at the W. M. Keck
Center for Comparative and Functional Genomics at the University of Illinois at Urbana-

34
Champaign. DNA samples were analyzed by denaturing capillary electrophoresis using an
ABI 3730XL Genetic Analyzer (Applied Biosystems Inc.).
Table 4-1. Primers for ARISA analysis.
Primer Sequence (5’-3’) Reference(s)
Bacterial
1406F FAM-TGYACACACCGCCCGT (Cardinale et al., 2004)
23Sr GGGTTBCCCCATTCRG (Cardinale et al., 2004)
S-D-Bact-1522 FAM-TGCGGCTGGATCCCCTCCTT (Cardinale et al., 2004)
L-D-Bact-132-a-A-18 CCGGGTTTCCCCATTCGG (Cardinale et al., 2004)
ITSF FAM-GTCGTAACAAGGTAGCCGTA (Cardinale et al., 2004)
ITSReub GCCAAGGCATCCACC (Cardinale et al., 2004)
Fungal
2234C GTTTCCGTAGGTGAACCTGC (Ranjard et al., 2001)
3126T-56 FAM-ATATGCTTAAGTTCAGCGGGT (Ranjard et al., 2001)
Archaeal
1389F FAM-ACGGGCGGTGTGTGCAAG (Qu et al., 2009b)
71R TCGGYGCCGAGCCGAGCCATCC (Qu et al., 2009b)

35
Electrophoresis conditions were 63oC and 15 kV with a run time of 120 m using POP-7
polymer. DNA fragment sizes were calculated using the Peak Scanner 2 software package
(Applied Biosystems Inc.) using a threshold of 100 to 500 fluorescence units. The primers
used are described in Table 4-1. All oligonucleotides were synthesized by Integrated DNA
Technologies.
4.2.2. Statistical analysis
The total peak area for each peak was normalized by dividing the area of individual
peaks by the total fluorescence detected in each sample run. The inter sample variability in the
ARISA data set was obtained by first making a matrix of distances between each observation
and then obtaining distribution of distances of points within replicates. The primary tools used
for ARISA data analysis was the Euclidean Distance Matrix. ARISA profiles were analyzed
using PeakScanner Software (Applied Biosystems Inc.). The base pair lengths were quantized
to 4 units and the area was normalized. One of the bacterial primers listed in Table 4-1,
archaeal primer and fungal primer were concatenated and the area was normalized for every
reading for individual primers. The between and within sample variability was obtained in the
same manner as flow cytometry data. To obtain the significance of difference between the
between sample variability distribution and the within sample variability distribution,
Kolmogorov- Smirnov Test was performed.
4.3. Results and discussion
4.3.1. Inter sample variability
Figure 4-1 shows the inter sample variability for ARISA data while Figure 4-2 shows the
inter sample variability in the flow cytometry data set. All the between sample variabilities

36
were clearly larger than the within sample variabilities, indicating that there is a significant
difference between the two distributions. This test is crucial to determine if the distance
between replicates is smaller than the average distance between treatments.
Figure 4-1. Inter sample variability in ARISA dataset (D+ = 0.4246, p-value = 1.894e-07).
Figure 4-2. Inter sample variability in flow cytometry dataset (for RMSD 3D voxel: D+ = 0.6208, p-value = 2.2e-16).
0.0
2.5
5.0
7.5
10.0
0.1 0.2 0.3
dist
de
nsity type
Between
Within
3D Voxel FSC−AmCyan FSC−SSC SSC−AmCyan
0
1
2
3
1e−04 1e−03 1e−04 1e−03 1e−04 1e−03 1e−04 1e−03
dist
de
nsity type
Between
Within

37
The within sample variability is a distribution of distances of points within replicates.
Two-sample Kolmogorov-Smirnov test suggested that the cumulative distribution function
(CDF) of the within- sample variability is greater than that of the between-sample variability
and the comparison of D+ value suggests that flow cytometry data set may be considered more
reliable than ARISA data set. This statistical comparison of data sets between flow cytometry
and ARISA is the first of it’s kind and immensely relevant in today’s era because flow
cytometry is rapidly becoming popular technique for microbial characterization (Pedreira et
al., 2013) thanks to its merits with low per sample cost and capability of producing rich high-
dimensional information (Müller and Nebe-von-Caron, 2010) and hence it’s crucial to
establish flow cytometry’s reliability as a routine bioprocess monitoring tool.
4.3.2. Multidimensional spacing analysis
The multidimensional scaling plots from the distance matrices obtained separately from
flow cytometry and ARISA data are shown in Figure 4-3 and 4-4, respectively. All the peak
value samples cluster separately from the 5 d samples in the ARISA plots with the exception
of GLUC_1. On contrary, NONE_5, NONE_O, ACET_5 and SLUD_5 clustered separately in
the flow cytometry plot. As expected, the ARISA plot indicated a similarity between ACET_5
and NONE_O. The reason for distance similarity between ACET and NONE could be that
acetate treatment was administered to enrich methanogens since they consume acetic acid to
generate methane gas (Berg et al., 1976). Interestingly, as illustrated in Figure 3-7, the
putative methanogens i.e. samples fed with acetate, sludge and blank samples reached the
peak biogas production on day 2. Due to the distinctive clustering from rest of the carbon
sources fed samples, cytometric fingerprints of putative methanogens obtained by flow

38
cytometry in real time can be considered as a promising high- throughput tool for routine on-
site monitoring of anaerobic digesters (Kinet et al., 2016).
Figure 4-3. Multidimensional spacing plots for flow cytometry data.
Figure 4-4. Multidimensional spacing plots for ARISA data.
.
39
4.3.3. Correlation between flow cytometry and ARISA data
In the interest of obtaining correlation between ARISA and flow cytometry data, the
flow cytometry data was reduced to include only those points present in the ARISA data set.
In order to see if the distance of any sample from the NONE_0 sample in the ARISA space be
predicted from the distance of that sample from the NONE_0 sample in the flow cytometry
space, a linear model was constructed as shown in Figure 4-5.
The SLUD_2, GLUC_5 and PROP_5 stood out as outliers in the model as evident from
Figure 4-6. This exception can be attributed to the fact that the ecological dynamics of these
syntrophic and resilient populations (J. J. Werner et al., 2011) may not be evident in the flow
cytometry based methodology demonstrated here. Flow cytometry looks more at the
morphology of the cells (Müller and Nebe-von-Caron, 2010) while ARISA is more of the
genetic technique exploiting the highly conserved Internal transcribed spacer (ITS) region
(Fisher and Triplett, 1999). Further analysis of ARISA data might resolve this divergence
since a single organism may contribute more than one peak to the ARISA community profile,
also unrelated organisms can also have similar spacer lengths, which leads to underestimation
of community diversity (Fisher and Triplett, 1999). The precise sizing information from
ARISA profiles could be used to identify the major bands of interest in a separate manual
polyacrylamide gel, which could then be further, characterized through band excision and
subsequent sequencing as illustrated by Fisher and Triplett (1999).

40
Figure 4-5. Flow cytometry RMSD 3D vs ARISA distance model.
Figure 4-6. Normal Q-Q plot for flow cyometry vs ARISA distance model.

41
Even though these two methodologies look at totally different aspects, the observed
similarities in the clustering of most of the samples illustrate that one can be used in place of
the other to study the complex microbial population dynamics. Recent studies concluded that
even though there was a lack of significant correlation at genus or species level, same
phenotypical profiles of microbiota during assays matched to several 16S rRNA gene
sequencing ones (Kinet et al., 2016). Due to high-throughput nature of flow cytometry, a
large, curated multi-dimensional flow cytometry dataset can be routinely generated and
applied for screening and exploratory purposes in bioprocess monitoring with an automated
software toolchain to access and analyze this information.
4.4. Conclusion and future research directions
Flow cytometry was found comparable to traditional culture-independent techniques like
ARISA. While ARISA measures diversity at the genomic level and flow cytometry measures
diversity at the morphological level, there was an observed complementarity between the two
measures. The flow cytometry-ARISA based method was sensitive enough to changes within
5 d of perturbation to the community.
Even thought the proposed methodology does not rely on traditional species or subtype-
level enumeration of microbial species within a consortium to derive a classification scheme,
cell sorting can improve community structure analysis on the basis of segregating various
clusters in gated community. The approach has the advantage that sorted cells can be further
investigated on various levels towards the cells’ genome, transcriptome or proteome. This will
enable quantitative and more precise community resolution since quantitative information is
often lost during whole community PCR-based approach. This is especially important when

42
low abundant sub-communities are of interest. The utility of the flow cytometry in quickly
analyzing the dynamics and trends in microbial community has been established and alleged
constraints about specificity can be addressed using various approaches as mentioned in
previous chapter.

43
5. Machine learning analysis of flow cytometry data using H2O.ai
Flow cytometry allows measuring single cells into unprecedented depth. This unique
power of flow cytometry has revolutionized the field of biology, medicine, ecology and
environment. While this is exciting, on the other hand this means we will be generating new
types of high-throughput datasets at rapid pace, which would demand incorporating the novel
computational techniques that efficiently mine single cell data sets. In this section, utility of
one of the recent machine learning techniques called ‘Deep Learning’ has been explored for
single cell data analysis, comparing it with traditional multivariate data analysis in community
ecology and highlighting interesting avenues that might lead to novel algorithm development
in the future incorporating a community physiology angle.
5.1. Background
During the past 50 years, flow cytometry has established it’s reputation as a high
throughput tool for single cell analysis (Fulwyler, 1965). Currently, there are over 100
companies in the flow cytometry business worldwide constituting more than $3 billion
(Robinson and Roederer, 2015). Since its genesis in 1965 (Fulwyler, 1965) and since it started
becoming more popular in 1970s (Gray et al., 1975), the basic design of flow cytometers has
remained almost unchanged, emphasizing the robustness in the design of the technology.
With the advancement of key technologies in cytometry, the number of parameters that
can be measured simultaneously from single particles have increased multifold most notable
of which are with the addition of more powerful lasers (Saeys et al., 2016). It has become
routine for many labs to use 18-parameter flow cytometry on daily basis (Perfetto et al.,
2004). The 30-parameter flow cytometers have started becoming available commercially in

44
the recent past and it’s being reported that 50-parameter flow cytometry is forecasted to be
available soon (Chattopadhyay and Roederer, 2012). This number will keep on increasing in
the coming years and theoretically it’s possible to measure upto 100 parameters per cell
(Saeys et al., 2016). Furthermore, there is another group of researchers who are interested in
combining cytometry with imaging for instance in tissue engineering (Giesen et al., 2014).
A novel combination of rapidness, high-throughput nature of flow cytometry, combined
with the increasing capacity to measure more and more cell parameters at once, will lead to
massive, high-dimensional datasets in not so distant future. There would be limitation on how
much the traditional community ecology tools or classical, mostly manual, analysis techniques
will be useful in analyzing this huge multidimensional datasets. Therefore there is a gap in the
development of novel computational techniques and their adoption by the broad community.
This exercise attempts to exploit open-source user-friendly platforms in machine learning
to analyze flow cytometry data generated in the anaerobic microbiome perturbation
experiments. The applications to the real world anaerobic digesters and nanotoxicity have
been discussed in the next chapter. The major drawback of this exercise is the limitation on
the size of the dataset we can generate from the wet lab experiments. With the more and more
data coming in from further research in the current lab as well from other researchers, the
performance is expected to increase drastically.
5.2. Approach
Experimental set-up and flow cytometry analysis were performed in the similar manner
explained in the 'Materials & Methods' section of Chapter 3. For the machine learning based
analysis, the .fcs files for the 5 days experiment obtained from a Biosciences LSR II Flow
45
Cytometry Analyzer were imported. To keep the number of nodes in the input layer to a
reasonable number, only 10000 events from each fcs data set were chosen and only the "FSC-
A", "SSC-A" and "AmCyan-A" columns were considered from each field. Each fcs file of
100000 events were split into 10 files of 10000 events each, and placed in a data frame. Each
data frame was labeled with the corresponding carbon source. Data from the third replicate
was split into two parts, one part was used as the validation data set and the second was used
as the test set in each case.
For the clubbed flow frames analysis, the sample names were clubbed as per the
conceptual division of putative microbial groups in anaerobic digestion process. The four
groups were: 1) Putative hydrolyzes represented by "HYDRO" which were samples fed with
cellulose (CELL) 2) Putative acidogens represented by "ACIDO" which were samples fed
with glucose (GLUC) 3) Putative synothrophic acetogens represented by "ACETO" which
were clubbed samples fed with propionate (PROP) and butyrate (BUTY) individually 4)
Putative methanogens represented by "METHA" which were clubbed samples fed with
acetate (ACET), sludge (SLUD) individually as well as those fed with no carbon source
(BLAN and NONE). The reason behind clubbing ACET, SLUD, BLAN and NONE into
METHA putative group was because all these samples were supposedly methanogenic
samples with acetate utilizing methanogens were the predominant group in the waste water
treatment plant anaerobic digesters (Li et al., 2013).
H2O.ai server was set-up as per instructions (http://www.h2o.ai/) and the data was
uploaded in individual csv files. H2O’s Deep Learning algorithm has been primarily used for
building the models. The Deep Learning algorithm is based on a multi-layer feed-forward
artificial neural network that is trained with stochastic gradient descent using back-

46
propagation. The default "RectifierWithDropout" was been selected for activation. The
network contained input_dropout_ratio = 0.1,hidden_dropout_ratios = c(0.2, 0.2, 0.1) and a
default hidden layer sizes (hidden=c(2000,1000,500)) were used. Number of epochs (i.e.
number of times to iterate the dataset) were selected to 10. To add stability and improve
generalization, either L1 or L2 regularization was used with the value of 1e-5 each.
5.3. Results and discussion
5.3.1. Trends in the machine learning predictions are comparable to traditional
statistical analysis
Figure 5-1 shows the results of the deep learning model. The idea was to see how did the
model perform in classifying sample vs predicted carbon sources. In accordance with the
results from classical multivariate analysis listed in the Chapters 3 and 4, GLUC looked very
different from the rest and is perfectly classified, followed by PROP followed by SLUD.
NONE and BLAN got misclassified. As discussed in the Chapter 3, the increased distance
with delay in the autocorrelation function analysis suggests a divergent culture, as seen in
GLUC whereas PROP and BUTY were rather stable. ACET and the controls (NONE, SLUD)
showed similar behavior (increasing sharply for a delay of 4). Similarly, as shown the
autocorrelation analysis on flow cytometry data with day-to-day changes (Figure 3-9), GLUC
shows a distinct pattern in reaching a stable extremum in the colony structure, which is a point
corresponding to minimum change. Furthermore, as shown in the MDS plot in Figure 4-3,
both the peak value and non-peak value GLUC samples cluster separately in the Flow
Cytometry plots, which is in accordance with the results from the deep learning model. Also,

47
NONE_5, NONE_O, ACET_5 and SLUD_5 clustered separately in Flow Cytometry MDS
plots which resemble to NONE, ACET and SLUD misclassification evident in Figure 5-1.
Figure 5-1: Carbon sources prediction with H2O's deep learning algorithm.
The machine learning approach to the flow cytometry and microbial ecology dataset is
still in its infancy but the results presented here demonstrate that it has much greater potential.
Compared to the tradition microbial ecology statistical analysis (like MDS or PCA), it is very
fast and therefore more useful. Further all the important variables were <V1000, which are
mostly FSC variables. Hence FSC corresponding to cell size and morphology stand out as the
most important predictor. With the advancement in the high-throughput nature of flow

48
cytometry, combined with the increasing capacity to measure more cell parameters at once, a
massive and high-dimensional datasets on a routine daily basis would be generated in future
and would add to the predictive power of the machine learning based approach.
Figure 5-2: Clubbed carbon sources predictions.
5.3.2.MSE reconstruction with autoencoder
Figure 5-3 shows the results from the H2O.ai’s DL autoencoder analysis. In an
attempt to determine which data looks the `weirdest', an autoencoder option was turned on,
which does a dimensional reduction type analysis. H2O.ai’s DL autoencoder is based on the
standard deep (multi-layer) neural net architecture, where the entire network is learned

49
together, instead of being stacked layer-by-layer. The only difference is that no response is
required in the input and that the output layer has as many neurons as the input layer (Le,
2015).
Figure 5-3: Reconstruction MSE for DL's Autoencoder for carbon sources parsed with days.
It’s obvious from the figure that ‘CELL’ and ‘GLUC’ looks very different. Coincidentally
day 2 is a peak biogas production for CELL with 272 mL while other days were in the range
of 25-40 mL. If this is compared with the clubbed predictions as shown in the Figure 5-2,
HYDRO (i.e.'CELL') is predicted more like 'ACETO' than itself in this model, which is same

50
as 'CELL' - 'PROP' clubbing observed previously. There might be a physiological explanation
for this phenomenon as reported by previous studies (Aydin et al., 2015; Blasco et al., 2014;
Čater et al., 2013; Ito et al., 2012; Venkiteshwaran et al., 2015). Smithllela, Syntrophobacter,
and Pelotomaculum might have the ability to break down CELL faster than classical
hydrolyzers like Clostridium or have greater doubling time (Batstone et al., 2009). As
mentioned in the section above, ACIDO (i.e.'GLUC') predicted very well. Interestingly
ACETO (i.e.'PROP' and 'BUTY') also got predicted well. These syntrophic acetogenesis are
believed to be very important in maintaining stable and robust anaerobic operation (Ariesyady
et al., 2007a; Fernandez et al., 2000). PROP species fall in the genera Smithllela,
Syntrophobacter, and Pelotomaculum (Ariesyady et al., 2007b) while BUTY species in the
genera Syntrophus and Syntrophomonas (Ahring and Westermann, 1987). There have been
reported phenotypic/physiological similarities between species of these two genera that may
explain this trend (Khanal, 2008; Narihiro and Sekiguchi, 2007).
5.3.3. Model comparison for predictive capabilities
Table 5-1 lists prediction MSEs for the different models in the H20.ai's supervised
learning data science algorithms suite. The efficiency in terms of speed and resources for
model optimization, training and validation would be altogether different track of inquiry and
it was not used for comparison in the proposed approach. The objective of this exercise was to
see if one algorithm is better at predicting putative microbial group phenotypes than other.
Deep Learning (DL) performed better overall with 33.47% prediction MSE followed by Naive
Bayes (NB) (39.19%), Gradient Boosting (GB) (39.52%) and Distributed Random Forest
(DRF) (40.93%). The results are in concordance with the similar supervised model

51
comparison studies where feedforward neural nets have been concluded to perform best and
are competitive with some of the algorithms (Caruana and Niculescu-Mizil, 2006).
Methanogens are considered as the driving microbial group in anaerobic digesters
(Daniels, 1984) and DRF performed the best in predicting putative methanogens from the
controlled experiments with the prediction MSE of as low as 5.67%. GB is the next best
model with prediction MSE of 14.25%. NB and DL performed surprisingly poor with
prediction MSEs of 53.68% and 67.08% respectively. The better putative methanogens
predicative capability of DRF can be attributed to the fact that with a given dataset, DRF
generates a forest of classification (or regression) trees, rather than a single classification (or
regression) tree. Each of these trees is a weak learner built on a subset of rows and columns
(Geurts et al., 2006). More trees will reduce the variance. Both classification and regression
take the average prediction over all of their trees to make a final prediction, whether
predicting for a class or numeric value.
The limitations of the DL in predicting methanogens were also evident in the clubbed
prediction as shown in the Figure 5-2 where METH contradicted the expectations.
Physiologically it may be it's too short of a time to get distinguishing phenotypic signatures
for DL algorithm at the single cell level for i) acetoclastic methanogens that use the
acetoclastic pathway to produce methane and carbon dioxide from acetate, ii)
hydrogenotrophic methanogens that use hydrogen to reduce carbon dioxide to methane via the
hydrogenotrophic pathway, and iii) methylotrophic methanogens that produce methane from
C1 compounds, such as methanol, methylamines, and methyl sulfides, through the
methylotrophic methanogenesis.

52
Table 5-1. Machine learning model comparison (values in the boxes are prediction errors; smaller the better).
Acidogens and acetogens are the middle groups in the anaerobic digestion hierarchy and for
this mid-tier putative microbial groups, DL performed the best with 1.60% and 20%
prediction MSEs for putative acidogens and acetogens respectively. NB has a comparable
performance with 2.93% prediction MSE putative acidogens and 37.47% for putative
acetogens. DRF and GB didn’t do well for these groups. The whole stability of bioreactors is
dependent on engineering acid build up and acid removal and with great predictions from
ACIDO and ACETO; DL seems to be doing a great job in predicting that middle level
hierarchy. Hydrolyzers are basically the samples fed with cellulose and NB and DL were
comparable in terms of prediction MSEs (32.80% and 35.20% respectively). As mentioned
earlier, FSC variables (depicting size and morphology of individual cells) are the deciding
variables and DL appears to be best at classifying cells based on it’s size and morphological
features.
Putative Groups Deep Learning Distributed
Random Forests
Gradient
Boosting
Naïve Bayes
Hydrolyzers 0.3520 0.7173 0.6293 0.3280
Acidogens 0.0160 0.2560 0.2587 0.0293
Acetogens 0.2000 0.8960 0.7507 0.3747
Methanogens 0.6708 0.0567 0.1425 0.5358
Overall 0.334668 0.4093 0.3952 0.3919

53
5.4. Conclusions and future research directions
The high-throughput nature of flow cytometry, combined with the increasing capacity to
measure more cell parameters at once, warrants novel computational techniques to handle
massive and high-dimensional datasets on a routine basis. With the limited dataset from the
carbon source perturbed anaerobic microbiome, the machine learning algorithms were found
to be very fast and comparable to the tradition microbial ecology statistical analysis. FSC
variables depicting cell size and morphology stood out the most important variable for the
classification purpose. Community perturbed with the controlled addition of glucose and
cellulose looked different than the normal community and that with the controlled addition of
other carbon sources. Model comparison exercise based on predictive capabilities concluded
that DL was best at predicting overall community but DRF was best for predicting the most
important putative microbial group in the anaerobic digesters viz. Methanogens.
In addition to classical multivariate analysis techniques, the research community in the
microbial ecology, clinical biology and the single cell analytics need to adapt to the rapidly
developing novel computational techniques. While each experiment will have its own specific
challenges, scalability may be an issue in the future particularly while dealing with large
datasets (containing millions of cells) and with increasing dimensionality (such as gene
expression on single cell level). Furthermore the most challenging part from the researcher’s
point of view would be obtaining sufficient data quality and striking the golden balance
between the computational and biological variations and incorporating this flexibility in the
algorithm development in the future. While this field is quickly developing, the presented
small exercise will be a stepping-stone towards making sense of high-dimensional single cell
data in the complex microbiome.

54
6. Applications of the proposed flow cytometry based methodology
The rich multidimensional information from flow cytometry along with fast machine
learning algorithms have been put to test for rapid characterization of the dynamics of
microbial communities in industrially relevant anaerobic systems. The utility of flow
cytometry based method has also been demonstrated in a fully functional industry scale
anaerobic digester to distinguish between microbiome compositions caused by varying
hydraulic retention time (HRT). Potential utility of the proposed methodology have been
demonstrated for monitoring the syntrophic resilience of the anaerobic microbiome perturbed
under nanotoxicity.
6.1. Applications in monitoring community dynamics in operational municipal
anaerobic digester
Anaerobic bioprocess plays a significant role in overall municipal wastewater treatment
worldwide (Brar et al., 2010). One of the important factors to consider for both the waste
treatment and resource recovery in municipal wastewater treatment is HRT, which indicates
the time the waste remains in the reactor in contact with the biomass (Zhang et al., 2006).
Rate of microbial metabolism decides the time required to achieve a given degree of treatment
(Elefsiniotis and Oldham, 1994; Rincón et al., 2008). Simple compounds like glucose gets
readily degraded hence requiring small HRT while complex wastes like halogenated organic
compounds would degrade slowly and hence demand longer HRT (Khanal, 2008). HRT is
considered as a deciding factor in process design for complex and slowly degradable organic
pollutants (Speece, 1996). Further HRT is crucial for maintaining the right balance between
acetoclastic and hydrogenotropic methanogens and hence play a crucial role in maintaining

55
the process stability in anaerobic digesters (Khanal, n.d.; Rincón et al., 2008). A quick, on-line
monitoring tool for HRT in light of microbiome metabolism and dyanamics would be
promising for routine on-site monitoring of anaerobic digesters.
6.1.1. Approach
The waste activated sludge used in this study was withdrawn from the secondary
settling tank of a municipal wastewater treatment plant of UCSD as shown in the Figure 6-1..
This stream is often called activated sludge and is the recycled fraction of wastewater
(Safoniuk, 2004). The dry solids in the sludge consist mostly of biodegradable organic
compounds, followed by a substantial amount of inorganics and a small amount of toxic
organics (Kolat and Kadlec, 2013). The organic fraction typically consists of paper fiber, food
waste, and fecal matter; the inorganic fraction often contains sand and other miscellaneous
grit (Barber, 2014). The composition of the sludge can vary greatly from day to day and even
hour to hour (Vanrolleghem and Lee, 2003). For UCSD experiments, samples were collected
on Day 1, 2, 4, 14 and 26 from Digester 1 (DIG 1) and Digester 2 (DIG 2) in order to capture
the microbiome dynamics beyond the usual residence time. Both the digesters have a same
volume but different flow rates making them operational at different Hydraulic Retention
Times (HRTs). DIG 1 has the HRT of 13 d while DIG 2 has the HRT of 26 d. In order to
explore potential applications of flow cytometry in detecting changes in the microbial
community at the industrial scale anaerobic digesters, the focus of the present study was on
differences caused by varying HRTs.

56
Figure 6-1. Schematic of UCSD's wastewater treatment plant showing position of anaerobic digester in the process.
For autofluorescence control experiments, E. coli HB101 strain was obtained from
Promega, Madison, WI in which bacterial cells were grown overnight at 37°C then diluted
1:100 into 10 ml of fresh LB medium to the optimal optical density (OD) (Rezaeinejad and
Ivanov, 2013) in a 50-ml tube and grown at 37oC to an OD600 of ~1.0. 1:100 diluted
subcultures were then grown in 5 mL of 3 different LB concentrations (10mg/L, 20 mg/L and
40 mg/L). Multiple samples were collected during different growth phases and the flow
cytometry analyses were performed as described.
6.1.2. Flow cytometry detects changes in the microbial community at different HRTs
Multidimensional spacing (MDS) plot-demonstrating clusters based on the RMSD3D
tool (described in Chapter 3) for the samples obtained UCSD’s DIG 1 and DIG 2 at different
time points has been shown in Figure 6-2. As evident from the MDS plots, all the DIG 2
samples cluster separately from DIG 1 samples with the exception of 3 d sample. The
difference in the clustering can be explained with the help of previously published studies
depicting variations in microbial abundance and composition in anaerobic digesters with

57
different HRTs (Sasaki et al., 2011; Zhang et al., 2006). For each of the samples, DIG 2 shows
a similar fraction of live cells as DIG 1 and the ratio of live cells between different digesters is
constant at 1.04 ± (1 Std. Dev.). As shown in the Appendix A5, the deep learning algorithm
mentioned in Chapter 5 worked best for DIG 2 (K) than DIG 1 (E) pointing to the potential
limitation in the utility of this approach to shorter HRT systems.
Figure 6-2. MDS plot showing clustering of samples obtained from different anaerobic digesters
Live cell percentages in two different functional digesters at UCSD have been shown
in Appendix A2. The main microbial populations of these digesters, belonging to the domains
of bacteria and archaea were identified by use of ribosomal oligonucleotide probes (Table 4-1)
as used in the ARISA experiments explained above and the results are presented in Appendix
A2. In both HRT conditions, bacterial bands were much more obvious than archaeal
suggesting that the bacteria represented the major microbial group, while the archaea
constituted the minor but significant group of microorganisms which is in agreement with the

58
previous work (Raskin et al., 1994). The results of the flow cytometry studies on fully
operational industrial scale UCSD’s anaerobic digesters suggests that different setup of HRT
shows significant impact on the percentage of dead cells in AD community. In agreement with
the preciously published work, methanogenic pathway and community structure in anaerobic
digesters are affected by HRT along with other parameters (Sasaki et al., 2011) and
importance of HRT as significant hydrodynamic selection on the mixed-microbial populations
to establish a stable microbial population (Zhang et al., 2006), this comparison studies on the
live cell percentages in two digesters shows a DIG 2 has a smaller fraction of live cells than
DIG 1. All the published work in this domain is based on ascertaining the species composition
of the culture using 16S rDNA genes separated by denaturing gradient gel electrophoresis
(DGGE), which is labor intensive, time consuming and suffers biases as described previously
(Müller and Nebe-von-Caron, 2010).
6.1.3. Role of autofluorescence in elucidating overfed vs underfed microbiome
Alexa Fluor 488 mean frequency for DIG1 is always greater than that in DIG 2 (p-value
< 0.001 for the paired two-sample test). In order to confirm the validity of this experiment, the
control monoculture experiment was performed with E. coli. Various molecular markers like
DAPI, SYBRgreen, SYTO etc. have been used previously for discriminating microbial cells
on the basis of their DNA content (Koch et al., 2014a, 2013c; Müller and Nebe-von-Caron,
2010). In this work, no label is involved and discrimination is made on the basis of
autofluorescence since its proven to be a good discriminant based on the most commonly
observed autofluorescencing molecules like NADPH and flavins (Monici, 2005).

59
Autofluorescence, as measured by Alexa Fluor 488 channel in flow cytometer is
likely from flavin. This autofluorescence can also be used to detect changes in microbial
community at different HRTs. The control monoculture experiment was performed with E.
coli demonstrates 3 distinct curves for flavin autofluorescence (measured with Alexa Fluor
488 channel in flow cytometer) for 3 different LB concentrations as shown in Appendix A3.
These results are in accordance with the previous study (Renggli et al., 2013) that has shown
that E. coli treated with different bactericidal antibiotics exhibits increased autofluorescence
when analyzed by flow cytometry and hence this control experiment validates the presented
autofluorescence results from UCSD. Even though the flavin based autofluorescence needs
further confirmation with the protein characterization studies (Mukherjee et al., 2013) which
is out of the scope of present work, we believe that the idea has a potential to be transformed
into the non-invasive, rapid, high throughput tool for routine bioprocess monitoring.
Flow cytometry can provide this information in a high throughput manner since it is
fast, requires small sample volumes and minimal sample preparation. All the steps can be
performed in less than an hour and hence has a potential to be used for controlling biogas
reactor based on HRT. The ability of flow cytometry to rapidly detect changes in microbiome
composition and dynamics caused by varying HRTs in fully functional industrial scale
anaerobic digester is a major step towards it’s application in monitoring and potentially
controlling biodigesters in the future.
6.2. Applications in evaluating microbiome resilience
The widespread use of engineered nanomaterials is faced with a skeptical and
demanding public for their potential environmental risks (Abdelsalam et al., 2016). With the

60
increasing diversity of engineered nanomaterials in commercial products, there is a need to
monitor potential consequences of their release into the environment. With the increasing use
of nanomaterials in daily activities, commercial products and industry, wastewater treatment
plants are the receptors and possible gateway for release into the environment (Brar et al.,
2010). Because of the hydrophobic nature of most of the engineered nanomaterials, they will
strongly partition into the biomass in wastewater treatment plants (Nyberg et al., 2008) and
ultimately adsorb into the waste activated sludge fed to anaerobic digesters (Westerhoff et al.,
2011).
As anaerobic digestion is the standard stream for energy generation (biogas) and waste
reduction, any perturbations in the waste stream contributes to the perturbations in the
anaerobic digester. The functional stability of the anaerobic bioreactor is an emerging
property of the dynamic interaction within the microbial communities (J. J. Werner et al.,
2011). However as discussed in Chapter 2, the strict anaerobic requirements are an
impediment to the high throughput monitoring of underlying microbial communities. In this
section, an effort has been made to demonstrate the utility of flow cytometry based method
along with machine learning algorithm to be used as a potential tool for monitoring the
syntrophic resilience of the anaerobic bioreactor microbial communities. If successful it will
be an ideal, real time tool that is quick, simple to use by plant operators and effective.
6.2.1. Approach
An experimental set-up used for this section is similar to the one described in Chapter 3.
The deep learning algorithm described in Chapter 5 is used as the analytical tool for this
section as well. The chemical properties of the sludge used in this research are summarized in

61
Table 6-1. The sludge samples were mixed with various nanoparticles in low (L) 1 mg/g-TS
and high (H) 10 mg/g-TS concentrations, which are considered environmentally relevant for
assessing nanotoxiciy (Mahapatra et al., 2015). Plain sludge with anaerobic inoculum from
active anaerobic digesters but no nanoparticles added was set up as a positive control (PCH)
and anaerobic inoculum from the active anaerobic digesters without sludge or nanoparticles
was set up as a negative control (NCL). The alleged toxic impact of nanoparticles on
anaerobic digestion process was quantified by monitoring the biogas production on a daily
basis along with gas composition, TCOD, SCOD and VFA production on biweekly basis.
Drawing the samples for flow cyometric analysis every week helped build the cytometric
fingerprints of the perturbed community, which forms the basis for subsequent machine
learning analysis. TINPs are titanium(IV) oxide, anatase nanopowder, <25 nm particle size,
99.7% trace metals basis, specific surface area 45-55 m2/g obtained from Sigma Aldrich
(Catalog # 1317-70-0 ). FENPs are iron nanopowder, 25 nm average particle size, 99.5% trace
metals basis from Sigma Aldrich (Catalog # 7439-89-6). CNTs are multi-walled carbon
nanotube which are reported thin and short, <5% Metal Oxide powder also from Sigma
Aldrich (Catalog # 308068-56-6).

62
Table 6-1. Chemical properties of wastewater sludge.
Total Chemical Oxygen
Demand (TCOD) (mg/L)
42,308 ± 3721
Soluble Chemical Oxygen
Demand (SCOD) (mg/L)
5028 ± 865
Total Solids (TS) (g/L) 33.8 ± 0.9
Volatile Solids (VS) (g/L) 29.3 ± 1.1
pH 6.2 ± 0.7
Ammonia (mg/L) 180 ± 12.8
6.2.2. Flow cytometry based method can capture functionally redundant microbiome
For the nanoparticles tested, none showed the toxic impact on anaerobic digestion
process observed in terms of biogas production, methane composition, TCOD/SCOD
reduction and VFA accumulation with respect to both positive and negative controls. The
results are in agreement with the most reported nanotoxicity on waste processing studies
(Chen et al., 2014; García et al., 2012; Li et al., 2015; Yang et al., 2013a). Similarly, nano-
TiO2 in doses up to 150 milligram per gram total suspended solids (mg/g-TSS) showed no
inhibitory effect and the methane generation was the same as that in the control (Mu et al.,
2011). (Nyberg et al., 2008) has studied exposure of biosolids from anaerobic wastewater
treatment to fullerene (C60) in order to model an environmentally relevant discharge scenario.
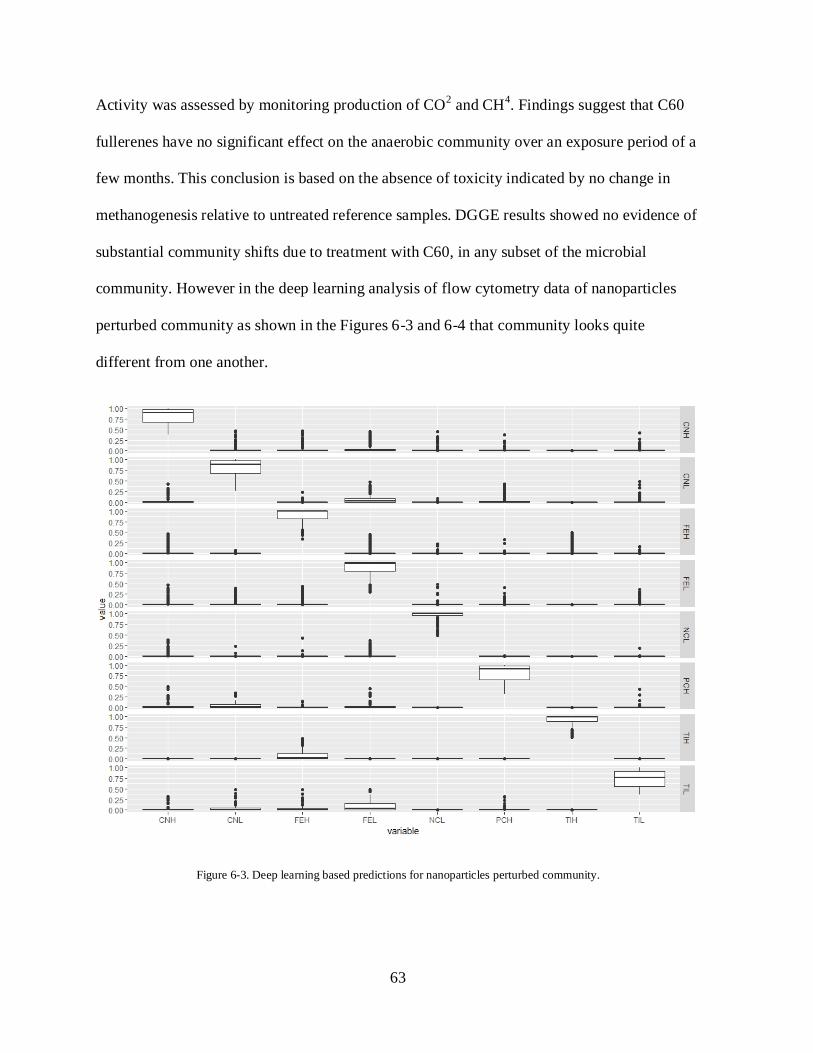
63
Activity was assessed by monitoring production of CO2 and CH
4. Findings suggest that C60
fullerenes have no significant effect on the anaerobic community over an exposure period of a
few months. This conclusion is based on the absence of toxicity indicated by no change in
methanogenesis relative to untreated reference samples. DGGE results showed no evidence of
substantial community shifts due to treatment with C60, in any subset of the microbial
community. However in the deep learning analysis of flow cytometry data of nanoparticles
perturbed community as shown in the Figures 6-3 and 6-4 that community looks quite
different from one another.
Figure 6-3. Deep learning based predictions for nanoparticles perturbed community.

64
As evident from Figure 6-3, each nanoparticle-perturbed community looks different
from one another and hence got predicted very well. TIH and TIL which were TINPs in high
and low concentrations respectively have shown a little deviation and got misclassified as
FENPs community for a few instances. This deviation might be because of the toxic impact of
these nanoparticles to the same trophic level in the microbiome (Ganzoury and Allam, 2015).
Compared to the carbon sources predictions as described in Chapter 5, the positive control
(PCH) and negative control (NCH) got classified better when trained with nanoparticles than
carbon sources. As reported in Chapter 5, the FSC variables are the most relevant in the deep
learning algorithm used in the proposed methodology, and hence since the community shifts
in the context of community morphology are severe under nanoparticles compared (Li et al.,
2015; Zheng et al., 2015) to carbon sources, the controls got classified well.
Figure 6-4. Autoencoder MSE reconstruction for nanoparticles perturbed community.

65
Figure 6-4 is similar to the corresponding figure in Chapter 5 determining which data
looks the `weirdest'. As evident the community perturbed with higher concentration of TINPs
on both the time points and higher concentration of CNTs on earlier time point looks
‘different’ than the normal community. As mentioned earlier, the nontoxicity experiments
were designed considering the environmentally relevant concentrations. With the rapid
development of nanotechnology, nanoparticles (NPs) are now widely used in some industrial
products, such as antibactericide coatings, catalysts, biomedicine, skin creams and toothpastes
because of their unique physicochemical properties of enhanced magnetic, electrical, optical
etc (Bolyard et al., 2013; Eduok et al., 2013). The present exercise with a limited dataset
proves the potential of flow ctyometry based method in monitoring the anaerobic bioprocess
when the community shifts away from it’s normal dynamics. These results may point to the
fact that even though the functional redundancy in terms of biogas production, methane
generation, TCOD/SCOD reduction and VFA accumulation; TINPs and CNTs may be
pointing towards the community that’s on the verge on breaking down (Bolyard et al., 2013;
Kaegi et al., 2013; Yuan et al., 2015). Further analysis on long term nontoxicity experiments
might resolve this divergence (Chen et al., 2012; Otero-González et al., 2014) but the present
exercise opens the door for exploring flow cytometry and machine learning towards high-
throughput tool for assessing nanotoxicity for both lab researchers and field operators.
Even though the results from the present study and the associated literature review
suggests no quantifiable effect of some nanoparticle’s toxicity on anaerobic digestion, some
perturbation of the normal functions with respect to controls in germinating tests was
observed, suggesting the necessity for further research in this field. At the same time, the
66
effect of NP-solvents was sometimes more significant than that of the NPs themselves, a point
that is of special interest for future nanotoxicological study.
6.3. Applications in the proposed campus anaerobic digester
The University of Illinois produces 1500 lbs of paper waste per day that is the best-case
scenario is consolidated at the waste transfer station and sold back to the community. While
relatively sustainable in the recyclables context, there are other options to consider when
dealing with this specific type of waste and others that can be more difficult to manage
including food waste, manure, and other biodegradables. It is, therefore, important to find
ways in making the campus adaptable in managing different wastes, more advanced in
renewable applications, as well as technologically competitive with other universities using
progressive systems. Under the grant from Student Sustainability Committee, the feasibility of
anaerobic digestion process is being evaluated experimentally and at pilot scale and the
proposed methodology has the potential in this widely utilized technology project.
The feedstock used for this section was newsprints from day-old Daily Illini Newspaper
obtained from the waste sorting facility. Newsprint samples were either ground to powder,
shredded to strips in the office paper shredder or whole pieces hand cut to size for required
weight in each experiment. The experimental platform and the analysis pipeline is the same as
mentioned in Chapter 3 and Chapter 5 respectively. The goal was to predict the newspaper
cytometric fingerprints (abbreviated as NEWS) off the carbon sources dataset generated with
the proposed flow cytometry methodology.
Figure 6-5 shows that NEWS community gets predicted very well and the model still
holds on to better predictions with GLUC and CELL as has been observed previously in
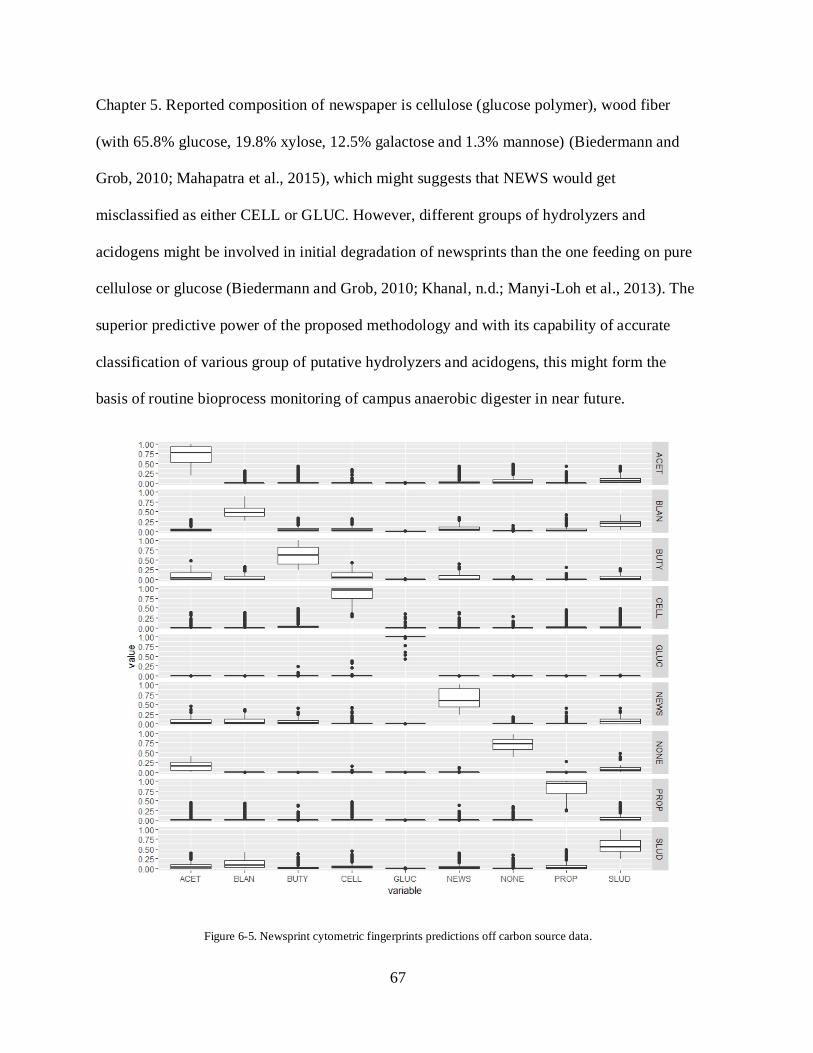
67
Chapter 5. Reported composition of newspaper is cellulose (glucose polymer), wood fiber
(with 65.8% glucose, 19.8% xylose, 12.5% galactose and 1.3% mannose) (Biedermann and
Grob, 2010; Mahapatra et al., 2015), which might suggests that NEWS would get
misclassified as either CELL or GLUC. However, different groups of hydrolyzers and
acidogens might be involved in initial degradation of newsprints than the one feeding on pure
cellulose or glucose (Biedermann and Grob, 2010; Khanal, n.d.; Manyi-Loh et al., 2013). The
superior predictive power of the proposed methodology and with its capability of accurate
classification of various group of putative hydrolyzers and acidogens, this might form the
basis of routine bioprocess monitoring of campus anaerobic digester in near future.
Figure 6-5. Newsprint cytometric fingerprints predictions off carbon source data.

68
Autoencoder model reconstruction MSEs on newsprint dataset are shown in Figure 6-6.
NEWS 1 through 4 represent four data points in the 2 weeks batch of lab-scale anaerobic
biodegradation of newsprint feedstock. As evident from the figure, NEWS 4 looks completely
different than the average community. The autoencoder model run on newsprint dataset
reconfirmed the results presented in Chapter 5 about CELL 2 community being weirdest of
the normal community.
Figure 6-6. Autoenconder reconstruction MSE on newsprint cytometric fingerprints.

69
These results from autoencoder model would be crucial in designing and operating the
campus anaerobic digester since the process would now be engineered considering NEWS 4
as the perturbed time point. The predictive power and ‘weirdest’ data point from the normal
community would have applications in stochastic optimization in classical Chemical
Engineering process design. It has a capability to transform the process engineering paradigm
in which a process designer are currently trained on designs based on throughput rate, process
yield and product purity (Doran, 1995). With the novel combination of cytometric
fingerprinting and machine learning based toolchain, weaknesses in designs could be
identified in much reliable, faster and high-throughput manner allowing process designers and
process engineers to choose better alternatives in real time, bypassing conventional lab-pilot-
operations route.
In addition benefitting the campus with sustainability applications, the proposed tool will
help develop a new tier of digestion technology. Not only will the system be able to degrade
waste more efficiently for energy production but it would also be enhanced with system
controls to be self-sustaining. As the model becomes stronger with more data and further
optimization of parameters, the campus anaerobic digester would be automation capable with
sensors so future maintenance and operation will be minimal. The end results of this self-
sustaining, scaled up operation would not only generate renewable energy but also act as an
educational demonstration model for the campus.

70
7. Conclusions and Future Work
7.1. Major conclusion of this work
The original hypothesis of this work that flow cytometry can classify microbial consortia
based on morphological and metabolic characteristics stood true and the rationale that the
proposed methodology complements existing technologies in rapid characterization of
microbiome dynamics proven to be justified. However in order to make subsequent analysis
more efficient and reduce subjectivity, there is a necessity to develop an automated pipeline to
efficiently analyze the information in cytometric fingerprints.
The major conclusions of this work were as follows:
1. It is possibile to quantitatively discrimination between divergent microbiome using
anaerobic microbial consortia perturbed with the controlled addition of various carbon
sources. Exploiting the three dimensional flow cytometry signals namely cell size (FSC or
forward scatter), cell granularity/morphology (SSC or side scatter) and autofluorescence
(corresponding to the same excitation/emission wavelength as in AmCyan standard dye), it is
possible to monitor and rapidly characterize the dynamics of the complex anaerobic
microbiome associated with perturbations in external environmental factors.
2. Flow cytometry was found comparable to traditional culture-independent techniques like
ARISA. While ARISA measures diversity at the genomic level and flow cytometry measures
diversity at the morphological level, there was an observed complementarity between the two
measures. The flow cytometry-ARISA based method was sensitive enough to changes within
5 d of perturbation to the community.

71
3. With the limited dataset from the carbon source perturbed anaerobic microbiome, the
machine learning algorithms were found to be very fast and comparable to the tradition
microbial ecology statistical analysis. FSC variables depicting cell size and morphology stood
out the most important variable for the classification purpose. Community perturbed with the
controlled addition of glucose and cellulose looked different than the normal community and
that with the controlled addition of other carbon sources. Model comparison exercise based on
predictive capabilities concluded that DL was best at predicting overall community but DRF
was best for predicting the most important microbial group in the anaerobic digesters viz.
Methanogens.
4. The proposed flow cytometry based method demonstrated to be directly applicable in a
fully functional industry scale anaerobic digester to distinguish between microbiome
compositions caused by varying hydraulic retention time (HRT). Further proposed
methodology have been demonstrated to be useful for monitoring the syntrophic resilience of
the anaerobic microbiome perturbed under nanotoxicity the utility of proposed methodology
beyond “Monitoring" and exploring its applications. The proposed methodology has a
potential for better "designing" and "operating" bioprocesses.
7.2. Future research goals
The research presented here demonstrates the utility of novel integration of flow
cytometry with machine learning in facilitating the rapid characterization of the dynamics of
microbial communities. As discussed in Chapter 3, structure and function of microbial
communities manifests as unique combinations, or “cytometric fingerprints” of characteristics
such as viability, metabolic activity, and morphology. Integrating Cytometric Fingerprinting

72
with Machine Learning (CFML) would be a powerful approach to detect changes in the
structure and function of a microbial community in near-real time. Future research direction
would be to improve CFML as a tool that increases the accuracy and throughput of
microbiome characterization. The following specific goals could be targetted in the near
future:
1. Validate CFML as a methodology to allow rapid, high-throughput characterization of the
dynamics of microbial community evolution: A different model community eg. from animal
gut microbiome could be used for validation.
2. Develop advanced analytic tools to automate the task of identifying and classifying samples
based on cytometric fingerprints: Flow cytometry relies on manual gating for feature
extraction. We propose novel algorithms to adapt to the raw data and produce fast
and automated feature detection in flow cytometry samples, which can become the basis of
classification and searching algorithms in an eventual cytometric fingerprinting database.
3. Apply CFML and the automated analytical pipeline to facilitate early detection
of subclinical bovine mastitis: Cytometric fingerprint is sensitive enough to detect and classify
(type) subclinical mastitis, which can provide real time high throughput microbiological milk
quality evaluation and appropriate antibiotic intervention strategies on dairy farms.
7.2.1. Further validation of proposed methodology
In order to assess correspondence between cytometric fingerprints and their genetic
composition, subpopulations could be sorted using various combinations of the parameters,
for instance, cell size (forward scatter), cell granularity/ morphology (side scatter), flavin
autofluorescence, total DNA content (DAPI staining), metabolic activity, and fluorescence in-

73
situhybridization (FISH) rRNA probes etc. Cells could be sorted using two-way sort option
and most accurate sort mode (single and one-drop-mode; highest purity 99%) could be chosen
for separating up to 5000 cells/sec. Sorted cell populations could be amplified, barcoded and
sequenced with an Illumina MiSeq® to generate genomic information. Analysis of NGS data
for the purpose of characterizing microbial communities takes two approaches: 1) “What
groups of microorganisms seem enriched / attenuated under controlled perturbations” and 2)
“Can the changes in these populations be justified based on the putative mechanism of the
perturbation”. The expectation behind such studies is that empirically identified
microorganisms can become ‘biomarkers’ for a specific perturbation or pathology of the
microbiome.
7.2.2. Dataset and analytical toolchain development
As discussed in the Chapter 5, with the advancement of key technologies in flow
cytometry, the number of parameters that can be measured are increasing exorbitantly year
after year. Hence there is a need to develop automated algorithms to extract specific features
from the cytometry dataset beyond a simple distance-based algorithms. These “fingerprints”
would form the basis of further analysis, such as identification and classification of samples,
as well as the development of autocorrelation functions that could be used to quantify the rate
of perturbation over time. In essence, a ‘fingerprint’ is a partitioning of the multidimensional
flow cytometry dataset into hyperrectangular regions such that each partition has similar
amounts of informational entropy. In other words, it is a multidimensional histogram where
the bin width is optimized to enclose equal amounts of Shannon’s information. Automated
partitioning tools such as Flow-FP exist, however the problem with such tools is that they
produce partitions based on informational entropy alone, without consideration or relevance to

74
the specific classification problem. Microbial ecosystems are highly dynamic and can show
large variation in short timescales. An important question to answer in this domain would be,
“How much dynamic variation is nominal to the treatment, and what specific variational
patterns signify perturbation?”.
An automated pipeline could be developed that introduces an iterative algorithm to
solve for dataset partitions that optimize a machine classifier; it would help compress the
information, making subsequent analysis more computationally efficient. The FlowFP
package in R/Bioconductor has the capability to generate partitions with a fixed number of
recursions. As the partitions get smaller, histograms of the within-sample and between-sample
RMSD could be generated and the Kolmogorov-Smirnov statistic could be used to rank order
the partitions based on their contrast. Repeating this procedure on random subsets of the data
could test the robustness of the optimal partitioning scheme. This optimal partitioning could
be used on the much larger dataset in order to develop efficient machine learning models to
identify the original cause of the perturbation, whether it be carbon sources, nanoparticles or
antibiotics.
This will reduce the subjectivity and time-consuming nature of manual data analysis of
cytometric fingerprints. With an algorithm for contrast enhancement and an automated
pipeline to find optimal partitions for a given objective function, the analysis of flow
cytometry data will become repeatable, and automated. A direct benefit of this approach is
that this algorithm will be able to identify the bounds of nominal variation within treatments,
thereby reducing the likelihood of false positive biomarkers. This toolchain will permit life
science researchers to focus on the design and interpretation of the experiment itself rather
than on different analytical tools.

75
7.2.3. Applications of proposed methodology in early detection of subclinical bovine
mastitis
Bovine mastitis costs the US dairy industry $2 billion, an average of $200 per cow
annually. Mastitis is currently diagnosed based on lymphocyte counts in milk, which are a
non-specific marker of infection. The proposed methodology along with the toolchain
developed above can potentially detect and classify (type) subclinical mastitis, which can
provide high throughput microbiological milk quality evaluation and may be able to inform
appropriate antibiotic intervention strategies in dairy farms.
Cytometric fingerprints could be developed for the identification of main mastitis-
causing pathogens using the multiple flow cytometry parameters. Variations in the number,
function and viability of milk leukocytes determine the first-line immune defense of the
bovine mammary gland. Cytometric fingerprinting technique could also be applied for
somatic cell count and the differential inflammatory cell count along with the quantification of
the portion of viable, apoptotic, and necrotic leukocytes isolated from the milk samples
infected with different mastitis pathogens. The deep-learning based machine classifier
approach could be applied to the mastitis dataset to create a classification of main mastitis-
causing pathogens. The most actionable and desirable outcome of this exercise would be a
clear identification of the pathogen, and the number, function and viability of milk leukocytes.
The proposed exercise will demonstrate the bridge between characterizing animal
microbiomes and practical applications in agriculture. Furthermore, it would motivate the use
of data- driven and monitoring-based approaches for the proper and judicious use of
antibiotics in animal agriculture. In addition, this application overcomes a major practical

76
drawback of animal microbiome evaluation: While characterizing gut and superficial
microbiomes of animals does provide unique insights, it is difficult to implement a practical
microbiome collection protocol in the context of production agriculture. In contrast, using
tools to evaluate the microbial composition of an animal product itself (viz. the milk) would
make a persuasive case for adopting this technology in the field.
7.3. Last words
In addition to the goal of developing a breakthrough technology
for microbiome characterization in anaerobic systems, the research presented here has a
potential to benefit the broader microbial ecology research community by providing a rapid
screening and characterization tool to discover patterns in dynamic microbiome responses to
several stimuli. For instance, these tools could be used in the discovery of novel
antimicrobials, useful probiotics, and in the advancement of our understanding of
gastrointestinal infectious pathogens such as C. difficile in the context of healthy and
perturbed microbial communities. Aspects of this research, including experimental
methodologies and data analysis (R and Machine Learning) can be incorporated into the
existing courses in the university curriculum and experiments from this project can be adapted
as a laboratory exercise or term projects for undergraduate classes or a learning module
including hands-on tools. This project will not only has a potential to be successful as a novel
methodology that increases the accuracy and throughput of microbiome characterization via
flow cytometry, but also opens a pathway to commercialize this tool.
77
LITERATURE CITED
Abdelsalam, E., Samer, M., Attia, Y.A., Abdel-Hadi, M.A., Hassan, H.E., Badr, Y., 2016.
Comparison of nanoparticles effects on biogas and methane production from anaerobic
digestion of cattle dung slurry. Renew. Energy 87, 592–598.
doi:10.1016/j.renene.2015.10.053
Ahring, B.K., Westermann, P., 1987. Kinetics of butyrate, acetate, and hydrogen metabolism
in a thermophilic, anaerobic, butyrate-degrading triculture. Appl. Environ. Microbiol. 53,
434–9.
Akunna, J.C., Bizeau, C., Moletta, R., 1993. Nitrate and nitrite reductions with anaerobic
sludge using various carbon sources: Glucose, glycerol, acetic acid, lactic acid and
methanol. Water Res. 27, 1303–1312. doi:10.1016/0043-1354(93)90217-6
Alsouleman, K., Linke, B., Klang, J., Klocke, M., Krakat, N., Theuerl, S., 2016.
Reorganisation of a mesophilic biogas microbiome as response to a stepwise increase of
ammonium nitrogen induced by poultry manure supply, Bioresource Technology.
doi:10.1016/j.biortech.2016.02.104
Amani, T., Nosrati, M., Sreekrishnan, T.R., 2010. Anaerobic digestion from the viewpoint of
microbiological, chemical, and operational aspects — a review. Environ. Rev. 18, 255–
278. doi:10.1139/A10-011
Amann, R.I., Binder, B.J., Olson, R.J., Chisholm, S.W., Devereux, R., Stahl, D.A., 1990.
Combination of 16S rRNA-targeted oligonucleotide probes with flow cytometry for
analyzing mixed microbial populations. Appl. Envir. Microbiol. 56, 1919–1925.
Angenent, L.T., Sung, S., Raskin, L., 2004. Formation of granules and Methanosaeta fibres in
an anaerobic migrating blanket reactor (AMBR). Environ. Microbiol. 6, 315–322.
doi:10.1111/j.1462-2920.2004.00597.x
Apha, A., 1998. WEF (1998) Standard methods for the examination of water and wastewater.
Ariesyady, H.D., Ito, T., Okabe, S., 2007a. Functional bacterial and archaeal community
structures of major trophic groups in a full-scale anaerobic sludge digester. Water Res.
41, 1554–1568. doi:10.1016/j.watres.2006.12.036
Ariesyady, H.D., Ito, T., Yoshiguchi, K., Okabe, S., 2007b. Phylogenetic and functional
diversity of propionate-oxidizing bacteria in an anaerobic digester sludge. Appl.
Microbiol. Biotechnol. 75, 673–683. doi:10.1007/s00253-007-0842-y
Aydin, S., Ince, B., Ince, O., 2015. Application of real-time PCR to determination of
combined effect of antibiotics on Bacteria, Methanogenic Archaea, Archaea in anaerobic
sequencing batch reactors. Water Res. 76, 88–98. doi:10.1016/j.watres.2015.02.043
Balskus, E.P., 2016. Addressing Infectious Disease Challenges by Investigating Microbiomes.
Barber, W.P.F., 2014. Influence of wastewater treatment on sludge production and processing.
Water Environ. J. 28, 1–10. doi:10.1111/wej.12044
Batstone, D.J., Tait, S., Starrenburg, D., 2009. Estimation of hydrolysis parameters in full-
scale anerobic digesters. Biotechnol. Bioeng. 102, 1513–1520. doi:10.1002/bit.22163
Berg, L. van den, Patel, G.B., Clark, D.S., Lentz, C.P., 1976. Factors affecting rate of methane
formation from acetic acid by enriched methanogenic cultures. Can. J. Microbiol. 22,
1312–1319. doi:10.1139/m76-194

78
Biedermann, M., Grob, K., 2010. Is recycled newspaper suitable for food contact materials?
Technical grade mineral oils from printing inks. Eur. Food Res. Technol. 230, 785–796.
doi:10.1007/s00217-010-1223-9
Bioprocess Engineering Principles - Pauline M. Doran - Google Books, 1995. . Academic
Press.
Blasco, L., Kahala, M., Tampio, E., Ervasti, S., Paavola, T., Rintala, J., Joutsjoki, V., 2014.
Dynamics of microbial communities in untreated and autoclaved food waste anaerobic
digesters. Anaerobe 29, 3–9. doi:10.1016/j.anaerobe.2014.04.011
Bolyard, S.C., Reinhart, D.R., Santra, S., 2013. Behavior of engineered nanoparticles in
landfill leachate. Environ. Sci. Technol. 47, 8114–8122. doi:10.1021/es305175e
Bombach, P., Hübschmann, T., Fetzer, I., Kleinsteuber, S., Geyer, R., Harms, H., Müller, S.,
2011. Resolution of natural microbial community dynamics by community
fingerprinting, flow cytometry, and trend interpretation analysis. Adv. Biochem. Eng.
Biotechnol. 124, 151–81. doi:10.1007/10_2010_82
Boone, D.R., Chynoweth, D.P., Mah, R.A., Smith, P.H., Wilkie, A.C., 1993. Ecology and
microbiology of biogasification. Biomass and Bioenergy 5, 191–202. doi:10.1016/0961-
9534(93)90070-K
Brar, S.K., Verma, M., Tyagi, R.D., Surampalli, R.Y., 2010. Engineered nanoparticles in
wastewater and wastewater sludge – Evidence and impacts. Waste Manag. 30, 504–520.
doi:10.1016/j.wasman.2009.10.012
Brummeler, E. Ten, Horbach, H.C.J.M., Koster, I.W., 2007. Dry anaerobic batch digestion of
the organic fraction of municipal solid waste. J. Chem. Technol. Biotechnol. 50, 191–
209. doi:10.1002/jctb.280500206
Cardinale, M., Brusetti, L., Quatrini, P., Borin, S., Puglia, A.M., Rizzi, A., Zanardini, E.,
Sorlini, C., Corselli, C., Daffonchio, D., 2004. Comparison of different primer sets for
use in automated ribosomal intergenic spacer analysis of complex bacterial communities.
Appl. Environ. Microbiol. 70, 6147–56. doi:10.1128/AEM.70.10.6147-6156.2004
Caruana, R., Niculescu-Mizil, A., 2006. An empirical comparison of supervised learning
algorithms. Proc. 23th Int. Conf. Mach. Learn. 161–168. doi:10.1145/1143844.1143865
Čater, M., Fanedl, L., Logar, R.M., 2013. Microbial Community Analyses in Biogas Reactors
by Molecular Methods. Acta Chim. Slov. 60, 243–255.
Chaparro, J.M., Sheflin, A.M., Manter, D.K., Vivanco, J.M., 2012. Manipulating the soil
microbiome to increase soil health and plant fertility. Biol. Fertil. Soils 48, 489–499.
doi:10.1007/s00374-012-0691-4
Chattopadhyay, P.K., Roederer, M., 2012. Cytometry: Today’s technology and tomorrow’s
horizons. Methods 57, 251–258. doi:10.1016/j.ymeth.2012.02.009
Chen, J.L., Ortiz, R., Steele, T.W.J., Stuckey, D.C., 2014. Toxicants inhibiting anaerobic
digestion: a review. Biotechnol. Adv. 32, 1523–34.
doi:10.1016/j.biotechadv.2014.10.005
Chen, Q. 1985-, 2010. Kinetics of anaerobic digestion of selected C1 to C4 organic acids.
Chen, Y., Wang, D., Zhu, X., Zheng, X., Feng, L., 2012. Long-Term Effects of Copper
Nanoparticles on Wastewater Biological Nutrient Removal and N2O Generation in the
Activated Sludge Process. Environ. Sci. Technol. 46, 12452–12458.
doi:10.1021/es302646q
Christgen, B., Yang, Y., Ahammad, S.Z., Li, B., Rodriquez, D.C., Zhang, T., Graham, D.W.,
2015. Metagenomics Shows That Low-Energy Anaerobic−Aerobic Treatment Reactors

79
Reduce Antibiotic Resistance Gene Levels from Domestic Wastewater.
Cohen, A., Breure, A.M., van Andel, J.G., van Deursen, A., 1982. Influence of phase
separation on the anaerobic digestion of glucose—II. Water Res. 16, 449–455.
doi:10.1016/0043-1354(82)90170-1
Daniels, L., 1984. Biological methanogenesis: physiological and practical aspects. Trends
Biotechnol. 2, 91–98. doi:10.1016/S0167-7799(84)80004-9
Dhoble, A., 2009. HIGH SOLIDS ANAEROBIC DIGESTION FOR THE LONG TERM
EXPLORATORY NASA LUNAR SPACE MISSIONS.
Dhoble, A.S., Pullammanappallil, P.C., 2014. Design and operation of an anaerobic digester
for waste management and fuel generation during long term lunar mission. Adv. Sp. Res.
54, 1502–1512. doi:10.1016/j.asr.2014.06.029
Eduok, S., Martin, B., Villa, R., Nocker, A., Jefferson, B., Coulon, F., 2013. Evaluation of
engineered nanoparticle toxic effect on wastewater microorganisms: current status and
challenges. Ecotoxicol. Environ. Saf. 95, 1–9. doi:10.1016/j.ecoenv.2013.05.022
EL AKKAD, I., HOBSON, P.N., Cahen, L., Delhal, J., Monteyne-Poulaert, G., 1966. Effect
of Antibiotics on Some Rumen and Intestinal Bacteria. Nature 209, 1046–1047.
doi:10.1038/2091046a0
Elefsiniotis, P., Oldham, W.K., 1994. Substrate degradation patterns in acid‐ phase anaerobic
digestion of municipal primary sludge. Environ. Technol. 15, 741–751.
doi:10.1080/09593339409385480
Faure, D., Vereecke, D., Leveau, J.H.J., 2009. Molecular communication in the rhizosphere.
Plant Soil 321, 279–303. doi:10.1007/s11104-008-9839-2
Fernandez, A.S., Hashsham, S.A., Dollhopf, S.L., Raskin, L., Glagoleva, O., Dazzo, F.B.,
Hickey, R.F., Criddle, C.S., Tiedje, J.M., 2000. Flexible Community Structure Correlates
with Stable Community Function in Methanogenic Bioreactor Communities Perturbed by
Glucose. Appl. Environ. Microbiol. 66, 4058–4067. doi:10.1128/AEM.66.9.4058-
4067.2000
Fisher, M.M., Triplett, E.W., 1999. Automated Approach for Ribosomal Intergenic Spacer
Analysis of Microbial Diversity and Its Application to Freshwater Bacterial
Communities. Appl. Envir. Microbiol. 65, 4630–4636.
Fulwyler, M.J., 1965. Electronic Separation of Biological Cells by Volume. Science (80-. ).
150.
Ganzoury, M.A., Allam, N.K., 2015. Impact of nanotechnology on biogas production: A mini-
review. Renew. Sustain. Energy Rev. 50, 1392–1404. doi:10.1016/j.rser.2015.05.073
García, A., Delgado, L., Torà, J.A., Casals, E., González, E., Puntes, V., Font, X., Carrera, J.,
Sánchez, A., 2012. Effect of cerium dioxide, titanium dioxide, silver, and gold
nanoparticles on the activity of microbial communities intended in wastewater treatment.
J. Hazard. Mater. 199–200, 64–72. doi:10.1016/j.jhazmat.2011.10.057
Geurts, P., Ernst, D., Wehenkel, L., 2006. Extremely randomized trees. Mach. Learn. 63, 3–
42. doi:10.1007/s10994-006-6226-1
Giesen, C., Wang, H.A.O., Schapiro, D., Zivanovic, N., Jacobs, A., Hattendorf, B., Schüffler,
P.J., Grolimund, D., Buhmann, J.M., Brandt, S., Varga, Z., Wild, P.J., Günther, D.,
Bodenmiller, B., 2014. Highly multiplexed imaging of tumor tissues with subcellular
resolution by mass cytometry. Nat. Methods 11, 417–422. doi:10.1038/nmeth.2869
Gray, J.W., Carrano, A. V, Steinmetz, L.L., Van Dilla, M.A., Moore, D.H., Mayall, B.H.,
Mendelsohn, M.L., 1975. Chromosome measurement and sorting by flow systems. Proc.

80
Natl. Acad. Sci. U. S. A. 72, 1231–4.
Günther, S., Faust, K., Schumann, J., Harms, H., Raes, J., Müller, S., 2016. Species-sorting
and mass-transfer paradigms control managed natural metacommunities. Environ.
Microbiol. 1–31. doi:10.1111/1462-2920.13402
Henderson, G., Cox, F., Ganesh, S., Jonker, A., Young, W., Janssen, P.H., 2015. Rumen
microbial community composition varies with diet and host, but a core microbiome is
found across a wide geographical range. Sci. Rep. 5, 14567. doi:10.1038/srep14567
Hirsch, A.M., Fujishige, N.A., 2012. Molecular Signals and Receptors: Communication
Between Nitrogen-Fixing Bacteria and Their Plant Hosts. Springer Berlin Heidelberg,
pp. 255–280. doi:10.1007/978-3-642-23524-5_14
Ito, T., Yoshiguchi, K., Ariesyady, H.D., Okabe, S., 2012. Identification and quantification of
key microbial trophic groups of methanogenic glucose degradation in an anaerobic
digester sludge. Bioresour. Technol. 123, 599–607. doi:10.1016/j.biortech.2012.07.108
Kaegi, R., Voegelin, A., Ort, C., Sinnet, B., Thalmann, B., Krismer, J., Hagendorfer, H.,
Elumelu, M., Mueller, E., 2013. Fate and transformation of silver nanoparticles in urban
wastewater systems. Water Res. 47, 3866–77. doi:10.1016/j.watres.2012.11.060
Khanal, S.K. (Ed.), 2008. Anaerobic Biotechnology for Bioenergy Production. Wiley-
Blackwell, Oxford, UK. doi:10.1002/9780813804545
Khanal, S.K., n.d. Microbiology and Biochemistry of Anaerobic Biotechnology, in: Anaerobic
Biotechnology for Bioenergy Production. Wiley-Blackwell, Oxford, UK, pp. 29–41.
doi:10.1002/9780813804545.ch2
Kinet, R., Dzaomuho, P., Baert, J., Taminiau, B., Daube, G., Nezer, C., Brostaux, Y., Nguyen,
F., Dumont, G., Thonart, P., Delvigne, F., 2016. Flow cytometry community
fingerprinting and amplicon sequencing for the assessment of landfill leachate
cellulolytic bioaugmentation. Bioresour. Technol. 214, 450–459.
doi:10.1016/j.biortech.2016.04.131
Koch, C., Fetzer, I., Harms, H., Müller, S., 2013a. CHIC-an automated approach for the
detection of dynamic variations in complex microbial communities. Cytometry. A 83,
561–7. doi:10.1002/cyto.a.22286
Koch, C., Fetzer, I., Schmidt, T., Harms, H., Müller, S., 2013b. Monitoring functions in
managed microbial systems by cytometric bar coding. Environ. Sci. Technol. 47, 1753–
1760. doi:10.1021/es3041048
Koch, C., Günther, S., Desta, A.F., Hübschmann, T., Müller, S., 2013c. Cytometric
fingerprinting for analyzing microbial intracommunity structure variation and identifying
subcommunity function. Nat. Protoc. 8, 190–202. doi:10.1038/nprot.2012.149
Koch, C., Harms, H., Müller, S., 2014a. Dynamics in the microbial cytome-single cell
analytics in natural systems. Curr. Opin. Biotechnol. 27, 134–41.
doi:10.1016/j.copbio.2014.01.011
Koch, C., Harms, H., Müller, S., 2014b. Dynamics in the microbial cytome — single cell
analytics in natural systems. Curr. Opin. Biotechnol., Energy biotechnology •
Environmental biotechnology 27, 134–141. doi:10.1016/j.copbio.2014.01.011
Koch, C., Harnisch, F., Schröder, U., Müller, S., 2014c. Cytometric fingerprints: evaluation of
new tools for analyzing microbial community dynamics. Front. Microbiol. 5, 273.
doi:10.3389/fmicb.2014.00273
Koch, C., Müller, S., Harms, H., Harnisch, F., 2014d. Microbiomes in bioenergy production:
From analysis to management. Curr. Opin. Biotechnol. 27, 65–72.

81
doi:10.1016/j.copbio.2013.11.006
Kolat, P., Kadlec, Z., 2013. Sewage sludge as a biomass energy source. Acta Univ. Agric.
Silvic. Mendelianae Brun. 61, 85–91. doi:10.11118/actaun201361010085
Le, Q. V, 2015. A Tutorial on Deep Learning Part 2: Autoencoders, Convolutional Neural
Networks and Recurrent Neural Networks.
Leitão, R.C., van Haandel, A.C., Zeeman, G., Lettinga, G., 2006. The effects of operational
and environmental variations on anaerobic wastewater treatment systems: a review.
Bioresour. Technol. 97, 1105–18. doi:10.1016/j.biortech.2004.12.007
Li, A., Chu, Y., Wang, X., Ren, L., Yu, J., Liu, X., Yan, J., Zhang, L., Wu, S., Li, S., Weiland,
P., Yadvika, N., Santosh, N., Sreekrishnan, T., Kohli, S., Rana, V., Liu, X., Wang, W.,
Gao, X., Zhou, Y., Shen, R., Demirel, B., Scherer, P., Ferry, J., Bryan, P., Tracy, S., Fast,
A., Indurthi, D., Papoutsakis, E., Schink, B., Chouari, R., Paslier, D. Le, Daegelen, P.,
Ginestet, P., Weissenbach, J., Sghir, A., Tang, Y., Shigematsu, T., Morimura, S., Kida,
K., Shigematsu, T., Era, S., Mizuno, Y., Ninomiya, K., Kamegawa, Y., Morimura, S.,
Kida, K., Tang, Y., Fujimura, Y., Shigematsu, T., Morimura, S., Kida, K., Klocke, M.,
Mahnert, P., Mundt, K., Souidi, K., Linke, B., Weiss, A., Jerome, V., Freitag, R., Mayer,
H., Klocke, M., Nettmann, E., Bergmann, I., Mundt, K., Souidi, K., Mumme, J., Linke,
B., Tang, Y., Shigematsu, T., Ikbal, N., Morimura, S., Kida, K., Sasaki, K., Haruta, S.,
Ueno, Y., Ishii, M., Igarashi, Y., Jaenicke, S., Ander, C., Bekel, T., Bisdorf, R., Droge,
M., Gartemann, K., Junemann, S., Kaiser, O., Krause, L., Tille, F., Margulies, M.,
Egholm, M., Altman, W., Attiya, S., Bader, J., Bemben, L., Berka, J., Braverman, M.,
Chen, Y., Chen, Z., Rothberg, J., Leamon, J., Schluter, A., Bekel, T., Diaz, N., Dondrup,
M., Eichenlaub, R., Gartemann, K., Krahn, I., Krause, L., Kromeke, H., Kruse, O.,
Simon, C., Wiezer, A., Strittmatter, A., Daniel, R., Abbai, N., Govender, A., Shaik, R.,
Pillay, B., Krause, L., Diaz, N., Edwards, R., Gartemann, K., Kromeke, H., Neuweger,
H., Puhler, A., Runte, K., Schluter, A., Stoye, J., Krause, L., Diaz, N., Goesmann, A.,
Kelley, S., Nattkemper, T., Rohwer, F., Edwards, R., Stoye, J., Krober, M., Bekel, T.,
Jaenicke, S., Krause, L., Miller, D., Runte, K., Viehover, P., Puhler, A., Schluter, A.,
Wirth, R., Kovacs, E., Maroti, G., Bagi, Z., Rakhely, G., Kovacs, K., Desai, N.,
Antonopoulos, D., Gilbert, J., Glass, E., Meyer, F., Scholz, M., Lo, C., Chain, P.,
Bergmann, I., Mundt, K., Sontag, M., Baumstark, I., Nettmann, E., Klocke, M., Hwang,
C., Ling, F., Andersen, G., LeChevallier, M., Liu, W., Ezaki, T., Yamamoto, N.,
Ninomiya, K., Suzuki, S., Yabuuchi, E., Murdoch, D., Ezaki, T., Kawamura, Y., Li, N.,
Li, Z., Zhao, L., Shu, S., Rodrigues, D., Jesus, E., Ayala-del-Rio, H., Pellizari, V.,
Gilichinsky, D., Sepulveda-Torres, L., Tiedje, J., Yoon, J., Lee, C., Kang, S., Oh, T.,
Yoon, J., Lee, C., Yeo, S., Oh, T., Jung, S., Lee, M., Oh, T., Park, Y., Yoon, J., Park’, Y.,
Liao, V., Chu, Y., Su, Y., Hsiao, S., Wei, C., Liu, C., Liao, C., Shen, W., Chang, F.,
Yumoto, I., Hirota, K., Sogabe, Y., Nodasaka, Y., Yokota, Y., Hoshino, T., Bozal, N.,
Montes, M., Tudela, E., Guinea, J., Kampfer, P., Albrecht, A., Buczolits, S., Busse, H.,
Vela, A., Collins, M., Latre, M., Mateos, A., Moreno, M., Hutson, R., Dominguez, L.,
Fernandez-Garayzabal, J., Yoon, J., Kang, K., Park, Y., Joseph, B., Ramteke, P.,
Thomas, G., Zhang, J., Lin, S., Zeng, R., Baena, S., Fardeau, M., Labat, M., Ollivier, B.,
Thomas, P., Garcia, J., Patel, B., Beaty, P., Wofford, N., Mcinerney, M., Wofford, N.,
Beaty, P., Mcinerney, M., Mackie, R., Bryant, M., Xu, J., Chiang, H., Bjursell, M.,
Gordon, J., Weimer, P., Zeikus, J., Beguin, P., Millet, J., Aubert, J., Sparling, R., Islam,
R., Cicek, N., Carere, C., Chow, H., Levin, D., Seedorf, H., Fricke, W., Veith, B.,
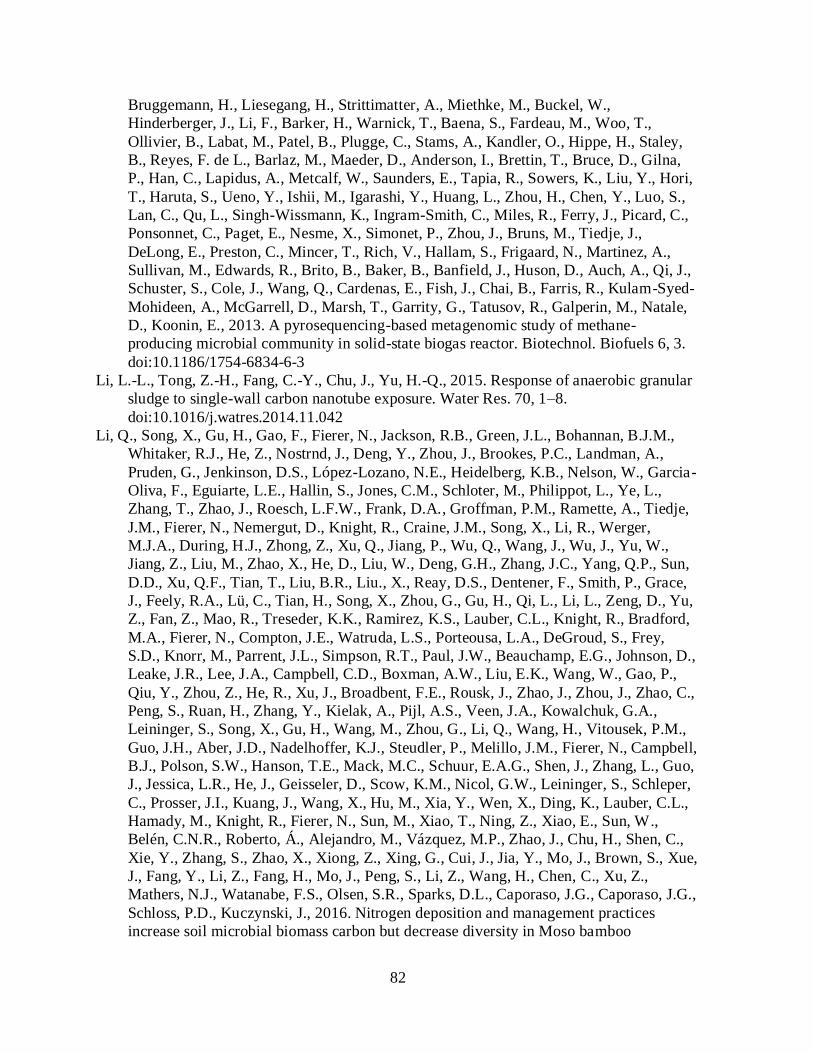
82
Bruggemann, H., Liesegang, H., Strittimatter, A., Miethke, M., Buckel, W.,
Hinderberger, J., Li, F., Barker, H., Warnick, T., Baena, S., Fardeau, M., Woo, T.,
Ollivier, B., Labat, M., Patel, B., Plugge, C., Stams, A., Kandler, O., Hippe, H., Staley,
B., Reyes, F. de L., Barlaz, M., Maeder, D., Anderson, I., Brettin, T., Bruce, D., Gilna,
P., Han, C., Lapidus, A., Metcalf, W., Saunders, E., Tapia, R., Sowers, K., Liu, Y., Hori,
T., Haruta, S., Ueno, Y., Ishii, M., Igarashi, Y., Huang, L., Zhou, H., Chen, Y., Luo, S.,
Lan, C., Qu, L., Singh-Wissmann, K., Ingram-Smith, C., Miles, R., Ferry, J., Picard, C.,
Ponsonnet, C., Paget, E., Nesme, X., Simonet, P., Zhou, J., Bruns, M., Tiedje, J.,
DeLong, E., Preston, C., Mincer, T., Rich, V., Hallam, S., Frigaard, N., Martinez, A.,
Sullivan, M., Edwards, R., Brito, B., Baker, B., Banfield, J., Huson, D., Auch, A., Qi, J.,
Schuster, S., Cole, J., Wang, Q., Cardenas, E., Fish, J., Chai, B., Farris, R., Kulam-Syed-
Mohideen, A., McGarrell, D., Marsh, T., Garrity, G., Tatusov, R., Galperin, M., Natale,
D., Koonin, E., 2013. A pyrosequencing-based metagenomic study of methane-
producing microbial community in solid-state biogas reactor. Biotechnol. Biofuels 6, 3.
doi:10.1186/1754-6834-6-3
Li, L.-L., Tong, Z.-H., Fang, C.-Y., Chu, J., Yu, H.-Q., 2015. Response of anaerobic granular
sludge to single-wall carbon nanotube exposure. Water Res. 70, 1–8.
doi:10.1016/j.watres.2014.11.042
Li, Q., Song, X., Gu, H., Gao, F., Fierer, N., Jackson, R.B., Green, J.L., Bohannan, B.J.M.,
Whitaker, R.J., He, Z., Nostrnd, J., Deng, Y., Zhou, J., Brookes, P.C., Landman, A.,
Pruden, G., Jenkinson, D.S., López-Lozano, N.E., Heidelberg, K.B., Nelson, W., Garcia-
Oliva, F., Eguiarte, L.E., Hallin, S., Jones, C.M., Schloter, M., Philippot, L., Ye, L.,
Zhang, T., Zhao, J., Roesch, L.F.W., Frank, D.A., Groffman, P.M., Ramette, A., Tiedje,
J.M., Fierer, N., Nemergut, D., Knight, R., Craine, J.M., Song, X., Li, R., Werger,
M.J.A., During, H.J., Zhong, Z., Xu, Q., Jiang, P., Wu, Q., Wang, J., Wu, J., Yu, W.,
Jiang, Z., Liu, M., Zhao, X., He, D., Liu, W., Deng, G.H., Zhang, J.C., Yang, Q.P., Sun,
D.D., Xu, Q.F., Tian, T., Liu, B.R., Liu., X., Reay, D.S., Dentener, F., Smith, P., Grace,
J., Feely, R.A., Lü, C., Tian, H., Song, X., Zhou, G., Gu, H., Qi, L., Li, L., Zeng, D., Yu,
Z., Fan, Z., Mao, R., Treseder, K.K., Ramirez, K.S., Lauber, C.L., Knight, R., Bradford,
M.A., Fierer, N., Compton, J.E., Watruda, L.S., Porteousa, L.A., DeGroud, S., Frey,
S.D., Knorr, M., Parrent, J.L., Simpson, R.T., Paul, J.W., Beauchamp, E.G., Johnson, D.,
Leake, J.R., Lee, J.A., Campbell, C.D., Boxman, A.W., Liu, E.K., Wang, W., Gao, P.,
Qiu, Y., Zhou, Z., He, R., Xu, J., Broadbent, F.E., Rousk, J., Zhao, J., Zhou, J., Zhao, C.,
Peng, S., Ruan, H., Zhang, Y., Kielak, A., Pijl, A.S., Veen, J.A., Kowalchuk, G.A.,
Leininger, S., Song, X., Gu, H., Wang, M., Zhou, G., Li, Q., Wang, H., Vitousek, P.M.,
Guo, J.H., Aber, J.D., Nadelhoffer, K.J., Steudler, P., Melillo, J.M., Fierer, N., Campbell,
B.J., Polson, S.W., Hanson, T.E., Mack, M.C., Schuur, E.A.G., Shen, J., Zhang, L., Guo,
J., Jessica, L.R., He, J., Geisseler, D., Scow, K.M., Nicol, G.W., Leininger, S., Schleper,
C., Prosser, J.I., Kuang, J., Wang, X., Hu, M., Xia, Y., Wen, X., Ding, K., Lauber, C.L.,
Hamady, M., Knight, R., Fierer, N., Sun, M., Xiao, T., Ning, Z., Xiao, E., Sun, W.,
Belén, C.N.R., Roberto, Á., Alejandro, M., Vázquez, M.P., Zhao, J., Chu, H., Shen, C.,
Xie, Y., Zhang, S., Zhao, X., Xiong, Z., Xing, G., Cui, J., Jia, Y., Mo, J., Brown, S., Xue,
J., Fang, Y., Li, Z., Fang, H., Mo, J., Peng, S., Li, Z., Wang, H., Chen, C., Xu, Z.,
Mathers, N.J., Watanabe, F.S., Olsen, S.R., Sparks, D.L., Caporaso, J.G., Caporaso, J.G.,
Schloss, P.D., Kuczynski, J., 2016. Nitrogen deposition and management practices
increase soil microbial biomass carbon but decrease diversity in Moso bamboo

83
plantations. Sci. Rep. 6, 28235. doi:10.1038/srep28235
Li, Y.-F., Shi, J., Nelson, M.C., Chen, P.-H., Graf, J., Li, Y., Yu, Z., 2016. Impact of different
ratios of feedstock to liquid anaerobic digestion effluent on the performance and
microbiome of solid-state anaerobic digesters digesting corn stover. Bioresour. Technol.
200, 744–752. doi:10.1016/j.biortech.2015.10.078
Limam, R.D., Chouari, R., Mazéas, L., Wu, T.-D., Li, T., Grossin-Debattista, J., Guerquin-
Kern, J.-L., Saidi, M., Landoulsi, A., Sghir, A., Bouchez, T., 2014. Members of the
uncultured bacterial candidate division WWE1 are implicated in anaerobic digestion of
cellulose. Microbiologyopen 3, 157–167. doi:10.1002/mbo3.144
Lin, Y., Lü, F., Shao, L., He, P., 2013. Influence of bicarbonate buffer on the methanogenetic
pathway during thermophilic anaerobic digestion. Bioresour. Technol. 137, 245–253.
doi:10.1016/j.biortech.2013.03.093
Lyerly, D.M., Saum, K.E., MacDonald, D.K., Wilkins, T.D., 1985. Effects of Clostridium
difficile toxins given intragastrically to animals. Infect. Immun. 47, 349–52.
Mahapatra, I., Sun, T.Y., Clark, J.R.A., Dobson, P.J., Hungerbuehler, K., Owen, R., Nowack,
B., Lead, J., Eustis, S., El-Sayed, M., Masitas, R., Zamborini, F., Trudel, S., Lukianova-
Hleb, E., Ren, X., Sawant, R., Wu, X., Torchilin, V., Lapotko, D., Shilo, M., Motiei, M.,
Hana, P., Popovtzer, R., Setua, S., Ouberai, M., Piccirillo, S., Watts, C., Welland, M.,
Arnaiz, B., Martinez-Avila, O., Falcon-Perez, J., Penades, S., Ramirez, A., Brain, R.,
Usenko, S., Mottaleb, M., O’Donnell, J., Stahl, L., Roberts, P., Thomas, K., Miller, T.,
McEneff, G., Brown, R., Owen, S., Bury, N., Barron, L., Keel, T., Judy, J., Unrine, J.,
Bertsch, P., Sabo-Attwood, T., Unrine, J., Stone, J., Murphy, C., Ghoshroy, S., Blom, D.,
Tsyusko, O., Unrine, J., Spurgeon, D., Blalock, E., Starnes, D., Tseng, M., Kim, K.,
Zaikova, T., Hutchison, J., Tanguay, R., Geffroy, B., Ladhar, C., Cambier, S., Treguer-
Delapierre, M., Brethes, D., Bourdineaud, J., Perreault, F., Bogdan, N., Morin, M.,
Claverie, J., Popovic, R., Cui, Y., Zhao, Y., Tian, Y., Zhang, W., Lu, X., Jiang, X.,
Coradeghini, R., Gioria, S., García, C., Nativo, P., Franchini, F., Gilliland, D., Zhao, Y.,
Tian, Y., Cui, Y., Liu, W., Ma, W., Jiang, X., Owen, R., Handy, R., Pastoor, T.,
Bachman, A., Bell, D., Cohen, S., Dellarco, M., Dewhurst, I., Gottschalk, F., Sonderer,
T., Scholz, R., Nowack, B., Sun, T., Gottschalk, F., Hungerbuhler, K., Nowack, B.,
Keller, A., McFerran, S., Lazareva, A., Suh, S., Keller, A., Lazareva, A., Gottschalk, F.,
Scholz, R., Nowack, B., Gottschalk, F., Sonderer, T., Scholz, R., Nowack, B.,
Gottschalk, F., Nowack, B., Booker, V., Halsall, C., Llewellyn, N., Johnson, A.,
Williams, R., Prejean, J., Song, R., Hernandez, A., Ziebell, R., Green, T., Walker, F.,
Siegel, R., Ma, J., Zou, Z., Jemal, A., Goel, R., Shah, N., Visaria, R., Paciotti, G.,
Bischof, J., Gad, S., Sharp, K., Montgomery, C., Payne, J., Goodrich, G., Zhang, X.-D.,
Wu, D., Shen, X., Liu, P.-X., Fan, F.-Y., Fan, S.-J., Longmire, M., Choyke, P.,
Kobayashi, H., Tudor, T., Townend, W., Cheeseman, C., Edgar, J., McHugh, J., Filser,
J., Arndt, D., Baumann, J., Geppert, M., Hackmann, S., Luther, E., Liu, H., Cohen, Y.,
Praetorius, A., Scheringer, M., Hungerbühler, K., Meesters, J., Koelmans, A., Quik, J.,
Hendriks, A., Meent, D., Dumont, E., Johnson, A., Keller, V., Williams, R., Gottschalk,
F., Ort, C., Scholz, R., Nowack, B., Suarez, I., Rosal, R., Rodriguez, A., Ucles, A.,
Fernandez-Alba, A., Hernando, M., Wheeler, J., Grist, E., Leung, K., Morritt, D., Crane,
M., Stilgoe, J., Owen, R., Macnaghten, P., Ashton, D., Hilton, M., Thomas, K., Thomas,
K., Hilton, M., Liu, J., Lu, G., Zhang, Z., Bao, Y., Liu, F., Wu, D., Liu, J., Lu, G., Xie,
Z., Zhang, Z., Li, S., Yan, Z., Sanchez, W., Sremski, W., Piccini, B., Palluel, O., Maillot-

84
Maréchal, E., Betoulle, S., Shvedova, A., Kagan, V., Fadeel, B., Lowry, G., Gregory, K.,
Apte, S., Lead, J., Linkov, I., Satterstrom, F., Steevens, J., Ferguson, E., Pleus, R.,
Garner, K., Suh, S., Lenihan, H., Keller, A., Gottschalk, F., Kost, E., Nowack, B.,
Hough, R., Noble, R., Hitchen, G., Hart, R., Reddy, S., Saunders, M., Kaegi, R.,
Voegelin, A., Ort, C., Sinnet, B., Thalmann, B., Krismer, J., Jarvie, H., Al-Obaidi, H.,
King, S., Bowes, M., Lawrence, M., Drake, A., Johnson, A., Jürgens, M., Lawlor, A.,
Cisowska, I., Williams, R., Buffat, P., Borel, J., Lee, J., Lee, J., Tanaka, T., Mori, H.,
Dick, K., Dhanasekaran, T., Zhang, Z., Meisel, D., Nanda, K., Maisels, A., Kruis, F.,
Rellinghaus, B., Luo, W., Su, K., Li, K., Liao, G., Hu, N., Jia, M., Kakumazaki, J., Kato,
T., Sugawara, K., AmuthaRani, D., Boccaccini, A., Deegan, D., Cheeseman, C.,
Ørnebjerg, H., Franck, J., Lamers, F., Angotti, F., Morin, R., Brunner, M., Mari, M.,
Domingo, J., Asharani, P., lianwu, Y., Gong, Z., Valiyaveettil, S., Bar-Ilan, O., Albrecht,
R., Fako, V., Furgeson, D., 2015. Probabilistic modelling of prospective environmental
concentrations of gold nanoparticles from medical applications as a basis for risk
assessment. J. Nanobiotechnology 13, 93. doi:10.1186/s12951-015-0150-0
Manyi-Loh, C.E., Mamphweli, S.N., Meyer, E.L., Okoh, A.I., Makaka, G., Simon, M., 2013.
Microbial anaerobic digestion (bio-digesters) as an approach to the decontamination of
animal wastes in pollution control and the generation of renewable energy. Int. J.
Environ. Res. Public Health 10, 4390–417. doi:10.3390/ijerph10094390
McCarty, P.L., Mosey, F.E., 1991. Modelling of Anaerobic Digestion Processes (A
Discussion of Concepts). Water Sci. Technol. 24, 17–33.
Melzer, S., Winter, G., Jäger, K., Hübschmann, T., Hause, G., Syrowatka, F., Harms, H.,
Tárnok, A., Müller, S., 2015. Cytometric patterns reveal growth states of S hewanella
putrefaciens. Microb. Biotechnol. 8, 379–391. doi:10.1111/1751-7915.12154
Merlin Christy, P., Gopinath, L.R., Divya, D., 2014. A review on anaerobic decomposition
and enhancement of biogas production through enzymes and microorganisms. Renew.
Sustain. Energy Rev. 34, 167–173. doi:10.1016/j.rser.2014.03.010
Monici, M., 2005. Cell and tissue autofluorescence research and diagnostic applications.
Biotechnol. Annu. Rev. 11, 227–56. doi:10.1016/S1387-2656(05)11007-2
Mu, H., Chen, Y., Xiao, N., 2011. Effects of metal oxide nanoparticles (TiO2, Al2O3, SiO2
and ZnO) on waste activated sludge anaerobic digestion. Bioresour. Technol. 102,
10305–11. doi:10.1016/j.biortech.2011.08.100
Mukherjee, A., Walker, J., Weyant, K.B., Schroeder, C.M., 2013. Characterization of flavin-
based fluorescent proteins: an emerging class of fluorescent reporters. PLoS One 8,
e64753. doi:10.1371/journal.pone.0064753
Müller, S., Nebe-von-Caron, G., 2010. Functional single-cell analyses: flow cytometry and
cell sorting of microbial populations and communities. FEMS Microbiol. Rev. 34, 554–
87. doi:10.1111/j.1574-6976.2010.00214.x
Nallathambi Gunaseelan, V., 1997. Anaerobic digestion of biomass for methane production:
A review. Biomass and Bioenergy 13, 83–114. doi:10.1016/S0961-9534(97)00020-2
Narihiro, T., Sekiguchi, Y., 2007. Microbial communities in anaerobic digestion processes for
waste and wastewater treatment: a microbiological update. Curr. Opin. Biotechnol. 18,
273–278. doi:10.1016/j.copbio.2007.04.003
Nelson, M.C., Morrison, M., Yu, Z., 2011. A meta-analysis of the microbial diversity
observed in anaerobic digesters. Bioresour. Technol. 102, 3730–3739.
doi:10.1016/j.biortech.2010.11.119

85
Nyberg, L., Turco, R.F., Nies, L., 2008. Assessing the Impact of Nanomaterials on Anaerobic
Microbial Communities. Environ. Sci. Technol. 42, 1938–1943. doi:10.1021/es072018g
Ong, S.H., Kukkillaya, V.U., Wilm, A., Lay, C., Ho, E.X.P., Low, L., Hibberd, M.L.,
Nagarajan, N., 2013. Species identification and profiling of complex microbial
communities using shotgun Illumina sequencing of 16S rRNA amplicon sequences.
PLoS One 8, e60811. doi:10.1371/journal.pone.0060811
Otero-González, L., Field, J.A., Sierra-Alvarez, R., 2014. Fate and long-term inhibitory
impact of ZnO nanoparticles during high-rate anaerobic wastewater treatment. J.
Environ. Manage. 135, 110–7. doi:10.1016/j.jenvman.2014.01.025
Owen, W.F., Stuckey, D.C., Healy, J.B., Young, L.Y., McCarty, P.L., 1979. Bioassay for
monitoring biochemical methane potential and anaerobic toxicity. Water Res. 13, 485–
492. doi:10.1016/0043-1354(79)90043-5
Pandit, P.D., Gulhane, M.K., Khardenavis, A.A., Vaidya, A.N., 2015. Technological
Advances for Treating Municipal Waste, in: Microbial Factories. Springer India, New
Delhi, pp. 217–229. doi:10.1007/978-81-322-2598-0_13
Park, H.S., Schumacher, R., Kilbane 2nd, J.J., 2005. New method to characterize microbial
diversity using flow cytometry. J Ind Microbiol Biotechnol 32, 94–102.
doi:10.1007/s10295-005-0208-3
Pedreira, C.E., Costa, E.S., Lecrevisse, Q., van Dongen, J.J.M., Orfao, A., 2013. Overview of
clinical flow cytometry data analysis: recent advances and future challenges. Trends
Biotechnol. 31, 415–25. doi:10.1016/j.tibtech.2013.04.008
Perfetto, S.P., Chattopadhyay, P.K., Roederer, M., 2004. Innovation: Seventeen-colour flow
cytometry: unravelling the immune system. Nat. Rev. Immunol. 4, 648–655.
doi:10.1038/nri1416
Qu, X., Mazéas, L., Vavilin, V.A., Epissard, J., Lemunier, M., Mouchel, J.-M., He, P.,
Bouchez, T., 2009a. Combined monitoring of changes in δ13CH4 and archaeal
community structure during mesophilic methanization of municipal solid waste. FEMS
Microbiol. Ecol. 68.
Qu, X., Mazéas, L., Vavilin, V.A., Epissard, J., Lemunier, M., Mouchel, J.-M., He, P.,
Bouchez, T., 2009b. Combined monitoring of changes in delta13CH4 and archaeal
community structure during mesophilic methanization of municipal solid waste. FEMS
Microbiol. Ecol. 68, 236–45. doi:10.1111/j.1574-6941.2009.00661.x
Ranjard, L., Poly, F., Lata, J.-C., Mougel, C., Thioulouse, J., Nazaret, S., 2001.
Characterization of Bacterial and Fungal Soil Communities by Automated Ribosomal
Intergenic Spacer Analysis Fingerprints: Biological and Methodological Variability.
Appl. Environ. Microbiol. 67, 4479–4487. doi:10.1128/AEM.67.10.4479-4487.2001
Raskin, L., Amann, R.I., Poulsen, L.K., Rittmann, B.E., Stahl, D.A., 1995. Use of ribosomal
RNA-based molecular probes for characterization of complex microbial communities in
anaerobic biofilms. Water Sci. Technol. 31, 261–272.
Raskin, L., Stromley, J.M., Rittmann, B.E., Stahl, D.A., 1994. Group-specific 16S rRNA
hybridization probes to describe natural communities of methanogens. Appl. Envir.
Microbiol. 60, 1232–1240.
Renggli, S., Keck, W., Jenal, U., Ritz, D., 2013. Role of Autofluorescence in Flow Cytometric
Analysis of Escherichia coli Treated with Bactericidal Antibiotics. J. Bacteriol. 195,
4067–4073. doi:10.1128/JB.00393-13
Rezaeinejad, S., Ivanov, V., 2013. Assessment of correlation between physiological states of

86
Escherichia coli cells and their susceptibility to chlorine using flow cytometry. Water
Sci. Technol. Water Supply 13, 1056. doi:10.2166/ws.2013.083
Rincón, B., Borja, R., González, J.M., Portillo, M.C., Sáiz-Jiménez, C., 2008. Influence of
organic loading rate and hydraulic retention time on the performance, stability and
microbial communities of one-stage anaerobic digestion of two-phase olive mill solid
residue. Biochem. Eng. J. 40, 253–261. doi:10.1016/j.bej.2007.12.019
Robinson, J.P., Roederer, M., 2015. Flow cytometry strikes gold. Science (80-. ). 350.
Rogers, W.T., Holyst, H.A., 2009. FlowFP: A Bioconductor Package for Fingerprinting Flow
Cytometric Data. Adv. Bioinformatics 2009, 1–11. doi:10.1155/2009/193947
Saeys, Y., Gassen, S. Van, Lambrecht, B.N., 2016. Computational flow cytometry: helping to
make sense of high-dimensional immunology data. Nat. Rev. Immunol. 16, 449–462.
doi:10.1038/nri.2016.56
Safoniuk, M., 2004. Wastewater Engineering: Treatment and Reuse. Chem. Eng. 111, 10–12.
Sasaki, D., Hori, T., Haruta, S., Ueno, Y., Ishii, M., Igarashi, Y., 2011. Methanogenic
pathway and community structure in a thermophilic anaerobic digestion process of
organic solid waste. J. Biosci. Bioeng. 111, 41–6. doi:10.1016/j.jbiosc.2010.08.011
Siegert, I., Banks, C., 2005. The effect of volatile fatty acid additions on the anaerobic
digestion of cellulose and glucose in batch reactors. Process Biochem. 40, 3412–3418.
doi:10.1016/j.procbio.2005.01.025
Speece, R.., 1996. Anaerobic biotechnology for industrial wastewaters.
Stappenbeck, T.S., Virgin, H.W., 2016. Accounting for reciprocal host–microbiome
interactions in experimental science. Nature 534, 191–199. doi:10.1038/nature18285
Stieritz, D.D., Holder, I.A., 1975. Experimental Studies of the Pathogenesis of Infections Due
to Pseudomonas aeruginosa: Description of a Burned Mouse Model. J. Infect. Dis. 131,
688–691. doi:10.1093/infdis/131.6.688
Tilman, D., Balzer, C., Hill, J., Befort, B.L., 2011. Global food demand and the sustainable
intensification of agriculture. Proc. Natl. Acad. Sci. 108, 20260–20264.
doi:10.1073/pnas.1116437108
Turker, G., Aydin, S., Akyol, Ç., Yenigun, O., Ince, O., Ince, B., 2016a. Changes in microbial
community structures due to varying operational conditions in the anaerobic digestion of
oxytetracycline-medicated cow manure. Appl. Microbiol. Biotechnol.
doi:10.1007/s00253-016-7469-9
Turker, G., Aydin, S., Akyol, Ç., Yenigun, O., Ince, O., Ince, B., 2016b. Changes in microbial
community structures due to varying operational conditions in the anaerobic digestion of
oxytetracycline-medicated cow manure. Appl. Microbiol. Biotechnol. 100, 6469–6479.
doi:10.1007/s00253-016-7469-9
Vanrolleghem, P.A., Lee, D.S., 2003. On-line monitoring equipment for wastewater treatment
processes: state of the art. Water Sci. Technol. 47.
Venkiteshwaran, K., Bocher, B., Maki, J., Zitomer, D., 2015. Relating Anaerobic Digestion
Microbial Community and Process Function. Microbiol. insights 8, 37–44.
doi:10.4137/MBI.S33593
Volmer, J., Schmid, A., Bühler, B., 2015. Guiding bioprocess design by microbial ecology.
Curr. Opin. Microbiol. 25, 25–32. doi:10.1016/j.mib.2015.02.002
Wei, W., 1990. Time series analysis. Ulb.Tu-Darmstadt.De.
Werner, J.J., Knights, D., Garcia, M.L., Scalfone, N.B., Smith, S., Yarasheski, K., Cummings,
T.A., Beers, A.R., Knight, R., Angenent, L.T., 2011. Bacterial community structures are

87
unique and resilient in full-scale bioenergy systems. Proc. Natl. Acad. Sci. U. S. A. 108,
4158–63. doi:10.1073/pnas.1015676108
Werner, J.J., Knights, D., Garcia, M.L., Scalfone, N.B., Smith, S., Yarasheski, K., Cummings,
T.A., Beers, A.R., Knight, R., Angenent, L.T., 2011. Bacterial community structures are
unique and resilient in full-scale bioenergy systems. Proc. Natl. Acad. Sci. 108, 4158–
4163. doi:10.1073/pnas.1015676108
Westerhoff, P., Song, G., Hristovski, K., Kiser, M.A., 2011. Occurrence and removal of
titanium at full scale wastewater treatment plants: implications for TiO2 nanomaterials. J.
Environ. Monit. 13, 1195–203. doi:10.1039/c1em10017c
Westerholm, M., Müller, B., Arthurson, V., Schnürer, A., 2011. Changes in the Acetogenic
Population in a Mesophilic Anaerobic Digester in Response to Increasing Ammonia
Concentration. Microbes Environ. 26, 347–353. doi:10.1264/jsme2.ME11123
Woese, C.R., 1987. Bacterial evolution. Microbiol. Rev. 51, 221–71.
Xue, Y., Wilkes, J.G., Moskal, T.J., Williams, A.J., Cooper, W.M., Nayak, R., Rafii, F.,
Buzatu, D.A., 2016. Development of a Flow Cytometry-Based Method for Rapid
Detection of Escherichia coli and Shigella Spp. Using an Oligonucleotide Probe. PLoS
One 11, e0150038. doi:10.1371/journal.pone.0150038
Yang, Y., Guo, J., Hu, Z., 2013a. Impact of nano zero valent iron (NZVI) on methanogenic
activity and population dynamics in anaerobic digestion. Water Res. 47, 6790–800.
doi:10.1016/j.watres.2013.09.012
Yang, Y., Zhang, C., Hu, Z., 2013b. Impact of metallic and metal oxide nanoparticles on
wastewater treatment and anaerobic digestion. Environ. Sci. Process. Impacts 15, 39–48.
doi:10.1039/C2EM30655G
Yu, B., Lou, Z., Zhang, D., Shan, A., Yuan, H., Zhu, N., Zhang, K., 2015. Variations of
organic matters and microbial community in thermophilic anaerobic digestion of waste
activated sludge with the addition of ferric salts. Bioresour. Technol. 179, 291–298.
doi:10.1016/j.biortech.2014.12.011
Yuan, Z.-H., Yang, X., Hu, A., Yu, C.-P., 2015. Long-term impacts of silver nanoparticles in
an anaerobic–anoxic–oxic membrane bioreactor system. Chem. Eng. J. 276, 83–90.
doi:10.1016/j.cej.2015.04.059
Zhang, Z.-P., Show, K.-Y., Tay, J.-H., Liang, D.T., Lee, D.-J., Jiang, W.-J., 2006. Effect of
hydraulic retention time on biohydrogen production and anaerobic microbial community.
Process Biochem. 41, 2118–2123. doi:10.1016/j.procbio.2006.05.021
Zheng, X., Wu, L., Chen, Y., Su, Y., Wan, R., Liu, K., Huang, H., 2015. Effects of titanium
dioxide and zinc oxide nanoparticles on methane production from anaerobic co-digestion
of primary and excess sludge. J. Environ. Sci. Heal. Part A.

88
APPENDIX A: Additional experimental results and output of model runs
A.1. FSC-SSC plots for all flow cytometry samples showing percentages of cells in
the prominent blobs.
Figure A-1. FSC-SSC plots of flow cytometry samples fed with different carbon sources.
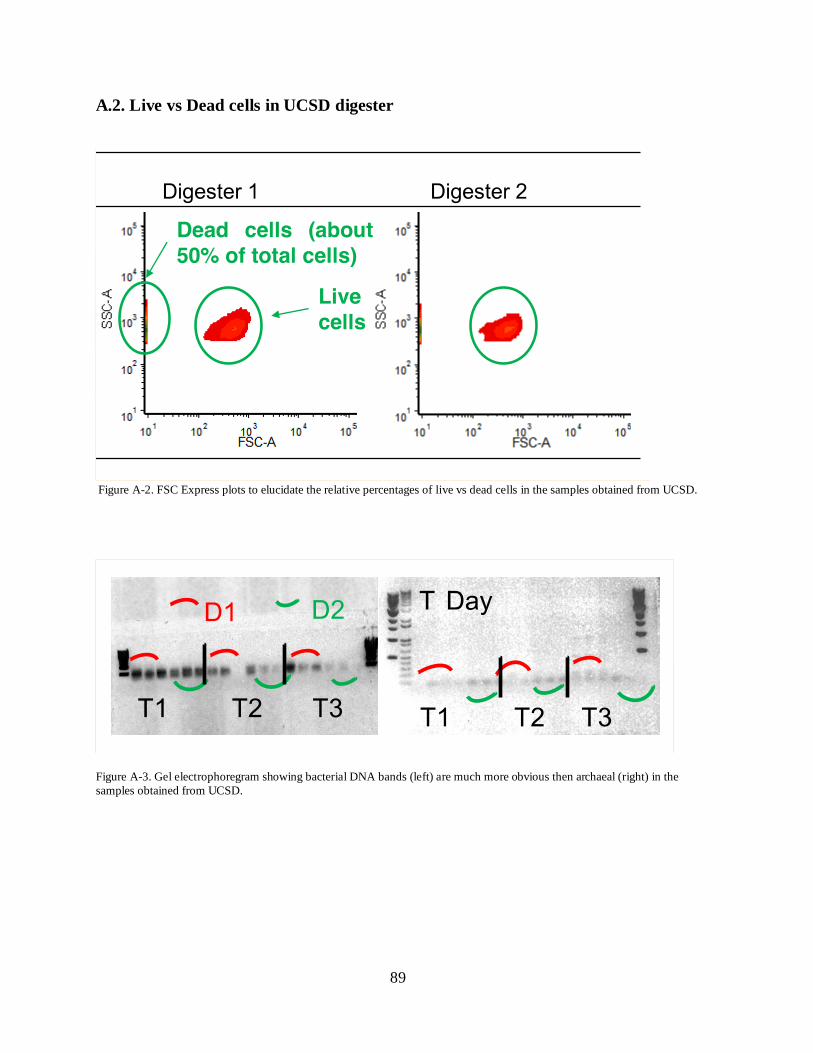
89
A.2. Live vs Dead cells in UCSD digester
Figure A-2. FSC Express plots to elucidate the relative percentages of live vs dead cells in the samples obtained from UCSD.
Figure A-3. Gel electrophoregram showing bacterial DNA bands (left) are much more obvious then archaeal (right) in the
samples obtained from UCSD.

90
A.3. E. coli HB 101 growth curves
Figure A-4. (Top) E. coli HB 101 growth curves under 3 different LB concentrations (A= 10 g/L, B= 20 g/L, C = 40 g/L).
(Bottom) Alexa Fuor 488 mean intensity curves showing varying autofluorescence at different LB concentrations (dotted
lines represent duplicates).
0
0.2
0.4
0.6
0.8
1
1.2
1.4
1.6
1.8
1 6 11 16 21 26 31
OD
60
0
Time (H)
E coli HB 101 Growth Curve A
B
C
50
100
150
200
250
300
350
400
450
1 6 11 16 21 26 31
Ale
xa F
luo
r 4
88
Me
an In
ten
sity
Time (H)
Alexa Fluor 488
A A2 B B2 C C2
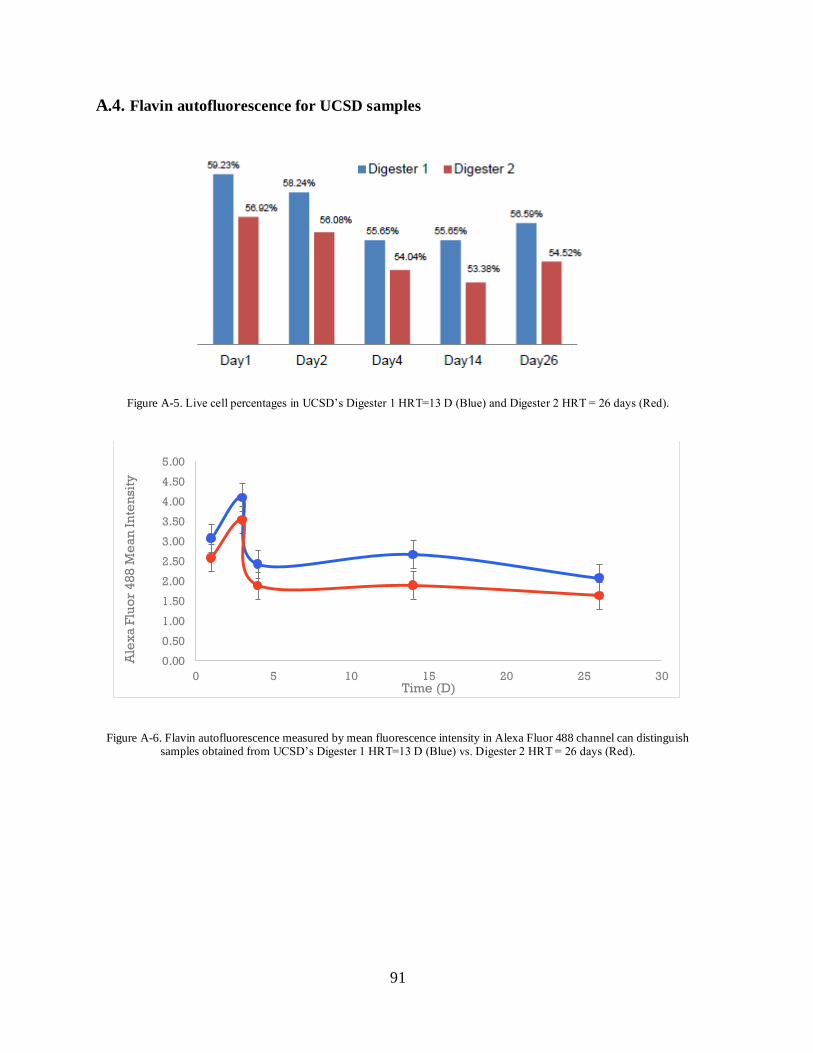
91
A.4. Flavin autofluorescence for UCSD samples
Figure A-5. Live cell percentages in UCSD’s Digester 1 HRT=13 D (Blue) and Digester 2 HRT = 26 days (Red).
Figure A-6. Flavin autofluorescence measured by mean fluorescence intensity in Alexa Fluor 488 channel can distinguish samples obtained from UCSD’s Digester 1 HRT=13 D (Blue) vs. Digester 2 HRT = 26 days (Red).
0.00
0.50
1.00
1.50
2.00
2.50
3.00
3.50
4.00
4.50
5.00
0 5 10 15 20 25 30
Ale
xa
Flu
or
48
8 M
ea
n I
nte
nsit
y
Time (D)

92
A.5. Predictive model run output for UCSD samples
Model Details:
==============
H2OBinomialModel: deeplearning
Model Key: first_model
Status of Neuron Layers: predicting label, 2-class
classification, bernoulli distribution, CrossEntropy loss,
640,802 weights/biases, 7.9 MB, 2,066 training samples, mini-
batch size 1
layer units type dropout l1 l2
mean_rate rate_RMS momentum mean_weight
1 1 3000 Input 10.00 %
2 2 200 RectifierDropout 50.00 % 0.000000 0.000000
0.003909 0.002068 0.000000 0.000057
3 3 200 RectifierDropout 50.00 % 0.000000 0.000000
0.008427 0.024785 0.000000 -0.000398
4 4 2 Softmax 0.000000 0.000000
0.000899 0.000369 0.000000 -0.009646
weight_RMS mean_bias bias_RMS
1
2 0.025627 0.499391 0.006595
3 0.069718 0.998175 0.011197
4 0.398366 -0.000081 0.016927
H2OBinomialMetrics: deeplearning
** Reported on training data. **
Description: Metrics reported on full training frame
MSE: 0.3220701
R^2: -0.2882805
LogLoss: 1.25982
AUC: 0.778114
Gini: 0.556228
Confusion Matrix for F1-optimal threshold:
E K Error Rate
E 513 487 0.487000 =487/1000
K 128 872 0.128000 =128/1000
Totals 641 1359 0.307500 =615/2000
Maximum Metrics: Maximum metrics at their respective thresholds
metric threshold value idx
1 max f1 0.007573 0.739296 386
2 max f2 0.000628 0.858992 397

93
3 max f0point5 0.028458 0.705271 362
4 max accuracy 0.022889 0.713500 367
5 max precision 0.999577 1.000000 0
6 max absolute_MCC 0.021389 0.432644 369
7 max min_per_class_accuracy 0.042678 0.698000 350
H2OBinomialMetrics: deeplearning
** Reported on validation data. **
Description: Metrics reported on temporary (load-balanced)
validation frame
MSE: 0.3958777
R^2: -0.5835108
LogLoss: 1.752724
AUC: 0.655518
Gini: 0.311036
Confusion Matrix for F1-optimal threshold:
E K Error Rate
E 191 309 0.618000 =309/500
K 71 429 0.142000 =71/500
Totals 262 738 0.380000 =380/1000
Maximum Metrics: Maximum metrics at their respective thresholds
metric threshold value idx
1 max f1 0.003129 0.693053 387
2 max f2 0.000125 0.838710 398
3 max f0point5 0.005741 0.625786 380
4 max accuracy 0.005741 0.626000 380
5 max precision 0.969332 0.800000 3
6 max absolute_MCC 0.003129 0.272899 387
7 max min_per_class_accuracy 0.025283 0.612000 343
Scoring History:
timestamp duration training_speed epochs iteration samples
training_MSE
1 2015-12-02 20:45:24 0.000 sec 0.00000
0 0.000000
2 2015-12-02 20:45:28 5.030 sec 219 rows/sec 0.09950
1 199.000000 0.32207
3 2015-12-02 20:45:41 20.065 sec 203 rows/sec 1.03300
10 2066.000000 0.04244
4 2015-12-02 20:45:47 23.609 sec 200 rows/sec 1.03300
10 2066.000000 0.32207
training_r2 training_logloss training_AUC
training_classification_error validation_MSE
1

94
2 -0.28828 1.25982 0.77811
0.30750 0.39588
3 0.83025 0.17720 0.98715
0.05050 0.34832
4 -0.28828 1.25982 0.77811
0.30750 0.39588
validation_r2 validation_logloss validation_AUC
validation_classification_error
1
2 -0.58351 1.75272 0.65552
0.38000
3 -0.39330 2.06235 0.66551
0.35600
4 -0.58351 1.75272 0.65552
0.38000
Variable Importances: (Extract with `h2o.varimp`)
=================================================
Variable Importances:
variable relative_importance scaled_importance percentage
1 V913 1.000000 1.000000 0.000381
2 V711 0.998849 0.998849 0.000380
3 V1772 0.998077 0.998077 0.000380
4 V2982 0.990547 0.990547 0.000377
5 V1019 0.987840 0.987840 0.000376
---
variable relative_importance scaled_importance percentage
2995 V1739 0.773655 0.773655 0.000295
2996 V1115 0.773630 0.773630 0.000295
2997 V846 0.765953 0.765953 0.000292
2998 V600 0.755322 0.755322 0.000288
2999 V842 0.744924 0.744924 0.000284
3000 V29 0.733244 0.733244 0.000279