a novel electrostatic electron analyzer for hard x-ray
TRANSCRIPT

Journal of Physics Conference Series
OPEN ACCESS
A novel electrostatic electron analyzer for hard x-ray photoelectron spectroscopy (up to 15 keV)To cite this article J Rubio-Zuazo et al 2008 J Phys Conf Ser 100 072032
View the article online for updates and enhancements
You may also likeLOCATING THE MOST ENERGETICELECTRONS IN CASSIOPEIA ABrian W Grefenstette Stephen PReynolds Fiona A Harrison et al
-
INVESTIGATION OF CHROMOSPHERICEVAPORATION IN A NEUPERT-TYPESOLAR FLAREZongjun Ning and Wenda Cao
-
Monte Carlo simulation of the effect ofshape and thickness on SEM-EDSmicroanalysis of asbestos fibres andbundles the case of anthophyllitetremolite and actinoliteG Valdregrave D Moro and G Ulian
-
Recent citationsMolybdenum and silver photoemissionsurvey spectra from hard x-raysT M Flanagan et al
-
Gold photoemission survey spectra fromhard x raysTimothy M Flanagan et al
-
Electrostatic energy analyzers for highenergy charged particle beamsAM Ilyin and IA Ilyina
-
This content was downloaded from IP address 177129206191 on 04012022 at 0255
A novel electrostatic electron analyzer for Hard X-Ray
Photoelectron Spectroscopy (up to 15 keV)
JRubio-Zuazo12
MEscher3 MMerkel
3 and GRCastro
12
1SpLine Spanish CRG Beamline at the ESRF ESRF-BP 220-38043 Grenoble cedex-
France 2Instituto de Ciencia de Materiales de Madrid-ICMMCSIC Cantoblanco E-28049
Madrid Spain 3Focus GmbH 65510 Huumlnstetten Germany
E-mail rubioesrffr
Abstract At the Spanish CRG beamline (SpLine) located at the European Synchrotron
Radiation Facility (ESRF) we have developed a complex experimental set-up dedicated to the
combination of X-Ray Diffraction (XRD) and Hard X-ray Photoelectron Spectroscopy
(HAXPES) For that we have developed a novel high energy electron analyzer that fulfills the
requirements imposed by both techniques The analyzer is a cylinder sector analyzer
(CSA300HV) designed to operate at energies between few eV and up to 15 keV Since one
year it is operated routinely up to 15 keV electron kinetic energy In this work we present a
detailed description of the developed electron analyzer together with the experimental
determination of its intrinsic properties in terms of transmission energy resolution and kinetic
energy range achievable
1 Introduction
HAXPES is a powerful emerging technique for bulk compositional chemical and electronic properties
determination It benefits from the exceptionally large escape depth of high kinetic energy
photoelectrons enabling the study of bulk and buried interfaces up to several tens of nanometers depth
Lindau et al [1] made in 1974 the first HAXPES experiment measuring the Au 4f subshell at a photon
energy of 8 keV However no other group followed this pioneering work certainly because of the
strong drop of the photoemission cross-section at higher photon energies and to the lack of
commercial analyzers available to handle high electron energies For low-Z elements a drop of up to 4
orders of magnitude is observed when the photon energy is increased from 2 keV to 15 keV [2] Very
high photon fluxes requested by HAXPES became available with the third generation synchrotron
sources Due to this many laboratories are starting now research programs based on HAXPES [3]
At the CRG Spanish synchrotron beamline SpLine installed at the ESRF Grenoble France we
have developed a novel cylindrical sector electron analyzer (CSA300HV) which fulfills the technical
requirements imposed by the combination of XRD and HAXPES For XRD a large sample to detector
distance is requested in order to keep a maximum access to the reciprocal space The analyzer should
be of both small dimensions and high luminosity adapted to the spot size of the synchrotron radiation
as the photoemission cross-sections are extremely low at high excitation energies The energy
resolution should be comparable to standard XPS The analyzer should also operate at low energies
IVC-17ICSS-13 and ICN+T2007 IOP PublishingJournal of Physics Conference Series 100 (2008) 072032 doi1010881742-65961007072032
ccopy 2008 IOP Publishing Ltd 1
(few eV) to be able to correlate surface and bulk properties by the combination of the low energy
surface sensitive data with the high energy bulk sensitive data The CSA300HV analyzer has been
installed since the beginning of 2006 and is running routinely in the full energy range from few eV up
to 15 keV [4] In this manuscript we present the analyzerrsquos main characteristics and its intrinsic
properties in terms of transmission resolution and energy range
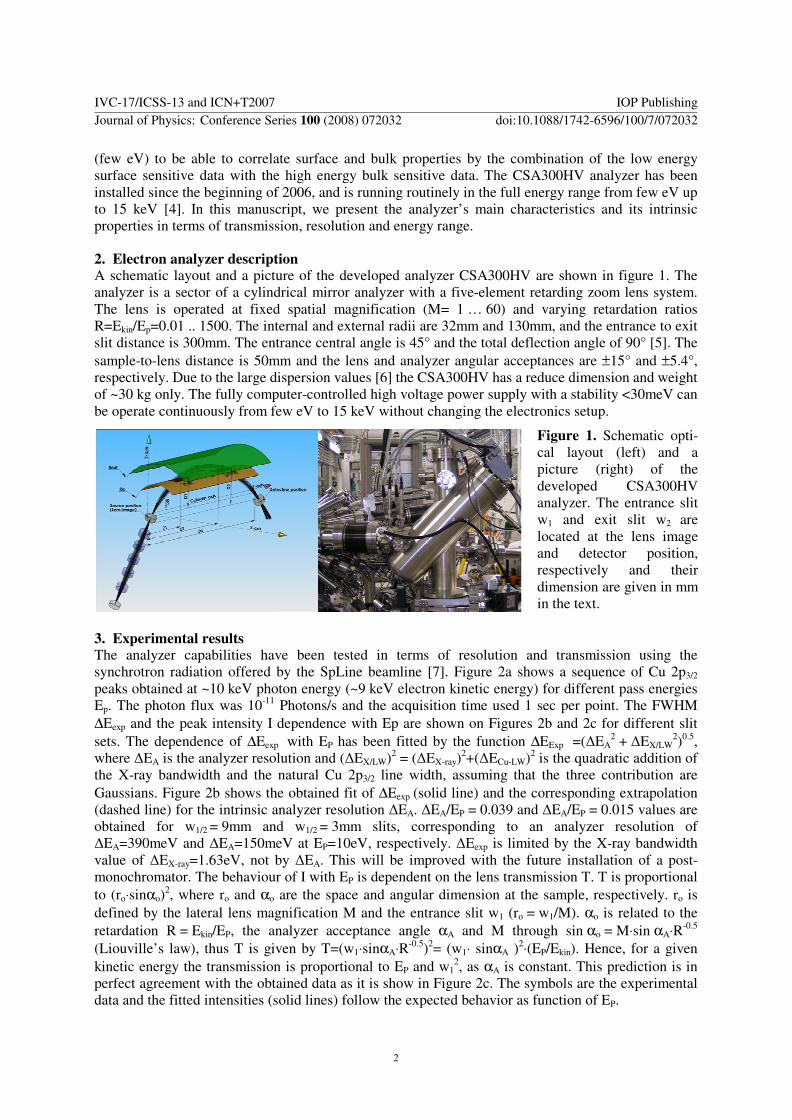
2 Electron analyzer description A schematic layout and a picture of the developed analyzer CSA300HV are shown in figure 1 The
analyzer is a sector of a cylindrical mirror analyzer with a five-element retarding zoom lens system
The lens is operated at fixed spatial magnification (M= 1 hellip 60) and varying retardation ratios
R=EkinEp=001 1500 The internal and external radii are 32mm and 130mm and the entrance to exit
slit distance is 300mm The entrance central angle is 45deg and the total deflection angle of 90deg [5] The
sample-to-lens distance is 50mm and the lens and analyzer angular acceptances are plusmn15deg and plusmn54deg
respectively Due to the large dispersion values [6] the CSA300HV has a reduce dimension and weight
of ~30 kg only The fully computer-controlled high voltage power supply with a stability lt30meV can
be operate continuously from few eV to 15 keV without changing the electronics setup
Figure 1 Schematic opti-
cal layout (left) and a
picture (right) of the
developed CSA300HV
analyzer The entrance slit
w1 and exit slit w2 are
located at the lens image
and detector position
respectively and their
dimension are given in mm
in the text
3 Experimental results The analyzer capabilities have been tested in terms of resolution and transmission using the
synchrotron radiation offered by the SpLine beamline [7] Figure 2a shows a sequence of Cu 2p32
peaks obtained at ~10 keV photon energy (~9 keV electron kinetic energy) for different pass energies
Ep The photon flux was 10-11
Photonss and the acquisition time used 1 sec per point The FWHM
∆Eexp and the peak intensity I dependence with Ep are shown on Figures 2b and 2c for different slit
sets The dependence of ∆Eexp with EP has been fitted by the function ∆EExp =(∆EA2 + ∆EXLW
2)
05
where ∆EA is the analyzer resolution and (∆EXLW)2 = (∆EX-ray)
2+(∆ECu-LW)
2 is the quadratic addition of
the X-ray bandwidth and the natural Cu 2p32 line width assuming that the three contribution are
Gaussians Figure 2b shows the obtained fit of ∆Eexp (solid line) and the corresponding extrapolation
(dashed line) for the intrinsic analyzer resolution ∆EA ∆EAEP = 0039 and ∆EAEP = 0015 values are
obtained for w12 = 9mm and w12 = 3mm slits corresponding to an analyzer resolution of
∆EA=390meV and ∆EA=150meV at EP=10eV respectively ∆Eexp is limited by the X-ray bandwidth
value of ∆EX-ray=163eV not by ∆EA This will be improved with the future installation of a post-
monochromator The behaviour of I with EP is dependent on the lens transmission T T is proportional
to (rosdotsinαo)2 where ro and αo are the space and angular dimension at the sample respectively ro is
defined by the lateral lens magnification M and the entrance slit w1 (ro = w1M) αo is related to the
retardation R = EkinEP the analyzer acceptance angle αA and M through sin αo = Msdotsin αAsdotR-05
(Liouvillersquos law) thus T is given by T=(w1sdotsinαAsdotR-05
)2= (w1sdot sinαA )
2sdot(EPEkin) Hence for a given
kinetic energy the transmission is proportional to EP and w12 as αA is constant This prediction is in
perfect agreement with the obtained data as it is show in Figure 2c The symbols are the experimental
data and the fitted intensities (solid lines) follow the expected behavior as function of EP
IVC-17ICSS-13 and ICN+T2007 IOP PublishingJournal of Physics Conference Series 100 (2008) 072032 doi1010881742-65961007072032
2
0
2
4
6
8
10
0 50 100 150 200 250 300
00
05
10
15
20
∆∆∆∆Eexp = ( ∆∆∆∆E
A
2+∆∆∆∆E
XLW
2 )
05
∆∆∆∆EAE
P = 0039
w1=w
2=3mm
w1=w
2=9mm
EP= 10 eV
EP= 10 eV
w1=w
2=3mm
w1=w
2=9mm
Cu 2p32 E
kin=9025 eV hνννν=9958 eV M=20
∆∆∆∆EA~ 150 meV
(c)
∆∆∆∆EA~ 390 meV
∆∆∆∆EAE
P = 0015
∆∆ ∆∆E
EXP
T= (sinααααo w
1)2(E
PE
kin)
I propproppropprop T =gt I propproppropprop Ep
(b)
EP (eV)
Intensity x 1
03 (cp
s)
9018 9020 9022 9024 9026 9028 9030 9032
0
10
20
30
40
50
60
EP = 20 eV
EP = 100 eV
EP = 50 eV
EP = 200 eV
(a)
w1=w
2=3mm
M=20hνννν = 9958 eV
Cu 2p32
Intensity (arb
units)
EKIN
(eV)
Figure 2 (a) Cu 2p32 peak for different EP and
w1=w2=3mm slits (b) and (c) show respectively the
experimental obtained resolution ∆Eexp (Cu 2p32 FWHM)
and intensity I vs EP for two different slit sets w1=w2=3mm
and w1=w2=9mm The symbols are experimental data and
the solid lines are root square (b) and linear (c) fits of the
data respectively The dash lines in (b) show the analyzer
intrinsic contribution to the energy resolution (s text)
The analyzerrsquos capability to cover a wide energy range (few eV to 15 keV) keeping its outstanding
performances is demonstrated in figure 3 Figure 3a shows a valence band spectrum (VB) from an
polycrystalline Ag sample obtained at 2121 eV photon energy at room temperature Slits of
w1=w2=3mm and Ep=1eV were used The inset shows the expanded Fermi cut-off the continuous line
illustrates the results from the best fit of a Fermi function A pseudo kT value of 39 meV is obtained
that correspond to a ∆Eexp = 130 meV (332 times pseudo kT-value) The difference to the expected
RT value (∆Eexp = 844 meV) is due to broadening induced by the analyzer Assuming a Gaussian
analyzer function an analyzer intrinsic resolution of ∆EA = 100 meV is obtained The analyzer
resolution is reduced to ∆EA=40 meV (not shown here) making a similar analysis at the same
conditions but with 1mm slits (w1=w2) Hence values of ∆EAEP = 01 and ∆EAEP = 004 are obtained
at low energy and EP=1 eV for w12 = 9mm and w12 = 1mm These two values are larger than the
expected values as deduced from the high energy data (s above) This discrepancy can be explained
by the power supply ripple getting discernible at very low pass energies However it must be stressed
that the same power supply is used in both cases and the analyzer resolution limit is better than
40 meV Figure 3c shows the gold 3s 3p and 3d core level spectra obtained with the CSA300HV
analyzer for a photon energy of hν=9 keV and hν=17 keV corresponding to an kinetic energy range of
Ekin = 5-15 keV These spectra in combination with the spectrum shown in Figure 3a demonstrate the
wide electron kinetic energy range covered by the analyzer Hence the developed energy analyzer
maintains its characteristic absolute energy resolution for a wide range of kinetic energies ie from
few eV up to 15 keV
IVC-17ICSS-13 and ICN+T2007 IOP PublishingJournal of Physics Conference Series 100 (2008) 072032 doi1010881742-65961007072032
3
20 18 16 14 12 10 8 6 4 2 0 -2
0
10
20
30
40
50
60
10 05 00 -05 -10
0
50
100
150
200
250
300
(a)
w1=w
2=9mm
hνννν = 2121eV
EP= 1eV
Ag
Intensity (Kcp
s)
Binding Energy (eV)
∆∆∆∆EEXP
= 130meV
∆∆∆∆EA= 100meV
Intensity (cps)
Binding Energy (eV)
3600 3400 3200 3000 2800 2600 2400 2200
00
05
10
15
20
25
30
x3
3p32
3d52
3p12
3d32
3s
hνννν = 9KeV
hνννν = 17KeV
EP= 200eV
w1=w
2=9mmAu
(b)
Intensity (Kcp
s)
Binding Energy (eV)
Figure 3 (a) VB spectra obtained on a polycrystalline Ag sample Inset shows the measured Fermi cut-off
with a HeI source The inset shows the expanded Fermi cut-off the solid line corresponds to the best fit of a
Fermi function to the measured data (b) Representative HAXPES 3s 3p and 3d core level spectra obtained
with the CSA300HV analyzer measured on a polycrystalline Au sample for a photon energy of hν = 9 keV
(Ekin = 54 69 keV) and hν = 17 keV (Ekin = 134 keV 149 keV) The bottom spectrum is multiplied by
a factor 3 Note the absolute and relative cross section differences in both spectra
4 Conclusions and outlook We have developed a novel outstanding electron analyzer that fulfills requirements imposed by the
XRD and HAXPES techniques It is the only commercially available analyzer capable to handle
kinetic energies up to 15 keV down to few eV Spectra over the full range are obtained with the same
setup of the analyzer and power supply The presented results demonstrate that the analyzerrsquos energy
resolution and transmission perform as expected over the full energy range The implementation of a
2D-detector for parallel data acquisition is currently in preparation to increase the measurement speed
and overcome the restrictions imposed by the low cross sections at high kinetic energies
Acknowledgements
We would like to thanks the SpLine and Focus GmbH staff for their valuable help in the development
of the electron analyzer Financial support for this research was provided through Spanish ministry of
Education and Science (MEC) Grants nos FAP-2001-2166 and MAT1999-0241-C01
References [1] Lindau I Pianetta P Doniach S Spicer WE Nature 250 (1974) 214
[2] Scofield JH Lawrence Livermore Report UCRL-51326 (1973) Rubio-Zuazo J and Castro GR
Workshop on Hard X-ray Photoelectron Spectroscopy 2006 Spring-8 Japan September 2006
[3] Proceedings of the Workshop on Hard X-ray Photoelectron Spectroscopy Nucl InstrMeth
Phys Resch A 547 (2005) Workshop on Hard X-ray Photoelectron Spectroscopy 2006 Spring-
8 Japan September 2006
[4] Rubio-Zuazo J and Castro GR Reviews on Advanced Material Science 15 (2007) pp 79-86
AIP Conference Proceedings-2007 International Conference on Frontiers of Characterization
and Metrology for Nanoelectronics
[5] Rubio-Zuazo J and Castro GR to be published
[6] Risley JS Rev Sci Instrum 43 (1971) 95 Sar-El HZ Rev Sci Instrum 38 (1967) 1210 Sar-
El HZ Rev Sci Instrum 41 (1970) 561
[7] Castro GR JSynchrotron Rad 5 657 (1998)
IVC-17ICSS-13 and ICN+T2007 IOP PublishingJournal of Physics Conference Series 100 (2008) 072032 doi1010881742-65961007072032
4
A novel electrostatic electron analyzer for Hard X-Ray
Photoelectron Spectroscopy (up to 15 keV)
JRubio-Zuazo12
MEscher3 MMerkel
3 and GRCastro
12
1SpLine Spanish CRG Beamline at the ESRF ESRF-BP 220-38043 Grenoble cedex-
France 2Instituto de Ciencia de Materiales de Madrid-ICMMCSIC Cantoblanco E-28049
Madrid Spain 3Focus GmbH 65510 Huumlnstetten Germany
E-mail rubioesrffr
Abstract At the Spanish CRG beamline (SpLine) located at the European Synchrotron
Radiation Facility (ESRF) we have developed a complex experimental set-up dedicated to the
combination of X-Ray Diffraction (XRD) and Hard X-ray Photoelectron Spectroscopy
(HAXPES) For that we have developed a novel high energy electron analyzer that fulfills the
requirements imposed by both techniques The analyzer is a cylinder sector analyzer
(CSA300HV) designed to operate at energies between few eV and up to 15 keV Since one
year it is operated routinely up to 15 keV electron kinetic energy In this work we present a
detailed description of the developed electron analyzer together with the experimental
determination of its intrinsic properties in terms of transmission energy resolution and kinetic
energy range achievable
1 Introduction
HAXPES is a powerful emerging technique for bulk compositional chemical and electronic properties
determination It benefits from the exceptionally large escape depth of high kinetic energy
photoelectrons enabling the study of bulk and buried interfaces up to several tens of nanometers depth
Lindau et al [1] made in 1974 the first HAXPES experiment measuring the Au 4f subshell at a photon
energy of 8 keV However no other group followed this pioneering work certainly because of the
strong drop of the photoemission cross-section at higher photon energies and to the lack of
commercial analyzers available to handle high electron energies For low-Z elements a drop of up to 4
orders of magnitude is observed when the photon energy is increased from 2 keV to 15 keV [2] Very
high photon fluxes requested by HAXPES became available with the third generation synchrotron
sources Due to this many laboratories are starting now research programs based on HAXPES [3]
At the CRG Spanish synchrotron beamline SpLine installed at the ESRF Grenoble France we
have developed a novel cylindrical sector electron analyzer (CSA300HV) which fulfills the technical
requirements imposed by the combination of XRD and HAXPES For XRD a large sample to detector
distance is requested in order to keep a maximum access to the reciprocal space The analyzer should
be of both small dimensions and high luminosity adapted to the spot size of the synchrotron radiation
as the photoemission cross-sections are extremely low at high excitation energies The energy
resolution should be comparable to standard XPS The analyzer should also operate at low energies
IVC-17ICSS-13 and ICN+T2007 IOP PublishingJournal of Physics Conference Series 100 (2008) 072032 doi1010881742-65961007072032
ccopy 2008 IOP Publishing Ltd 1
(few eV) to be able to correlate surface and bulk properties by the combination of the low energy
surface sensitive data with the high energy bulk sensitive data The CSA300HV analyzer has been
installed since the beginning of 2006 and is running routinely in the full energy range from few eV up
to 15 keV [4] In this manuscript we present the analyzerrsquos main characteristics and its intrinsic
properties in terms of transmission resolution and energy range
2 Electron analyzer description A schematic layout and a picture of the developed analyzer CSA300HV are shown in figure 1 The
analyzer is a sector of a cylindrical mirror analyzer with a five-element retarding zoom lens system
The lens is operated at fixed spatial magnification (M= 1 hellip 60) and varying retardation ratios
R=EkinEp=001 1500 The internal and external radii are 32mm and 130mm and the entrance to exit
slit distance is 300mm The entrance central angle is 45deg and the total deflection angle of 90deg [5] The
sample-to-lens distance is 50mm and the lens and analyzer angular acceptances are plusmn15deg and plusmn54deg
respectively Due to the large dispersion values [6] the CSA300HV has a reduce dimension and weight
of ~30 kg only The fully computer-controlled high voltage power supply with a stability lt30meV can
be operate continuously from few eV to 15 keV without changing the electronics setup
Figure 1 Schematic opti-
cal layout (left) and a
picture (right) of the
developed CSA300HV
analyzer The entrance slit
w1 and exit slit w2 are
located at the lens image
and detector position
respectively and their
dimension are given in mm
in the text
3 Experimental results The analyzer capabilities have been tested in terms of resolution and transmission using the
synchrotron radiation offered by the SpLine beamline [7] Figure 2a shows a sequence of Cu 2p32
peaks obtained at ~10 keV photon energy (~9 keV electron kinetic energy) for different pass energies
Ep The photon flux was 10-11
Photonss and the acquisition time used 1 sec per point The FWHM
∆Eexp and the peak intensity I dependence with Ep are shown on Figures 2b and 2c for different slit
sets The dependence of ∆Eexp with EP has been fitted by the function ∆EExp =(∆EA2 + ∆EXLW
2)
05
where ∆EA is the analyzer resolution and (∆EXLW)2 = (∆EX-ray)
2+(∆ECu-LW)
2 is the quadratic addition of
the X-ray bandwidth and the natural Cu 2p32 line width assuming that the three contribution are
Gaussians Figure 2b shows the obtained fit of ∆Eexp (solid line) and the corresponding extrapolation
(dashed line) for the intrinsic analyzer resolution ∆EA ∆EAEP = 0039 and ∆EAEP = 0015 values are
obtained for w12 = 9mm and w12 = 3mm slits corresponding to an analyzer resolution of
∆EA=390meV and ∆EA=150meV at EP=10eV respectively ∆Eexp is limited by the X-ray bandwidth
value of ∆EX-ray=163eV not by ∆EA This will be improved with the future installation of a post-
monochromator The behaviour of I with EP is dependent on the lens transmission T T is proportional
to (rosdotsinαo)2 where ro and αo are the space and angular dimension at the sample respectively ro is
defined by the lateral lens magnification M and the entrance slit w1 (ro = w1M) αo is related to the
retardation R = EkinEP the analyzer acceptance angle αA and M through sin αo = Msdotsin αAsdotR-05
(Liouvillersquos law) thus T is given by T=(w1sdotsinαAsdotR-05
)2= (w1sdot sinαA )
2sdot(EPEkin) Hence for a given
kinetic energy the transmission is proportional to EP and w12 as αA is constant This prediction is in
perfect agreement with the obtained data as it is show in Figure 2c The symbols are the experimental
data and the fitted intensities (solid lines) follow the expected behavior as function of EP
IVC-17ICSS-13 and ICN+T2007 IOP PublishingJournal of Physics Conference Series 100 (2008) 072032 doi1010881742-65961007072032
2
0
2
4
6
8
10
0 50 100 150 200 250 300
00
05
10
15
20
∆∆∆∆Eexp = ( ∆∆∆∆E
A
2+∆∆∆∆E
XLW
2 )
05
∆∆∆∆EAE
P = 0039
w1=w
2=3mm
w1=w
2=9mm
EP= 10 eV
EP= 10 eV
w1=w
2=3mm
w1=w
2=9mm
Cu 2p32 E
kin=9025 eV hνννν=9958 eV M=20
∆∆∆∆EA~ 150 meV
(c)
∆∆∆∆EA~ 390 meV
∆∆∆∆EAE
P = 0015
∆∆ ∆∆E
EXP
T= (sinααααo w
1)2(E
PE
kin)
I propproppropprop T =gt I propproppropprop Ep
(b)
EP (eV)
Intensity x 1
03 (cp
s)
9018 9020 9022 9024 9026 9028 9030 9032
0
10
20
30
40
50
60
EP = 20 eV
EP = 100 eV
EP = 50 eV
EP = 200 eV
(a)
w1=w
2=3mm
M=20hνννν = 9958 eV
Cu 2p32
Intensity (arb
units)
EKIN
(eV)
Figure 2 (a) Cu 2p32 peak for different EP and
w1=w2=3mm slits (b) and (c) show respectively the
experimental obtained resolution ∆Eexp (Cu 2p32 FWHM)
and intensity I vs EP for two different slit sets w1=w2=3mm
and w1=w2=9mm The symbols are experimental data and
the solid lines are root square (b) and linear (c) fits of the
data respectively The dash lines in (b) show the analyzer
intrinsic contribution to the energy resolution (s text)
The analyzerrsquos capability to cover a wide energy range (few eV to 15 keV) keeping its outstanding
performances is demonstrated in figure 3 Figure 3a shows a valence band spectrum (VB) from an
polycrystalline Ag sample obtained at 2121 eV photon energy at room temperature Slits of
w1=w2=3mm and Ep=1eV were used The inset shows the expanded Fermi cut-off the continuous line
illustrates the results from the best fit of a Fermi function A pseudo kT value of 39 meV is obtained
that correspond to a ∆Eexp = 130 meV (332 times pseudo kT-value) The difference to the expected
RT value (∆Eexp = 844 meV) is due to broadening induced by the analyzer Assuming a Gaussian
analyzer function an analyzer intrinsic resolution of ∆EA = 100 meV is obtained The analyzer
resolution is reduced to ∆EA=40 meV (not shown here) making a similar analysis at the same
conditions but with 1mm slits (w1=w2) Hence values of ∆EAEP = 01 and ∆EAEP = 004 are obtained
at low energy and EP=1 eV for w12 = 9mm and w12 = 1mm These two values are larger than the
expected values as deduced from the high energy data (s above) This discrepancy can be explained
by the power supply ripple getting discernible at very low pass energies However it must be stressed
that the same power supply is used in both cases and the analyzer resolution limit is better than
40 meV Figure 3c shows the gold 3s 3p and 3d core level spectra obtained with the CSA300HV
analyzer for a photon energy of hν=9 keV and hν=17 keV corresponding to an kinetic energy range of
Ekin = 5-15 keV These spectra in combination with the spectrum shown in Figure 3a demonstrate the
wide electron kinetic energy range covered by the analyzer Hence the developed energy analyzer
maintains its characteristic absolute energy resolution for a wide range of kinetic energies ie from
few eV up to 15 keV
IVC-17ICSS-13 and ICN+T2007 IOP PublishingJournal of Physics Conference Series 100 (2008) 072032 doi1010881742-65961007072032
3
20 18 16 14 12 10 8 6 4 2 0 -2
0
10
20
30
40
50
60
10 05 00 -05 -10
0
50
100
150
200
250
300
(a)
w1=w
2=9mm
hνννν = 2121eV
EP= 1eV
Ag
Intensity (Kcp
s)
Binding Energy (eV)
∆∆∆∆EEXP
= 130meV
∆∆∆∆EA= 100meV
Intensity (cps)
Binding Energy (eV)
3600 3400 3200 3000 2800 2600 2400 2200
00
05
10
15
20
25
30
x3
3p32
3d52
3p12
3d32
3s
hνννν = 9KeV
hνννν = 17KeV
EP= 200eV
w1=w
2=9mmAu
(b)
Intensity (Kcp
s)
Binding Energy (eV)
Figure 3 (a) VB spectra obtained on a polycrystalline Ag sample Inset shows the measured Fermi cut-off
with a HeI source The inset shows the expanded Fermi cut-off the solid line corresponds to the best fit of a
Fermi function to the measured data (b) Representative HAXPES 3s 3p and 3d core level spectra obtained
with the CSA300HV analyzer measured on a polycrystalline Au sample for a photon energy of hν = 9 keV
(Ekin = 54 69 keV) and hν = 17 keV (Ekin = 134 keV 149 keV) The bottom spectrum is multiplied by
a factor 3 Note the absolute and relative cross section differences in both spectra
4 Conclusions and outlook We have developed a novel outstanding electron analyzer that fulfills requirements imposed by the
XRD and HAXPES techniques It is the only commercially available analyzer capable to handle
kinetic energies up to 15 keV down to few eV Spectra over the full range are obtained with the same
setup of the analyzer and power supply The presented results demonstrate that the analyzerrsquos energy
resolution and transmission perform as expected over the full energy range The implementation of a
2D-detector for parallel data acquisition is currently in preparation to increase the measurement speed
and overcome the restrictions imposed by the low cross sections at high kinetic energies
Acknowledgements
We would like to thanks the SpLine and Focus GmbH staff for their valuable help in the development
of the electron analyzer Financial support for this research was provided through Spanish ministry of
Education and Science (MEC) Grants nos FAP-2001-2166 and MAT1999-0241-C01
References [1] Lindau I Pianetta P Doniach S Spicer WE Nature 250 (1974) 214
[2] Scofield JH Lawrence Livermore Report UCRL-51326 (1973) Rubio-Zuazo J and Castro GR
Workshop on Hard X-ray Photoelectron Spectroscopy 2006 Spring-8 Japan September 2006
[3] Proceedings of the Workshop on Hard X-ray Photoelectron Spectroscopy Nucl InstrMeth
Phys Resch A 547 (2005) Workshop on Hard X-ray Photoelectron Spectroscopy 2006 Spring-
8 Japan September 2006
[4] Rubio-Zuazo J and Castro GR Reviews on Advanced Material Science 15 (2007) pp 79-86
AIP Conference Proceedings-2007 International Conference on Frontiers of Characterization
and Metrology for Nanoelectronics
[5] Rubio-Zuazo J and Castro GR to be published
[6] Risley JS Rev Sci Instrum 43 (1971) 95 Sar-El HZ Rev Sci Instrum 38 (1967) 1210 Sar-
El HZ Rev Sci Instrum 41 (1970) 561
[7] Castro GR JSynchrotron Rad 5 657 (1998)
IVC-17ICSS-13 and ICN+T2007 IOP PublishingJournal of Physics Conference Series 100 (2008) 072032 doi1010881742-65961007072032
4

0
2
4
6
8
10
0 50 100 150 200 250 300
00
05
10
15
20
∆∆∆∆Eexp = ( ∆∆∆∆E
A
2+∆∆∆∆E
XLW
2 )
05
∆∆∆∆EAE
P = 0039
w1=w
2=3mm
w1=w
2=9mm
EP= 10 eV
EP= 10 eV
w1=w
2=3mm
w1=w
2=9mm
Cu 2p32 E
kin=9025 eV hνννν=9958 eV M=20
∆∆∆∆EA~ 150 meV
(c)
∆∆∆∆EA~ 390 meV
∆∆∆∆EAE
P = 0015
∆∆ ∆∆E
EXP
T= (sinααααo w
1)2(E
PE
kin)
I propproppropprop T =gt I propproppropprop Ep
(b)
EP (eV)
Intensity x 1
03 (cp
s)
9018 9020 9022 9024 9026 9028 9030 9032
0
10
20
30
40
50
60
EP = 20 eV
EP = 100 eV
EP = 50 eV
EP = 200 eV
(a)
w1=w
2=3mm
M=20hνννν = 9958 eV
Cu 2p32
Intensity (arb
units)
EKIN
(eV)
Figure 2 (a) Cu 2p32 peak for different EP and
w1=w2=3mm slits (b) and (c) show respectively the
experimental obtained resolution ∆Eexp (Cu 2p32 FWHM)
and intensity I vs EP for two different slit sets w1=w2=3mm
and w1=w2=9mm The symbols are experimental data and
the solid lines are root square (b) and linear (c) fits of the
data respectively The dash lines in (b) show the analyzer
intrinsic contribution to the energy resolution (s text)
The analyzerrsquos capability to cover a wide energy range (few eV to 15 keV) keeping its outstanding
performances is demonstrated in figure 3 Figure 3a shows a valence band spectrum (VB) from an
polycrystalline Ag sample obtained at 2121 eV photon energy at room temperature Slits of
w1=w2=3mm and Ep=1eV were used The inset shows the expanded Fermi cut-off the continuous line
illustrates the results from the best fit of a Fermi function A pseudo kT value of 39 meV is obtained
that correspond to a ∆Eexp = 130 meV (332 times pseudo kT-value) The difference to the expected
RT value (∆Eexp = 844 meV) is due to broadening induced by the analyzer Assuming a Gaussian
analyzer function an analyzer intrinsic resolution of ∆EA = 100 meV is obtained The analyzer
resolution is reduced to ∆EA=40 meV (not shown here) making a similar analysis at the same
conditions but with 1mm slits (w1=w2) Hence values of ∆EAEP = 01 and ∆EAEP = 004 are obtained
at low energy and EP=1 eV for w12 = 9mm and w12 = 1mm These two values are larger than the
expected values as deduced from the high energy data (s above) This discrepancy can be explained
by the power supply ripple getting discernible at very low pass energies However it must be stressed
that the same power supply is used in both cases and the analyzer resolution limit is better than
40 meV Figure 3c shows the gold 3s 3p and 3d core level spectra obtained with the CSA300HV
analyzer for a photon energy of hν=9 keV and hν=17 keV corresponding to an kinetic energy range of
Ekin = 5-15 keV These spectra in combination with the spectrum shown in Figure 3a demonstrate the
wide electron kinetic energy range covered by the analyzer Hence the developed energy analyzer
maintains its characteristic absolute energy resolution for a wide range of kinetic energies ie from
few eV up to 15 keV
IVC-17ICSS-13 and ICN+T2007 IOP PublishingJournal of Physics Conference Series 100 (2008) 072032 doi1010881742-65961007072032
3
20 18 16 14 12 10 8 6 4 2 0 -2
0
10
20
30
40
50
60
10 05 00 -05 -10
0
50
100
150
200
250
300
(a)
w1=w
2=9mm
hνννν = 2121eV
EP= 1eV
Ag
Intensity (Kcp
s)
Binding Energy (eV)
∆∆∆∆EEXP
= 130meV
∆∆∆∆EA= 100meV
Intensity (cps)
Binding Energy (eV)
3600 3400 3200 3000 2800 2600 2400 2200
00
05
10
15
20
25
30
x3
3p32
3d52
3p12
3d32
3s
hνννν = 9KeV
hνννν = 17KeV
EP= 200eV
w1=w
2=9mmAu
(b)
Intensity (Kcp
s)
Binding Energy (eV)
Figure 3 (a) VB spectra obtained on a polycrystalline Ag sample Inset shows the measured Fermi cut-off
with a HeI source The inset shows the expanded Fermi cut-off the solid line corresponds to the best fit of a
Fermi function to the measured data (b) Representative HAXPES 3s 3p and 3d core level spectra obtained
with the CSA300HV analyzer measured on a polycrystalline Au sample for a photon energy of hν = 9 keV
(Ekin = 54 69 keV) and hν = 17 keV (Ekin = 134 keV 149 keV) The bottom spectrum is multiplied by
a factor 3 Note the absolute and relative cross section differences in both spectra
4 Conclusions and outlook We have developed a novel outstanding electron analyzer that fulfills requirements imposed by the
XRD and HAXPES techniques It is the only commercially available analyzer capable to handle
kinetic energies up to 15 keV down to few eV Spectra over the full range are obtained with the same
setup of the analyzer and power supply The presented results demonstrate that the analyzerrsquos energy
resolution and transmission perform as expected over the full energy range The implementation of a
2D-detector for parallel data acquisition is currently in preparation to increase the measurement speed
and overcome the restrictions imposed by the low cross sections at high kinetic energies
Acknowledgements
We would like to thanks the SpLine and Focus GmbH staff for their valuable help in the development
of the electron analyzer Financial support for this research was provided through Spanish ministry of
Education and Science (MEC) Grants nos FAP-2001-2166 and MAT1999-0241-C01
References [1] Lindau I Pianetta P Doniach S Spicer WE Nature 250 (1974) 214
[2] Scofield JH Lawrence Livermore Report UCRL-51326 (1973) Rubio-Zuazo J and Castro GR
Workshop on Hard X-ray Photoelectron Spectroscopy 2006 Spring-8 Japan September 2006
[3] Proceedings of the Workshop on Hard X-ray Photoelectron Spectroscopy Nucl InstrMeth
Phys Resch A 547 (2005) Workshop on Hard X-ray Photoelectron Spectroscopy 2006 Spring-
8 Japan September 2006
[4] Rubio-Zuazo J and Castro GR Reviews on Advanced Material Science 15 (2007) pp 79-86
AIP Conference Proceedings-2007 International Conference on Frontiers of Characterization
and Metrology for Nanoelectronics
[5] Rubio-Zuazo J and Castro GR to be published
[6] Risley JS Rev Sci Instrum 43 (1971) 95 Sar-El HZ Rev Sci Instrum 38 (1967) 1210 Sar-
El HZ Rev Sci Instrum 41 (1970) 561
[7] Castro GR JSynchrotron Rad 5 657 (1998)
IVC-17ICSS-13 and ICN+T2007 IOP PublishingJournal of Physics Conference Series 100 (2008) 072032 doi1010881742-65961007072032
4