a novel calcium carbonate scaling model for … considering for both carbonate and bicarbonate ......
TRANSCRIPT

A Novel Calcium Carbonate Scaling Model for Calculating Maximum
Recovery and Inhibitor Dosages in Industrial RO Applications
Calcium carbonate (CaCO3) is the most frequently encountered scale in industrial reverse
osmosis (RO) systems. The Langelier Saturation Index (LSI) has traditionally been used to
predict antiscalant limits to inhibiting CaCO3 scaling, but has been highly unreliable. The lack
of reliability of the LSI is in part due to its use of TDS values to estimate CaCO3 solubility,
rather than ionic strength. Another widely used scale prediction model, the Calcium Carbonate
Precipitation Potential (CCPP), very accurately predicts the quantity of precipitant, but cannot
reliably predict levels at which antiscalants will fail to inhibit scale; the reason being that severe
scaling occurs at very low CCPP values at the upper pH range where the driving force for scale
formation is highest. Both calculations are ineffective at reliably predicting antiscalant dosage
demands at varying pH levels, however both are commonly used to estimate such dosages in the
absence of alternatives.
Antiscalants inhibit crystalline scales like calcium carbonate through threshold inhibition, a
mechanism that interferes with the rate of crystal nucleation. A series of lab experiments
through the neutral to high pH range validated a relationship between the rate of nucleation and
antiscalant demand. This led to the development of a kinetics index used to calculate inhibitor
dosages.
Furthermore, a saturation calculation using ionic activity and ion complexation was developed to
predict the maximum saturation that could be controlled by antiscalants regardless of feedwater
type. By considering for both carbonate and bicarbonate alkalinity, the index was made to be
reliable at any pH. Such a calculation was essential for predicting whether pH reduction would
be required, and for reliably determining the maximum recovery at which an RO system could be
operated.
It was also recognized that antiscalants were severely limited by calcium and magnesium
concentrations when attempting to operate at high recovery or high pH. Calcium and
magnesium at high concentrations can form salts with all antiscalants, whether phosphonate or
acrylate based. Higher inhibitor dosages exasperate this phenomenon, frustrating those who
adhere to the common engineering practice of applying a safety factor. This creates scenarios
where the antiscalant could fail even when a calculated saturation index is well below the
maximum limit for a given inhibitor. The failure is twofold; the calcium or magnesium salts act
as scales, while the loss of active inhibitor results in CaCO3 precipitation. An index was
developed to calculate the point of failure for antiscalants at all pH ranges, with different
constants applied for different antiscalant chemistries.
Using the three abovementioned indices, the maximum recovery, optimal operating pH, and
minimum antiscalant dosage can all be predicted for complex feedwater chemistries. Several
examples of full scale RO systems are presented where the validity of these indices is proven.

Introduction
The most commonly used indices to predict scaling brackish water reverse osmosis systems
(BWRO) are the Langelier Saturation Index (LSI) [1] and the Calcium Carbonate Precipitation
Potential (CCPP) [2]. For seawater reverse osmosis systems (SWRO), a modification of the LSI
known as the Stiff and Davis index (S&DI) [3] is used; while this should theoretically be more
versatile because it uses ionic strength instead of TDS, it has still been shown to be unreliable.
Many suppliers of scale inhibitors have written scale prediction software that rely on these values
for their dosage calculations.
However, our work has shown that it is impossible to correlate any of these indices to a dosage
outside of a very narrow pH range. The dosage required to inhibit scaling for a LSI of 2.3 is
completely different at pH 7 as compared to pH 8. Likewise, a CCPP of 500 mg/l at pH 7 would
not require the same dosage as a CCPP of 500 mg/l at pH 8. Furthermore, a CCPP of 500 mg/l
at pH 9 would be associated with conditions that cause severe scaling and could not be inhibited.
The Stiff and Davis [3] index is widely used for TDS > 10,000 ppm, however, we’ve found it to
be highly misleading in industrial water applications where the water chemistry can be vastly
different to that of seawater.
The purpose of this work was to:
1. Create an index that could be used to determine the scaling potential and maximum
achievable RO recoveries for any type of water.
2. Identify a useful method to predict antiscalant dosages at any pH and for any water
chemistry
Background
LSI was originally developed by Langelier [1] in 1936 to establish the pH at which calcium
carbonate would precipitate to form a protective layer on iron pipe. This was under the mistaken
assumption that passive scales were made up of iron hydroxide co-deposited with calcium
carbonate (we now know that it’s actually ferrous carbonate that forms).
The LSI is based on the algebraic manipulation of the active ion product for calcium carbonate
and that of the dissociation of the bicarbonate ion:
αCa2+ . αCO32- = Ksp (1)
αCO32- . αH+ / αHCO3
- = Ka (2)
where (2) is rearranged and substituted into (1);
αCO32- = Ka . αHCO3
- / αH+ (3)
αCa2+ . Ka . αHCO3- / αH+ = Ksp (4)

and rearranged to solve for the log activity of the hydronium ion;
αH+ = αCa2+ . Ka . αHCO3- / Ksp (5)
Log αH+ = Log αCa2+ + Log Ka + Log αHCO3- - Log Ksp (6)
pHs = - Log αCa2+ - Log Ka - Log αHCO3- + Log Ksp (7)
pHs = - (Log γ Ca2+ + Log γ HCO3-) + Log (Ksp / Ka) - (Log [Ca2+] + Log [HCO3
-]) (8)
where activity coefficients are replaced with a TDS dependent constant (A) and a temperature
correction factor is added for Ksp and Ka values (B), and C and D are calcium and bicarbonate
alkalinity values.
pHs = (A + B) – (C + D)
Langelier did not account for ion complexations – very little data available at the time, and
computers were not available to perform the non-trivial calculations. However, they would have
been likely negligible in the low salinity water for which the LSI was intended.
He used TDS to estimate activity coefficients rather than relying on ionic strength. A complete
water analysis would be required to calculate ionic strength, which makes the use of activity
coefficients impractical for a plant operator who has to make an immediate decision.
For this reason, Langelier created a table of constants that could be referenced by an operator
through a simple TDS measurement and gave a relatively reliable prediction of the likelihood for
protective calcium carbonate scale formation on asbestos cement pipe.
However, the LSI was never meant to be used for RO scaling predictions where the source
waters carry higher salinities, and high recoveries concentrate them further. In these cases,
complexes become very important, and reliable activity coefficients are essential for calculating
both the complex formation and the scale formation potentials.
CCPP [3] is a stoichiometrically limited calculation that accounts for the behavior of alkalinity in
water. When calcium carbonate precipitates, bicarbonate ions dissociate to form more carbonate
and hydronium ions to maintain the equilibrium. The increased concentration in hydronium ions
results in a pH decrease that’s typically observed when calcium carbonate precipitation occurs.
CaCO3 = Ca + CO3
HCO3 = H+ + CO3
The CCPP is different than other scaling calculations in that it accounts for the fact that the
quantity of calcium carbonate that precipitates is not limited to the concentration of carbonate ion
at the time of nucleation, but is actually dependent on total carbonate alkalinity in the water.
At the same time, it is stoichiometrically limited by its reactants. For example, a highly saturated
water with low calcium concentration may result in a low CCPP value, even when scaling is not
controllable by antiscalant.
In RO systems, quantity of precipitate is not necessarily associated with flux decline. A thin
layer of scale covering the membrane surface can be just as disruptive to membrane permeability
as a scaling layer that is triple the thickness.
The CCPP is therefore not useful in predicting maximum recovery in a RO system, nor is it in
any way related to antiscalant dosage. Scale is controlled primarily by threshold inhibition
which acts on a crystal nuclei to prevent its growth into a crystal lattice. The potential for total
calcium carbonate precipitation is therefore of little relevance to the dosages of antiscalant
required.
At best, the CCPP is useful for predicting the severity of differential pressure (ΔP) increases
across the last stage of a system if scaling were not controlled.
It was therefore apparent that a saturation-based approach would be more reliable than a
quantity-based approach for predicting maximum recoveries in RO systems. However, in order
for the saturation calculation to be useful for a broad range of water chemistries, ion complexes
and ion activities had to be considered.
Experimental Setup
Separate solutions of calcium chloride (CaCl2) and sodium bicarbonate (NaHCO3) were prepared
using reagent grade salts in batches large enough to perform up to 10 simultaneous tests. The
solutions were then each filtered using a 0.45 μm filter using a vacuum apparatus to remove any
contaminants. The CaCl2 and NaHCO3 solutions were heated to exactly 25°C and mixed
together into a glass dish at a controlled rate. The mixed solutions were then continuously stirred
on hotplates at 200 rpm for the remainder of the experiment to maintain homogeneity and
simulate laminar flow. The hotplates were equipped with a thermocouple to maintain a
temperature of 25°C throughout the experiment.
pH was adjusted to target in one of the solutions using reagent grade hydrochloric acid (HCl) or
sodium hydroxide (NaOH). Once the amount of HCl or NaOH required was determined, the
bulk solution was adjusted using the same ratio.
Preliminary experiments found significant loss of alkalinity upon mixing of solution, even in the
absence of precipitation. This was presumed to be a result of carbon dioxide off-gassing upon
mixing of the low pH CaCl2 and NaHCO3 solutions. For that reason, the alkalinity was always
measured by titration upon mixing, and that value was used for all subsequent calculations.
Various antiscalants were tested at various dosages. The initial turbidity readings were collected
immediately upon mixing and every 30 minutes thereafter for a total of 2 hours. Turbidity
values were compared to those of deionized water. Antiscalant dosages were only considered
successful if they prevented turbidity from rising above that of deionized water. In some cases,
the experiment at any given pH, calcium and alkalinity concentration would have to be repeated
several times to optimize the dosage for each of the antiscalants tested. Inevitably, experiments
below pH 9 saw a slight increase in pH over the 2 hour period due to CO2 equilibrating with the
atmosphere. For the same reason, experiments at pH 10 and above saw a slight decrease in pH.
While these pH changes would normally be considered to be “noise”, we considered this to be an
important part of the experiment due to scaling events frequently experienced during concentrate
disposal at atmospheric pressure. The goal was to identify a method for calculating antiscalant
dosages that would control scale beyond the membranes.
Experiments were performed at pH 7, 8, 9, 10 and 11. At each pH, multiple values of calcium
and alkalinity were tested. In total 130 different combinations were tested, each test being
repeated a total of three times to validate the results and identify false values caused by human
error.
Results
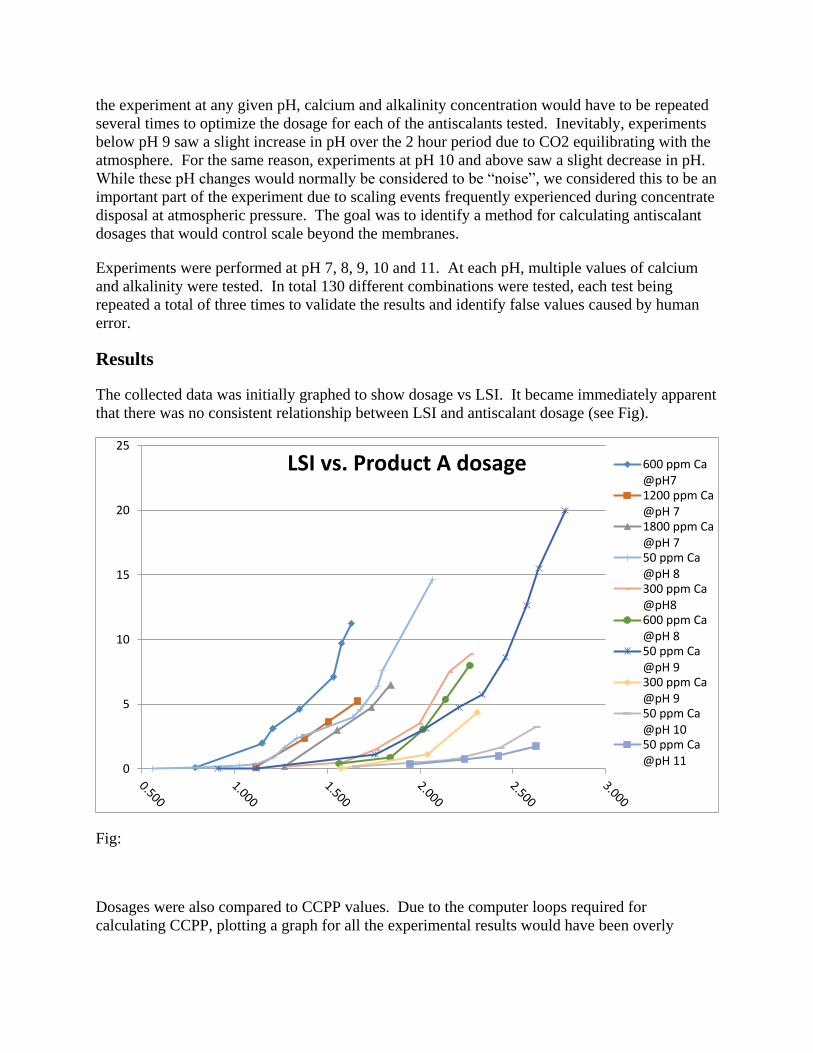
The collected data was initially graphed to show dosage vs LSI. It became immediately apparent
that there was no consistent relationship between LSI and antiscalant dosage (see Fig).
Fig:
Dosages were also compared to CCPP values. Due to the computer loops required for
calculating CCPP, plotting a graph for all the experimental results would have been overly
0
5
10
15
20
25
LSI vs. Product A dosage 600 ppm Ca@pH71200 ppm Ca@pH 71800 ppm Ca@pH 750 ppm Ca@pH 8300 ppm Ca@pH8600 ppm Ca@pH 850 ppm Ca@pH 9300 ppm Ca@pH 950 ppm Ca@pH 1050 ppm Ca@pH 11

tedious. However, several data points were selected and are shown below to demonstrate the
lack of a relationship between CCPP and antiscalant dosage.
The initial goal of this study was to determine whether a reliable saturation calculation could be
correlated to dosages. The approach was to calculate all relevant complexes and then use the
activities of the free calcium and carbonate ions to determine the saturation. Only complexes for
which reliable thermodynamic data was available were considered as follows:
[Ca2+] = [CaT] – {[Ca2+] + [CaOH+] + [Ca(OH)2o
(aq)] + [CaCl+] + [CaF+] + [CaHCO3+] +
[CaCO3o
(aq)] + [CaSO4o
(aq)] + [CaPO4-] + [CaHPO4
o(aq)] + [CaH2PO4
+] + [CaH2SiO4o
(aq)] +
[Ca(H3SiO4)2o
(aq)] + [CaH3SiO4+ + [CaNO3
+]} (9)
[CO32-] = [CT] – {[HCO3
-] + [H2CO3] + [CaHCO3+] + [MgHCO3
+] + [BaHCO3+] + [SrHCO3
+] +
[NaHCO3o
(aq)] + [MnHCO3+] + [FeHCO3
+] + [CaCO3o
(aq)] + [MgCO3o
(aq)] + [BaCO3o
(aq)] +
[SrCO3o
(aq)] + [NaCO3-] + [MnCO3
o(aq)] + [FeCO3
o]} (10)
[Ca2+].γCa2+.[CO32-].γ CO3
2- = KspCaCO3 (11)
The equilibrium and solubility constants would be corrected for temperature by utilizing the
Van’t Hoff equation and the enthalpy of reaction for each association or formation reaction,
where:
∆rG° = -RT ln K (12)
And
∆rGT= (T/298.15) ∆rG° + ∆rH°(1-(T/298.15)) (13)
Where;
∆rG° = Gibbs Free Energy of Reaction
∆rH°= Enthalpy of Reaction
R = Universal Gas Constant
T = Temperature (°K)
K = Equilibrium or Solubility Constant
Since activity coefficients were necessary to calculate the complexes, but calculation of
complexes were necessary to calculate the ionic strength, multiple iterations were required to
determine all values. This was essential because neutral complexes do not contribute to ionic
strength, and monovalent complexes would have a lower contribution to ionic strength than the
free ions originally considered in the ionic strength calculation.
Our experiments used salts of chlorides and sodium, so the formations of those complexes had to
be considered as well in order to determine the ionic strength of the solution. The following
complexes were therefore considered in calculating saturations of the experimental solutions:

[CaT] = [Ca2+] + [Ca2+] + [CaOH+] + [CaCl+] + [CaHCO3+] + [CaCO3
o(aq)] (14)
[CT] = [CO32-] + [HCO3
-] + [H2CO3] + [CaHCO3+] + [NaHCO3
o(aq)] + [CaCO3
o(aq)] + [NaCO3
-]
(15)
[NaT] = [Na+] + [NaOHo] + [NaHCO3] + [NaCO3-(aq)] (16)
[ClT ] = [Cl-] + [CaCl+] (17)
Saturation = [Ca2+].γCa2+.[CO32-].γ CO3
2- / KspCaCO3 (18)
The log of the saturation value was given the name “Calcium Carbonate Nucleation Index” or
CCNI.
Table xx shows a comparison between LSI, CCPP and CCNI vs. the dosage of one of the
antiscalants. It was apparent that there was no correlation between saturation and inhibitor
dosages.
Under these conditions, the CCNI values were extremely similar to LSI. However, the
advantages of using the CCNI to predict whether a scaling potential existed become very
apparent when it was compared to other indices in more complex water.
A projection for a seawater plant operating at 45% recovery (Table xx) calculated the following:
CCNI: 0.04
LSI: 1.66
S&DSI: -2.11
The LSI showed an unrealistically high saturation while the Stiff and Davis index showed the
water to be undersaturated. Since it is known that seawater is supersaturated with calcium
carbonate and that calcium carbonate precipitation can occur in the presence of a seed [4], the
S&DSI value was also considered to be unreliable.
The CCNI value of 0.04 was below the range at which our experiments found spontaneous
nucleation to occur. We found that a minimum 5X saturation was necessary for nucleation to
occur, and this was in agreement with other work [5]. Seawater also contains natural organic
matter (NOM) which has an inhibitory effect on calcium carbonate nucleation [6].
However, despite the usefulness of the CCNI in determining whether a solution with complex
water chemistry was saturated, it could still not be used to predict antiscalant dosages.
Antiscalants have been postulated to interfere with crystal nucleation by changing the kinetics
rather than thermodynamics of crystal growth [7,8]. This suggest that antiscalant dosages would
be dependent on the rate of nucleation rather than the saturation of calcium carbonate scale.

Table: Comparison of CCPP, LSI, S&DSI, and CCNI values to minimum required dosage for scale inhibition. All values are
calculated at 25°C.
Test
pH Ca2+
Total
Na+
Bicarbonate
Alkalinity,
ppm
CaCO3 (by
titration)
Carbonate
Alkalinity,
ppm
CaCO3
(by
titration)
Total
Cl- TDS
Ionic
Strength
CCPP
(mg/l) LSI S&DSI CCNI
Product A
Dosage,
ppm
7.04 600 226 394 0 1122 2428 0.1 222.0 0.787 0.683 .794 0.10
7.06 1800 904 1604 0 3423 8085 0.2 1199.0 1.843 1.421 1.649 6.50
8.01 50 2864 6018 0 214 10469 0.1 123.2 1.794 1.556 1.727 7.125
8.02 50 5727 11817 0 293 20487 0.2 124.1 2.065 1.492 1.877 14.625
8.01 600 345 732 0 1062 2900 0.1 512.8 2.015 1.915 2.017 3.055
9.06 50 42 76 14 88 282 0.0 18.2 1.117 1.055 1.325 0.0625
9.02 50 729 1290 260 88 2597 0.0 124.2 2.207 2.176 2.320 4.75
9.03 300 143 228 86 531 1303 0.0 171.2 2.306 2.213 2.400 4.375

Table: Water Quality Obtained from Projection for a Seawater RO plant operating at 45% recovery. A
temperature of 25 °C was used for the purposes of the projection.
Cations Raw
pH
Adjusted
Feed Reject Permeate Anions Raw
pH
Adjusted
Feed Reject Permeate
mg/L mg/L mg/L mg/L mg/L mg/L mg/L mg/L
Ca2+ 437.37 437.37 793.74 1.81 HCO3- Alk (CaCO3) 153.18 148.28 239.93 0.71
Mg2+ 1435.58 1435.58 2605.29 5.93 CO32- Alk (CaCO3) 11.57 21.42 97.29 0.00
Ba2+ 0.02 0.02 0.04 0.00 Total Alk (CaCO3) 164.76 169.71 337.22 0.71
Sr 2+ 7.64 7.64 13.87 0.03 Orthophosphate (PO43-) 0.33 0.33 0.60 0.00
Na+ 12085.04 12085.04 21934.94 55.63 SO42- 2358.94 2358.94 4287.03 2.39
K+ 401.96 401.96 729.32 1.85 F- 0.86 0.86 1.56 0.01
Ferrous (Fe2+) 0.00 0.00 0.00 0.00 Cl- 22103.00 22106.00 40106.53 105.36
Calculated Fe3+ Br- 0.32 0.32 0.58 0.00
Ferric (Fe3+) 0.00 0.00 0.00 0.00 SiO2 1.00 1.00 1.81 0.01
Al3+ 0.00 0.00 0.00 0.00 Nitrate (NO3- - N) 0.00 0.00 0.00 0.00
Mn2+ 0.00 0.00 0.000 0.00 Nitrite (NO2- - N) 0.00 0.00 0.00 0.00
Total Ammonia (NH3-N) 0.00 0.00 0.000 0.00 Total Sulfide (as S2-) 5.50 5.50 9.69 0.38
B(OH)3 - B 0.00 0.00 0.00 0.00
H3AsO3 - As(III) 0.00 0.00 0.000 0.00
pH 8.20 8.20 8.23 6.60 H3AsO4 - As(V) 0.00 0.00 0.000 0.00

When an attempt was made to correlate antiscalant dosages to the rate of
precipitation, the initial results were promising than those for LSI, but the slopes
were still vastly different. However, when the antiscalant complexes for sodium
and calcium (the only two metals involved in our experiments) were taken into
account, the dosages showed a very predictable relationship to the rate of
precipitation (see Fig….).
It therefore became evident that only free antiscalant would act to inhibit scale, and
as such, dosages had to account for all cations in solution. Our model was
therefore adjusted to account for ligand formation with Na, K, Ca, Mg, Ba, Sr, Fe
(II), Fe(III), Mn (II), Al.
A review of the experimental data found that precipitation would sometimes occur
at extremely low saturation values. In those cases, there would be no pH decline
despite an extremely high turbidity, suggesting that the precipitate did not consist
of calcium carbonate. SEM/EDS analysis of the precipitate found that the scales
consisted of calcium salts of the antiscalant, regardless of whether a phosphonate
of polymer were used. The precipitations did not occur only when calcium levels
were high, but also appeared to form at low calcium concentrations when alkalinity
was extremely high. This suggested that a calcium-carbonate-antiscalant
compound was forming. Furthermore, available Ksp values for calcium-
antiscalant salts verified that in all cases, the solutions were unsaturated for those
precipitants. When phosphonate antiscalants were tested, the SEM/EDS analyses
verified that Ca:P ratios were not consistent with pure calcium phosphonate scales.
This observation made it clear that the reason that inhibition could not be
correlated to a calcium carbonate saturation index was because the precipitant was
not calcium carbonate. It appeared that when a scale could not be controlled, it
was either due to underdosing of antiscalant, resulting in calcium carbonate scale
formation, or overdosing of antiscalant where a salt of the antiscalant would form.
However, overdosing of the antiscalant was sometimes inevitable. During our
experiments, dosages would be increased with every experiment until a turbidity
equivalent to that of deionized water could be achieved. In some cases, a higher
dosage would show improved turbidity with every trial, but after a certain dosage
is exceeded, the turbidity would suddenly get worse. When even higher dosages
were attempted, turbidity values only increased. In other words, the dosage of
antiscalant necessary to inhibit the calcium carbonate scale under those conditions
would form a calcium-antiscalant precipitate.
It was also observed that calcium carbonate precipitation would eventually follow,
as a result of active antiscalant being removed from solution as a precipitate.

Fig: Free antiscalant dosage vs calcium carbonate precipitation rate
0.0000E+00
1.0000E-10
2.0000E-10
3.0000E-10
4.0000E-10
5.0000E-10
6.0000E-10
7.0000E-10
8.0000E-10
Fre
e A
ctiv
e A
nti
scal
ant
(mo
ls)
Rate of Precipitation (k/ko[A][B])
Free Active Antiscalant vs Rate of Precipitation
600 ppm Ca @ pH 7
1200 ppm Ca @ pH 7
1800 ppm Ca @ pH 7
50 ppm Ca @ pH 8
300 ppm Ca @pH8
600 ppm Ca @pH 8
50 ppm Ca @ pH 9
300 ppm Ca @ pH 9
50 ppm Ca @ pH 10
50 ppm Ca@ pH 11
Solubility limits were estimated for the various antiscalants based on the
experimental results, as functions of calcium, carbonate and antiscalant
concentrations. This resulted in a fairly reliable method for predicting antiscalant
failures in RO systems. In order to simplify their use, a constant was added to the
saturation values to achieve a single failure value regardless of which antiscalant
was used. This was named “Antiscalant Precipitation Index”.
Conclusion
A series of calcium carbonate precipitation experiments were performed at various
pH values, calcium and alkalinity concentrations. The results of the experiment
verified that LSI, S&DSI and CCPP were not useful at predicting antiscalant
dosages or maximum RO recoveries. A new index, the Calcium Carbonate
Nucleation Index (CCNI), was developed to account for complexes and ionic
activities. This index reliably predicted scaling potential in brackish and seawater,
but also could not be used for antiscalant dosages or maximum recoveries.
A review of the experimental data determined that antiscalant dosages had no
dependence on saturations, but were instead functions of precipitation kinetics.
Solutions with higher calcium or sodium concentrations clearly required higher
dosages; Incorporation of calculations for cation ligands enabled the free active
antiscalant to be correlated to antiscalant precipitation under all test conditions.
Maximum RO recoveries with respect to calcium carbonate were determined to be
primarily limited by antiscalant precipitation, as opposed to calcium carbonate
saturation. An index, the Antiscalant Precipitation Index (API), was developed
and incorporated into a reverse osmosis projection software to help predict
maximum recoveries.
In conclusion, no single index could be used to predict calcium carbonate
saturation, antiscalant dosage, and maximum RO recovery. Three separate indices
were developed and incorporated into a membrane projection software so they
could be used simultaneously.

References:
1. Langelier, Wilfred F. "The analytical control of anti-corrosion water treatment." Journal (American Water Works Association) 28.10 (1936): 1500-1521.
2. AWWA (American Water Works Association), The Rothberg, Tamburini & Winsor Model for Corrosion Control and Process Chemistry, Version 3.0 (1996).
3. ASTM D4582-10, Standard Practice for Calculation and Adjustment of the Stiff and Davis Stability
Index for Reverse Osmosis, ASTM International, West Conshohocken, PA, 2010, www.astm.org
4. Correns, Carl W. Introduction to mineralogy: crystallography and petrology. Springer Science & Business Media, 2012.
5. Sun, Wenhao, et al. "Nucleation of metastable aragonite CaCO3 in seawater." Proceedings of the National Academy of Sciences 112.11 (2015): 3199-3204.
6. Lin, Yi-Pin, Philip C. Singer, and George R. Aiken. "Inhibition of calcite precipitation by natural organic material: kinetics, mechanism, and thermodynamics." Environmental science & technology 39.17 (2005): 6420-6428.
7. Toulhoat, Hervé. Physical Chemistry of Colloids and Interfaces in Oil Production: Proceedings of the 6th IFP Exploration and Production Research Conference, Held in Saint-Raphaël, September 4-6, 1991. Vol. 49. Editions Technip, 1992.
8. Jonasson, Ralph G., et al. "Effect of phosphonate inhibitors on calcite nucleation kinetics as a function of temperature using light scattering in an autoclave." Chemical geology 132.1 (1996): 215-225.