a novel approach for multimodal medical image fusion using...
TRANSCRIPT

A Novel approach for Multimodal Medical Image Fusion using Hybrid
Fusion Algorithms for Disease Analysis
B.Rajalingam1, Dr.R.Priya
2
1Research Scholar,
2Associate Professor
Department of Computer Science & Engineering, Annamalai University,
Chidambaram, Tamilnadu, India
[email protected], [email protected]
Abstract
Multimodality medical image fusion technique performs a vital role in biomedical
research and clinical disease analysis. The medical image fusion is used to improve the quality
of multimodality medical images by merge the two multimodal medical images of the same
patient. This paper, proposed a novel multimodal medicinal image fusion approach based on
hybrid fusion techniques. Magnetic Resonance Imaging (MRI), Positron Emission
Tomography (PET) and Single Photon Emission Computed Tomography (SPECT) are the
input multimodal therapeutic brain images and the curvelet transform with neural network
techniques are applied to fuse the multimodal medical image. Along with, Subband
Decomposition, Dividing the multimodal medical image into resolution layers, Smooth
Partitioning used smoothly squares input medical images with appropriate scale. Ridgelet
Transform techniques was used along with radon Transform to execute multimodal medical
image to convert from 1-D to 2-D image in the restoration level, after reconstructed
multimodality medical image applied the pulse coupled neural network fusion rule to get the
fused medical image. The proposed work combines the curvelet transform with pulse coupled
neural network for fusion process. Hybrid fusion algorithms are evaluated using several
performance quality metrics. Compared with other existing techniques the proposed technique
experimental results demonstrate the better processing performance and results in both
subjective and objective evaluation criteria.
Keywords: Multimodal medical image fusion, MRI, PET, SPECT, PCA, DWT, DCHWT,
GIF, curvelet transform, Sub-band Decomposition, Ridgelet Transform and PCNN.
1 Introduction
Image fusion is the mixture of two or more different images to form a novel image by
using certain techniques. It is extracting information from multi-source images and improves
the spatial resolution for the original multi-spectral image and preserves the spectral
information. Image fusion can be done in three levels: Pixel level fusion, Feature level fusion
and Decision level fusion. Pixel-level fusion having a large portion of the remarkable data is
protected in the merged image. Feature-level fusion performs on feature-by-feature origin,
such as edges, textures. Decision-level fusion refers to make a final merged conclusion. The
image fusion decrease quantity of information and hold vital data. It make new output image
that is more appropriate for the reasons for human/machine recognition or for further
processing tasks. Image fusion is classified into two types‟ single sensor and multi sensor
picture combination consolidating the pictures from a few sensors to shape a composite
International Journal of Pure and Applied MathematicsVolume 117 No. 15 2017, 599-619ISSN: 1311-8080 (printed version); ISSN: 1314-3395 (on-line version)url: http://www.ijpam.euSpecial Issue ijpam.eu
599

picture and their individual pictures are converged to acquire an intertwined image Ex: Multi
focus and Multi Exposure fusion.
Multi sensor image fusions merge the images from several sensors to form a composite
image and their individual images are merged to obtain a fused image. Ex: medical imaging,
military area. Multimodality medical images categorised into several types which include
computed tomography (CT), magnetic resonance angiography (MRA), magnetic resonance
imaging (MRI), positron emission tomography (PET), ultra sonography (USG), nuclear
magnetic resonance(NMR) spectroscopy, single photon emission computed tomography
(SPECT), X-rays, visible, infrared and ultraviolet. MRI, CT, USG and MRA images are the
structural therapeutic images which afford lofty resolution images. PET, SPECT and
functional MRI (fMRI) images are functional therapeutic images which afford low-spatial
resolution images with functional information. Anatomical and functional therapeutic images
can be incorporated to obtain more constructive information about the same object. Medicinal
image fusion reduces storage cost by storing the single fused image instead of multiple-input
images. Multimodal medical image fusion uses the pixel level fusion. Different imaging
modalities can only provide limited information. Computed Tomography (CT) image can
display accurate bone structures. Magnetic Resonance Imaging (MRI) image can reveal
normal and pathological soft tissues. The fusion of CT and MRI images can integrate
complementary information to minimize redundancy and improve diagnostic accuracy.
Combined PET/MRI imaging can extract both functional information and structural
information for clinical diagnosis and treatment. Image fusion having several applications like
medical imaging, biometrics, automatic change detection, machine vision, navigation aid,
military applications, remote sensing, digital imaging, aerial and satellite imaging, robot
vision, multi focus imaging, microscopic imaging, digital photography and concealed weapon
detection. Multimodal medical imaging plays a vital role in a large number of healthcare
applications including medical diagnosis and treatment. Medical image fusion combining
multiple images into form a single fused modalities. Medical image fusion methods involve
the fields of image processing, computer vision, pattern recognition, machine learning and
artificial intelligence.
The research paper is organized as follows. Sec. 2 describes the literature survey on
related works. Sec. 3 discusses the proposed research work method both traditional and hybrid
multimodal medical image fusion techniques, performance evaluation metrics is briefly
reviewed. Sec. 4 describes the implemented medical image fusion experimental results and
performance comparative analysis. Finally, Sec. 5 concludes the paper.
2 Related Works
Jiao Du, Weisheng Li, Ke Lu.[1] proposed the multimodal medicinal image fusion for
the image disintegration, image restoration, image mixture rules and image excellence
assessments. Therapeutic image fusion has been broadly used in medical assessments for
disease diagnose. Xiaojun Xua, Youren Wang, et al. [2] proposed a multimodality medicinal
image mixture algorithm based on discrete fractional wavelet transform. The input therapeutic
images are decomposed using discrete fractional wavelet transform. The sparsity character of
the mode coefficients in subband images changes. Xingbin Liu, Wenbo Mei, et al.[3]
proposed a new technique namely Structure tensor and non subsampled shearlet transform
(NSST) to extract geometric features. A novel unified optimization model is proposed for
International Journal of Pure and Applied Mathematics Special Issue
600

fusing computed Tomography (CT) and Magnetic Resonance Imaging (MRI) images. K.N.
Narasimha Murthy and J. Kusuma[4] proposed Shearlet Transform (ST) to fuse two different
images Positron Emission Tomography (PET) and Magnetic Resonance Imaging (MRI) image
by using the Singular Value Decomposition (SVD) to improve the information content of the
images. Satishkumar S. Chavan, Abhishek Mahajan,et al.[5] introduced the technique called
Nonsubsampled Rotated Complex Wavelet Transform (NSRCxWT) combining CT and MRI
images of the same patient. It is used for the diagnostic purpose and post treatment review of
neurocysticercosis. S. Chavan, A. Pawar, et al.[6] innovated a feature based fusion technique
Rotated Wavelet Transform (RWT) and it is used for extraction of edge-related features from
both the source modalities (CT/MRI). Heba M. El-Hoseny, El-Sayed M.El.Rabaie,et al.[7]
proposed a hybrid technique that enhance the fused image quality using both traditional and
hybrid fusion algorithms(Additive Wavelet Transform (AWT) and Dual Tree complex
wavelet transform (DT-CWT)). Udhaya Suriya TS, Rangarajan P [8] implemented an
innovative image fusion system for the detection of brain tumours by fusing MRI and PET
images using Discrete Wavelet Transform (DWT). Jingming Yang, YanyanWu,et al.[9]
described an Image fusion technique Non-Subsampled Contourlet Transform (NSCT) to
decompose the images into lowpass and highpass subbands. C.Karthikeyan, B. Ramadoss[10]
proposed the fusion of medical images using dual tree complex wavelet transform (DTCWT)
and self organizing feature map (SOFM) for better disease diagnosis. Xinzheng Xu,Dong
Shana,et al.[11] introduced an adaptive pulse-coupled neural networks (PCNN), which was
optimized by the quantum-behaved particle swarm optimization (QPSO) algorithm to improve
the efficiency and quality of QPSO. Three performance evaluation metrics is used. Jyoti
Agarwaland Sarabjeet Singh Bedi, et al.[12] innovate the hybrid technique using curvelet and
wavelet transform for the medical diagnosis by combining the Computed Tomography (CT)
image and Magnetic Resonance Imaging (MRI) image. Jing-jing Zonga and Tian-shuang
Qiua[13] proposed a new fusion scheme for medical images based on sparse representation of
classified image patches In this method, first, the registered input images are separated into
confidential patches according to the patch geometrical route, from which the corresponding
sub-dictionary is trained via the online dictionary learning (ODL) algorithm and the least
angle regression (LARS) algorithm to sparsely code each patch; second, the sparse
coefficients are combined with the “choose-max” fusion rule; Finally, the fused image is
reconstructed from the combined sparse coefficients and the corresponding sub-dictionary.
Richa Gautam and Shilpa Datar[14] proposed a method for fusing CT (Computed
Tomography) and MRI (Medical Resonance Imaging) images based on second generation
curvelet transform. Proposed method is compared with the results obtained after applying the
other methods based on Discrete Wavelet Transform (DWT), Principal Component Analysis
(PCA) and Discrete Cosine Transform (DCT). Jiao Du, Weisheng Li, Bin Xiao,et.al.[15]
proposed an approach union Laplacian pyramid with multiple features for accurately
transferring salient features from the input medical images into a single fused image. Zhaobin
Wang, Shuai Wang,Ying Zhu,et al.[16] described the statistical analysis PCNN and some
modified models are introduced and reviewed the PCNN‟s applications in the field of image
International Journal of Pure and Applied Mathematics Special Issue
601

fusion. Zhaobin Wang, Shuai Wang, et al.[17] Proposed a novel guided filtering based
weighted average technique to make full use of spatial consistency for fusion of the base and
detail layers. B. K. Shreyamsha Kumar [18] proposed a discrete cosine harmonic wavelet
transform (DCHWT) based image fusion to retain the visual quality and performance of the
merged image with reduced computations.
3 Proposed Research Work
3.1 Traditional Multimodal Medical Image Fusion Techniques
This paper implements different traditional image fusion algorithms for different types
of multimodality medical images as shown in Figure. 1
3.1.1 Principal Component Analysis (PCA)
Principal Component Analysis (PCA) is one of the well-known techniques used for
measurement decrease, feature removal and data revelation. In general, PCA is defined by the
conversion of an elevated dimensional vector space into a near to the ground dimensional
vector space. This property of principal component analysis is helpful in reducing the size of
medical image data which is of large size without losing essential information. In this method
a number of simultaneous variables are altered into uncorrelated variables called principal
components. Each principal component is taken in the route of highest variance and lie in the
subspace at right angles to one another.
3.1.1.1 Procedural steps for image fusion using PCA algorithm
1) Convert the two input multimodal images into column vectors and make a matrix „B‟ using
these two column vectors.
2) Calculate the empirical mean vector along each column and subtract it from each of the
columns of the matrix.
3) Calculate the covariance matrix „R‟ of the resulting matrix.
4) Calculate the eigen values K and eigen vectors E of the covariance matrix.
5) Select the eigenvector equivalent to well-built eigen value and divide its each element by
mean of that eigenvector. This will give us first principal component P1. Repeat the same
procedure with eigenvector corresponding to smaller eigen value to get second principal
component P2.
Figure 1 Traditional multimodal medical image fusion techniques
Transform Domain
Fusion Techniques
Neural Network
GIF DWT, DCHWT, CVT
Traditional Multimodal Medical Image Fusion Techniques
PCNN
Image Fusion Filter
Techniques
Spatial Domain
Techniques
PCA
International Journal of Pure and Applied Mathematics Special Issue
602

𝑃1 =𝑅(1)
𝑅 𝑃2 =
𝑅(2)
𝑅
6) Final Fused multimodal medical image is obtained by
𝐼𝑓 𝑥,𝑦 = 𝑃1𝐼1 𝑥,𝑦 + 𝑃2𝐼2 𝑥,𝑦 (1)
3.1.2 Image Fusion with Guided Filtering
Currently, in medical image processing energetic research topic is edge preserving
filter technique. Image processing has several edge preserving smoothing filtering techniques
such as guided filter, weighted least squares and bilateral filter. Among the several filter
techniques the guided image filter is giving better results and less execution time for fusion
process. This image fusion filter method is based on a local linear form, creating it eligible for
other image processing methods such as image matting, up-sampling and colorization. A
multi-level representation is utilized by average smoothing filter. Subsequently, based on
weighted average fusion technique, the guided image filter fuses the bottom and feature layers
of multi-modal medical images.
3.1.2.1 Multi level Image Decomposition
The average filter used to decompose the input multimodal medical images into multilevel
representations. The bottom layer of each input image is represented by.
𝑬𝑛 = 𝑆𝑛 ∗ 𝐾 (2)
Where the nth
input image is denoted as Sn, average filter is represented by K and the 31×31
conventional matrix is set to average filter size. First the bottom layer is found then the feature
layer can be simply computed by subtracting the bottom layer from the input medical images.
𝑭𝑛 = 𝑆𝑛 − 𝐸𝑛 (3)
The aim of the multi level decomposition step is to separate each input medical images into
bottom and feature layer. A bottom layer contains the huge level variations in strength and a
feature layer contains the minute level information.
3.1.2.2 Guided image filter with weight map construction
The Gaussian filtering is applied on both the input multimodality medical images to
get the high pass multimodal medical image Rn.
𝑹𝑛 = 𝑆𝑛 ∗ 𝑀 (4)
Where the Gaussian filters is represented by M with 3 × 3 matrix. Construct the saliency maps
Pn using the local average value of Rn.
𝑃𝑛 = |𝑅𝑛 | ∗ 𝑣𝑟𝑣𝜎𝑣 (5)
Where Gaussian low pass filter is denoted by v and (2rv + 1) (2rv + 1) is the size of low pass
filter and the rv and σv parameters of the Gaussian filters. The calculated saliency weight maps
are giving good description and detail information of the saliency intensity. After that, the
saliency weight maps are compared to establish the weight maps are represented by,
𝑇𝑥𝑘 = 1 𝑖𝑓 𝑃1
𝑘 = max(𝑃1𝑘 ,𝑃2
𝑘 …… . ,𝑃𝑋𝑘)
0 𝑜𝑡𝑒𝑟𝑤𝑖𝑒 (6)
Where the number of input multimodal medical images is represented by X, the saliency value
of the pixel k in the nth
image is 𝑃𝑥𝑘 . But, the artifacts of the merged image which may
produce the weight maps with noisy and not associated with object limitations. The effective
way to solve the above problem is to use spatial consistency. Spatial consistency is two
adjacent pixels have identical clarity or color, they will be apt to have comparable weights.
The formulating an energy function is based on spatial consistency fusion approach. To get
the essential weight maps this energy function can be minimized globally. But, the
optimization based methods are often somewhat incompetent. Guided image filtering is
International Journal of Pure and Applied Mathematics Special Issue
603

performed on every weight map Tn with the equivalent input image Sn serving as the
supervision image.
𝑊𝑛𝐸 = 𝑉𝑟1𝜀1
(𝑇𝑛 ,𝑆𝑛) (7)
𝑊𝑛𝐹 = 𝑉𝑟1𝜀1
(𝑇𝑛 , 𝑆𝑛) (8)
Where the guided image filtering parameters are represented by 𝑟1, 𝜀1, 𝑟2,𝑎𝑛𝑑 𝜀2, the weight
maps of the bottom and features layers denoted by 𝑊𝑛𝐸 and 𝑊𝑛
𝐹 . N is normalized weight maps
value and each pixel k is sum to one. The inspiration of the weight maps construction
technique is represented in the following expression. The eqn.1, eqn. 3 and eqn. 4 derived the
local variance point i is referred by its value very small and the supervision image having
pixel in very large, then ak will become close to 0 and the filtering output R will equal to 𝑇𝑘 . If the local variance of pixel i having very large value, then the i is represent the pixel edge
area, next ak will become far from zero. As established in, ∇R ≈ 𝑎 ∇S will turn into accurate,
which means that only the weight map in one side of the edge will be averaged. In both
situations, those pixels with identical color or clarity tend to have comparable weights. In
contrast, sharp and edge-aligned weights are preferred for merging the feature layers because
details may be lost when the weights are over-smoothed. Hence, a large filter size and a large
blur degree are chosen for merging the bottom layers, while a minute filter size and a minute
blur degree are chosen for the feature layers.
3.1.2.3 Multi level Image re-enactment
Multi level image reconstruction contains the following two steps. Initially, the bottom and
feature layers of different input multimodal medical images are combined together using
weighted averaging filtering
𝐸 = 𝑊𝑛𝐸𝑁
𝑛=1 𝑬𝑛 (9)
𝐹 = 𝑊𝑛𝐹𝑁
𝑛=1 𝑭𝑛 (10)
Next, the merged output multimodal medical image R is obtained by combining the merged
bottom layer 𝐸 and the merged feature layer 𝐹
𝑅 = 𝐸 + 𝐹 (11)
3.1.2.4 Procedural steps for image fusion using Guided Image Filtering:
1) Take the two input multimodal medical images.
2) Resize both images into 512 x 512 dimensions.
3) Decompose the input multimodal medical images using average filtering.
4) Separate the input multimodality medical images into bottom layer and feature layer based
on multi scale representation.
5) Apply the Gaussian laplacian filters for to construct the weight map and saliency map.
6) Perform the image reconstruction and get the final fused multimodal medical image.
3.1.3 Discrete Wavelet Transform (DWT) Wavelet transform is applied in two domains namely continuous and discrete. CWT
(Continuous Wavelet Transform) is the correlation between the wavelet at different scales
(inverse of frequency) and the signal and is figured by changing the size of the investigation
window each time, moving it, increasing it by the flag. Scientific condition is given by
𝜑𝑥 𝜏,𝑅 =1
𝑅 𝑋 𝑡 .𝜑 ∗ 𝑡 −
𝜏
𝑅 𝑑𝑡 (12)
In the above expression τ (translation) and R (scale) are variables required for transforming
the signal x (t). Psi (Ψ) is the transforming function known as mother wavelet. In DWT
(Discrete Wavelet Transform) a 2D signal (image) I(x, y) is first filtered through low pass and
high pass finite impulse response filters (FIR), having impulse response h[n] in horizontal
direction and then decimated by factor of 2. This gives first level decomposition. Further the
low pass filtered image is again filtered through low pass and high pass FIR filters in vertical
International Journal of Pure and Applied Mathematics Special Issue
604
direction and then again decimated by 2 to obtain second level decomposition. Filtering
operation is given by the convolution of the signal and impulse response of signal.
𝑋 𝑛 ∗ 𝑛 = 𝑋 𝑘 . [𝑛 − 𝑘]∞𝑘=−∞ (13)
Now to perform inverse wavelet transform, first up sample the sub band images by factor of 2
column wise and then filter them through low pass and high pass FIR filters. Repeat the same
process in next step row wise. Now add all the images to get the original image.
3.1.3.1 Procedural steps for image fusion using DWT algorithm
1) Take the two input multimodal medical images.
2) Resize both images into 512 x 512 dimensions.
3) Convert both the images into gray scale if required.
4) Apply 2D-DWT on both the images and obtain its four components.
5) Now apply the fusion rule as per the requirement.
a) Most extreme pixel determination governs (all maximum): By choosing every single
greatest coefficient of both the input images and merging them.
b) Mean: By taking the normal of the coefficients of both the images.
c) Blend: By taking the normal of the estimated coefficients of both the input images and
choosing the most extreme pixels from detail coefficients of both the input data.
6) Now apply IDWT to obtain the fused output image.
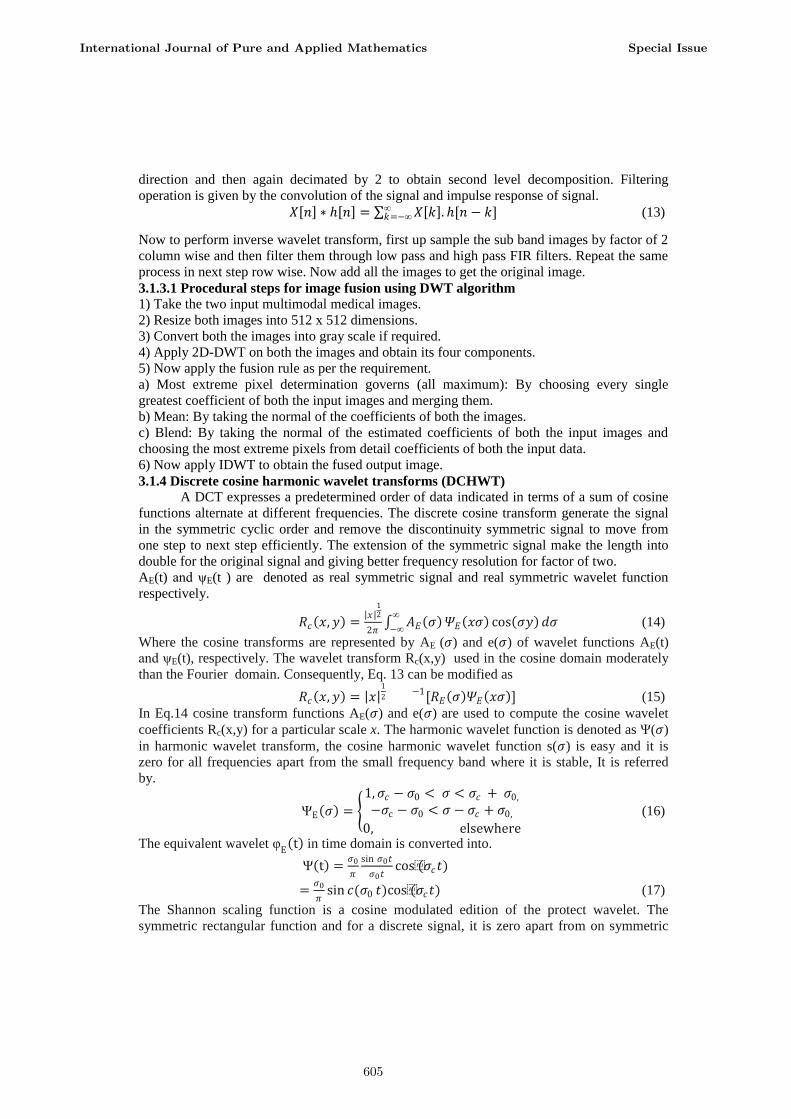
3.1.4 Discrete cosine harmonic wavelet transforms (DCHWT)
A DCT expresses a predetermined order of data indicated in terms of a sum of cosine
functions alternate at different frequencies. The discrete cosine transform generate the signal
in the symmetric cyclic order and remove the discontinuity symmetric signal to move from
one step to next step efficiently. The extension of the symmetric signal make the length into
double for the original signal and giving better frequency resolution for factor of two.
AE(t) and ψE(t ) are denoted as real symmetric signal and real symmetric wavelet function
respectively.
𝑅𝑐 𝑥,𝑦 = 𝑥
12
2𝜋 𝐴𝐸 𝜎 ∞
−∞𝛹𝐸 𝑥𝜎 cos 𝜎𝑦 𝑑𝜎 (14)
Where the cosine transforms are represented by AE (𝜎) and e(𝜎) of wavelet functions AE(t)
and ψE(t), respectively. The wavelet transform Rc(x,y) used in the cosine domain moderately
than the Fourier domain. Consequently, Eq. 13 can be modified as
𝑅𝑐 𝑥,𝑦 = 𝑥 1
2 −1[𝑅𝐸 𝜎 𝛹𝐸 𝑥𝜎 ] (15)
In Eq.14 cosine transform functions AE(𝜎) and e(𝜎) are used to compute the cosine wavelet
coefficients Rc(x,y) for a particular scale x. The harmonic wavelet function is denoted as Ψ(𝜎)
in harmonic wavelet transform, the cosine harmonic wavelet function s(𝜎) is easy and it is
zero for all frequencies apart from the small frequency band where it is stable, It is referred
by.
ΨE 𝜎 =
1,𝜎𝑐 − 𝜎0 < 𝜎 < 𝜎𝑐 + 𝜎0,
−𝜎c − 𝜎0 < 𝜎 − 𝜎𝑐 + 𝜎0,
0, elsewhere
(16)
The equivalent wavelet υE t in time domain is converted into.
Ψ t =𝜎0
𝜋
sin 𝜎0𝑡
𝜎0𝑡cos(𝜎𝑐𝑡)
=𝜎0
𝜋sin 𝑐(𝜎0 𝑡)cos(𝜎𝑐𝑡) (17)
The Shannon scaling function is a cosine modulated edition of the protect wavelet. The
symmetric rectangular function and for a discrete signal, it is zero apart from on symmetric
International Journal of Pure and Applied Mathematics Special Issue
605
finite bands [π/c, π/d] and [−π/c, −π/d] where c, d can be real numbers for the spectral
weighing in cosine harmonic transform. The cosine harmonic transform too suffers from the
difficulty of poor time localization and the result of spectral weighing to restrict in time period
by wavelet functions other than rectangular outputs in non orthogonal wavelets due to spectral
overlap similar to the Fourier based harmonic wavelet transform. In discrete cosine harmonic
wavelet transform the multimodal medical image is decomposed by cluster the discrete cosine
transform coefficients in a method similar to that of discrete Fourier transform coefficients
except for the conjugate procedure in inserting the coefficients symmetrically. The inverse
discrete cosines transform of these collection results in discrete cosine harmonic wavelet
coefficients. The discrete cosine transform of these progression subbands results in subband
DCT coefficients, which are relocated in their equivalent spot to recover the overall DCT
range at the unique sampling rate.
3.1.4.1 Procedural steps for image fusion using DCHWT algorithm
1) Take the two source multimodal medical images.
2) Resize both images into 512 x 512 dimensions
3) Divide the first 2D image into rows and link them together in a chain form to have a 1D
row vector R.
4) Divide the second 2D image into columns and link them together in a chain form to have a
1D column vector C.
5) Apply DCHWT on both R and C separately and then apply averaging operation on the
vectors.
6) Apply inverse DCHWT on the resulting vector.
7) Convert 1D vector into 2D image to obtain the fused output medical image
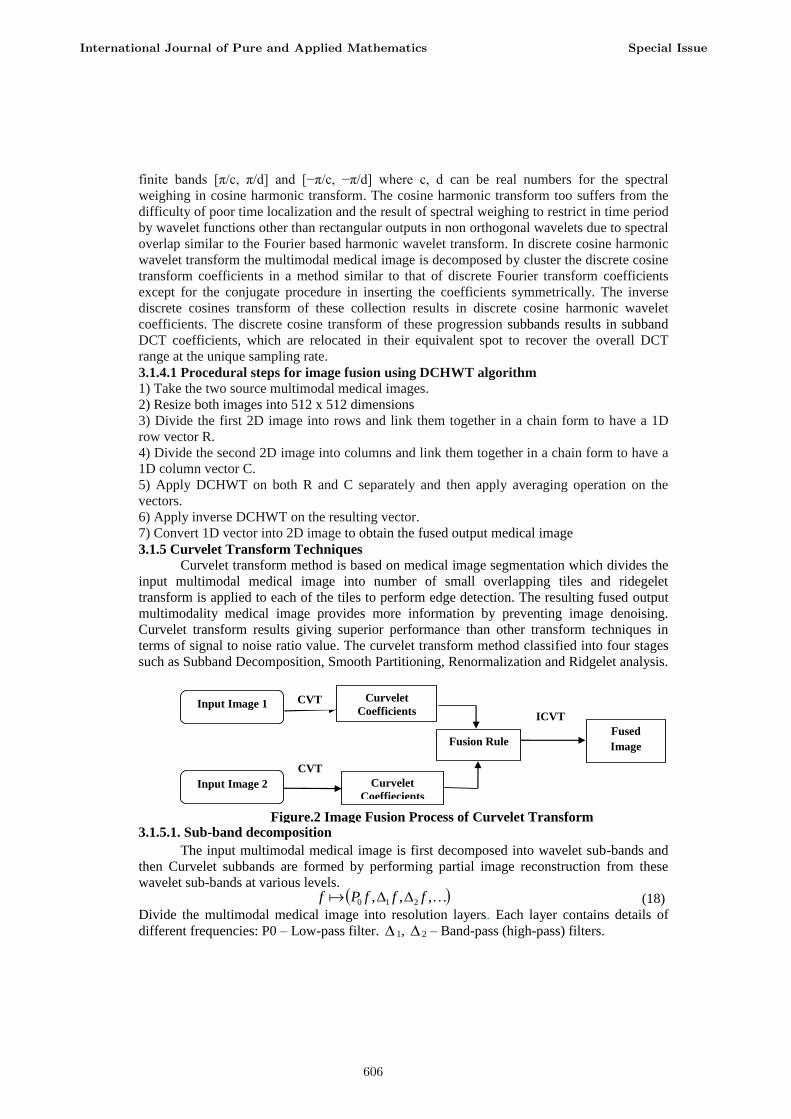
3.1.5 Curvelet Transform Techniques
Curvelet transform method is based on medical image segmentation which divides the
input multimodal medical image into number of small overlapping tiles and ridegelet
transform is applied to each of the tiles to perform edge detection. The resulting fused output
multimodality medical image provides more information by preventing image denoising.
Curvelet transform results giving superior performance than other transform techniques in
terms of signal to noise ratio value. The curvelet transform method classified into four stages
such as Subband Decomposition, Smooth Partitioning, Renormalization and Ridgelet analysis.
3.1.5.1. Sub-band decomposition
The input multimodal medical image is first decomposed into wavelet sub-bands and
then Curvelet subbands are formed by performing partial image reconstruction from these
wavelet sub-bands at various levels.
(18)
Divide the multimodal medical image into resolution layers. Each layer contains details of
different frequencies: P0 – Low-pass filter. 1, 2 – Band-pass (high-pass) filters.
Figure.2 Image Fusion Process of Curvelet Transform
Input Image 1 Curvelet
Coefficients
Curvelet
Coeffiecients
Fusion Rule Fused
Image
Input Image 2
CVT
ICVT
CVT
,,, 210 fffPf
International Journal of Pure and Applied Mathematics Special Issue
606
The original image can be reconstructed from the sub-bands:
(19)
Energy preservation
(20)
3.1.5.2. Smooth partitioning
The decomposed multimodal medical image each subband is smoothly windowed in to
„squares‟ of an appropriate scale.
(21)
3.1.5.3. Renormalization
The outcome of the smoothening multimodal medical image of each resulting square is
renormalized to unit scale.
(22)
3.1.5.4. Ridgelet analysis In the earlier two levels we transform the multimodal medical image curved lines into
small straight lines. That improves the ability of the Curvelet transform to handle the medical
image curved edges.
Ridgelet Transform: The Ridgelet Transform deals efficiently with line singularities
in 2D. The basic idea is to map a line singularity in the two-dimensional (2D) domain into a
point by means of the Radon transform. Then, a one-dimensional wavelet is performed to deal
with the point singularity in the Radon domain
(23)
3.1.5.5 Procedural steps for image fusion using Curvelet Transform algorithm
1) Take the two input multimodal medical images.
2) Resize both images into 512 x 512 dimensions.
3) Each input multimodal medical image is then analyzed and a set of Curvelet coefficients
are generated
4) Maximum Selection, Minimum Selection and Simple Average fusion rules are applied.
5) Finally apply the Inverse Curvelet transform (ICVT) to reconstruct the multimodal source
image.
6) Perform the image reconstruction and get the final fused multimodal medical image.
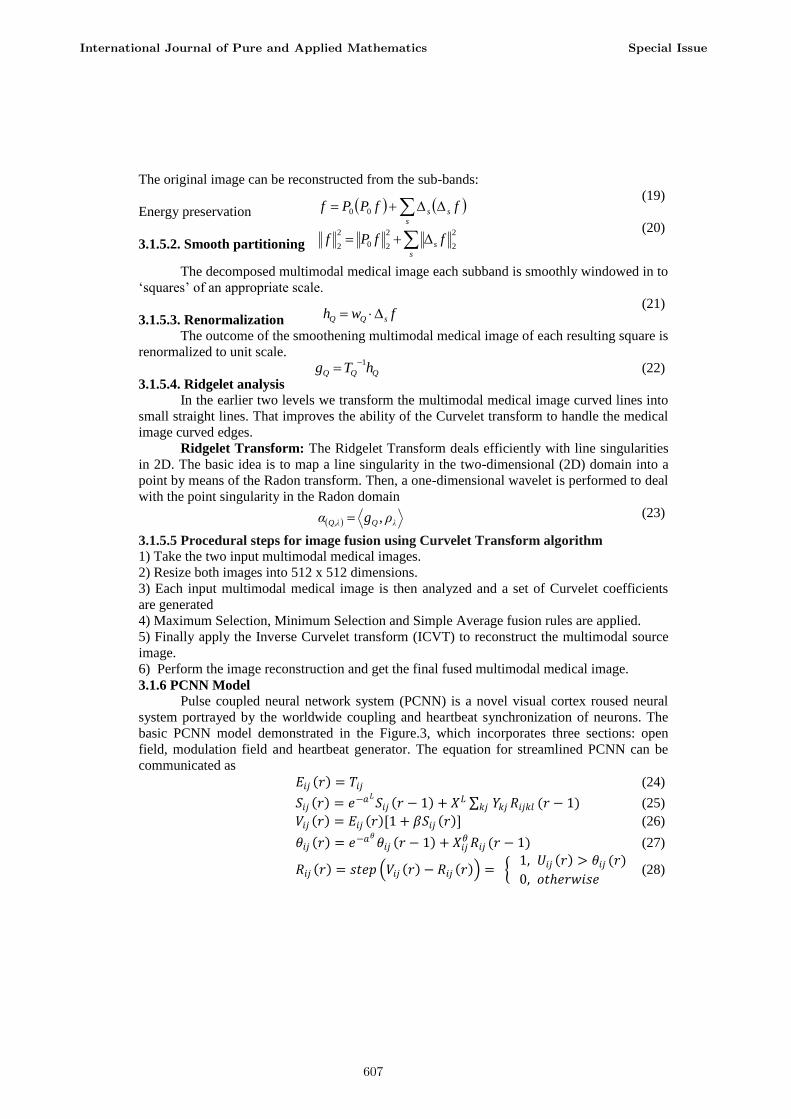
3.1.6 PCNN Model Pulse coupled neural network system (PCNN) is a novel visual cortex roused neural
system portrayed by the worldwide coupling and heartbeat synchronization of neurons. The
basic PCNN model demonstrated in the Figure.3, which incorporates three sections: open
field, modulation field and heartbeat generator. The equation for streamlined PCNN can be
communicated as
𝐸𝑖𝑗 𝑟 = 𝑇𝑖𝑗 (24)
𝑆𝑖𝑗 𝑟 = 𝑒−𝑎𝐿𝑆𝑖𝑗 𝑟 − 1 + 𝑋𝐿 𝑌𝑘𝑗𝑅𝑖𝑗𝑘𝑙 (𝑟 − 1)𝑘𝑗 (25)
𝑉𝑖𝑗 𝑟 = 𝐸𝑖𝑗 𝑟 [1 + 𝛽𝑆𝑖𝑗 𝑟 ] (26)
𝜃𝑖𝑗 𝑟 = 𝑒−𝑎𝜃𝜃𝑖𝑗 𝑟 − 1 + 𝑋𝑖𝑗
𝜃𝑅𝑖𝑗 (𝑟 − 1) (27)
𝑅𝑖𝑗 𝑟 = 𝑠𝑡𝑒𝑝 𝑉𝑖𝑗 𝑟 − 𝑅𝑖𝑗 𝑟 = 1, 𝑈𝑖𝑗 𝑟 > 𝜃𝑖𝑗 (𝑟)
0, 𝑜𝑡𝑒𝑟𝑤𝑖𝑠𝑒 (28)
λQQ,λ ρgα ,
s
ss ffPPf 00
s
s ffPf2
2
2
20
2
2
fwh sQQ
QQQ hTg1
International Journal of Pure and Applied Mathematics Special Issue
607

Figure 3 Simplified PCNN model
In Fig. 2, the open field contains two input compartment: the feeding Eij and the connecting Sij
(see (17) and (18)). Each neuron receives the output Rij of neighborhood neurons and the
peripheral stimuli Tij, where Tij represent the gray value of the input image. In the modulation
field, the domestic state signal Vij is created by connecting input signal Sij and the feeding
input Eij via connecting coefficient β. Then, if Vij is superior to the threshold value θij of the
neuron, the heartbeat generator will produce a pulse, namely, it is called a fire. After the
neuron outputs a pulse, the threshold of the neuron will get higher rapidly by feedback. If θij is
superior to Vij, the heartbeat generator stops generating the pulse, the threshold starts to
reduce until θij is less than Vij again. Yid denotes the connecting weight, the decay coefficients
cS, c
θ and potentials coefficients X
S, X
θ undertaking the periodicity of the pulse output of the
PCNN model.
3.2 Hybrid Multimodal Medical Image Fusion Techniques
Traditional medical image fusion techniques lack the ability to get high-quality
images. So, there is a bad need to use hybrid fusion techniques to achieve this objective. The
basic idea of the hybrid technique is to combine the guided image filter fusion technique with
neural network fusion techniques to improve the performance and increase fused image
quality. Another possibility is applying two stage transformations on input images before
fusion process. These transformations provide better characterization of input images, better
handling of curved shapes and higher quality for fused details. The overall advantages of the
hybrid techniques are improving the visual quality of the images, and decreasing image
artifacts and noise. Each image size is 512*512 dimensions. Figure 4 illustrates the schematic
diagram of the proposed hybrid multimodal medical image fusion techniques.
Figure.4 Image Fusion Process of PCNN
Source Image 1 Pre-processing
Pre-processing
PCNN
PCNN
Fusion Rule Fused
Image
Source Image 2
∑ ∑
Regulate
threshold
0
1
cS
Open field Modulation field Heartbeat generator
β
+1
Eij Rij
Xθ
cθ
Θij
Vij
Sij
Yid
XS
Rid
Tij
International Journal of Pure and Applied Mathematics Special Issue
608
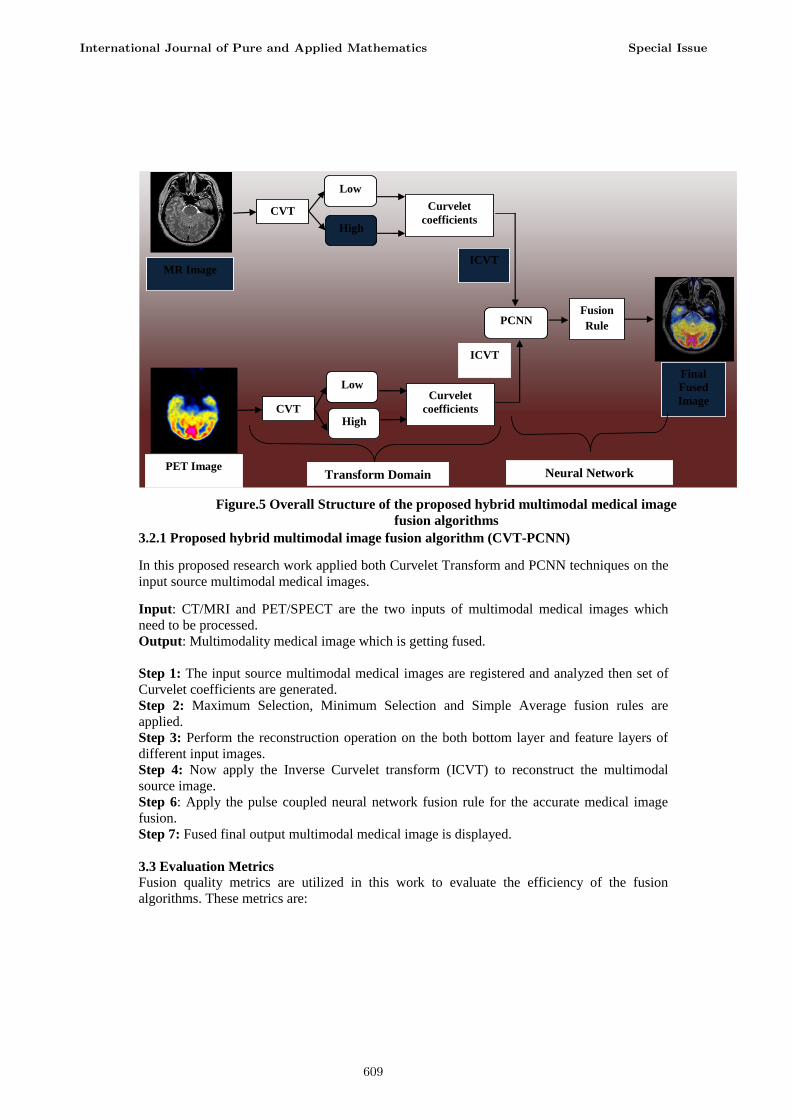
3.2.1 Proposed hybrid multimodal image fusion algorithm (CVT-PCNN)
In this proposed research work applied both Curvelet Transform and PCNN techniques on the
input source multimodal medical images.
Input: CT/MRI and PET/SPECT are the two inputs of multimodal medical images which
need to be processed.
Output: Multimodality medical image which is getting fused.
Step 1: The input source multimodal medical images are registered and analyzed then set of
Curvelet coefficients are generated.
Step 2: Maximum Selection, Minimum Selection and Simple Average fusion rules are
applied.
Step 3: Perform the reconstruction operation on the both bottom layer and feature layers of
different input images.
Step 4: Now apply the Inverse Curvelet transform (ICVT) to reconstruct the multimodal
source image.
Step 6: Apply the pulse coupled neural network fusion rule for the accurate medical image
fusion.
Step 7: Fused final output multimodal medical image is displayed.
3.3 Evaluation Metrics
Fusion quality metrics are utilized in this work to evaluate the efficiency of the fusion
algorithms. These metrics are:
MR Image
Final
Fused
Image
PET Image
ICVT
CVT
PCNN
CVT
High
Low
Low
High
Transform Domain
Curvelet
coefficients
Curvelet
coefficients
ICVT
Fusion
Rule
Neural Network
Figure.5 Overall Structure of the proposed hybrid multimodal medical image
fusion algorithms
International Journal of Pure and Applied Mathematics Special Issue
609

3.3.1 Average Gradient (g)
The average gradient represents the amount of texture variation in the image. It is calculated
as:
𝑔 =1
R−1 S−1 (
∂f
∂x)2+(
∂f
∂x)2
2
R−1 S−1 i=1 (29)
Where, R and S are the image dimensions of images x and y respectively.
3.3.2 Standard Deviation (STD)
It is used to establish how much difference of the data is from the average or mean value. The
input data is said to be clearer if its STD value is bigger. STD is deliberate using the equation:
𝑆𝑇𝐷 = |𝑓 𝑖 ,𝑗 −𝜇 |2S
j=1Ri=1
RS (30)
Where R and S represent the dimensions of the image f(i,j), and the mean value is represented
by µ .
3.3.3 Local Contrast (Clocal)
It is an index for the image quality and purity of view. It is calculated using the equation:
𝐶𝑙𝑜𝑐𝑎𝑙 =|µ𝑡𝑎𝑟𝑔𝑒𝑡 −µ𝑏𝑎𝑐𝑘𝑔𝑟𝑜𝑢𝑛𝑑 |
µ𝑡𝑎𝑟𝑔𝑒𝑡 +µ𝑏𝑎𝑐𝑘𝑔𝑟𝑜𝑢𝑛𝑑 (31)
Where μtarget is the mean gray-level of the target image in the local region of interest and
μbackground is the mean of the background in the same region. The larger value of C indicates
more purity of the image.
3.3.4 Structural Similarity Index Metric (SSIM)
It is a measure of the similarity between two regions wx and wy of two images x and y.
𝑆𝑆𝐼𝑀 𝑥,𝑦 𝑤 = 2𝑤 𝑥 𝑤 𝑦+𝐶1 (2𝜎𝑤𝑥𝑤𝑦 +𝑐2)
𝑤 𝑥2+𝑤 𝑦
2+𝐶1 (𝜎2𝑤𝑥+𝜎2𝑤𝑦+𝑐2) (32)
Where, C1 and C2 are small constants. 𝑤 𝑥 , 𝑤 𝑦 are the mean values of wx and wy. 𝜎2𝑤𝑥 , 𝜎2𝑤𝑦
are the variance of wx and wy. 𝜎𝑤𝑥𝑤𝑦 is the covariance between the two regions
3.3.5 Xydeas and Petrovic Metric (QAB/F
)
This metric is used to measure the transferred edge information amount from source images to
the fused one. A normalized weighted performance form of that metric can be calculated as
following
𝑄𝐴𝐵/𝐹 = (𝑄(𝑚 ,𝑛 )
𝐴𝐹 𝑊(𝑚 ,𝑛 )𝐴𝐹 +𝑄(𝑚 ,𝑛 )
𝐵𝐹𝑁𝑛=1 𝑊(𝑚 ,𝑛 )
𝐵𝐹𝑀𝑚 =1
𝑊(𝑚 ,𝑛 )𝐴𝐹 +𝑁
𝑛=1 𝑊(𝑚 ,𝑛 )𝐵𝐹𝑀
𝑚 =1 (33)
Where, 𝑄(𝑚 ,𝑛)𝐴𝐹 ,𝑄(𝑚 ,𝑛)
𝐵𝐹 is the edge information preservation value and 𝑊(𝑚 ,𝑛)𝐴𝐹 ,𝑊(𝑚 ,𝑛)
𝐵𝐹 are their
weights
3.3.6 Mutual Information (MI) MI is an index that calculates the quantity of dependency between two images (R, S), and it
gives the joint distribution detachment between them using the subsequent equation:
𝐼 𝑟, 𝑠 = 𝑝 𝑟, 𝑠 log(𝑟𝜖𝑅𝑦𝜖𝑅𝑝(𝑟 ,𝑠)
𝑝 𝑟 𝑝(𝑠)) (34)
Where p(r) and p(s) are the marginal probability distribution functions of the both images, and
p(r,s) is the joint probability distribution function.
𝑀𝐼 𝑟, 𝑠,𝑓 =𝐼 𝑟 ,𝑠 +𝐼 𝑟 ,𝑓
𝐻 𝑟 +𝐻 𝑠 (35)
Where, H(r), H(s) are the entropies of images r and s.
3.3.7 Feature Similarity Index Metric (FSIM)
It represents edge similarity between input images and the fused image, and it can be
calculated from the following equation:
International Journal of Pure and Applied Mathematics Special Issue
610

𝐹𝑆𝐼𝑀 = 𝑆𝐿(𝑥∈Ω 𝑥).𝑃𝐶𝑚 (𝑥)
𝑃𝐶𝑚 (𝑥)𝑥∈Ω (36)
Where, Ω is the image spatial domain, SL (x) is the total similarity between the two images,
and PCm(x) is the phase congruency value.
3.3.8 Processing Time It represents the time required for the fusion process in seconds according to the computer
specifications.
4 Experimental Results and Discussions
The implementations are based on five set of source images and the proposed hybrid
technique (CVT-PCNN) is compared with existing techniques i.e. PCA, DWT, DCHWT,
CVT and PCNN. The implementation is executed in MATLAB R2013b on windows 7 laptop
with Intel Core I5 Processor, 4.0 GB RAM and 500 GB Hard Disk. The processed
multimodality therapeutic input images are gathered from harvard medical school and
radiopedia.org medical image online database. The size of the image is 512 × 512 for
execution process.
4.1 Dataset 1
The MRI and PET are the input source images as shown in Figure-6A, B respectively.
Figure-6I is the fused final output image of the proposed technique. The Existing techniques
are PCA, DWT, DCHWT, CVT, Guided Filtering and PCNN outputs as shown in Figure-6C
to H respectively.
4.2 Dataset 2
The MRI and PET are the input source images as shown in Figure-7A, B respectively. Figure
7I is the fused final output image of the proposed technique. The Existing techniques are PCA,
DWT, DCHWT, CVT, Guided Filtering and PCNN outputs as shown in Figure-7C to H
respectively.
4.3 Dataset 3
The MRI and PET are the input source images as shown in Figure-8A, B respectively. Figure
8I is the fused final output image of the proposed technique. The Existing techniques are PCA,
DWT, DCHWT, CVT, Guided Filtering and PCNN outputs as shown in Figure-8C to H
respectively.
4.4 Dataset 4
The MRI and SPECT are the input source images as shown in Figure-9A, B respectively.
Figure 9I is the fused final output image of the proposed technique. The Existing techniques
are PCA, DWT, DCHWT, CVT, Guided Filtering and PCNN outputs as shown in Figure-9C
to H respectively.
4.5 Dataset 5
The MRI and PET are the input source images as shown in Figure-10A, B respectively. Figure
10I is the fused final output image of the proposed technique. The Existing techniques are
PCA, DWT, DCHWT, CVT, Guided Filtering and PCNN outputs as shown in Figure-10C to
H respectively.
International Journal of Pure and Applied Mathematics Special Issue
611

(B) PET (I) Proposed
Method (H) PCNN (D)DWT (E) DCHWT
(G)Guided
Filtering
(A) MRI (C) PCA (F)CVT
(B) SPECT (I) Proposed
Method (H) PCNN (D)DWT (E) DCHWT
(G)Guided
Filtering
(A) MRI (C) PCA (F)CVT
(B) PET (I) Proposed
Method (H) PCNN (D)DWT (E) DCHWT
(G)Guided
Filtering
(A) MRI (C) PCA (F)CVT
(B) PET (I) Proposed
Method (H) PCNN (D)DWT (E) DCHWT
(G)Guided
Filtering
(A) MRI (C) PCA (F)CVT
(B) PET (I) Proposed
Method (H) PCNN (D)DWT (E) DCHWT
(G)Guided
Filtering
(A) MRI (C) PCA (F)CVT
Figure 6: Results of Dataset 1
Figure 7: Results of Dataset 2
Figure 8: Results of Dataset 3
Figure 9: Results of Dataset 4
Figure 10: Results of Dataset 5
International Journal of Pure and Applied Mathematics Special Issue
612
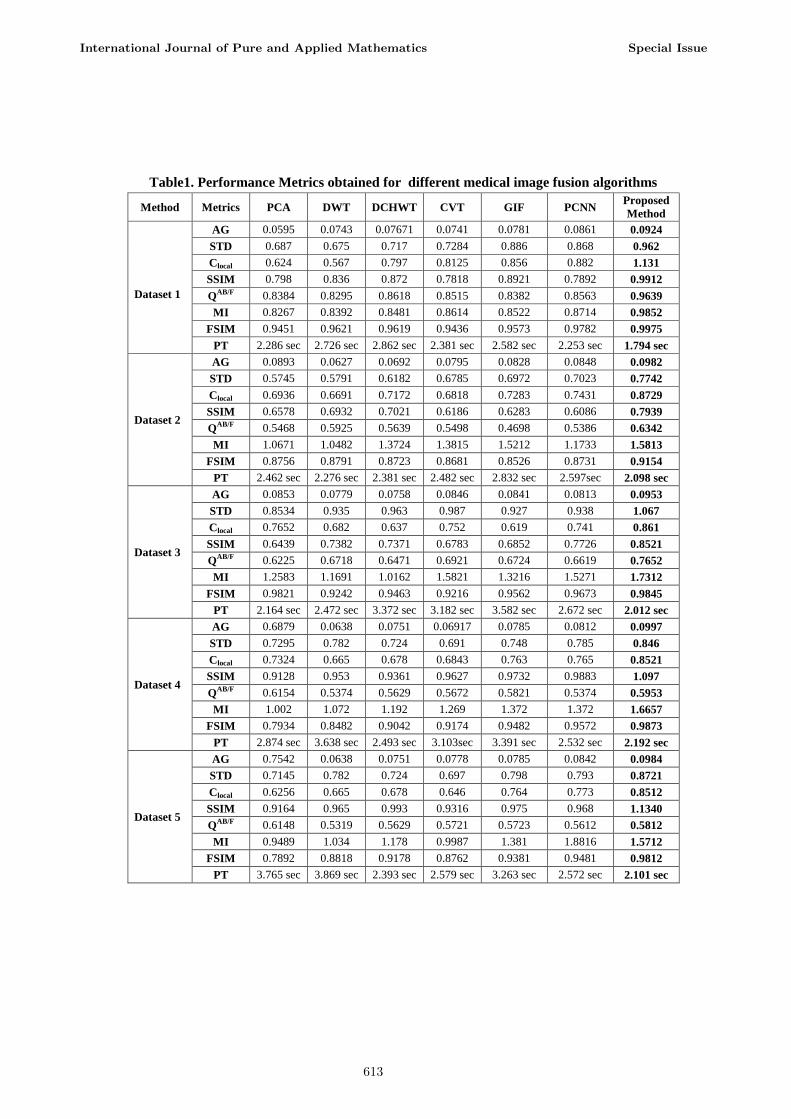
Table1. Performance Metrics obtained for different medical image fusion algorithms
Method Metrics PCA DWT DCHWT CVT GIF PCNN Proposed
Method
(CVT+PC
NN)
Dataset 1
AG 0.0595 0.0743 0.07671 0.0741 0.0781 0.0861 0.0924
STD 0.687 0.675 0.717 0.7284 0.886 0.868 0.962
Clocal 0.624 0.567 0.797 0.8125 0.856 0.882 1.131
SSIM 0.798 0.836 0.872 0.7818 0.8921 0.7892 0.9912
QAB/F
0.8384 0.8295 0.8618 0.8515 0.8382 0.8563 0.9639
MI 0.8267 0.8392 0.8481 0.8614 0.8522 0.8714 0.9852
FSIM 0.9451 0.9621 0.9619 0.9436 0.9573 0.9782 0.9975
PT 2.286 sec 2.726 sec 2.862 sec 2.381 sec 2.582 sec 2.253 sec 1.794 sec
Dataset 2
AG 0.0893 0.0627 0.0692 0.0795 0.0828 0.0848 0.0982
STD 0.5745 0.5791 0.6182 0.6785 0.6972 0.7023 0.7742
Clocal 0.6936 0.6691 0.7172 0.6818 0.7283 0.7431 0.8729
SSIM 0.6578 0.6932 0.7021 0.6186 0.6283 0.6086 0.7939
QAB/F
0.5468 0.5925 0.5639 0.5498 0.4698 0.5386 0.6342
MI 1.0671 1.0482 1.3724 1.3815 1.5212 1.1733 1.5813
FSIM 0.8756 0.8791 0.8723 0.8681 0.8526 0.8731 0.9154
PT 2.462 sec 2.276 sec 2.381 sec 2.482 sec 2.832 sec 2.597sec 2.098 sec
Dataset 3
AG 0.0853 0.0779 0.0758 0.0846 0.0841 0.0813 0.0953
STD 0.8534 0.935 0.963 0.987 0.927 0.938 1.067
Clocal 0.7652 0.682 0.637 0.752 0.619 0.741 0.861
SSIM 0.6439 0.7382 0.7371 0.6783 0.6852 0.7726 0.8521
QAB/F
0.6225 0.6718 0.6471 0.6921 0.6724 0.6619 0.7652
MI 1.2583 1.1691 1.0162 1.5821 1.3216 1.5271 1.7312
FSIM 0.9821 0.9242 0.9463 0.9216 0.9562 0.9673 0.9845
PT 2.164 sec 2.472 sec 3.372 sec 3.182 sec 3.582 sec 2.672 sec 2.012 sec
Dataset 4
AG 0.6879 0.0638 0.0751 0.06917 0.0785 0.0812 0.0997
STD 0.7295 0.782 0.724 0.691 0.748 0.785 0.846
Clocal 0.7324 0.665 0.678 0.6843 0.763 0.765 0.8521
SSIM 0.9128 0.953 0.9361 0.9627 0.9732 0.9883 1.097
QAB/F
0.6154 0.5374 0.5629 0.5672 0.5821 0.5374 0.5953
MI 1.002 1.072 1.192 1.269 1.372 1.372 1.6657
FSIM 0.7934 0.8482 0.9042 0.9174 0.9482 0.9572 0.9873
PT 2.874 sec 3.638 sec 2.493 sec 3.103sec 3.391 sec 2.532 sec 2.192 sec
Dataset 5
AG 0.7542 0.0638 0.0751 0.0778 0.0785 0.0842 0.0984
STD 0.7145 0.782 0.724 0.697 0.798 0.793 0.8721
Clocal 0.6256 0.665 0.678 0.646 0.764 0.773 0.8512
SSIM 0.9164 0.965 0.993 0.9316 0.975 0.968 1.1340
QAB/F
0.6148 0.5319 0.5629 0.5721 0.5723 0.5612 0.5812
MI 0.9489 1.034 1.178 0.9987 1.381 1.8816 1.5712
FSIM 0.7892 0.8818 0.9178 0.8762 0.9381 0.9481 0.9812
PT 3.765 sec 3.869 sec 2.393 sec 2.579 sec 3.263 sec 2.572 sec 2.101 sec
International Journal of Pure and Applied Mathematics Special Issue
613

Table 1 demonstrates the performance metrics experimental results of the traditional
fusion algorithms and hybrid fusion algorithms on the dataset 1, 2, 3, 4 and 5. To evaluate the
performance of the proposed image fusion approach MRI, PET and SPECT image are selected
as the input source multimodal medical images. It can be seen that because of different
imaging standards, the source images with various modalities contain integral data. The
performance metrics are compared with the traditional methods like PCA, Discrete Wavelet
Transform (DWT), Discrete Cosine Harmonic Wavelet Transform (DCHWT), Curvelet
Transform, Guided Image Filtering (GIF) and Pulse Coupled Neural Network (PCNN) to the
hybrid method (Curvelet Transform-PCNN). The evaluations of performance metrics for
hybrid techniques results are better than other existing traditional techniques as shown in
Table 1. By means of objective criteria analysis, the proposed algorithm not only preserves
edge information but also improves the spatial detail information. Therefore, the proposed
method of multimodal medical image fusion is an effective method in both subjective and
objective evaluation criterion. The experimental results are shown in Figure 6, 7, 8, 9 and 10
and Table 1.
(A)
(B)
International Journal of Pure and Applied Mathematics Special Issue
614

(C)
(D)
(E)
Figure.11 Performance Comparative analysis for 5 datasets (A-E)
International Journal of Pure and Applied Mathematics Special Issue
615

The evaluated performance metrics output results are shown in Table 1. The superior
performance value in each column of Table 1 is shown in bold. The graphs for all the values
of Table 1 are shown in the Figure-11 A, B, C, D and E. From the Table 1 and Figure-11, it is
clear the proposed hybrid technique outperform the existing techniques for all the
performance metrics.
Conclusion
This work investigated the performance of both the traditional and hybrid multimodal
medical image fusion techniques using several evaluation metrics. It has been shown that the
best multimodality medical image fusion technique is implemented using proposed hybrid
technique. This hybrid algorithm (Curvelet Transform-Pulse Coupled Neural Network)
introduced a superior performance compared to all the other traditional techniques. It gives
much more image details, higher image quality, the shortest processing time and a better
visual inspection. All these advantages make it a good choice for several applications such as
for assisting medical diagnosis for an accurate treatment.
References
[1] Jiao Du, Weisheng Li, Ke Lu, Bin Xiao “An Overview of Multi-Modal Medical Image
Fusion” Elsevier, Neurocomputing-2015.
[2] Jiao Du,WeishengLi n,BinXiao,QamarNawaz “Union Laplacian pyramid with multiple
features for medical image fusion” Elsevier, Neuro computing 194, 326–339-2016.
[3] xingbin Liu, Wenbo Mei, Huiqian Du “Structure tensor and nonsubsampled sheasrlet
transform based algorithm for CT and MRI image fusion” Elsevier,Neurocomputing-2017.
[4] K.N. Narasimha Murthy and J. Kusuma “Fusion of Medical Image Using STSVD”
Springer, Proceedings of the 5th International Conference on Frontiers in Intelligent
Computing: Theory and Applications, Advances in Intelligent Systems and Computing 516-
2017.
[5] Satishkumar S. Chavana, Abhishek Mahajanb, Sanjay N. Talbarc, Subhash Desaib,
Meenakshi Thakurb, Anil D'cruzb “Nonsubsampled rotated complex wavelet transform
(NSRCxWT) for medical image fusion related to clinical aspects in neurocysticercosis”
Elsevier, Computers in Biology and Medicine 81,64–78-2017.
[6] S. Chavan, A. Pawar and S. Talbar “Multimodality Medical Image Fusion using Rotated
Wavelet Transform” Advances in Intelligent Systems Research. Vol. 137, Pp. 627-635-2017
[7[ Heba M. El-Hoseny, El-Sayed M. El.Rabaie, Wael Abd Elrahman, and Fathi E Abd El-
Samie “Medical Image Fusion Techniques Based on Combined Discrete Transform Domains”
34th National Radio Science Conference (NRSC 2017), IEEE ,978-1-5090-4609-6/17-2017
[8] Udhaya Suriya TS , Rangarajan P, “Brain tumour detection using discrete wavelet
transform based medical image fusion” Biomedical Research-2017
[9] Periyavattam Shanmugam Gomathi, Bhuvanesh Kalaavathi “Multimodal Medical Image
Fusion in Non-Subsampled Contourlet Transform Domain” Scientific Research Publishing,
Circuits and Systems, 7, 1598-1610-2016
[10] C.Karthikeyan and B. Ramadoss “Comparative Analysis of Similarity Measure
Performance for Multimodality Image Fusion using DTCWT and SOFM with Various
Medical Image Fusion Techniques” Indian Journal of Science and Technology, Vol 9(22),
June 2016.
International Journal of Pure and Applied Mathematics Special Issue
616

[11] Xinzheng Xua, Dong Shana, Guanying Wanga, Xiangying “Multimodal medical image
fusion using PCNN optimized by the QPSO algorithm” Elsevier, Applied Soft Computing ,
2016.
[12] Jyoti Agarwal and Sarabjeet Singh Bedi “Implementation of hybrid image fusion
technique for feature enhancement in medical diagnosis” springer, Human-centric Computing
and Information Sciences, 2015.
[13] Jing-jing Zonga, Tian-shuang Qiua, “Medical image fusion based on sparse
representation of classified image patches” Elsevier, Biomedical Signal Processing and
Control 34,195–205, 2017.
[14] Richa Gautam and Shilpa Datar “Application of image fusion techniques on medical
images” International Journal of Current Engineering and Technology, 2017.
[15] Xiaojun Xu, Youren Wang, Shuai Chen “Medical image fusion using discrete fractional
wavelet transform” Elsevier, Biomedical Signal Processing and Control 27, 103–111-2016
[16] Zhaobin Wang, Shuai Wang,Ying Zhu, Yide Ma “Review of image fusion based on
pulse-coupled neural network” Springer, Arch Computer Methods Eng, 2015.
[17] Shutao Li, Xudong Kang S And Jianwen Hu “Image fusion with guided filtering”
Transactions on Image Processing, Vol. 22, No. 7, July 2013.
[18] B. K. Shreyamsha Kumar “Multifocus and multispectral image fusion based on pixel
significance using discrete cosine harmonic wavelet transform” Springer-Verlag London
Limited, 2012.
[19] K. He, J. Sun, and X. Tang, “Guided image filtering,” in Proc. Eur. Conf. Comput. Vis.,
Heraklion, Greece, pp. 1–14, Sep. 2010.
[20] Z. Farbman, R. Fattal, D. Lischinski, and R. Szeliski, “Edge-preserving decompositions
for multi-scale tone and detail manipulation,” ACM Trans. Graph., vol. 27, no. 3, pp. 67-1–
67-10, Aug. 2008.
[21] F. Durand and J. Dorsey, “Fast bilateral filtering for the display of highdynamic-range
images” ACM Trans. Graph., vol. 21, no. 3, pp. 257–266,Jul. 2002.
[22] N. Draper and H. Smith, Applied Regression Analysis. New York, USA:Wiley, 1981.
[23] Narasimhan, S.V., Harish, M.: Discrete cosine harmonic wavelet transform and its
application to subband spectral estimation using modified group delay. In: Pai, B.R. Dr. (eds.)
Proceedings of Conference in Honor of Dr.B.R. Pai.NationalAerospace Laboratories,
Bangalore, 2004.
[24] Narasimhan, S.V, Harish, M., Haripriya, A.R., Basumallick, N.: Discrete cosine
harmonic wavelet transform and its application to signal compression and subband spectral
estimation using modified group delay. J. SIViP 3(1), 85–99, 2009.
[25] Narasimhan, S.V., Haripriya, A.R., Shreyamsha Kumar,B.K.: Improved Wigner–Ville
distribution performance based on DCT/DFT harmonic wavelet transform and modified
magnitude group delay. Signal Process. 88(1), 1–18, 2008.
[26] Narasimhan, S.V., Veena, S.: Signal Processing: Principles and Implementation, Revised
Edition. Narosa Publishing House Pvt. Ltd, India, 2008.
[27] Britanak, V., Yip, P.C., Rao, K.R.: Discrete Cosine and Sine Transforms.1st edn.
Academic Press, Great Britain, 2007.
[28] RAJESH, M. "A SYSTEMATIC REVIEW OF CLOUD SECURITY CHALLENGES IN
HIGHER EDUCATION." The Online Journal of Distance Education and e‐ Learning 5.4
(2017): 1.
[29] Rajesh, M., and J. M. Gnanasekar. "Protected Routing in Wireless Sensor Networks: A
study on Aimed at Circulation." Computer Engineering and Intelligent Systems 6.8: 24-26.
International Journal of Pure and Applied Mathematics Special Issue
617
[30] Rajesh, M., and J. M. Gnanasekar. "Congestion control in heterogeneous WANET using
FRCC." Journal of Chemical and Pharmaceutical Sciences ISSN 974 (2015): 2115.
[31] Rajesh, M., and J. M. Gnanasekar. "Hop-by-hop Channel-Alert Routing to Congestion
Control in Wireless Sensor Networks." Control Theory and Informatics 5.4 (2015): 1-11.
[32] Rajesh, M., and J. M. Gnanasekar. "Multiple-Client Information Administration via
Forceful Database Prototype Design (FDPD)." IJRESTS 1.1 (2015): 1-6.
[33] Rajesh, M. "Control Plan transmit to Congestion Control for AdHoc Networks."
Universal Journal of Management & Information Technology (UJMIT) 1 (2016): 8-11.
[34] Rajesh, M., and J. M. Gnanasekar. "Consistently neighbor detection for MANET."
Communication and Electronics Systems (ICCES), International Conference on. IEEE, 2016.
[35] https://radiopaedia.org.
[36] http://www.med.harvard.edu.
International Journal of Pure and Applied Mathematics Special Issue
618

619

620