a normal incidence scanning reflectometer of high precision
TRANSCRIPT

A Normal Incidence Scanning Reflectometer of High Precision
Ulrich Gerhardt and Gary W. Rubloff
A near-normal incidence (6°) reflectometer system is described that records continuously and directlythe reflectance R(co) as a range of photon energies is scanned. The system has an absolute error of ±2 X10⁻² and a relative error of ±t2 X b5. It incorporates a quartz light pipe rotating at 70 Hz which cap-tures light from the incident and the reflected beam, respectively, during about 20% of its period of rotationin either case. A gating circuit separates the output signal of the photomultiplier into two channels, cor-responding to the incident and the reflected beam, respectively. The signal corresponding to the incidentbeam is kept constant by a servo system which regulates the gain of the photomultiplier. The reflectanceis thus proportional to the signal of the second channel, which is recorded as a function of photon energy.Portions of the reflectance spectrum of Ge are given as examples. No trace of a fine structure in the re-flectance of Ge below 2 eV is found.
1. IntroductionThe complex dielectric function (co) of a solid is
closely connected with its electronic structure. Thus,the accurate eperimental determination of this quantityis of great importance. One method to determine econsists of measuring the reflectance at or close tonormal incidence over a sufficiently large range ofphoton energies and then performing a Kramers-Kroniginversion.I
Reflectance measurements require a separation of theincident and the reflected beam. This requirementgives rise to two major difficulties. First, the noisespectrum of the light source, such as a high pressuredischarge, and of the detector quite frequently containslarge low frequency components. Such a noise spec-trum is particularly harmful when measuring the re-flectance by a point-by-point method, in which onenormalizes the incident beam to 100%, changes theoptical path of the light, and then measures the reflectedbeam. The change of the optical path takes typically10 see or longer, thus making the method susceptible toinstabilities with a time constant of this order of magni-tude.
Second, Io, the output of the detector, is normally astrong function of photon energy, so that intensityvariations of several orders of magnitude often occurwithin the spectral range of interest. It is possible torecord Io () and then R(cw) Io(W) and divide the twoquantities afterwards in order to get the reflectance.However, this method performs poorly if Io (co) depends
The authors are with The James Franck Institute, The Univer-sity of Chicago, Chicago, Illinois 60637.
Received 15 August 1968.
strongly on c, because it requires a very high repro-ducibility of the wavelength setting.
The point-by-point method is capable of very accu-rate results, provided the low frequency components ofthe noise spectrum are small enough.2 The methodconsisting of first recording o (co) and then R(w) Io(W)requires both a good long-term stability and a weakdependence of o on in order to be accurate. An idealmethod should be capable of bypassing both difficulties,i.e., it should alternate between Io and RIO at high fre-quency in order to avoid the low frequency componentsof the noise spectrum and it should be capable of operat-ing under strong variations of lo(U). Furthermore, ahigh signal-to-noise ratio requires that a large fraction ofthe photons available are used in the measurements,i.e., the on-time should be a large fraction of the periodof the system.
The purpose of this paper is to describe a reflectometerwhich approaches the ideal system mentioned above.The paper describes the optical and electronic compo-nents of the system and its characteristics in operation.It also gives some portions of the reflectance spectrumof germanium samples recorded with this system.
11 The Scanning Reflectometer
Design of the SystemOur procedure for continuously recording R () at near
normal (.6) incidence is shown schematically in Fig.1. The beam emerging from the monochromator isfocused on the surface of the sample. A Suprasilfused quartz light pipe 4.8 mm in diameter rotates atabout 70 Hz, sampling incident (Io) and reflected (RIo)beams alternately. Figure 2 shows the top view of thelight pipe, the top part of which is bent slightly off-axisso that it does not interfere with the incident beam
February 1969 / Vol. 8, No. 2 / APPLIED OPTICS 305
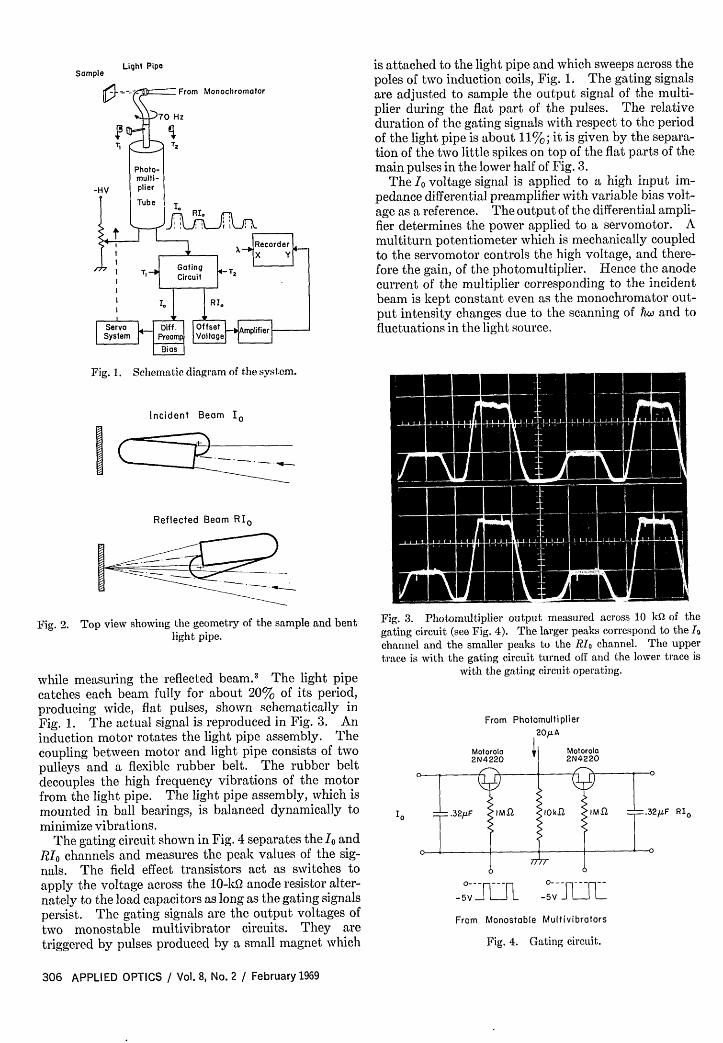
Sample Light Pipe is attached to the light pipe and which sweeps across thepoles of two induction coils, Fig. 1. The gating signalsare adjusted to sample the output signal of the multi-plier during the flat part of the pulses. The relativeduration of the gating signals with respect to the periodof the light pipe is about 11%; it is given by the separa-tion of the two little spikes on top of the flat parts of themain pulses in the lower half of Fig. 3.
The lo voltage signal is applied to a high input im-pedance differential preamplifier with variable bias volt-age as a reference. The output of the differential ampli-fier determines the power applied to a servomotor. Amultiturn potentiometer which is mechanically coupledto the servomotor controls the high voltage, and there-fore the gain, of the photomultiplier. Hence the anodecurrent of the multiplier corresponding to the incidentbeam is kept constant even as the monochromator out-put intensity changes due to the scanning of h and tofluctuations in the light source.
Fig. 1. Schematic diagram of the system.
BIncident Beam Io
Reflected Beam RIO
Fig. 2. Top view showing the geometry of the sample and bentlight pipe.
while measuring the reflected beam.3 The light pipecatches each beam fully for about 20% of its period,producing wide, flat pulses, shown schematically inFig. 1. The actual signal is reproduced in Fig. 3. Aninduction motor rotates the light pipe assembly. Thecoupling between motor and light pipe consists of twopulleys and a flexible rubber belt. The rubber beltdecouples the high frequency vibrations of the motorfrom the light pipe. The light pipe assembly, which ismounted in ball bearings, is balanced dynamically tominimize vibrations.
The gating circuit shown in Fig. 4 separates the 1 andRIO channels and measures the peak values of the sig-nals. The field effect transistors act as switches toapply the voltage across the 10-kQ anode resistor alter-nately to the load capacitors as long as the gating signalspersist. The gating signals are the output voltages oftwo monostable multivibrator circuits. They aretriggered by pulses produced by a small magnet which
Fig. 3. Photomultiplier output measured across 10 kg of thegating circuit (see Fig. 4). The larger peaks correspond to the Iochannel and the smaller peaks to the Rlo channel. The uppertrace is with the gating circuit turned off and the lower trace is
with the gating circuit operating.
From Photomultiplier20/± A
10 RI,
sv 0 l- l L - trp5V 7 7 J 1 -5 7V J~From Monostoble Multivibrators
Fig. 4. Gating circuit.
306 APPLIED OPTICS / Vol. 8, No. 2 / February 1969

0.7 Ge, 3000 K
w, 0.6
I-U
0.5
2 3 4 5
PHOTON ENERGY (eV)
Fig. 5. The reflectance of P type Ge (0.074 02 cm) from 1.6 eV to5.2 eV. Vibration coupling to the monochromator causes awavelength modulation, which produces a bump in the reflect-ance near the strong xenon line at 4.85 eV. The energy resolu-tion given in the bottom part is the half-width of atomic mercury
lines, as recorded with our system.
The RIo voltage signal is amplified by a Keithley 150BMicrovolt-Ammeter and then applied to the Y channelof an X-Y recorder. The Y channel is calibrated forabsolute values of the reflectance by applying the Iosignal to the RIO channel and adjusting the gain to fullscale of the recorder. The X channel of the recordermonitors the wavelength setting of the monochromator.A variable offset voltage is available at the input of theKeithley amplifier to compensate for most of the RIosignal. We are thus able to record fine structure inR (w) by using a much higher gain of the amplifier or therecorder.
Optimization of the SystemThe servo system keeps the lo signal constant to within
i 2 X 10-'. This is achieved by using a large dc gainof the feedback loop. A damping force proportional tothe velocity of the motor reduces the tendency of thesystem to oscillate and reduces the response time. Analuminum flywheel mounted on the shaft of the servo-motor moves in a strong magnetic field to provide thedamping mechanism.
The values of the anode resistance and the load ca-pacitance in Fig. 4 are chosen to fulfill two requirements.First, the RC time constant is set equal to the gatingtime, resulting in a fast response while still averagingover variations of the intensity during the gating time,which are about 5%. Second, the anode resistance iskept small compared with the load resistances of thedifferential preamplifier in the I channel and of theamplifier in the RIO channel. In this way the capacitorsdischarge negligibly when not connected to the anoderesistance; hence the signal levels read are very close tothe peak values and independent of differences in theload resistances of the two channels.
Dynamical balancing of the light pipe assembly isessential to the success of this method, since vibrationscause microphonics of the photomultiplier and wave-length modulation of the monochromator output.
Furthermore, high precision, low friction ball bearingsin the mounting of the light pipe are needed to minimizevibrations generated in the bearings themselves.
The 70-Hz rotation speed of the light pipe is wellabove the frequency response of the servo system, whichis about 10 Hz. Thus, low frequency signals fromintensity fluctuations and wavelength scanning arecompensated by the feedback circuit, whereas higherfrequency signals are attenuated by the filter circuits ofthe system.
The absolute error of the reflectance measured withour system is (AR/R)bsoluto = ±i2 X 10-2. This is thedeviation of the measured reflectance of quartz from thetheoretical reflectance, calculated using the tabulatedrefractive index. This value is the maximum errorwithin the spectral range of the system, i.e., from 1.5 eVto 5.5 eV. The absolute error depends smoothly onphoton energy. Therefore, the ability of the system todetect fine structure in the reflectance superimposed ona smoothly varying background is given by the perfor-mance of the servo system, i.e., the relative error of thesystem is (R/R)oiative = 2 X 10⁻⁵.
111. Experimental Examples: GermaniumThe room temperature reflectance of P type Ge ( =
0.074 Q cm) is given in Figs. 5-7. The surface of thissample is prepared by grinding with increasingly finerabrasives down to mesh 1000 and subsequently etchingin a mixture of nitric, hydrofluoric, and acetic acid(ratio 3:1: 1). The etching process is stopped byrinsing in methanol and quickly removing the thinmethanol layer on the surface by a warm stream of air.
Figure 5 shows the actual recorder trace of the reflec-tance of Ge from 1.6 eV to 5.2 eV. The zero of the re-flectance scale is suppressed. The bump at 4.85 eV iscaused by a wavelength modulation of the monochroma-tor output. The source intensity changes rapidly inthis region because of the strong xenon line at 4.85 eV,superimposed on the continuum of the high pressurexenon lamp used in our measurements. In Fig. 6, thesensitivity has been increased fourfold compared with
O.
0Z0
i1:
a:
0.45
2.0 2.5 3.0PHOTON ENERGY ( eV)
Fig. 6. The reflectance of Ge from 1.6 eV to 3.2scale (same sample as Fig. 5).
eV in expanded
February 1969 / Vol. 8, No. 2 / APPLIED OPTICS 307
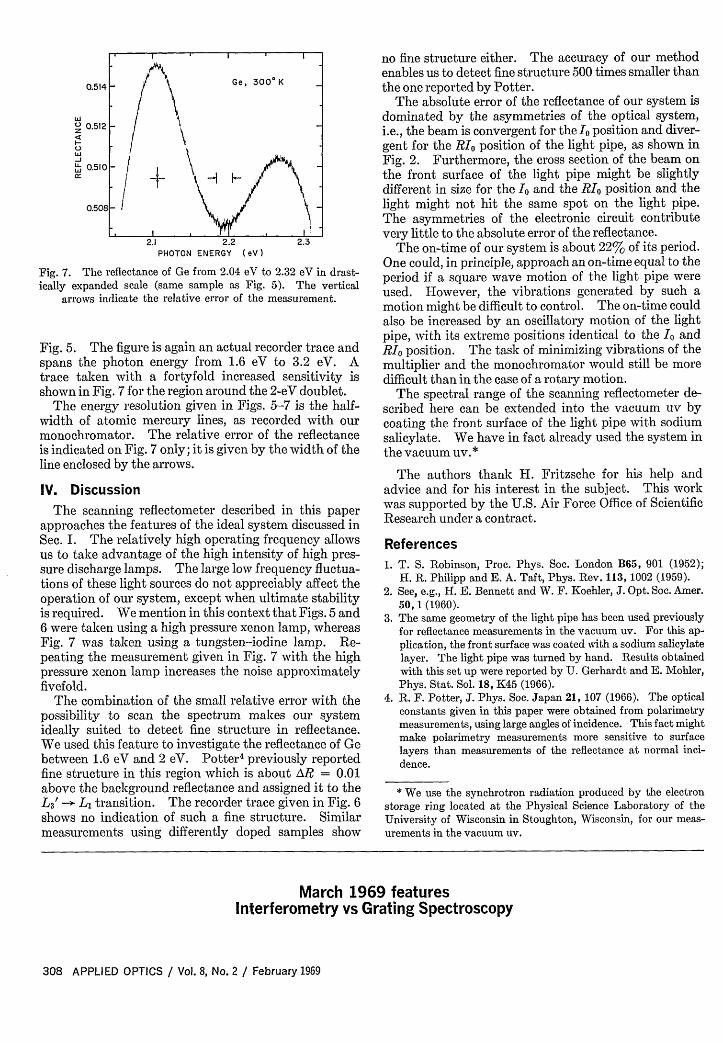
W, 0.512Z
W0.510 ( w
0.508
2.!1 2.2 2.3PHOTON ENERGY (eV)
Fig. 7. The reflectance of Ge from 2.04 eV to 2.32 eV in drast-ically expanded scale (same sample as Fig. 5). The vertical
arrows indicate the relative error of the measurement.
Fig. 5. The figure is again an actual recorder trace andspans the photon energy from 1.6 eV to 3.2 eV. Atrace taken with a fortyfold increased sensitivity isshown in Fig. 7 for the region around the 2-eV doublet.
The energy resolution given in Figs. 5-7 is the half-width of atomic mercury lines, as recorded with ourmonochromator. The relative error of the reflectanceis indicated on Fig. 7 only; it is given by the width of theline enclosed by the arrows.
IV. DiscussionThe scanning reflectometer described in this paper
approaches the features of the ideal system discussed inSec. I. The relatively high operating frequency allowsus to take advantage of the high intensity of high pres-sure discharge lamps. The large low frequency fluctua-tions of these light sources do not appreciably affect theoperation of our system, except when ultimate stabilityis required. We mention in this context that Figs. 5 and6 were taken using a high pressure xenon lamp, whereasFig. 7 was taken using a tungsten-iodine lamp. Re-peating the measurement given in Fig. 7 with the highpressure xenon lamp increases the noise approximatelyfivefold.
The combination of the small relative error with thepossibility to scan the spectrum makes our systemideally suited to detect fine structure in reflectance.We used this feature to investigate the reflectance of Gebetween 1.6 eV and 2 eV. Potter 4 previously reportedfine structure in this region which is about AiR = 0.01above the background reflectance and assigned it to theL3 ' -> L1 transition. The recorder trace given in Fig. 6shows no indication of such a fine structure. Similarmeasurements using differently doped samples show
no fine structure either. The accuracy of our methodenables us to detect fine structure 500 times smaller thanthe one reported by Potter.
The absolute error of the reflectance of our system isdominated by the asymmetries of the optical system,i.e., the beam is convergent for the Io position and diver-gent for the RIO position of the light pipe, as shown inFig. 2. Furthermore, the cross section of the beam onthe front surface of the light pipe might be slightlydifferent in size for the I and the RIO position and thelight might not hit the same spot on the light pipe.The asymmetries of the electronic circuit contributevery little to the absolute error of the reflectance.
The on-time of our system is about 22% of its period.One could, in principle, approach an on-time equal to theperiod if a square wave motion of the light pipe wereused. However, the vibrations generated by such amotion might be difficult to control. The on-time couldalso be increased by an oscillatory motion of the lightpipe, with its extreme positions identical to the Io andRIo position. The task of minimizing vibrations of themultiplier and the monochromator would still be moredifficult than in the case of a rotary motion.
The spectral range of the scanning reflectometer de-scribed here can be extended into the vacuum uv bycoating the front surface of the light pipe with sodiumsalicylate. We have in fact already used the system inthe vacuum uv.*
The authors thankI H. Fritzsche for his help andadvice and for his interest in the subject. This workwas supported by the U.S. Air Force Office of ScientificResearch under a contract.
References1. T. S. Robinson, Proc. Phys. Soc. London B65, 901 (1952);
H. R. Philipp and E. A. Taft, Phys. Rev. 113, 1002 (1959).2. See, e.g., H. E. Bennett and W. F. Koehler, J. Opt. Soc. Amer.
50, 1 (1960).3. The same geometry of the light pipe has been used previously
for reflectance measurements in the vacuum uv. For this ap-plication, the front surface was coated with a sodium salicylatelayer. The light pipe was turned by hand. Results obtainedwith this set up were reported by U. Gerhardt and E. Mohler,Phys. Stat. Sol. 18, K45 (1966).
4. R. F. Potter, J. Phys. Soc. Japan 21, 107 (1966). The opticalconstants given in this paper were obtained from polarimetrymeasurements, using large angles of incidence. This fact mightmake polarimetry measurements more sensitive to surfacelayers than measurements of the reflectance at normal inci-dence.
* We use the synchrotron radiation produced by the electronstorage ring located at the Physical Science Laboratory of theUniversity of Wisconsin in Stoughton, Wisconsin, for our meas-urements in the vacuum uv.
March 1969 featuresInterferometry vs Grating Spectroscopy
308 APPLIED OPTICS / Vol. 8, No. 2 / February 1969