a new urban mobility concept - greenpeace usa...gehl architects gehl architects vision germany -...
TRANSCRIPT

A NEW URBAN MOBILITY CONCEPT

Gehl Architects Gehl Architects
VISION
GERMANY - CHALLENGES AND TARGETSGreen mobility is an important milestone on the road to reducing greenhouse gas emissions. In Germany, motorized traffic is responsible for some 20 per cent of all carbon dioxide emissions. Green mobility not only makes sense in terms of protecting the environment, but it can also deliver huge social and economic benefits. Action is urgently required.
THE CITY - 6 PRINCIPLESGreen mobility is a key element of any attempt to create sustainable cities - even if only on account of its contribution to a better quality of life. However, it will take collaboration between many different disciplines to build a high-quality mobility network. This publication presents six examples of what has worked in practice and they will, so we hope, inspire Germany's towns and cities to take immediate action.
OVER TO YOU - INSTRUMENTS OF CHANGEGreen mobility leads to a healthier life. It offers you the chance to take simple decisions that have a big effect and benefit you as well as the environment and society at large. The way ahead starts at your doorstep. Therefore, at the end of this publication, you will find tools to help you analyze your daily movements. Why not enter into a dialogue with your city and play your part in reducing Germany's carbon emissions? You can thus help to establish a new culture of green mobility.
Knowledge and action
In these pages you can find how the new, green mobility affects our planet, our towns and cities, and you personally. We also hope it will encourage you to start making a difference. Take a critical look at your daily journeys. What transport options are available? What does your town have in the way of a green mobility network? What can you do to help reduce Germany's carbon footprint?
A new kind of mobility calls for holistic concepts. With this in mind, Greenpeace teamed up with Gehl Urban Quality Consultants and set out to create an overall strategy. The aim was - and is - to enhance mobility and quality of life in those parts of Germany where most of the population lives, namely in urban areas. In the coming years, the concept presented here will guide Greenpeace Germany's strategies in the field of sustainable, urban mobility.
Specifically, the mobility envisaged by Greenpeace consists of four elements:
o Reducing dependency on cars
o Improving sustainable alternative modes (public transport, cycling, walking)
o Using available space in more efficient ways
o Creating highly accessible urban hubs that offer space for homes, workplaces, shops and
the enjoyment of life
Schemes to avoid traffic and to channel it along different routes point the way to a new kind of mobility.
1
2
3
GERMANY
YOUR TOWN
YOU
GERMANY
YOUR TOWN
YOU
PEOPLE TAKE THEIR OWN MOBILITY DECISIONS The key to green mobility is to understand people and how they behave. Because green behaviour is about our personal lifestyle choices. It is about the way we organize our daily lives and how our decisions depend on circumstances. We choose the simple, easy courses of action. Only very few of us are idealists who always, whatever the circumstances, do “the right thing”. Therefore, cities need to be designed so that the “right” decision is the “easiest and most convenient” option.
In the case of mobility, it is above all a question of giving people a choice.
Transport accounts for nearly a fifth of all energy-related greenhouse gas emissions in Germany. Changing how we meet our daily mobility needs thus directly impacts the overall volume of carbon emitted. In no other sphere do our personal decisions have such far-reaching effects as those we take regarding mobility and consumption. But mobility differs from consumption in that many people would consider altering their consumption patterns tantamount to lowering their quality of life. This is not true of mobility: here a change in behaviour can actually enhance the quality of life.
20% Trade & Industry
40% Power gen- eration
20%Households
20% Mobility
13% Cars
7% Others
Where mobility is concerned, carbon emissions and people’s behaviour are crucial
Figure 1
2 3

Gehl Architects Gehl Architects
GREEN MOBILITY UNDERSTANDS ITS USERS About 98 per cent of the people who use public transport in Scandinavian cities start their journey on foot or on a bike. Even in rural districts, 90 per cent walk or cycle part of the way. Basically, this recognizes an obvious fact: once someone has got into their car, they are going to stay in the car. So if we want to encourage people to use public transport we must improve the situation for pedestrians and cyclists and make the choice an easy one.
GREEN MOBILITY MAKES LIFE EASIERCopenhagen is world-famous for its masses of cyclists. When asked why they cycle, few people cite health or the environment - these are welcome, but secondary benefits. About 63 per cent of Copenhagen's cyclists use a bike because it is easy, fast and convenient. When we offer people the chance to do something good without too much effort, we hold the key to changing their behaviour. But we need integrated schemes that have been thought through properly.
63% Exercise
15%
To help the environment
5%70%
cycle even in winter
Walk or cycle to public transport
Take the car to bus
or train stop
98%
2% 10%
90%
Rural districts
Urban districts
Easy, fast and convenient
Financial reasons
Figure 3: Why do people cycle in Copenhagen?
Figure 2
A WIN-WIN SITUATION
Green mobility
Inclusive and attractive
Environment friendly
Affordable and efficient
Safe
and
invi
gora
ting
Healthy
Quality of life
17%
4 5

Gehl Architects Gehl Architects
Mobility must go green
Even if the amount of CO2 in the air from car exhausts gradually lessens, these emissions are still far higher than those caused by walking, cycling and travelling by public transport. And every decision to take the car makes it more difficult for public transport companies to attain the number of users needed to support an efficient network. This is especially true in more rural areas, but the effects are significant in every part of the country. Above all, children and senior citizens are often obliged to get from A to B without using a car.
If we want a greener lifestyle, mobility is a good starting point for rapid results. A simple example will illustrate what is meant here: a typical office building located close to good public transport services saves five times as much carbon per employee as a zero-emissions house that can only be reached by car. Of course that does not alter the fact that we need better mobility as well as sustainable systems for buildings.
Target
Reduce CO2 emissions by using integrated public transport services.
Challenge | Climate change
CO2 e
mis
sion
s in
kg
per
pers
on a
nd k
ilom
etre
0.00
0.04
0.200.2
0.15
0.10
0.05
0.00
CO2
CO2
kg of CO2 per workplace and day0.38 1.86
Figure 4 Figure 5: Savings by switching from a standard to a zero-emissions office building compared with savings obtainable by ensuring good public transport services to a standard office building
6 7
Gehl Architects Gehl Architects
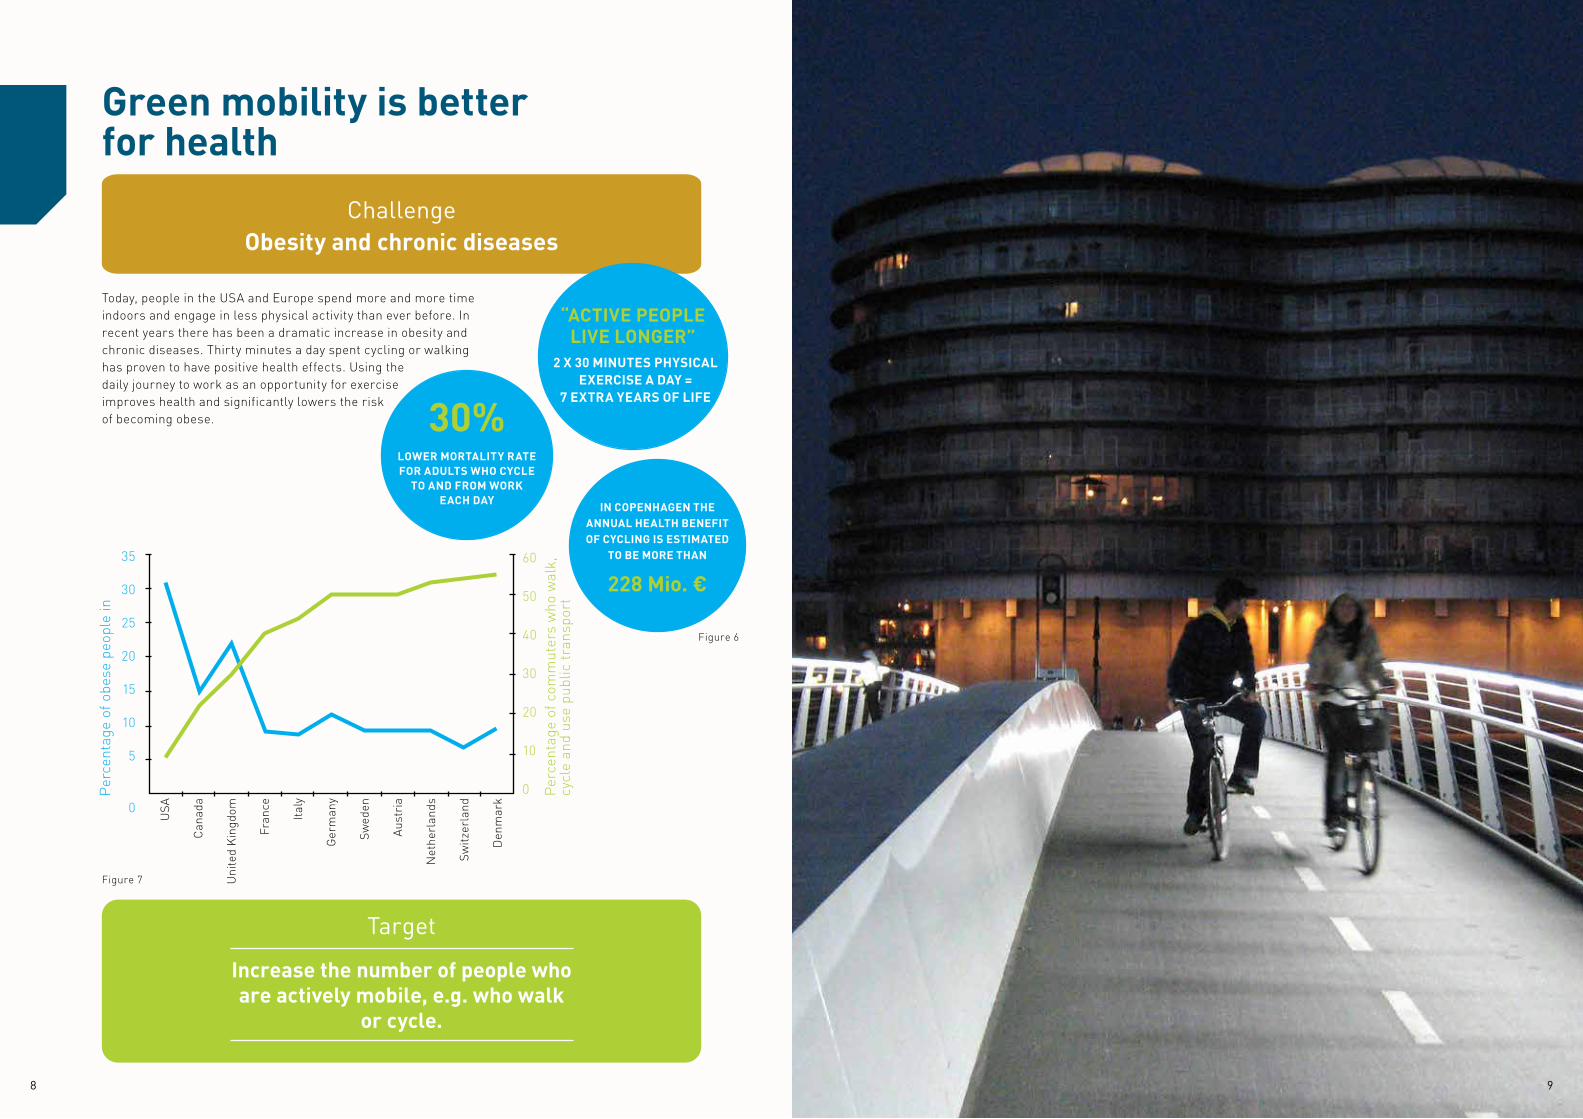
Today, people in the USA and Europe spend more and more time indoors and engage in less physical activity than ever before. In recent years there has been a dramatic increase in obesity and chronic diseases. Thirty minutes a day spent cycling or walking has proven to have positive health effects. Using the daily journey to work as an opportunity for exercise improves health and significantly lowers the risk of becoming obese.
Green mobility is better for health
35
30
25
20
15
10
5
0
60
50
40
30
20
10
0 Per
cent
age
of c
omm
uter
s w
ho w
alk,
cy
cle
and
use
publ
ic tr
ansp
ort
Per
cent
age
of o
bese
peo
ple
in
USA
Can
ada
Uni
ted
Kin
gdom
Fran
ce
Ital
y
Ger
man
y
Swed
en
Aus
tria
Net
herl
ands
Switz
erla
nd
Den
mar
k
228 Mio. €
Target
Increase the number of people who are actively mobile, e.g. who walk
or cycle.
ChallengeObesity and chronic diseases
Figure 6
Figure 7
2 X 30 MINUTES PHYSICAL EXERCISE A DAY =
7 EXTRA YEARS OF LIFE
“ACTIVE PEOPLE LIVE LONGER”
30%LOWER MORTALITY RATE FOR ADULTS WHO CYCLE
TO AND FROM WORK EACH DAY IN COPENHAGEN THE
ANNUAL HEALTH BENEFIT OF CYCLING IS ESTIMATED
TO BE MORE THAN
8 9

Gehl Architects Gehl Architects
Green mobility is affordable and efficient
+0.16 €
-0.09 €
1.5
1.2
0.9
0.6
0.3
0.0
-0.3
-0.6
-0.9
1
,505
,914
€
2,2
59,0
64 €
7
,531
,188
€
7
,531
,188
€
753
,177
€
15,0
63,5
57 €
total external costs saved
over33 million €
Air pollution
Climate change
Noise
Accidents
Infrastructure
Traffic congestion
Every kilometre travelled by car costs Copenhagen money. Every kilometre travelled by bike saves the city money. Not only does that have something to do with the fact that it costs less to build and maintain the infrastructure for pedestrians and cyclists; savings thanks to fewer traffic hold-ups, illnesses and accidents, and less environmental pollution are also included in the calculation. And of course local shops and businesses reap the economic benefits of an easily accessible, mobile city.
Target
Green mobility must be affordable and stand out as a model of the sensible and efficient use deployment of local government funds.
Challenge | Keeping sight of the big picture
Figure 8: Estimated external costs saved by switching from car to bike (data from the City of Copenhagen for the period from 1995 to 2010)
Figure 9: Social savings / costs per kilometre, taking into account trans-port costs, safety, practicality, brand-ing, tourism, journey times and health
10 11
Gehl Architects Gehl Architects
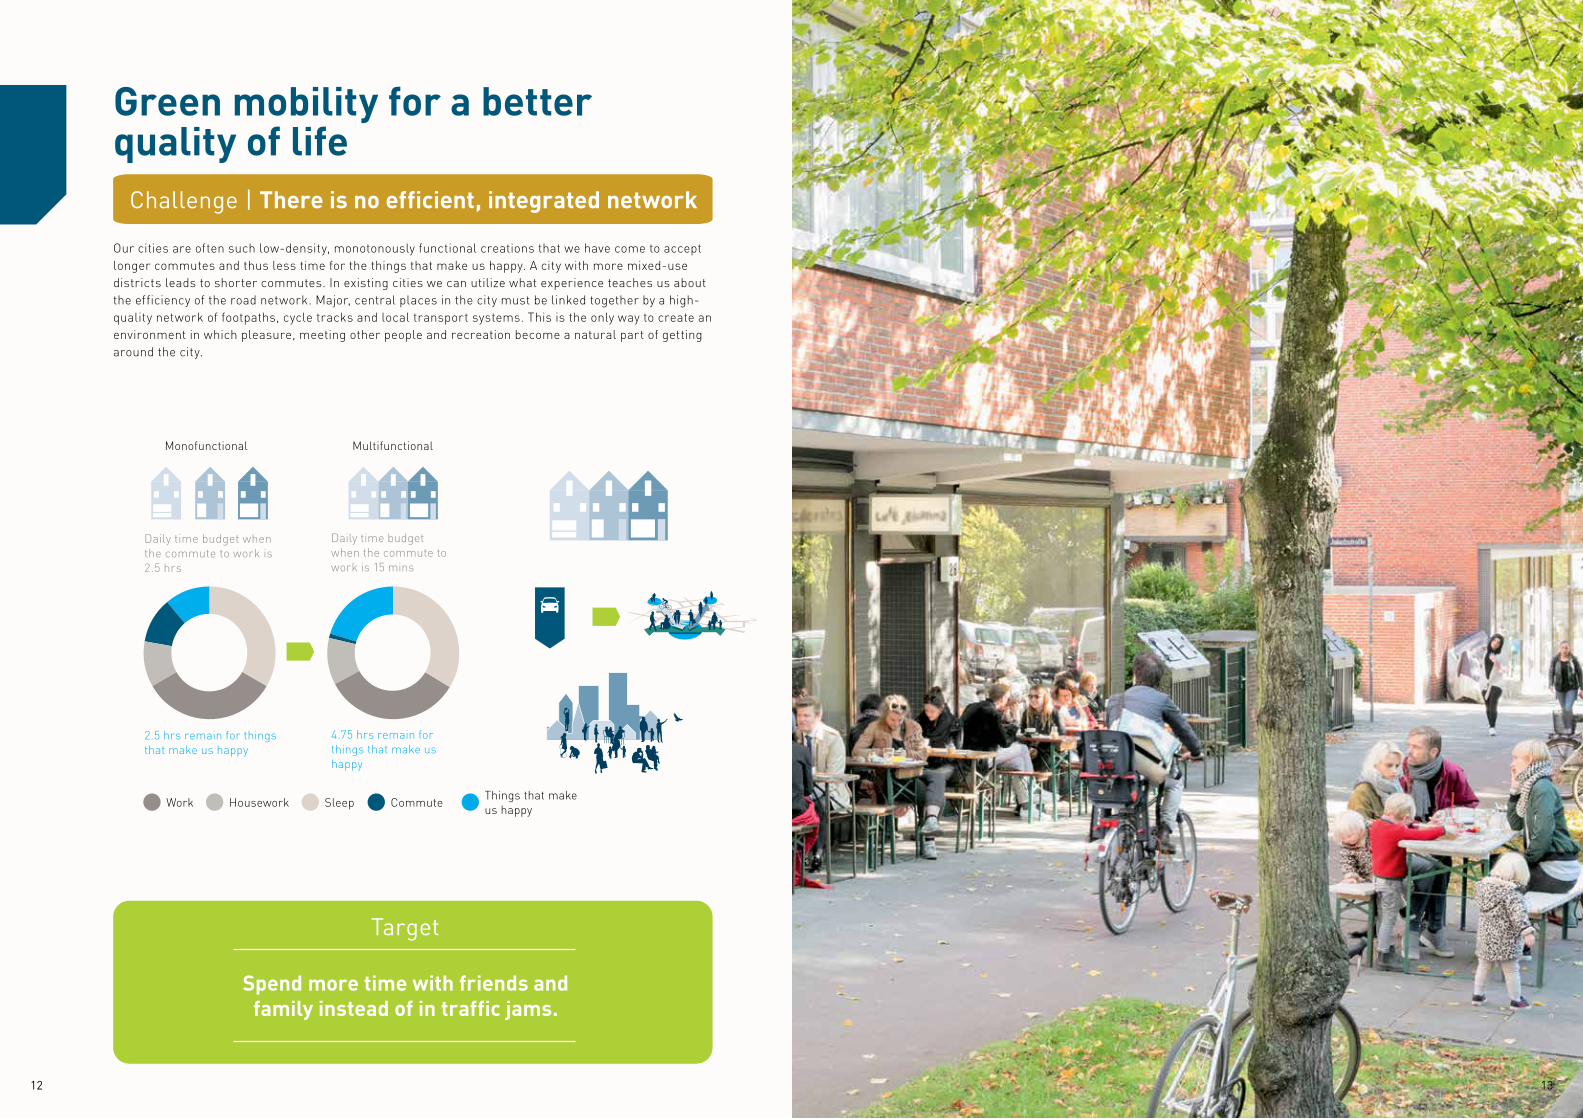
Green mobility for a better quality of life
Daily time budget when the commute to work is 2.5 hrs
2.5 hrs remain for things that make us happy
SleepHouseworkThings that make us happy
Work Commute
Monofunctional
Daily time budget when the commute to work is 15 mins
4.75 hrs remain for things that make us happy
Multifunctional
Our cities are often such low-density, monotonously functional creations that we have come to accept longer commutes and thus less time for the things that make us happy. A city with more mixed-use districts leads to shorter commutes. In existing cities we can utilize what experience teaches us about the efficiency of the road network. Major, central places in the city must be linked together by a high-quality network of footpaths, cycle tracks and local transport systems. This is the only way to create an environment in which pleasure, meeting other people and recreation become a natural part of getting around the city.
Target
Spend more time with friends and family instead of in traffic jams.
Challenge | There is no efficient, integrated network
12 13

Gehl Architects Gehl Architects
Green mobility stands for a safe yet vibrant city
1900 1950 2000
Figure 11: Average living space per person
We have two options for the future. In many cities such as Copenhagen, people who live near the centre are choosing to stay there.
10 m2 30 m2 60 m2
Predicted living space requirement per person in 2040: 70 to 80 square metres.
2.9 24.5
To develop safe, vibrant neighbourhoods is a challenging task. As the city continues to eat into large parts of its surrounding areas, people risk becoming physically and mentally isolated. Alternative modes of transport and options for actively bridging the distance from A to B become increasingly unimportant. An added problem is that people now live more private and secluded lives. This makes it more challenging to create an environment that fosters social interaction. An active city is also a safer city, because on busy streets we can keep an eye on what is happening to our fellow beings.
Target
Build in more compact architectural styles to facilitate green mobility and make the environment safer.
Challenge Urban sprawl, deserted and unsafe city centres
14 15

Gehl Architects Gehl Architects
Green mobility makes the city attractive – for everyone
1900 1950 20001971Jan Gehl, Life between Buildings
1950 to present day:The invasion of cars
1960 to present day:Public urban spaces Pedestrian zones Areas with low traffic
1961Jane Jacobs,
The Death and Life of Great American Cities
Active
Passive
Figure 12: The diagram illustrates the shifting relationship between essential and elective activities over the past 100 years. Note the growth of car ownership in the 1950s and the current trend towards creating open spaces for public life.
Essential activities
must be undertaken regardless of
whether they are attractive or not
Elective activitieshappen only if they offer the
desired quality
Quality of life has become the new benchmark in the global competition to attract businesses and workers. Livable cities are those that pulsate with life and open up possibilities. An attractive city offers us the freedom to choose from a generous selection of different activities in public space. To create an inviting urban environment that people want to use, we need good-quality public spaces that are easily accessed with green transport. This makes it easy for people to participate in public life and to play a part in making the city vibrant and livable.
Target
Create more attractions that appeal to everyone and make the
city more inclusive.
Challenge | Competition from other cities
16 17

Gehl Architects Gehl Architects
6 PRINCIPLES FOR CITIES
PROXIMITY
CONNECTIONS
SAFETY
CONVENIENCE
ENJOYMENT
CULTURE
. MIXED USE
. DIVERSITY
. DENSITY
. CONTINUOUS . INTEGRATED
. BALANCED
. PROTECTED
. SAFE
. HEALTHY
. ACCESSIBLE
. COMPREHENSIBLE
. SMART
. ON A HUMAN SCALE
. IDENTITY
. RECREATION
. EDUCATION AND COMMUNICATION
. POLITICAL SUPPORT
. COMMITMENT
If an assessment is to be made regarding how “green” the mobility within a city is, many different factors need to be considered. The most important step is to evaluate both the special challenges facing a city and its specific potential, and draw the appropriate conclusions. This guide offers important, core principles that can help a city to boost its standing as a platform for green mobility. There is no single answer that is right for every case as local circumstances must determine the approach chosen.
18 19

Gehl Architects Gehl Architects
PROXIMITY
STATION
Opening up small alleyways in Melbourne resulted in greater accessibility and proximity and created a finely meshed network of streets. At the same time, urban space was freed up for a wider range of uses such as small busi-nesses and other facilities.
Recent surveys of Melbourne show that the population could be doubled within the existing city limits simply if the city were to infill only around the existing public transport infrastructure and nowhere else.
MIXED USE• A mix of functions within one
area: homes, commerce and workplaces
• Group the places serving daily needs in close proximity
• Bring together functions that can mutually support each other
• A mix of leisure facilities and services within walking or cycling distance
The resident population in downtown Melbourne increased several times over when apartment blocks were added to the existing built environment, thereby creating a mixed-use city centre.
DIVERSITY• A large number of homes
of varying sizes and price categories (to buy or rent), as well as workplaces for the self-employed and firms providing jobs, generate a diverse community of users
• The surroundings should be attractive and diversified
• A range of different possibilities and options for using public space attracts a variety of users
POPULATION DENSITY• Greater density and finely meshed
networks create greater proximity between the various functions of the city
• In this case, density must be high enough to support local transport and open up opportunities for new interconnecting nodes between public transport routes
• New projects should be planned close to existing transport networks
• Appropriate infill measures create vibrant neighbourhoods where daily needs can be met within walking or biking distance
• Instead of allowing more urban sprawl, the gaps in existing areas should be closed
Walkable, cycle-friendly urban districts that offer a good environment for public transport will not emerge unless the places people want to get to are brought closer together. Cities must ensure that train, tram or bus stops, leisure pursuits, homes, workplaces and the amenities people require on a daily basis are as close together as possible. The closer these places are to each other, the less time people need to spend com-muting or travelling further afield.
With the growing diversity of individual life-styles and obvious demographic changes, society now demands increasing degrees of flexibility and choice. Neighbourhoods must
be designed to accommodate a mix of various functions and services for all age groups.
Cas
eBEST PRACTICE — Melbourne, Australia
Diverse functions
Active use of buildings’ ground
floors
Attractions within walking distance
Many access points
Views into and out of the space
Activities spill over into public space
Interesting and varied environment
Sense of security generated by surroundings built on a
human scale
Proximity to public transport
CPH Melbourne
Odense
NY
Greater London Greater Shanghai/Pudong Moscow
Hammarby SjöstadBRIGHTON
38%
9%17%
36%
CHOICE OF TRANSPORT MODE
Food andbeverages
Retail shops
Street cafés
Figure 13
2,500
2,000
1,500
1,000
500
0 1982 1992 2002 2012
FACTSArea of city centre:
3.02 km2
population: 9,375 (2002)
4.35 millionlive in the greater metropolitan area
830%MORE
RESIDENTS1992 – 2002
300% MORE
BUSINESSES1982 – 2012
Over the past 30 years, Melbourne has been work-
ing to transform its city centre - moving away from
the single-use, car-dominated past to today’s
vibrant, mixed-use inner city. It is a place where
people live, work and enjoy a variety of pursuits,
both during the daytime and at night, on weekdays
and at weekends. Walking has become a key ele-
ment of daily routines and the public space is full of
life every day and at any time.
IN 2002 THERE WERE MORE THEN
33 TIMESAS MANY
APARTMENTS AS IN 1982
20 21

Gehl Architects Gehl Architects
CONNECTIONS
STATION
BALANCED• Prioritize pedestrians, cyclists
and public transport• Create balanced and fully
usable roads with space for traffic of every kind
• Create a "democratic" traffic space where every road user has equal rights
• Make public transport affordable
CONTINUOUS• Infrastructure of continuous
barrier-free paths for pedestrians and cyclists
• Network linking central points and everyday destinations
• Close the gaps in the existing infrastructure
• Keep paths of travel short, minimize detours
• Ensure local public transport is efficient and reliable
• Link local and regional networks
If mobility is to become greener, pedestrians and cyclists must be provided with a continuous network of direct routes that link central points such as transport nodes, schools, workplaces and other locations where daily life goes on.
INTEGRATED• Integrate the networks of
various transport modes• Link the transport networks
with public spaces and destinations
• Design routes that can be travelled end to end, e.g. as a door-to-door trip using several forms of transport, and make it easy to switch between them
• Link public transport nodes with places where people satisfy their daily needs
• Create attractive, safe nodes with good links between all forms of transport
People find it easier to reach their des-tination if bikes can be taken on buses, railways and local commuter trains. In this way people who live further from the city centre can make their commute greener too.
Copenhagen’s roads reflect the way they are actually used - more cycle traffic results in cycle tracks being widened to ensure cyclists’ safety and convenience.
Copenhagen has 426 kilometres (as at 2012) of continuous, designated cycle tracks with very few gaps. Cyclists and pedestrians have right of way at intersections.
BEST PRACTICE — Copenhagen, Denmark
4%
CPH Melbourne
Odense
NY
Greater London Greater Shanghai/Pudong Moscow
Hammarby SjöstadBRIGHTON
24%
41%31%
CHOICE OF TRANSPORT MODE
25,000
20,000
15,000
10,000
5,000
01970 1975 1980 1985 1990 1995 2000 2005
41%
22%
7.4% 7%6%
Cop
enha
gen
Am
ster
dam
Ber
lin
S
tock
holm
Hel
sink
i
Percentage cycling to work in European capitals
FACTSGreater central city:
30.25 km2
population: 299,000 (2012)
98 inhabitants per hectare
1.2 millionlive in the greater metropolitan area
(www.dst.dk)
REDUCTION IN CO2 EMISSIONS
1995 – 2010
109,586TONNES
Copenhagen has been working for some time on
creating a continuous network for green mobility. A
well-defined web of interlinked cycle tracks and con-
venient, easily accessible pedestrian spaces has been
integrated with local and regional public transport.
This produces a coherent system of green mobility
that prompts people to use their cars less and cre-
ates an attractive, inviting city centre that people are
happy to visit and spend time in.
Cas
e
Proximity to public transport
Good walking routes connect
spaces
Integrated public transport nodes
Efficient public transport
Diversified experiencesShort paths
of travel
CO2 EMISSIONS
POPULATION
22 23

Gehl Architects Gehl Architects
SAFETY
STATION
PROTECTION• Users who feel especially
vulnerable need safe paths of travel
• Priority must be given to pathways for pedestrians and cyclists
• Reducing the speed and volume of traffic helps to allay fears
• A safe environment must be developed for road users of every age and skill level
• Safe intersections and crossings for all users
• Establish a code of good conduct on the roads
• Offer clearly separated and defined areas for various types of mobility
SECURITY• Protect from crime and violence• Functions should overlap in
terms of time and space, so that areas are not deserted at certain times
• Well-lit paths• Clean and tidy paths• Cycle tracks and pedestrian
paths should be where there is activity
• Creating bustling streets generates security and ensures that people keep an eye on each other
• Safe, alternative night-time routes are required
HEALTH• Pollution, particulate matter
and noise should be minimized where pedestrian paths and cycle tracks are sited
• More and better spaces should be created for physical activity
• Air must be kept clean• A healthier lifestyle must be
made more inviting• Public spaces should be altered
to reflect the local climate and, for example, offer shelter from the rain or areas shaded from the sun
New users and people who feel more vulnerable than others are especially attentive to road safety issues. If they feel safe and protected when using green mobility systems, they will make these options part of their daily lives. This in turn increases the likelihood of sustainable mobility becoming more generally accepted.
People who want to live a healthy life include physical exercise and time outdoors in their daily routines.
Pedestrian paths and cycle tracks should not only be well-lit: at night, people also feel safer on routes lined with dwellings that overlook the street.
Bridges for pedestrians and cyclists link different areas of the city and create a network of safe routes.
BEST PRACTICE — Hammarby Sjöstad, Sweden
FACTSArea:
1.3 km2
population: 17,000 (2010)
1,331 inhabitants per hectare
Over the past 15 years the old industrial area of
Hammarby Sjöstad in Stockholm has been trans-
formed into a modern, sustainable district of the city.
Here, above all along the main street, one finds a mix
of owner-occupied and rented apartments, offices
and retail units. The result is a district where there is
always life. Numerous public paths and cycle tracks
offer pedestrians and bike riders a safe environment.
21% use car sharing
79% choose green
mobility
CPH Melbourne
Odense
NY
Greater London Greater Shanghai/Pudong Moscow
Hammarby SjöstadBRIGHTON
21%12%
15%
52%
Hammarby Sjöstad Stockholm Sweden
996
402
1,484
Annual traffic-related emissions per resident (in kg CO2)
Cas
e
CHOICE OF TRANSPORT MODE
Passive surveillance by residents
Reduced air pollution, dust and noise
Good street lighting
Pedestrians are protected
Good street crossings
Well-maintained environment
Active façades
Lively public space
Noise protection
24 25

Gehl Architects Gehl Architects
CONVENIENCESTATION
How easy and convenient the door-to-door trip is tends to count more than the actual distance. Making mobility greener creates fresh challenges for strategic locations and requires them to be linked well with their surrounding areas. A neighbourhood in which workplaces, services and homes are within easy walking or cycling distance has special value, and is readily accessible to all potential users.
City bikes can be reserved by text message in Odense, ensuring that a bike is available when required.
An orientation system for cyclists shows dedicated and preferred cycle routes to a variety of destinations.
In Odense cyclists and pedestrians have easy access to paths with smooth surfaces and few obstacles.
CLEAR• It’s easy to find the way• Roads have a clear hierarchy• So self-explanatory there is no
need for a map• Signs and repeater symbols
point the way• Special features or sightlines• The way can be found even at
night• Unobstructed views aid
orientation• Uniform structures for cyclists
(same cycle tracks, same lighting)
SMART• Improve the experience of
waiting for public transport• Shelters against wind, heat and
cold• Provide crossings at the places
where people want to cross the roads
• Cyclists and buses take priority at traffic lights
• Online reservations for city and commuter bikes
• Cycle racks close to everyday destinations
ACCESSIBLE• Create accessibility for everyone
- including people who have problems walking or use walking aids, the young, the old, and people with special needs, etc.
• Offer alternatives if one road can’t meet all needs
• Plan sufficient space for pedestrians and cyclists
• No barriers, well-surfaced paths and cycle tracks
• Well-signed crossings that aren’t too far apart
• As few grade changes, overpasses or underpasses as possible
BEST PRACTICE — Odense, Denmark
FACTSGreater central city:
15 km2
population: 166,305 (2010)
110 inhabitants per hectare
CPH Melbourne
Odense
NY
Greater London Greater Shanghai/Pudong Moscow
Hammarby SjöstadBRIGHTON
28% 18%
27%26%
Odense's city council has worked hard to create a
convenient, easy-access infrastructure for pedestri-
ans and cyclists. The new mobility scheme concen-
trates on improving the efficiency of people’s daily
travelling and encouraging them to make greater
use of
greener alternatives.
540 km of dedicated cycle tracks within city
limits
20%increase in bike
riding during the four years of the “National Cycling Capital” project
72% use green mobility options
Cas
e
CHOICE OF TRANSPORT MODE
Good smooth surface with no
obstacles
Can see far enough ahead
Accessible to all
Easy to find the way
Easy to cross
Well-lit
26 27

Gehl Architects Gehl Architects
PLEASURESTATION
IDENTITY• Environments with special
characteristics• Tangible heritage/history• Recognize and build on the
context of a place• Appreciate local traditions and
identities• Have a sense of place• Underscore the positive aspects
of existing leisure facilities• Create a sense of belonging
RECREATION• Offer good links to recreation
areas• Provide possibilities on or near
the pavements (sidewalks) for games or physical exercise
• Seating in quiet spots where people can relax and chat
• Places to rest and meet others along the pathways
• Create beautiful views• Plant trees and shrubs on the
streets
HUMAN SCALE• Spaces, buildings and roads
that have been designed with human needs in mind
• Homely streets on a manageable scale
• Dimensions and details that stimulate our senses
• Intimacy that invites us to go and meet people
• Top-quality design and materials
• Lighting and signage that meets people’s needs
• An environment that offers variety and a range of impressions at eye level
Immaterial values are steadily gaining importance in our present-day society. Where we live is an issue that has become part of our identity and self-development. The more we know about the world, the greater our desire to be unique. We seek that special something, a place with which to identify - a place that gives us a strong sense of being at home.
The street invites passers-by to stop and stay for a while - basically, it’s a good environment for social interaction.
Activities in the cultural facilities housed in the surrounding buildings spill out into the street.
The street provides an environment with human dimensions and a stimulating range of activities and details.
BEST PRACTICE — New Road, Brighton, England
FACTSgreater central city:
58 km2
population: 155,919 (2001)
27 inhabitants per hectare
600%MORE TIME SPENT IN THE STREET
175%MORE PEDESTRIANS
25%MORE CYCLISTS
New Road in the centre of Brighton was a little-
noticed side street - a white spot on the map of
networked public spaces. In the course of extensive
alterations New Road was turned into a shared street
and public space where people can spend some
downtime or meet up with others. New Road comple-
ments neighbouring destinations frequented by the
general public and has become one of the busiest
spots in town.
CPH Melbourne
Odense
NY
Greater London Greater Shanghai/Pudong Moscow
Hammarby SjöstadBRIGHTON
51%19%
7%23%
93% less car traffic, average speed
less than 20 km/h
Cas
e
CHOICE OF TRANSPORT MODE
Human-scale buildings of similar height
An eye for detail
Good viewsPlace has
identity
Seating placed in sunny spots
RecreationWell-defined,
protected spaces on a human scale
28 2928 29

Gehl Architects Gehl Architects
CULTURE
EDUCATION AND COMMUNICATION• Education, e.g. cycling classes
at school• Campaigns, e.g. road safety
information for new residents• Information and communication• Events to explore or mould
opinions• Nudging people in the right
direction instead of imposing outright bans
POLITICAL SUPPORT• The strategies, visions and
objectives of sustainable mobility should be an integral part of a town/city’s guiding principles
• Ensure politicians are on board • Lobby for sustainable mobility• Conduct before and after
surveys in order to measure success and promote best practice models
COMMITMENT
• A standing process of dialogue and other ways to involve the public
• Polls of public opinion and mobility habits
• Cooperation between the state and private enterprise
• Cooperation with NGOs and citizens’ action groups
STATION
To establish green mobility in a city takes more than simply working on physical characteristics. It is equally important to promote green mobility through publicity campaigns and educational efforts. To create a culture of sustainability will also involve changing how cities work, striving for a culture of collaboration between the public and private sectors and practising citizen participation; it will test the ability of cities to define clear objectives and build political support. If they want people to change the way they act, city councils must focus on procedures and efficient work processes.
BEST PRACTICE — New York, USA
FACTS
CITYWIDE
Area: 22.8 km2
population: 612,000 (2010)
19 million live in greater metro-
politan area (source: www.nyc.gov)
30 % fewer
fatal accidents citywide
(2000 – 2010)
2.4 % less
traffic volume (2000 – 2009)
6.5 % fewer vehicles
heading into downtown
(2003 – 2012)
58 %greater use
of bicycles throughout
the year (2008 – 2012)
11.3 % increasein trips into
the inner city (2003 – 2012)
Cas
e
CPH Melbourne
Odense
NY
Greater London Greater Shanghai/Pudong Moscow
Hammarby SjöstadBRIGHTON
30 %14 %
1 %
55 %
CHOICE OF TRANSPORT MODE
Source: Sustainable Streets Index, 2012, New York City Dept. of Transport
As part of its “New York City Plaza Program” the city invites local organi-zations to apply for a pilot project slot in their neighbourhood which is then co-funded by the city government.
The pilot project along Broadway was one way to generate political support because it demonstrated the benefits needed in terms of improving safety and boosting the local economy.
New York City temporarily closed some streets (called "summer streets"). Taking part in events and activities was a completely new street experience for a large number of different users.
172 % more retail turn-
over in Pearl Street, Brooklyn (18% for the
borough overall)
74 % of New Yorkers
think Times Square has improved significantly
49 % less commercial space remained empty after the
makeover of Union Square
66 % of New Yorkers are in favour of
bicycle lanes
Within a short space of time New York City has done an
impressive job of altering its infrastructure and ensuring
that people are far more receptive to the idea of sustainable
mobility. Testing pilot projects for a limited time proved
to be a great success. Innovative approaches could be
trialled before spending money on permanent alterations
to the infrastructure. The pilot projects gave people an
opportunity to test the full effects of the potential changes
and to provide feedback based on their experiences. Before
and after surveys on accident statistics, street soccer,
cycling, economic impact and behavioural aspects provided
the proof needed to document the project’s success, which
in turn lent considerable political clout to the advocates of
further changes.
30 31
Gehl Architects Gehl Architects
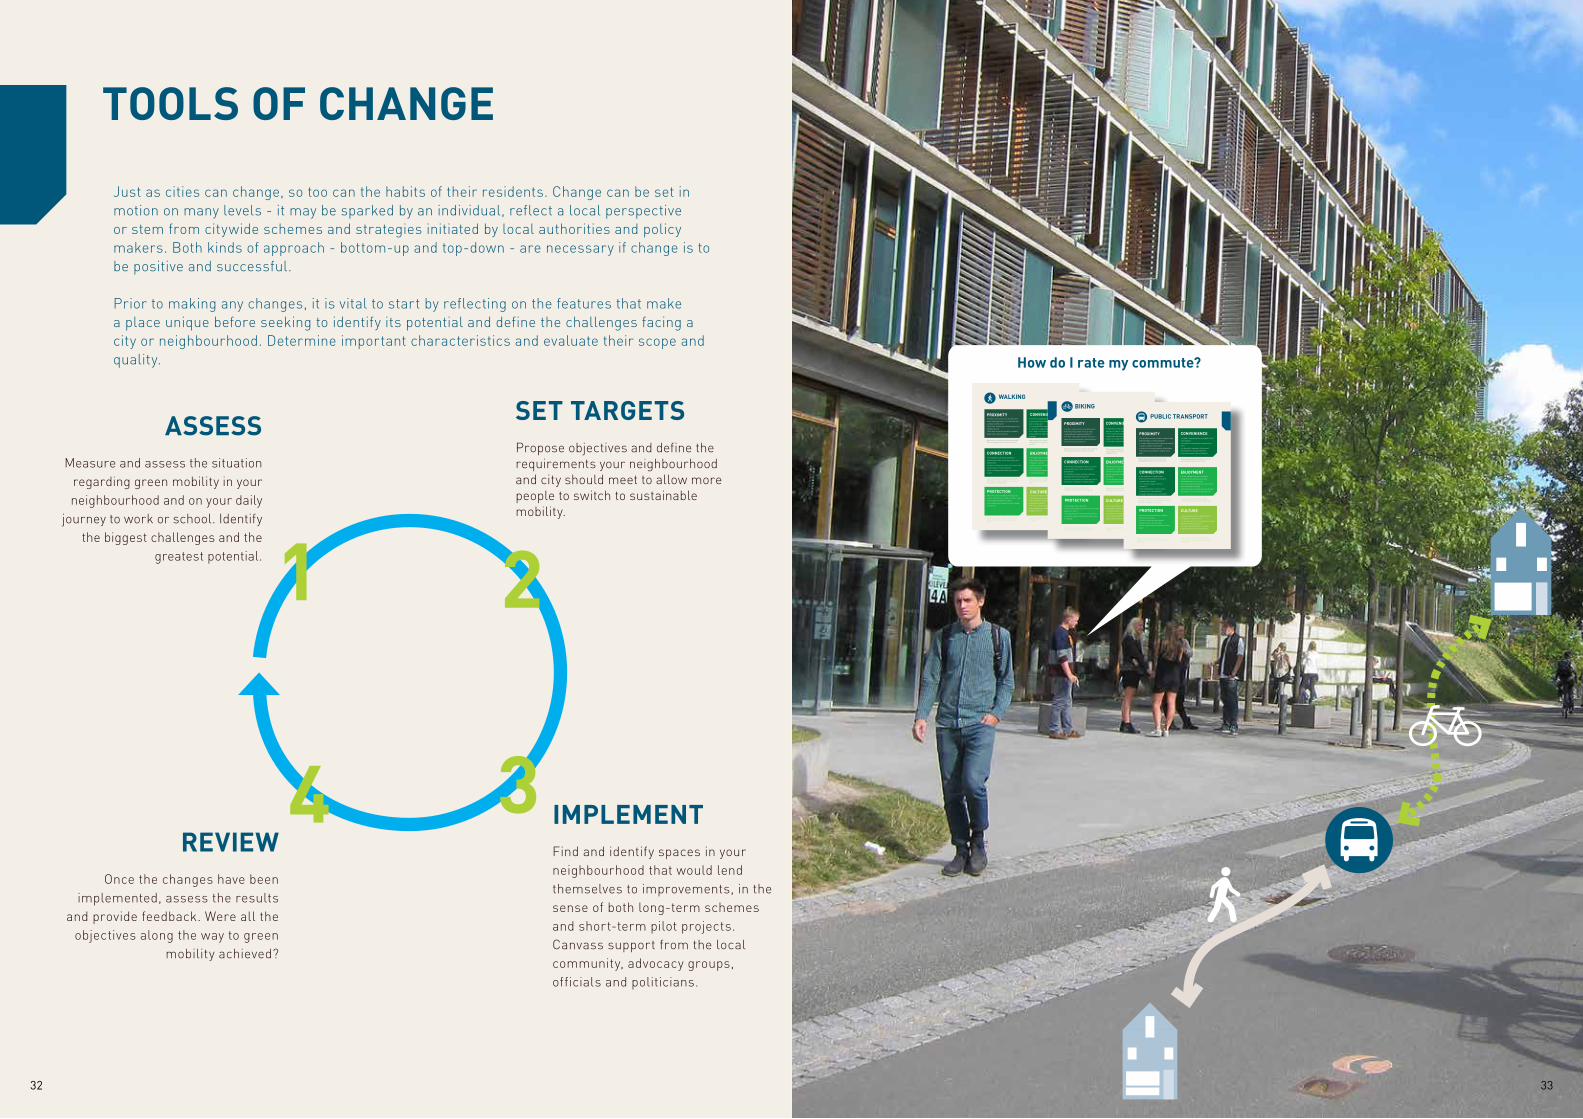
TOOLS OF CHANGE
1
4
2
3
Just as cities can change, so too can the habits of their residents. Change can be set in motion on many levels - it may be sparked by an individual, reflect a local perspective or stem from citywide schemes and strategies initiated by local authorities and policy makers. Both kinds of approach - bottom-up and top-down - are necessary if change is to be positive and successful.
Prior to making any changes, it is vital to start by reflecting on the features that make a place unique before seeking to identify its potential and define the challenges facing a city or neighbourhood. Determine important characteristics and evaluate their scope and quality.
ASSESS
IMPLEMENT
SET TARGETS
REVIEW
Propose objectives and define the requirements your neighbourhood and city should meet to allow more people to switch to sustainable mobility.
Measure and assess the situation regarding green mobility in your neighbourhood and on your daily
journey to work or school. Identify the biggest challenges and the
greatest potential.
Find and identify spaces in your neighbourhood that would lend themselves to improvements, in the sense of both long-term schemes and short-term pilot projects. Canvass support from the local community, advocacy groups, officials and politicians.
Once the changes have been implemented, assess the results
and provide feedback. Were all the objectives along the way to green
mobility achieved?
How do I rate my commute?
Gehl Architects
PROXIMITY
CONNECTION
PROTECTION
CONVENIENCE
ENJOYMENT
CULTURE
WALKING
• Is there a mix of services and functions
within walking distance of residential and
commercial districts?• Are there a diversity of usergroups in the
neighbourhood?• Are there attractive and active facades
along main walking routes?
Map functions, services and attractions within 5 min of walking radie from home and work
• Are walking routes with sidewalks
connected in order to link key origins and
destinations.
• Is there a fine grain network of routes with
no long detours to destinations?
• Are crossings placed where you want to
cross?
Map "missing links": places along your route that havedo not have sidewalks, crossings or long detours for pedestrians
• is there a comfortable walking
environment with enough space for walking
and no obstacles?
• Is the pedestrian environment designed
for diversity of ages and skill levels?
• Is it easy to find your way and can you
choose different types of routes for
walking?
Map how much % of space is for pedestrians and how much for cars in a local street section?
• Are walking enviromnets in human
scale: dimensions and experiences that
stimulates senses?
•Is there a sence of place/local
characteristics?
• Do you have walking access to parks or
recreational areas?
Map areas in your neighbourhood that have more than 5 min to a park or recreational area.
Count pedestrians for 15 min along your local commute.
• Does local schools teach children good
traffic behavour as a pedestrian?
• Do you have easy access to local plans
and political visions?
• Are your consulted as a pedestrian
when changes are planned in your
neighbourhood?
• Are there safe crossings for all users?
• Does it feel sacure to walk, are there “eyes
on the street" and well lit paths?
• Are walking enviromnets in good climate
conditions?
Map places in your neighbourhood where you feel unsafe or unsecure walking at night.
Gehl Architects
BIKING
PROXIMITY
CONNECTION
PROTECTION
CONVENIENCE
ENJOYMENT
CULTURE
Map functions, services and attractions within 5 min of bicycling radie from home and work
• Is there a mix of services and functions
within bicycling distance of your local
residential and commercial district?
• Is there a fine grain network of bicycle
lanes and no long detours to destinations?
• Are there a hierarchy of t?
• Are bicycle lanes placed where you want
to go; along "desier lines" and linked to
destinaions?
• Is the bicycle lanes continous with few
missing links and interruptions?
• Are there enough bicycle parking close to
destinations and public transportation?
Map location of bicycle lanes in your neighbourhood and identify missing links.
• Do you feel safe to bicycle?
• Are cyclists protected from traffic on roads
40km/h or more?
• Are bicycles prioritised at intersections?
• Is the air quality and pollution levels good
for biking?
Map places in your neighbourhood where you feel unsafe or unsecure bicycling.
• Does the cycling infrastructure invite a
diversity of riders: children and seniors?
• Is the cycling infrastructure
comfortable and user friendly; good
surfaces, enough room for cyclists?
• is it easy to find your way?
Photograph and map the quality of the bicycle network and bicycle parking in your neighbourhood.
Map bicycle lanes and links to parks and recreational areas and identiry missing links.
• Are bicycle lanes placed in an enjoyable
invironment; climate, greenery etc?
•Is the bicycle network linked to public
spaces and areas with other activites and
funcitons?
• Is the bicycle network linked to
recreational destinations?
Count bicyclists for 15 min along your local commute.
• Does local schools teach children traffic
rules and bicycling behavour?
• Is there a vision or targets for increased
bicycling in your neighbourhood/city?
• Are there local NGO´s or community
groups advocating bicycling?
Gehl Architects
PUBLIC TRANSPORT
PROXIMITY
CONNECTION
PROTECTION
CONVENIENCE
ENJOYMENT
CULTURE
Map functions and services within 5 min walking/600 m distance from transit hub.
• Do you have access to public transportaion
within walking or biking distance?
• is there daily functions located in proximity
to public transportation hubs?
• is there an increased density of buildings
and functions around the transportation
hub?
• Are networks for pedestrians
and bicycles linked well with public
transportation stops?
• is it easy to change modes of
transport?
• Are transit public transportation
located close to destinations?
•Is public transportation affordable?
Measure how long it takes from home to work by public transportation including the trip to the bus/train compared to using a car.
• Is public transportation accessible for all
user groups?
• Are public transportation stops easy to
find?
• Is the public transport efficent and
predictable? Do you get real time
information about time and delays?
Map and photograph accessibility issues at your local bus stop or transit station.
Evaluate and photograph the waiting experience at your local public transit stop.
• Is the waiting experience at public
transportation stops positive? well
maintaind with place to rest?
• Does the public transportatin system use
clear and visible identity?
•Does the public transportation system get
you easily to recrearional destinations?
Make a mini-survey asking 5 people what would make them use public transportaion more often.
• Have you experienced campaignes for
using public transportation?
• Is there a vision for increased use of public
transportation in your city?
• Are you consulted when new public
transportation routes are planned?
• Are there safe connections to public
transportation stops?
• Do you feel secure using public
transportation in the evening?
• Is there good climate protection at bus
stops?
Map bus stops/train stops in your neighbourhood that feel unsafe or unsecure waiting at.
32 33

Gehl Architects Gehl Architects
PROXIMITY
CONNECTIONS
SAFETY
CONVENIENCE
PLEASURE
CULTURE
RATE YOUR COMMUTE WALKING
This tool can be used to
rate the quality of a space
from the pedestrian’s point
of view. It serves as an
instrument for discussion
and dialogue.
Rating
More extensive surveys can add
to the substance of each quality
criterion so that the rating carries
more weight.
When the rating phase is over
this tool can be used to record
visions and targets so that
steps for improvement can be
defined.
When tackling new projects
the instrument can be
employed as a quality check
list.
To ensure the relevance of your rating, carefully document the walkability qualities and place them in their specific context.
?
?
RATING THE QUALITY OF SPACE IN-DEPTH SURVEYS
VISIONS OF THE FUTURE AND PROGRESS
QUALITY CHECK LIST
As an auxiliary to the tool, any remarks
and specific points should be entered
on a map. Note any observations that
deviate from the overall rating.
Take photos to document your
observations.
For every criterion, distinguish between
“good”, “average” and “poor”.
• Starting from residential or business
districts, are various services and functions
within walking distance?
• Is there a variety of different user groups in
the neighbourhood?
• Are the façades along the central walkways
attractive and active?
List which functions, services and attractions are within a five-minute walk of your home and of your workplace.
• Are pedestrian routes connected in such
a way that key destinations and starting
points can be linked together?
• Is the network of routes so finely meshed
that people can reach their destinations
without making big detours?
• Are there crossing points at the places
where people want to cross?
Note any omissions: where are pavements (sidewalks) and zebra crossings lacking? Where are long detours necessary?
• Is the neighbourhood an inviting place to
walk? Is it reliably barrier-free and is there
enough space?
• Is the neighbourhood designed for
pedestrians of every age and skill level?
• Is it easy to find one’s way around? Are
there various options for walking to places?
Note how much of the street space is reserved for pedestrians and how much for motor vehicles.
• Have the footpaths in your neighbourhood
been made to a human scale? Do the
dimensions and impressions stimulate
your senses?
• Do you get a feeling for the place and its
specific characteristics?
• Can parks or recreation areas be reached
on foot?
List places in your neighbourhood that are more than five minutes away from the nearest park or recreation area.
On your way to work, count the number of pedestrians you see in the space of 15 minutes.
• Do local schools teach children about road
safety for pedestrians?
• Do you have easy access to local planning
policy visions or strategies?
• If changes are planned in your
neighbourhood, does anyone ask you for a
pedestrian’s opinion?
• Are there safe crossings for all users?
• Does one feel safe walking? Does one feel
isolated? Are the paths well-lit?
• When using these paths, how well is one
protected against the elements?
Note the places in your neighbourhood where you feel uncomfortable or unsafe when walking at night.
In this publication we introduce a selection of rating tools for someone’s personal assessment of the different kinds of mobility that he/she uses to travel around the city - on foot, riding a bike or by public transport - and thus explore the quality of a space as experienced by the individual. The rating tool can form the basis for discussion and dialogue, or be used to set targets and discover where improvement is needed.
HOW IS THE TOOL USED?
observation ofthe environment
mapping
survey
observation of behaviour ?
34 35

Gehl Architects Gehl Architects
CYCLING
PROXIMITY
CONNECTIONS
SAFETY
CONVENIENCE
PLEASURE
CULTURE
List which functions, services and attractions are within a five-minute cycle ride of your home and of your workplace.
• Starting from residential or business
districts, are various services and functions
within cycling distance?
• Is the network of cycle paths so finely
meshed that people can reach their
destinations without making big detours?
• Is there a hierarchy of possible routes?
• Do the routes you use daily have cycle paths?
Do they run alongside busy roads and are
they connected with important destinations?
• Do cycle paths join up to form a closed
network with only a few gaps?
• Are there enough cycle racks at important
destinations and public transport stops?
Note the cycle tracks in your neighbourhood. Where are they lacking?
• Do you feel safe when cycling?
• Are cyclists protected from fast-moving
traffic (40 km/h or more)?
• Do cyclists have priority at intersections?
• Is the air quality good for cycling?
Note the places in your neighbourhood where you feel uncomfortable or unsafe when cycling.
• Is the infrastructure inviting for various
groups of cyclists - including children and
senior citizens?
• Is the infrastructure for cyclists convenient
and user-friendly? What is the surface like on
the route? Is there enough space for cyclists?
• Is it easy to find one’s way around?
Photograph and map the quality of the cycle track network and cycle racks in the neighbourhood.
Note the cycle tracks and how they connect to parks and recreation destinations. Where are there gaps?
• Are the cycle tracks in pleasant
surroundings with shelter from the
elements, and with greenery?
• Are cycle paths linked to public spaces that
offer other activities and functions?
• Are cycle paths linked to recreation
destinations?
On your way to work, count the number of cyclists you see for 15 minutes.
• Do local schools teach children about road
safety for cyclists?
• Does your neighbourhood or city have
visions or objectives for the future which
involve encouraging more people to cycle?
• Are there local NGOs or community groups
that actively promote cycling?
PUBLIC TRANSPORT
PROXIMITY
CONNECTIONS
SAFETY
CONVENIENCE
PLEASURE
CULTURE
List the functions and services you can reach within five minutes (or that are less than 600 metres away) from the transport node.
• Is it easy to reach public transport on foot
or by bike?
• Are functions of daily life close to public
transport nodes?
• Is there a higher density of buildings and
amenities around these nodes?
• Are the pedestrian and cycle routes
well linked with public transport
stops?
• Is it easy to switch from one mode of
transport to another?
• Are public transport stops near
important destinations?
• Is local public transport affordable?
Note how long it takes you to travel from home to work (door to door) by public transport compared with using your car.
• Can all user groups access public
transport?
• Are the stops easy to find?
• Is local public transport efficient and
reliable? Is real-time information about
travel times and delays provided?
List and photograph problems with access to your local public transport stops.
Photograph and rate the waiting experience at your local stops.
• Is waiting at a stop a positive experience?
Are the stops in good condition? Is it
possible to have a rest?
• Does the local transport company operate
with a clear and visible brand identity?
• Is it easy to reach recreation areas by
public transport?
Conduct a little survey and ask five people under what circumstances they would use public transport more frequently.
• Have you noticed any advertising for public
transport?
• Does your town have a vision to encourage
greater use of public transport?
• Do people ask your opinion when new local
transport routes are planned?
• Are there safe connections to and from
public transport stops?
• Are you completely relaxed about
using public transport at night?
• Do bus stops protect people well from
the elements?
Note the stops in your neighbourhood where you feel uncomfortable or unsafe.
36 37
Gehl Architects Gehl Architects
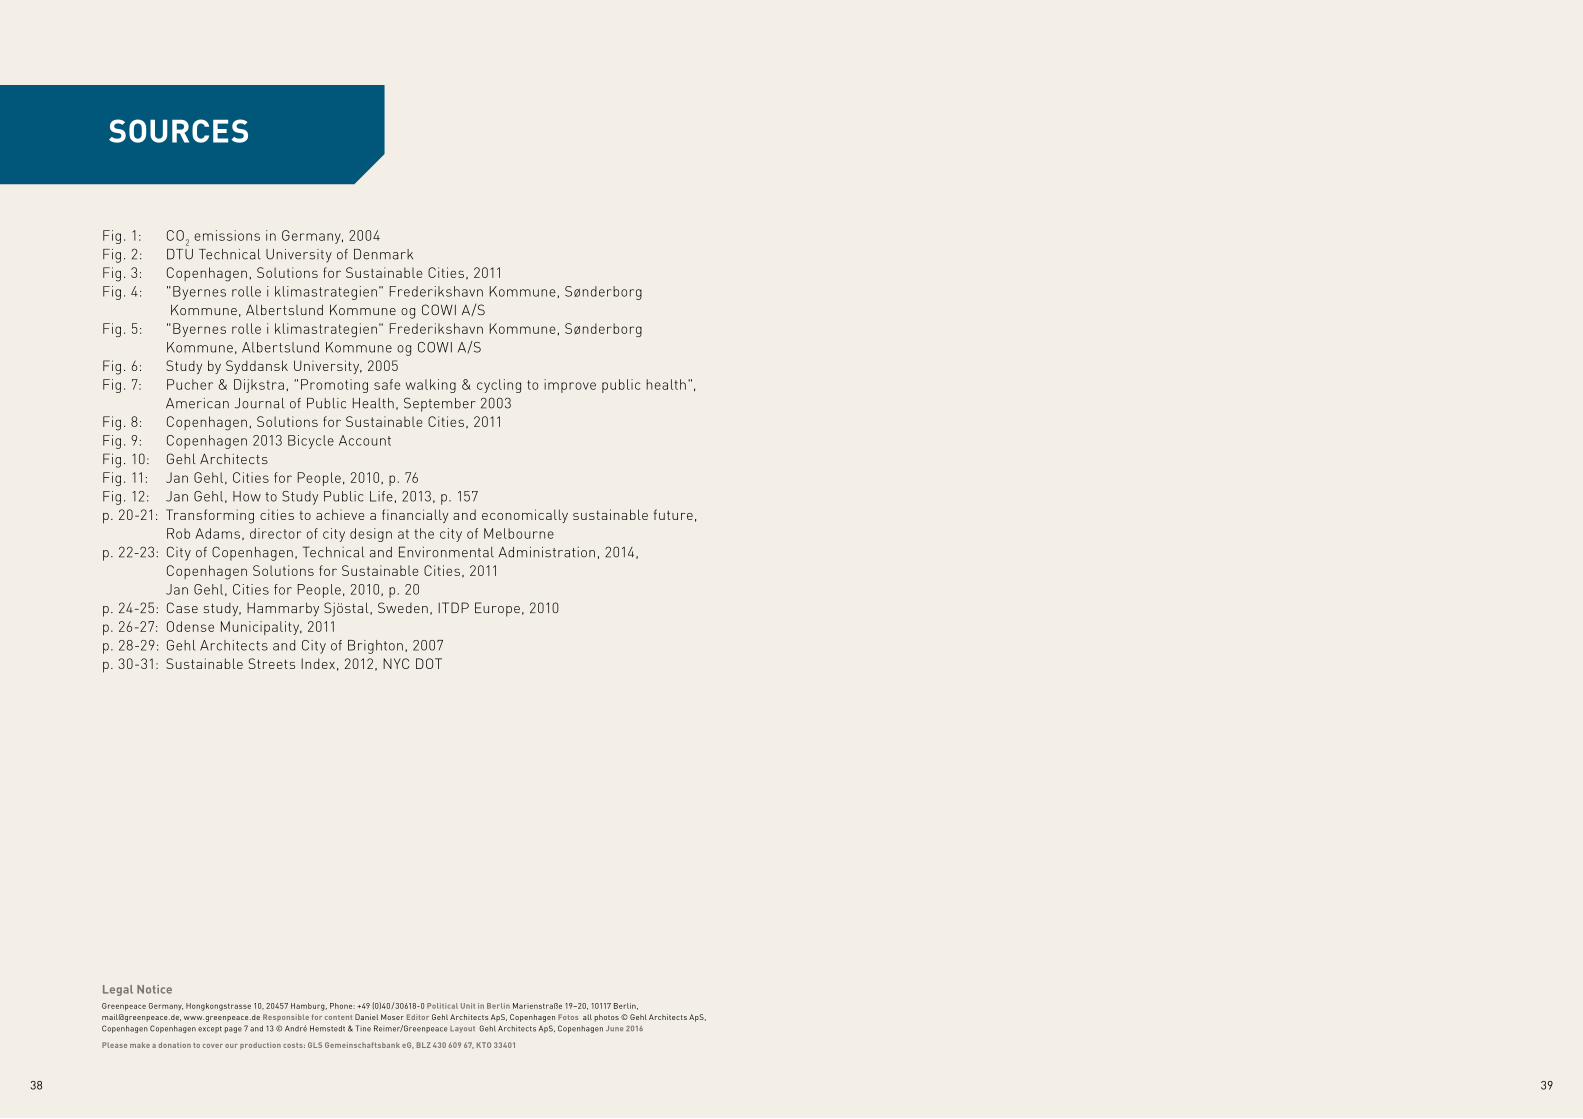
Fig. 1: CO2 emissions in Germany, 2004 Fig. 2: DTU Technical University of Denmark Fig. 3: Copenhagen, Solutions for Sustainable Cities, 2011Fig. 4: "Byernes rolle i klimastrategien" Frederikshavn Kommune, Sønderborg
Kommune, Albertslund Kommune og COWI A/S Fig. 5: "Byernes rolle i klimastrategien" Frederikshavn Kommune, Sønderborg Kommune, Albertslund Kommune og COWI A/S Fig. 6: Study by Syddansk University, 2005Fig. 7: Pucher & Dijkstra, "Promoting safe walking & cycling to improve public health", American Journal of Public Health, September 2003 Fig. 8: Copenhagen, Solutions for Sustainable Cities, 2011 Fig. 9: Copenhagen 2013 Bicycle AccountFig. 10: Gehl ArchitectsFig. 11: Jan Gehl, Cities for People, 2010, p. 76Fig. 12: Jan Gehl, How to Study Public Life, 2013, p. 157p. 20-21: Transforming cities to achieve a financially and economically sustainable future, Rob Adams, director of city design at the city of Melbournep. 22-23: City of Copenhagen, Technical and Environmental Administration, 2014, Copenhagen Solutions for Sustainable Cities, 2011 Jan Gehl, Cities for People, 2010, p. 20p. 24-25: Case study, Hammarby Sjöstal, Sweden, ITDP Europe, 2010p. 26-27: Odense Municipality, 2011p. 28-29: Gehl Architects and City of Brighton, 2007p. 30-31: Sustainable Streets Index, 2012, NYC DOT
SOURCES
Legal NoticeGreenpeace Germany, Hongkongstrasse 10, 20457 Hamburg, Phone: +49 (0)40 / 30618-0 Political Unit in Berlin Marienstraße 19 – 20, 10117 Berlin, mail @ greenpeace . de, www . greenpeace . de Responsible for content Daniel Moser Editor Gehl Architects ApS, Copenhagen Fotos all photos © Gehl Architects ApS, Copenhagen Copenhagen except page 7 and 13 © André Hemstedt & Tine Reimer/Greenpeace Layout Gehl Architects ApS, Copenhagen June 2016 Please make a donation to cover our production costs: GLS Gemeinschaftsbank eG, BLZ 430 609 67, KTO 33401
38 39

S 01
86 1