a new strategy for fast mri-based quantification of the ... · research article a new strategy for...
TRANSCRIPT

RESEARCH ARTICLE
A New Strategy for Fast MRI-BasedQuantificationof theMyelin Water Fraction:Application to Brain Imaging in InfantsSofya Kulikova1¤, Lucie Hertz-Pannier1, Ghislaine Dehaene-Lambertz2, Cyril Poupon3☯,
Jessica Dubois2☯*
1 INSERM U1129, CEA/DRF/I2BM/Neurospin/UNIACT, Gif-sur-Yvette, France; Universite Paris-Saclay,
Universite Paris Descartes, Sorbonne Paris Cite, Paris, France, 2 INSERM U992, CEA/DRF/I2BM/
Neurospin/UNICOG, Gif-sur-Yvette, France; Universite Paris Saclay, Universite Paris-Sud, Gif-sur-Yvette,
France, 3 CEA/DRF/I2BM/Neurospin/UNIRS, Gif-sur-Yvette, France; Universite Paris Saclay, Universite
Paris-Sud, Gif-sur-Yvette, France
☯ These authors contributed equally to this work.
¤ Current address: National Research University Higher School of Economics, Laboratory for
Interdisciplinary Empirical Studies, Perm, Russia
AbstractThe volume fraction of water related to myelin (fmy) is a promising MRI index for in vivo
assessment of brain myelination, that can be derived from multi-component analysis of T1
and T2 relaxometry signals. However, existing quantification methods require rather long
acquisition and/or post-processing times, making implementation difficult both in research
studies on healthy unsedated children and in clinical examinations. The goal of this work
was to propose a novel strategy for fmy quantification within acceptable acquisition and
post-processing times. Our approach is based on a 3-compartment model (myelin-related
water, intra/extra-cellular water and unrestricted water), and uses calibrated values of
inherent relaxation times (T1c and T2c) for each compartment c. Calibration was first per-
formed on adult relaxometry datasets (N = 3) acquired with large numbers of inversion
times (TI) and echo times (TE), using an original combination of a region contraction
approach and a non-negative least-square (NNLS) algorithm. This strategy was compared
with voxel-wise fitting, and showed robust estimation of T1c and T2c. The accuracy of fmy
calculations depending on multiple factors was investigated using simulated data. In the
testing stage, our strategy enabled fast fmy mapping, based on relaxometry datasets
acquired with reduced TI and TE numbers (acquisition <6 min), and analyzed with NNLS
algorithm (post-processing <5min). In adults (N = 13, mean age 22.4±1.6 years), fmy maps
showed variability across white matter regions, in agreement with previous studies. In
healthy infants (N = 18, aged 3 to 34 weeks), asynchronous changes in fmy values were
demonstrated across bundles, confirming the well-known progression of myelination.
PLOS ONE | DOI:10.1371/journal.pone.0163143 October 13, 2016 1 / 24
a11111
OPENACCESS
Citation: Kulikova S, Hertz-Pannier L, Dehaene-
Lambertz G, Poupon C, Dubois J (2016) A New
Strategy for Fast MRI-Based Quantification of the
Myelin Water Fraction: Application to Brain Imaging
in Infants. PLoS ONE 11(10): e0163143.
doi:10.1371/journal.pone.0163143
Editor: Veronika Schopf, Karl-Franzens-Universitat
Graz, AUSTRIA
Received: January 13, 2016
Accepted: September 2, 2016
Published: October 13, 2016
Copyright: © 2016 Kulikova et al. This is an open
access article distributed under the terms of the
Creative Commons Attribution License, which
permits unrestricted use, distribution, and
reproduction in any medium, provided the original
author and source are credited.
Data Availability Statement: The French
regulation does require the explicit authorization
from the subjects (or his/her parents) to make
research data fully public. We did not receive
patient consent and are not able to upload the raw
data. To access these data, any interested
researcher may contact the person in charge of
data availability at our institution, as well as the
authors: Dimitri Papadopoulos (dimitri.
[email protected]), Jessica Dubois (jessica.
[email protected]), Lucie Hertz-Pannier
([email protected]). Post-processed

Introduction
Myelination is a crucial process of the white matter maturation. Although there is a criticalneed for in vivo quantitative assessment of myelination in many clinical conditions encom-passing most neurodevelopmental disorders, there is still no gold-standard for its evaluation.Whereas myelination can be assessed using conventional Magnetic Resonance Imaging (MRI)and Diffusion Tensor Imaging (DTI) parameters [1–3], these methods provide only indirectand non-specificmeasures of the myelin content as they also reflect other tissue properties[4,5]. Recent advances in MR relaxometry have proposed a novel index: the volume fractionof water related to myelin (fmy), which has shown good correlation with the myelin amount[6] and seems relevant for quantifying the progression of white matter myelination [7–9]. fmy
corresponds to the fraction of water volume trapped by the myelin sheaths relative to the totalwater volume within an imaging voxel, and can be derived from a multi-component analysisof relaxometry signals [10,11]. The number of compartments, corresponding to differentpools of water within a voxel, usually varies from 2 to 4, and includes myelin-related compart-ment, intra/extra-cellularwater, and unrestrictedwater (such as observed in the cerebro-spi-nal fluid CSF).
The most conventional approaches for fmy quantification rely on the calculation of T2spectrum, and define fmy in each voxel as the ratio between the signal with T2 below 40-50ms, and the total water signal [6,11–16]. Similar strategies have been proposed for T2� [17]and T1 spectra [18]. However, reliable estimation of a spectrum requires acquisition ofrelaxometry signals with a large number of sampling points (N>32 for echo times TE orinversion times TI) [10,11], making the acquisition protocol impractically long for unsedatedinfants and children. Alternative approaches are based on multi-compartment models of MRrelaxometry signals, which take into account the relative contributions of different compart-ments: fitting these models against acquired measurements enables to estimate the volumefractions of the various compartments [9,19,20]. In such models, differences in relaxometrysignals across voxels might be explained either by different compartment fractions, or by var-iations in their magnetic properties (i.e. intrinsic relaxation times) due to variations in theirbiophysical properties (axonal diameters, myelin thickness, myelin compactness, axonal den-sity, etc.). Unless a priori assumptions are made on the compartment relaxation times [9],such models are described by non-linear equations, and the robustness of their fitting relieson the sampling strategy, the number of measurements and the optimization algorithm.mcDESPOT sequences were the first approach that allowed to reduce the acquisition time:for instance, in infants between 3 and 9 months of age, the total imaging time (includingsequences for B0 and B1 corrections [21]) can be reduced down to 18min on a 3T scanner [8].Unfortunately this duration remains rather long for unsedated pediatric subjects. In addition,long post-processing times (~14 hours per subject on an 8-core Intel I7 machine [19]) areinevitable due to the model non-linearity imposing the use of time-consuming stochasticmodel fitting. The goal of this study was thus to design and test a novel strategy for fast fmy
quantification, based on reasonable acquisition and post-processing times, which could beapplied for instance in infants.
Strategy and Hypotheses for Fast fmy Quantification
Let us first introduce the general concepts and hypotheses of our approach. It is based on a3-compartment relaxation model adapted from [9], and uses a 2-stage strategy (calibrationthen testing), which imposes little a priori assumptions on the compartment relaxation proper-ties. Details on the fitting procedures are provided in the “Materials and Methods” section.
Fast fmy Quantification in Infants
PLOS ONE | DOI:10.1371/journal.pone.0163143 October 13, 2016 2 / 24
images (e.g. myelin fraction maps and quantitative
T1 and T2 maps for infants and adults) are
available at http://neurovault.org/collections/1847/.
Funding: � Fyssen Foundation (JD): funding of the
data collection � Fondation de France (JD): funding
of the data collection � Ecole des Neurosciences de
Paris (JD): 1-year salary for JD � ELA Foundation
(LHP): salary for SK � French National Agency for
Research (GDL): The funder had no direct role in
study design, data collection and analysis, decision
to publish, or preparation of the manuscript. �
European Union Seventh Framework Program
(GDL, FP7/2007-2013, grant agreement n˚
604102): The funder had no direct role in study
design, data collection and analysis, decision to
publish, or preparation of the manuscript.
Competing Interests: The authors have declared
that no competing interests exist.
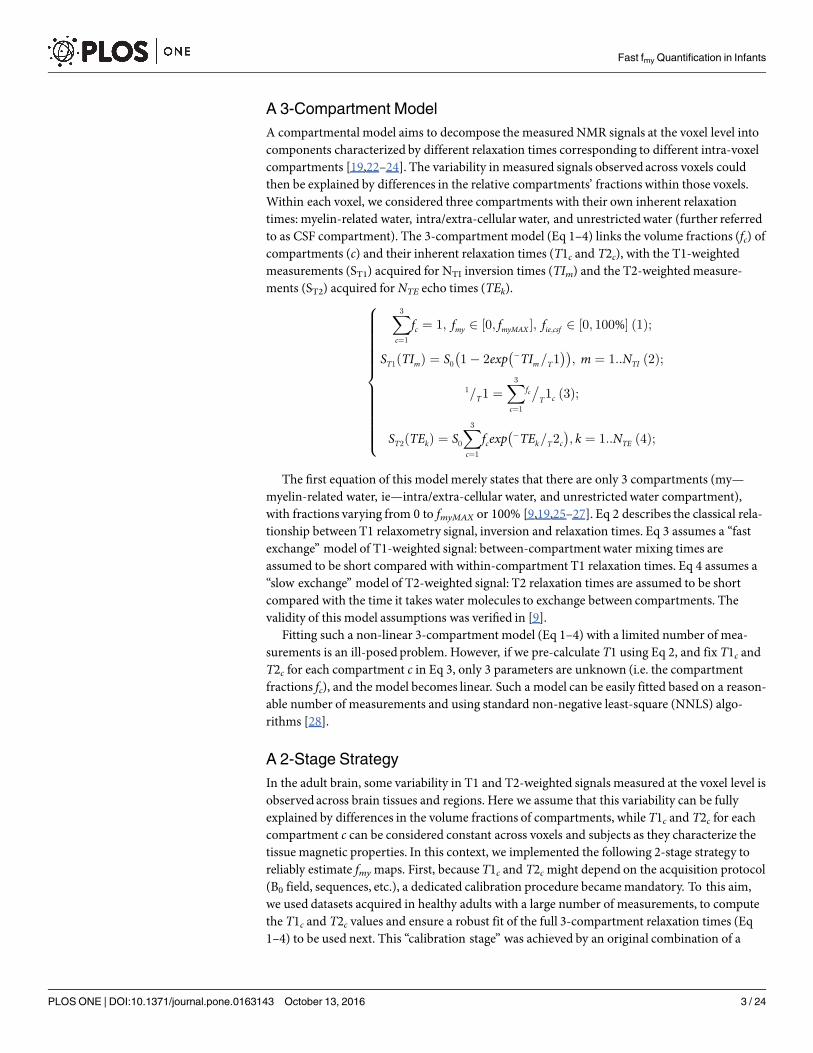
A 3-Compartment Model
A compartmental model aims to decompose the measured NMR signals at the voxel level intocomponents characterized by different relaxation times corresponding to different intra-voxelcompartments [19,22–24]. The variability in measured signals observed across voxels couldthen be explained by differences in the relative compartments’ fractions within those voxels.Within each voxel, we considered three compartments with their own inherent relaxationtimes: myelin-related water, intra/extra-cellularwater, and unrestrictedwater (further referredto as CSF compartment). The 3-compartment model (Eq 1–4) links the volume fractions (fc) ofcompartments (c) and their inherent relaxation times (T1c and T2c), with the T1-weightedmeasurements (ST1) acquired for NTI inversion times (TIm) and the T2-weighted measure-ments (ST2) acquired for NTE echo times (TEk).
X3
c¼1
fc ¼ 1; fmy 2 ½0; fmyMAX �; fie;csf 2 ½0; 100%� ð1Þ;
ST1ðTImÞ ¼ S0 1 � 2exp � TIm=T1� �� �
; m ¼ 1::NTI ð2Þ;
1=T1 ¼X3
c¼1
fc�
T1c ð3Þ;
ST2ðTEkÞ ¼ S0
X3
c¼1
fcexp � TEk=T2c
� �; k ¼ 1::NTE ð4Þ;
8>>>>>>>>>>>>><
>>>>>>>>>>>>>:
The first equation of this model merely states that there are only 3 compartments (my—myelin-related water, ie—intra/extra-cellular water, and unrestrictedwater compartment),with fractions varying from 0 to fmyMAX or 100% [9,19,25–27]. Eq 2 describes the classical rela-tionship betweenT1 relaxometry signal, inversion and relaxation times. Eq 3 assumes a “fastexchange” model of T1-weighted signal: between-compartmentwater mixing times areassumed to be short compared with within-compartment T1 relaxation times. Eq 4 assumes a“slow exchange” model of T2-weighted signal: T2 relaxation times are assumed to be shortcompared with the time it takes water molecules to exchange between compartments. Thevalidity of this model assumptions was verified in [9].
Fitting such a non-linear 3-compartment model (Eq 1–4) with a limited number of mea-surements is an ill-posedproblem. However, if we pre-calculate T1 using Eq 2, and fix T1c andT2c for each compartment c in Eq 3, only 3 parameters are unknown (i.e. the compartmentfractions fc), and the model becomes linear. Such a model can be easily fitted based on a reason-able number of measurements and using standard non-negative least-square (NNLS) algo-rithms [28].
A 2-Stage Strategy
In the adult brain, some variability in T1 and T2-weighted signals measured at the voxel level isobserved across brain tissues and regions. Here we assume that this variability can be fullyexplained by differences in the volume fractions of compartments, while T1c and T2c for eachcompartment c can be considered constant across voxels and subjects as they characterize thetissue magnetic properties. In this context, we implemented the following 2-stage strategy toreliably estimate fmy maps. First, because T1c and T2c might depend on the acquisition protocol(B0 field, sequences, etc.), a dedicated calibration procedure became mandatory. To this aim,we used datasets acquired in healthy adults with a large number of measurements, to computethe T1c and T2c values and ensure a robust fit of the full 3-compartment relaxation times (Eq1–4) to be used next. This “calibration stage” was achieved by an original combination of a
Fast fmy Quantification in Infants
PLOS ONE | DOI:10.1371/journal.pone.0163143 October 13, 2016 3 / 24

region contraction approach and a standard NNLS algorithm. Second, the model complexitywas reduced by fixing T1c and T2c in the “testing stage”, which allowed us to compute fmy mapsfrom datasets acquired using a significantly reduced imaging protocol relying on a small num-ber of measurements. To check the validity of our hypothesis, we compared fmy, T1c and T2c
values computed with voxel-wise model fitting, and at the calibration and testing stages. Theimpact of several factors on fmy accuracywas also investigated.
Besides, compartmental models have enabled the efficient description of changes related tobrain maturation in the recent years [8,9,29]. Here we evaluated whether fmy maps could becomputed in infants with the same approach, based on reduced datasets relying on few mea-surements. As detailed in the “Discussion” section, we assumed that T1c and T2c do not evolvethroughout development, and that age-related decreases in T1 and T2 relaxation times mea-sured at the voxel level are exclusively explained by age-related changes in intra-voxel compart-ments fractions.
Materials and Methods
Datasets and MRI Acquisition
We acquired different datasets in adult and infant subjects. All acquisitions were performed ona 3T MRI system (Tim Trio, Siemens Healthcare, Erlangen, Germany), equipped with a wholebody gradient (40mT/m, 175T/m/s) and a 32-channel receive-only head coil. To measure T1and T2 relaxometry signals, single-shot spin-echo (SE) echo-planar-imaging (EPI) sequenceswere used to acquire interleaved axial slices covering the whole brain (70/50 slices for adults/infants) with a 1.8 mm isotropic spatial resolution (field-of-view= 23cm, matrix = 128x128,slice thickness = 1.8mm). For T1 relaxometry, an inversion recovery (IR) SE-EPI sequencewith different TI values was used (TE = 38ms, TR = TI + 21s/15s for adults/infants; partial Fou-rier sampling factor of 5/8). For T2 relaxometry, a SE-EPI sequence with different TE valueswas used (TR = 21.7s/15.5s for adults/infants, parallel imaging with GRAPPA factor 2, partialFourier sampling factor of 6/8). Anatomical images were further acquired for registration: inadults, T1-weighted (T1w) images with a 1mm isotropic spatial resolution using a 3D fast gra-dient inversion recovery sequence (MPRage); in infants, T2-weighted (T2w) images with a spa-tial resolution of 1x1x1.1mm3 using a 2D turbo spin echo sequence.
Calibration datasets in adults. To calibrate T1c and T2c of each compartment c, weacquired data on 3 healthy adult volunteers (1 female, 2 males, mean age: 23.2±2 years) usinglong protocols, based on large numbers (N = 30–60) of TI (sampled between 100ms and3100ms) and TE (sampled between 30ms and 340ms) leading to acquisition times between 35and 47min (S1 Table and S1 Fig). The TI and TE samplings were denser at the beginning of thesampling range to ensure good parameters estimation for the fast-relaxing myelin-related com-partment with low T1my and T2my.
Reduced datasets in adults and infants. The strategy was tested in two groups using shortacquisition protocols: an adult group of 13 healthy subjects (6 females, 7 males, mean age: 22.4±1.6 years), and a group of 18 healthy infants born at term (8 girls, 10 boys), with a matura-tional age (i.e. chronological age corrected for gestational age at birth) between 3 and 21 weeksfor 17 infants, plus one infant of 34 weeks old. A reduced number of measurements wasacquired. For T1 relaxometry, 8 different TIs (from 250 to 1500ms every 250ms, 2000 and2500ms) were used, leading to a scan duration of 3min03s/2min11s (adults/infants). For T2relaxometry, 8 linearly spaced TE values were used betweenTE = 50 and 260ms, leading to ascan duration of 4min/2min51s. To identify different white matter bundles used as regions-of-interest for fmy quantification, a non-diffusionweighted image (b = 0 s/mm2) and 30 diffusion-weighted (DW) images (b = 700 s/mm2) were acquired using a DW-SE-EPI sequence
Fast fmy Quantification in Infants
PLOS ONE | DOI:10.1371/journal.pone.0163143 October 13, 2016 4 / 24
(TE = 72ms, TR = 14s/10s, parallel imaging GRAPPA factor 2, partial Fourier sampling factor6/8) within an acquisition time of 7min56s/5min40s.
The study protocol was approved by the regional ethical committee for biomedical researchfrom Kremlin-Bicêtre (for adult experiments: CPP #2008-A00241-54; for infant experiments:INSERM 123 011, CPP #05 14). All parents and adult subjects gave written informed consents.The infants were spontaneously asleep during MR imaging (the protocol length was sufficientlyshort to be acquired during the nap). Particular precautions were taken to minimize noiseexposure, by using customized headphones and covering the magnet tunnel with special noiseprotection foam (“plastison”, Serenata, http://www.serenata.tm.fr/product.php?id_product=17). We also restrained the slew rate of MR gradients in EPI acquisitions. To reduce motion,the infants’ heads were gently restricted by the headphones and MRI foam pads.
Data Post-Processing
Data preparation. All data were pre- and post-processed using PTK toolkit and Connec-tomist software both developed in-house at NeuroSpin [30,31]. For T1 and T2 relaxometryimages, the signal-to-noise ratio (SNR) was computed as the ratio between the mean signalfrom the brain (without ventricles) to the standard deviation of the noise from the image back-ground. For all TIs and TEs, the SNR of T1 and T2 relaxation images was above 5.3 and 6.2respectively. These noise levels allowed us to approximate the non-centered chi-noise presentin GRAPPA-reconstructed images by a Gaussian noise, and thus to use NNLS estimators.
In each subject, T1 and T2 relaxometry images were co-registeredwith anatomical imagesusing affine transformations maximizing their mutual information. A brain mask was com-puted from the T2-weighted images with the highest SNR (corresponding to the lowest TE),based on thresholding and mathematical morphology tools (combination of opening and clos-ing). All images were masked with this brain mask. Quantitative T1 and T2 maps were furthercomputed.
Computation of reference fmy maps. In the calibration datasets (3 adults), we first per-formed a voxel-wise fitting of the 3-compartment model (Eq 1–4), to estimate fc, T1c and T2c
for each compartment c in each brain voxel. We aimed to both ensure that there was no partic-ular regional dependence of T1c and T2c, and to compute reference fmy maps. The upperboundary for fmy was set to 40%. An original combination of a region contraction approach[19,32] and a standard NNLS algorithm [28] was used (Fig 1). This procedure was pro-grammed in Python using NumPy and SciPy libraries. The initial search ranges for the individ-ual compartment T1c and T2c were set based on literature evidence [9,19,33,34] and to ensuretheir continuity:
• for myelin-related compartment: T1my 2 [300; 570] ms, T2my 2 [1; 40] ms
• for intra/extra-cellularwater compartment: T1ie 2 [570; 1600] ms, T2ie 2 [40; 200] ms
• for CSF compartment: T1csf 2 [1600; 4000] ms, T2csf 2 [200; 2000] ms.
In each voxel, random T1c and T2c values were first selected from the corresponding searchranges using uniform random distributions. Then the simplified model (with correspondingT1c and T2c) was fitted using a NNLS algorithm. The fitting error was calculated by increasingthe weight of Eq 3 (describing T1 relaxation) proportionally to the number of TI points: thiswas performed to balance the contributions of T1 (only one equation in the model) and T2(TE equations) in the fitting error computation. Similar to [19], this step was repeated 10000times in each voxel, and the best 100 selections of T1c and T2c values (i.e. providing the smallest
Fast fmy Quantification in Infants
PLOS ONE | DOI:10.1371/journal.pone.0163143 October 13, 2016 5 / 24

fitting errors) were used to contract the search ranges. After contraction, the whole procedurewas re-started: 90% of random T1c and T2c values were chosen from the new search ranges,while the remaining 10% were selected from the initial ranges to avoid falling into a local mini-mum. This fitting procedure was executed until both the fitting errors and the differencebetween the ranges boundaries became less than 1%. For each voxel, this procedure tookaround 70-80sec on Intel I3 machine using a single core CPU (the algorithm convergence isillustrated in S2 Fig), leading to around 120 hours per subject for the central slices of the brain(covering the ventricles, corpus callosum and basal ganglia, i.e. containing portions of all threecompartments).
At the same time, fmy maps were computed using Eq 1–4 by fixing T1c and T2c based on theliterature: either according to [9] (T1my = 350ms, T1ie = 850ms, T1csf = 2800ms, T2my = 10ms,T2ie = 40ms, T2csf = 130ms) or [19] (T1my = 465ms, T1ie = 9665ms, T1csf = 3500ms, T2my =12ms, T2ie = 90ms, T2csf = 250ms). The resulting fmy maps were compared with maps obtainedwith voxel-wise fitting, with the aim to demonstrate that T1c and T2c values could not be sim-ply taken from the literature but required specific calibration for our acquisition protocol.
Calibration of the 3-compartment relaxationmodel. T1c and T2c were then calibratedon the same datasets, using the same fitting procedure as for the voxel-wise estimation, exceptthat it was performed at the slice level and not at the voxel level for two reasons: to save compu-tation time, and to increase the fitting accuracy (as detailed below, calculation errors decreasewith the number of voxels used for fitting). In each of the 3 subjects, we considered the same 10central slices as they contained portions of all three compartments. The total fitting error wascalculated over all voxels within each slice independently (averaged number per slice: 5718
Fig 1. Schematic representation of the fitting algorithm. The fitting procedure was performed either for each voxel (voxel-wise
approach) or for each slice (calibration approach) independently. The fitting steps were repeated until both the fitting error and the
differences between the upper and lower borders of the search ranges became less than 1%.
doi:10.1371/journal.pone.0163143.g001
Fast fmy Quantification in Infants
PLOS ONE | DOI:10.1371/journal.pone.0163143 October 13, 2016 6 / 24

±406). Once the calibration was performed for each slice, T1c and T2c were set to the weightedaverages over all slices of all subjects (10 slices x 3 subjects, weighted with inversed fittingerrors). These calibrated values were compared with T1c and T2c distributions obtained withthe voxel-wise approach. The resulting fmy maps were also compared with the reference fmy
maps. This calibration stage took approximately 24 hours per subject.
Checking the Accuracy and Limits of the Calibration Stage
Selectionof fmy upper boundary. We explored the effect of fmy upper boundary at the cal-ibration stage, since it was shown to have a considerable impact on fmy values derived from therelaxometry model based on mcDESPOT protocol [35]. It has been shown that the quality ofmodel fitting (sum-of-square of residuals) using stochastic region contraction approach is thebest when the upper boundary is between 0.3 and 0.5 and is insensitive to changes within thisrange [35]. Thus the search interval for fmy was initially set to [0; 0.4], and we also consideredtwo other upper boundaries (0.3 and 0.5) at the calibration stage, to compare the estimated T1c
and T2c, and fmy maps. Given the results, the upper boundarywas fixed to 0.4 in the followingtests.
Impact of TI/TE numbers on the calibration of T1c and T2c. We investigated the impactof TI and TE numbers on the estimation of T1c and T2c, to make sure that each calibrationdataset had enough sampling points for reliable calibration. From the initial dataset with 60 TI/TE sampling points (subject #3, S1 Fig), we progressively removed data points in a regularmanner from 60 down to 10 points (S1 Fig), and we performed independent calibrations foreach resulting dataset.
Evaluating the fitting accuracyusing simulated data. We also checked using simulateddata whether the proposed calibration strategy provided reliable computation of fmy values. T1and T2 relaxometry signals were simulated using Eq 2–4 at all TI and TE sampling points. Wefixed T1c and T2c values either equal to those identified at the calibration stage or as in previousstudies [9,19,34,35] (T1my = 465ms, T1ie = 965ms, T1csf = 3500ms, T2my = 12ms, T2ie = 90ms,T2csf = 250ms). Different compartment fractions were considered, as possibly observed in thewhite matter: fmy = [5,10,15,20,25,30,40]%, fcsf = [0,1,2,3,4,5]% and fie = (100 − fmy − fcsf)%. Sim-ulated signals were additionally corrupted with a Gaussian noise with a dispersion varyingfrom 0 to 20% relative to signal values. Then the calibration procedure was applied to simulatedsignals to identify the compartment fractions as well as T1c and T2c. The error in fmy calculationwas estimated as the averaged absolute percent difference between identified and simulated val-ues. We also investigated how the number of voxels used for the model fitting impacted fmy
errors. In theory, calculation errors are proportional to the inversed square root of the voxelnumber [36]. Thus, simulations were performed for voxel numbers equal to [12, 22, . . ., 752 =5625], and errors were fitted with the inverse square root function. Finally, we compared fmy
calculation errors obtained in simulations using both T1 and T2 relaxometry signals together,vs. only T2 relaxometry signal.
Testing the Calibration Model and Measuring fmy over White Matter
Bundles
In the testing stage, fmy maps were computed in both the calibration and reduced datasets byfixing T1c and T2c to those determined at the calibration stage. For the whole brain of each sub-ject, this stage took less than 5 min. We checked that down-sampling the calibration datasets(to match the 8 TIs and 8 TEs of the reduced datasets) had no significant impact on the gener-ated fmy maps. Similarity between fmy distributions computed from the adult calibration andreduced datasets was assessed by ad-hoc χ2 test [37]. For each adult and infant reduced dataset,
Fast fmy Quantification in Infants
PLOS ONE | DOI:10.1371/journal.pone.0163143 October 13, 2016 7 / 24

fmy was further quantified and averaged over different white matter bundles. To do so, DWimages were co-registeredwith anatomical images using affine transformations, and correctedfor motion and eddy current artifacts [38]. 18 projection, association, commissural and limbicbundles maturing at different times and rates were reconstructed in each subject according to a4-order analytical Q-ball model [39], regularized 3D tractography [40], and manually delin-eated regions of interest [41]. In the adult group, fmy value in each bundle was compared withquantitative T1 and T2 relaxation times based on correlation across subjects. In the infantgroup, fmy age-related changes were assessed. Infant values were further normalized by the cor-responding average from the adult group to address the degree of bundles myelination rela-tively to the adult mature stage [42].
Results
Calibration vs Voxel-Wise Fitting Approach
In the calibration datasets, the voxel-wise fitting procedure provided fmy maps of high quality(Fig 2a). Across voxels, T1c and T2c estimations varied to some extent over the whole searchranges, but in a completely random way (Fig 3), suggesting these magnetic properties can beconsidered as stable across brain regions. The resulting mean T1c and T2c values (±standarddeviations SD) were:
• for myelin-related water compartment: T1my = 360±39ms, T2my = 18±8ms
• for intra/extra-cellularwater compartment: T1ie = 1482±29ms, T2ie = 53±12ms
• for unrestrictedwater (CSF) compartment: T1csf = 3431±78ms, T2csf = 852±79ms.
In the same datasets, the calibration procedure resulted in the following T1c and T2c estima-tions (mean±SD over the 10 slices of the 3 subjects):
• for myelin-related water compartment: T1my = 357 ± 21ms, T2my = 18 ± 5ms
• for intra/extra-cellularwater compartment: T1ie = 1483 ± 17ms, T2ie = 52 ± 6ms
• for unrestrictedwater (CSF) compartment: T1csf = 3441 ± 36ms, T2csf = 858 ± 47ms.
These values were close to the distribution peaks revealed by the voxel-wise procedure (nostatistical difference: t-test, p>0.4). The resulting fmy maps (Fig 2b) had similar distributions ofvalues across the 3 subjects (ad-hoc χ2 test, p>0.95), and similar visual appearances with voxel-wise fmy maps (Fig 2a), with differences smaller than 3% (histogram in Fig 2b). These resultssuggested that our slice-wise calibration procedure was successful in comparison with thevoxel-wise procedure. On the contrary, fixing T1c and T2c according to the literature was inad-equate as fmy maps displayed much smaller values than voxel-wise maps in most voxels, andwere not consistent across subjects (Fig 2c and 2d). fmy values were very low in the grey matter,despite the known presence of myelin in both the cortex and deep grey nuclei. These observa-tions confirmed that the calibration stage was necessary to estimate reliable T1c and T2c givenour acquisition framework.
Factors Influencing the Calibration Stage
Selectionof fmy upper boundary. We investigated how the initial upper search boundaryfor fmy impacted the estimated fmy, T1c and T2c values at the calibration stage. With a [0, 0.4]interval, quite high fmy values were observed in the adult white matter (Fig 2b), in comparisonwith previous studies [7,9]. When changing the upper boundary to 0.3 and 0.5 for the 3
Fast fmy Quantification in Infants
PLOS ONE | DOI:10.1371/journal.pone.0163143 October 13, 2016 8 / 24

Fig 2. fmy maps in the 3 calibration adult subjects. For each subject, fmy maps were computed according
to different strategies based on either the complete datasets (a-e) or datasets with reduced numbers of
measurements (f). Maps were first estimated without fixing T1c and T2c, using voxel-wise fitting (a) or slice-
wise fitting (b: maps computed at the calibration stage). Second, T1c and T2c were fixed according to the
literature (from [9] and [19] in c and d respectively), or to calibrated values (e, f). Maps are displayed in
Fast fmy Quantification in Infants
PLOS ONE | DOI:10.1371/journal.pone.0163143 October 13, 2016 9 / 24

radiological convention. Histograms show the number of voxels with a given fmy difference (in %) between
each fmy map and the reference map (a).
doi:10.1371/journal.pone.0163143.g002
Fig 3. Variations of the compartments relaxation times across voxels. In the first three rows,
histograms show distributions of T1c and T2c estimations (for myelin-related water, intra/extra-cellular water,
and CSF compartments) obtained from voxel-wise fitting within the search ranges, across all voxels of the 3
calibration datasets. T1c and T2c maps (presented for subject #3) did not reveal any regional dependence. In
the bottom row, distributions of quantitative T1 and T2 values obtained from mono-exponential fittings at the
voxel-level are shown, as well as T1 and T2 maps (subject #3).
doi:10.1371/journal.pone.0163143.g003
Fast fmy Quantification in Infants
PLOS ONE | DOI:10.1371/journal.pone.0163143 October 13, 2016 10 / 24

calibration datasets, we observed a strong impact on fmy maps (S3 Fig): higher upper boundaryresulted in higher fmy values in all 3 subjects. However, the estimated T1c and T2c were veryclose (S2 Table). Of interest, when the upper boundarywas set to 0.4, distributions of fmy valuesacross the 3 subjects were the most similar (i.e. they had the biggest overlap, S3 Fig), and stan-dard deviations for T1c and T2c estimations were the lowest (S2 Table). These results suggestedthat fixing the upper boundary for fmy to 0.4 was valid although it might provide high fmy
values.Accuracyof the calibration strategy. We further assessed whether our calibration strategy
was sensitive to different acquisition parameters (sampling points, noise level). First, reducingthe number of calibration TI and TE points until N = 25 for both T1 and T2 relaxometry sig-nals, had no significant effect on T1c and T2c calibration in subject #3 (ad-hoc paired t-testbetween T1c and T2c values from individual slices: p>0.06, S4 Fig). This suggested that our cal-ibration stage was performed in a stable manner across all 3 subjects despite the different num-bers of TI and TE points.
Application of the calibration strategy to simulated data showed that as the noise levelincreased, reliable calculation of fmy values required increasing the number of voxels used to esti-mate the compartment relaxation times (Fig 4a). In agreement with previously conducted simu-lations [19], the average estimation errors were less than 10% even for a noise level of 20% of thesignal values, on condition that more than 2000 voxels were used simultaneously (Fig 4a). Insimulations with a 20% noise level and a number of voxels higher than 5000, we observed thatestimation errors decreasedwith increasing fmy values, and that maximal errors did not exceed15% for fmy values of 5% (Fig 4b). This suggested that the number of voxels considered in ourcalibration stage (~5718±406 voxels for each slice) was sufficient for reliable fmy estimation.
Besides, in identical conditions (same noise level, number of voxels, compartment fractions,T1c and T2c), removing T1 relaxation from the model (i.e. removing Eq 3) significantly reducedthe accuracy of fmy calculations as compared to the full model (ad-hoc paired t-test, p< 10−6).This demonstrated that modeling T1 and T2 relaxometry signals together was more appropri-ate than considering T2 relaxation alone, this was probably because we could not sample T2signals for very short TE as compared with the very low T2my value as discussed below.
Evaluation of the Testing Stage
Fixing T1c and T2c with calibrated values. In the calibration datasets, fixing T1c and T2c
with calibrated values to fit the 3-compartment model had little effect on fmy maps, whetherthe number of data points was kept complete (Fig 2e) or reduced to 8 TI and 8 TE valuesmatching those of the reduced datasets (Fig 2f). The average absolute differences between thereference fmy maps and fmy maps computed with fixed calibrated T1c and T2c were very low(-0.3±1.8%; Fig 2e and 2f).
fmy maps in the reduceddatasets. In adults, fmy maps from the reduced datasets were verysimilar to the maps from the calibration datasets, both in terms of visual appearance (Figs 2 vs5) and distribution of fmy values (ad-hoc χ2 test: p>0.95). In infants, fmy maps showed the mye-lination progression describedby post-mortem studies [43]. Within white matter, the youngestinfants had high fmy values only in the posterior limb of the internal capsule, and fmy valuesprogressively increasedwith age in a caudo-rostral direction, from the center of the brain tothe periphery (Fig 5).
fmy Quantification in White Matter Bundles
fmy in the adult bundles. In adults, fmy values were highly variable across bundles (Fig 6aand 6b): from 0.14 in the spino-thalamic tract up to 0.36 in the optic radiations. In the spino-
Fast fmy Quantification in Infants
PLOS ONE | DOI:10.1371/journal.pone.0163143 October 13, 2016 11 / 24

thalamic tract, surprisingly low values and high inter-individual variability were probably dueto subtle misalignment between fmy maps and DW images in the brainstem of some adults.High variability in fmy values was also observed in the genu of corpus callosum, possibly due topartial volume effects with the ventricle CSF. In all bundles, fmy values were strongly correlatedwith T1 values across adult subjects (R2> 0.95), but not with T2 values.
fmy in the infant bundles. In infants, fmy values were smaller than in adults and below 0.05for most bundles (on average over the group) (Fig 6b). The highest fmy values were observed inthe cortico-spinal and spino-thalamic tracts and in the optic radiations, which are known tomyelinate early on. According to the 3-compartment model, age-related changes in T1 and T2relaxation times (measured at the voxel level) over the infant group could be explained by age-related changes in the compartment fractions, notably by changes in fmy values. For instance,in the middle cortico-spinal tract, we observed that fmy changed from 5% at 3 weeks of age to17% at 21 weeks, in relation with changes in fie from 89% to 80%, and in fcsf from 6% to 3%.
Fig 4. fmy calculation accuracy at the calibration stage assessed in numerical simulations. (a) The fmy calculation errors were calculated for simulated
fmy = [5,10,15,20,25,30,40]% and fcsf = [0,1,2,3,4,5]%, and the resulting average values were represented as a function of the number of voxels used for the
model fitting [12, 22, . . ., 752 = 5625], for different noise levels (from 0 to 20%). As expected, relationship between the fmy calculation errors and the number of
voxels could be described by inverse square root relationship (R2 > 0.75). (b) For a noise level of 20%, calculation errors for different simulated fmy values
were averaged for voxel numbers higher than 5000 ([712, . . ., 752]) and fcsf = [0,1,2,3,4,5]%, considering T1c and T2c values fixed according to our calibration
stage (set1) or to previous studies (set2 [9,19,34,35]). (c, d) Examples of the theoretical and estimated T2 (c) and T1 (d) relaxation signals for data simulated
with fmy = 20%, fie = 78%, fcsf = 2% and T1c and T2c fixed according to our calibration stage.
doi:10.1371/journal.pone.0163143.g004
Fast fmy Quantification in Infants
PLOS ONE | DOI:10.1371/journal.pone.0163143 October 13, 2016 12 / 24
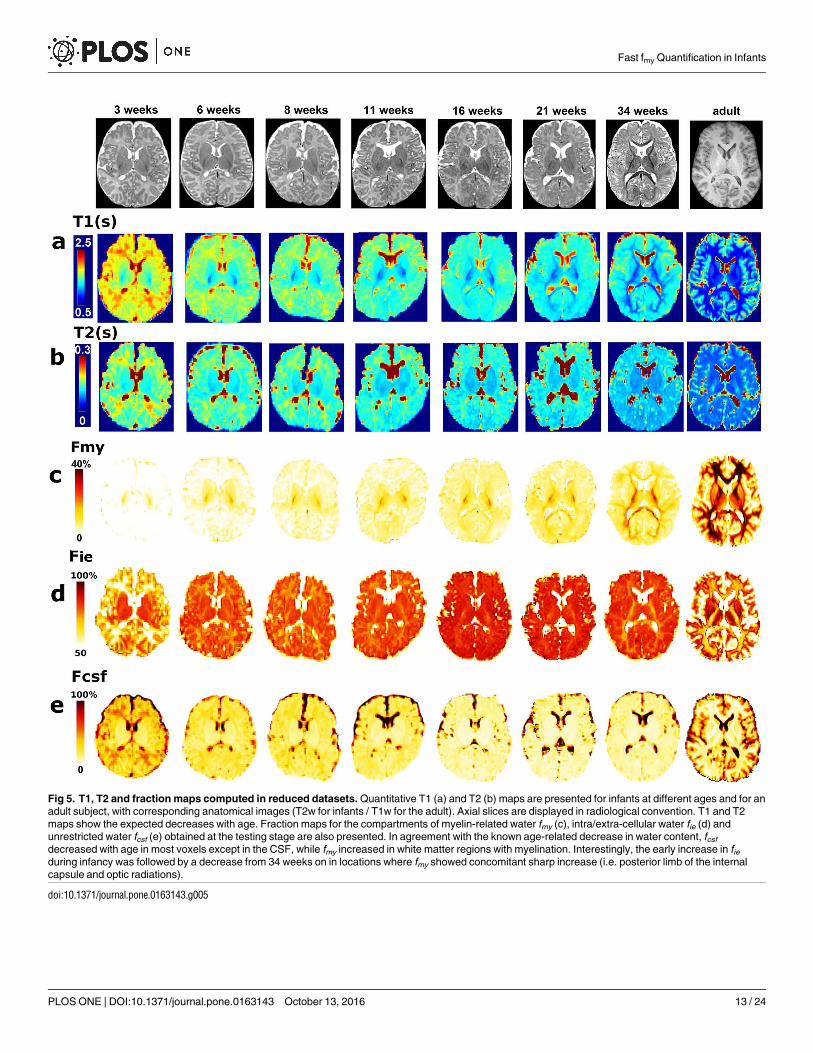
Fig 5. T1, T2 and fraction maps computed in reduced datasets. Quantitative T1 (a) and T2 (b) maps are presented for infants at different ages and for an
adult subject, with corresponding anatomical images (T2w for infants / T1w for the adult). Axial slices are displayed in radiological convention. T1 and T2
maps show the expected decreases with age. Fraction maps for the compartments of myelin-related water fmy (c), intra/extra-cellular water fie (d) and
unrestricted water fcsf (e) obtained at the testing stage are also presented. In agreement with the known age-related decrease in water content, fcsf
decreased with age in most voxels except in the CSF, while fmy increased in white matter regions with myelination. Interestingly, the early increase in fieduring infancy was followed by a decrease from 34 weeks on in locations where fmy showed concomitant sharp increase (i.e. posterior limb of the internal
capsule and optic radiations).
doi:10.1371/journal.pone.0163143.g005
Fast fmy Quantification in Infants
PLOS ONE | DOI:10.1371/journal.pone.0163143 October 13, 2016 13 / 24

Fig 6. fmy quantification across white matter bundles in infants and adults. (a) White matter bundles reconstructed with tractography (adapted from
[42]). (b) fmy values across bundles in infants (light) and adults (dark). (c) Age-related changes in infants’ normalized fmy values (in % of the mean adult
values) for the same bundles. Lines show significant linear regressions with age (R2 > 0.58, p<0.015), for all bundles except the spino-thalamic tract.
Abbreviations: Projection bundles: cortico-spinal tract CST (inf—inferior, mid—middle, sup—superior portions), spino-thalamic tract STT, optic radiations
OR, anterior limb of the internal capsule ALIC; Association bundles: external capsule EC, arcuate fasciculus AF, superior SLF and inferior ILF longitudinal
fascicles, uncinate fasciculus UF, fronto-occipital fasciculus FOF; Limbic and Commissural bundles: fornix FX, inferior CGinf and superior CGsup parts of
the cingulum; corpus callosum: genu CCg, body CCb and splenium CCs.
doi:10.1371/journal.pone.0163143.g006
Fast fmy Quantification in Infants
PLOS ONE | DOI:10.1371/journal.pone.0163143 October 13, 2016 14 / 24
According to Eq 3 and calibrated T1c and T2c, T1 was expected to change from 1321 to 979ms,in agreement with experimental observations (the measured T1 changed from 1322 to 978mson average over the tract). These results were coherent with our initial hypothesis that age-related changes in relaxometry signals and T1 / T2 relaxation times (measured at the voxellevel), could be modeled exclusively by age-related changes in the compartment fractions.
fmy values normalized by the mean values from the adult group increasedwith age (from 3 to21 weeks) in all bundles but in an asynchronous manner (Fig 6c): in certain bundles (e.g. spino-thalamic tract, cortico-spinal tract, external capsule, fornix, optic radiations), normalized fmy
values increased earlier than in other bundles (e.g. arcuate and uncinate fasciculi, anterior limbof the internal capsule, corpus callosum). In all bundles except the spino-thalamic tract, linearregressions could describe these age-related increases over this short developmental period.However, since certain bundles had zero fmy values in the youngest infants, non-linear fittingmay be more pertinent for describing the earliest subtle changes in bundle myelination [29].
Discussion
In this work we proposed an original 2-stage approach for fast fmy quantification, based on a3-compartment model (myelin-related water, intra/extra-cellular water, unrestrictedwater) ofT1 and T2 relaxometry signals. At the first stage, we calibrated the compartment inherentrelaxation times (T1c and T2c) using data acquired in healthy adult subjects with a long acquisi-tion protocol. At the second stage, fmy maps could be computed using a simplified linear modeland relaxometry data acquired with a short acquisition protocol more adequate for a pediatricpopulation.
Is This 2-Stage Strategy Valid to Quantify fmy in the Adult Brain?
Checking the measures of fmy, T1c and T2c. One may first wonder whether our mainhypothesis (i.e. fixing the compartment relaxation times to identical values across all brainregions and tissues) is valid in the adult brain. Indeed, when we applied a voxel-wise fitting tothe calibrating datasets, T1c and T2c did not show any regional dependence across voxels, andtheir distributions showed mean values close to those identified during calibration. Further-more differences in fmy values across methods were rather low (<3% Fig 2a, 2b and 2e). Thuslocal variations in T1c and T2c were not expected to significantly vitiate our results in adults.However, these magnetic properties likely depend on acquisition protocol, and fixing their val-ues based on the literature (Fig 2c and 2d) was less reliable than considering calibrated values.Similarly, in future studies with different acquisition settings, calibrating T1c and T2c valueswould be required rather than applying the values reported here.
At the calibration stage, the initial search ranges for T1c and T2c were selected based on liter-ature evidence [9,19,34,35], and identified values were in agreement with reported values[6,9,33,44]. Before fixing T1c and T2c to compute fmy maps in the reduced datasets, we checkedthat their calibration was stable by 1) showing that all calibration datasets had enough samplingpoints for robust estimation of the compartment magnetic properties (S4 Fig); 2) verifyingusing simulated data that the proposed calibration procedure resulted in reliable estimations offmy values even in the presence of noise in relaxometry signals (Fig 4a and 4b); 3) proving thatfixing these relaxation times and down-sampling the calibration datasets did not change thegenerated fmy maps (Fig 2e and 2f). Experiments with simulated data further suggested that inthe presence of noise, calculation of fmy values might not be reliable on a voxel-wise level, andthat increasing the number of voxels used to calibrate T1c and T2c was then required (Fig 4a).
Comparisonwith other methods. With our approach, the calibration stage naturallyrequired long acquisition (>35min) and post-processing times (up to 24 hours, without
Fast fmy Quantification in Infants
PLOS ONE | DOI:10.1371/journal.pone.0163143 October 13, 2016 15 / 24
parallel computing). However, it must be performed only once for a given acquisition protocol(magnetic field, acquisition sequences, spatial resolution, etc.), and could be drastically acceler-ated using parallel computing. The main advantage of this approach is that, once calibration isperformed, fmy values can be computed over the whole brain within much shorter acquisition(~5/7min for 50/70 slices with 1.8mm isotropic resolution, in infants/adults correspondingly)and post-processing times (<5min) than in previous studies. Indeed, in conventional multi-compartment relaxometry imaging studies [11], acquisition time takes up to 15 min for 8–12contiguous slices because estimation of the T2 spectrumrequires acquisition of the relaxometrydata with a large number of TE. Although alternative approaches using mcDESPOT protocol[8] have enabled to shorten the acquisition time (between 18 and 25 min for a 1.8mm isotropicwhole brain coverage on a 3T scanner, including B0 and B1 corrections [21], or around 10–12min without these corrections [7]), these times remain quite long for unsedated infants, andrather long post-processing times (i.e. ~14 hours per subject [19]) are still required. Thus,using the proposed strategy can save at least 10 min of acquisition time and ~14 hours of post-processing time.
Our computed fmy values were higher than in most previous studies of infants [7,9] andadults [45], despite some exceptions [26,28]. Simulations suggested that our strategy was reli-able even in the presence of noise in relaxometry signals. Nevertheless, local variations in thebiophysical tissue properties and hence, in T1c and T2c across voxels might have introducedsome additional “physiological” noise, leading to slight overestimation of fmy values (indeed,fmy values from the calibration stage were slightly higher than voxel-wise fmy values). It shouldalso be noted that our model did not directly take into account the exchange between the differ-ent compartments: it only assumed that this exchange was fast relatively to T1 relaxation andslow relatively to T2 relaxation but it did not explicitly use exchange rate constants. Althoughthese assumptions are generally true [9], ignoring exchange between compartments may alsoresult in systematic bias [19,35]. However, including exchange through additional free parame-ters (exchange rate constants), would prevent the model to be linear, and our post-processingstrategy would lose in reliability and speed. Similarly, our model neglected susceptibility differ-ences across compartments, which might interfere particularly at high magnetic field, whenthese differences may impact the compartments relaxation. Correcting this would require tomodel a local susceptibility field gradient with a sinc function, but at the expense of an addi-tional free parameter (i.e. the gradient amplitude). With fast-gradient echo sequences and inmcDESPOT protocols [21], not correcting for B0 and B1 field inhomogeneitiesmight lead toerrors in fmy calculations (e.g. overestimated fmy values [46]) since the signal is spatially depen-dent on the accuracy of the net flip angle. However, our protocol to measure T1 and T2 mag-netic properties was based on spin echo EPI sequences, with repetition times much longer thanT1 relaxation times, and MR signal was sampled for different TIs and TEs respectively. Thusinhomogeneities in B0 and B1 fields would impact images in the same way at all different TIsand TEs, and might corrupt proton density maps but without any impact on T1 and T2estimations.
Eventually, our potential bias in high fmy values may arise from the stochastic fitting strategyused during calibration. Actually, in white matter structures, voxel-wise region contractionapproach tend to assign fmy values to the upper part of the initial search interval, and the corre-sponding T2my values to the lower part of the initial search interval [35]. Thus the initiallyselected search interval for fmy may have a considerable impact on fmy values. Indeed, weobserved a strong impact on fmy maps when the upper boundarywas changed from 0.4 to 0.3or 0.5: higher boundary resulted in higher fmy values, and the 0.4 boundary provided the high-est similarity in fmy distributions across the 3 subjects while the compartment relaxation timeswere stable. These observations point out to a main limitation of the present approach and
Fast fmy Quantification in Infants
PLOS ONE | DOI:10.1371/journal.pone.0163143 October 13, 2016 16 / 24
possibly of other approaches using stochastic model fitting, meaning that fmy values stronglydepend on the model fitting parameters. fmy quantification is also very sensitive to acquisitionsettings, including field strength, phase rewinding, sampling schemes of the inversion- andecho-times, voxel size, etc. [12,14,33,46]. This also justified the requirement to calibrate T1c
and T2c instead of considering values from the literature. As a consequence, quantitative com-parisons of fmy values across studies remain difficult.
Modeling both T1 and T2 relaxometry signals to measure fmy. As myelin-related com-partment has rather fast relaxation properties (e.g. T2my~20ms), robust estimation of its frac-tion from T2 spectrumrequires to start TE sampling with small values [10–12]. In this study,single-shot EPI sequences were used to keep the acquisition time as short as possible; and suchshort TEs could not be achieved, mainly due to the further lines of the partial k-space locatedbefore the echo time [47]. This means that even at the shortest TE, T2 relaxometry signal frommyelin-related water was already strongly degraded. Consequently, estimating fmy values fromT2 spectral analysis only was not possible, and reliably fitting the 3-compartment modelrequired adding information from T1 relaxation in order to reveal the contribution of myelin-water compartment. However, information from T2 relaxometry signal did help to separateintra-/extracellularwater from unrestrictedwater compartments. Thus in such experimentalconditions, considering both T1 and T2 relaxometry signals was necessary. In our study theSNRs were high and similar for both T1 and T2 relaxation images; thus, to balance T1 and T2contributions to the model fitting error, the weight of Eq 3, describing T1 relaxation, wasincreased proportionally to the number of TI points. However, it may be necessary to adjustthe relative weights of the model equations if SNRs differ between T1 and T2 relaxation signals.These different issues might explain at least in part why fmy and T1 values were strongly corre-lated in all adult bundles, similarly to previous studies using mcDESPOT strategy [45], in addi-tion to the dramatic influence on T1 values of water compartmentalization and ofmacromolecules (large lipids and proteins) in the myelin sheath.
Is This Approach Valid for Quantifying fmy in the Developing or
Pathological Brain?
Estimation of fmy in the infant brain from T1c and T2c calibration in the adult brain.In addition to the verified hypothesis on compartmental property stability across adult braintissues and regions, we also assumed stability throughout development, enabling us to computefmy maps in infants using calibrated T1c and T2c in adults. Actually the hypothesis that age-related changes in T1 and T2 relaxation signals measured at the voxel level could be explainedexclusively by changes in the compartment fractions within voxels, was verified in our infantgroup.
This assumption of compartment properties stability is often implicitly used in fmy studies[9,48] as well as in multi-compartment diffusion imaging studies [49]. Nevertheless, it mightbe questioned as compartments might change their biophysical properties during develop-ment, thus possibly affecting their relaxation times. For example, does the increase in myelincompactness with maturation shorten T1my and T2my values of the myelin-related compart-ment? Interestingly, the chemical composition of myelin in the infant brain was shown to besimilar to that of the adult brain [50], meaning that T1my and T2my should be identical acrossdifferent ages. Similarly, do T1ie and T2ie values of the intra-/extra-cellular compartmentchange with the development of intra-cellular cytoskeleton and microtubules?
Anyhow, investigating possible age-related changes in the compartments relaxation timeswas beyond the scope of this study for two main reasons: healthy infants cannot withstandlong acquisition protocols without sedation, and maturation is not homogeneous across brain
Fast fmy Quantification in Infants
PLOS ONE | DOI:10.1371/journal.pone.0163143 October 13, 2016 17 / 24

regions [43,51,52]. First, to be coherent with the issue raised previously, the estimation of T1c
and T2c at the calibration stage should be performed independently for regions with differentmaturational levels. This would require voxel-wise (and not slice-wise) fitting at the individuallevel, which is hardly achievable because of acquisition time. Estimating these magnetic proper-ties is not realistic at the group level either, i.e. using data from different infants: even at thesame age, inter-individual differences in brain development are observed, and it would be amajor challenge to register tissues with strictly similar microstructure and maturation. Second,even if calibration of maturation-specific T1c and T2c was realistic, it would not have muchsense at the testing stage. To fit the model within a single infant brain, different T1c and T2c
would be needed for different regions with different maturations. Such an approach wouldrequire the maturation level to be known a priori in each voxel, creating a vicious circle. Tosummarize, only a voxel-wise estimation of fmy, T1c and T2c would be entirely free from modelhypotheses, and considering exchange between compartments would be helpful. Neverthelessthese aspects might be hardly achievable in healthy infants. Despite possible limitations relatedto the assumption of T1c and T2c stability across brain regions and throughout development,our approach based on calibration and testing stages remains a reliable and realistic strategy insuch populations.
As detailed in S1 Supporting Information, we observed a strong correlation between theage-matched infant fmy maps that we obtained and those computed by another group [8,29].These latter studies used an alternative approach based on age-range optimized mcDESPOTprotocols and the voxel-wise 3-component fitting of relaxometry signals. Some differences infmy values were observed across these and our studies. They might rely either on the use ofadult T1c and T2c to fit our model equations in infants, or on the fact that mcDESPOT fmy esti-mates might represent not only the magnetization associated with the water pool trappedbetween the myelin sheaths, but also the magnetization transfer from non-aqueous myelin pro-tons [35]. Thus comparing our results with previous studies across all ages remains difficult[8]. Furthermore, the authors did not indicate whether T1c and T2c were stable across the lifespan. Some correlations between fmy values, T1 and T2 (computed at the voxel level) wereobserved in infants. As both relaxation times do not exclusively reflect white matter myelina-tion and as they change according to different maturational processes [5], their correlationswith fmy values are likely to be age-dependent [8].
Modeling 3 compartments to measure fmy. In our model, the number of model compart-ments was set to 3 because it has been shown to be adequate under a wide range of differentconditions, including in the developing white matter [9,19,29,53,54]. Although it is possible toquantify fmy based on 2 compartments, 3-compartment models are thought to be more reliable,especially in regions with partial volume [19]. Furthermore, consistently with a 3-compartmentmodel, T2 spectrum in both in vitro and in vivo experiments has shown three major peaks[22,39,55–57]. If necessary, our model could be easily extended with additional compartments,at the expense of increased model fitting complexity due to additional free-parameters. How-ever, theoretical considerations suggest that there is no scope for deriving more than 2 or 3components in healthy tissues [58].
The most reliable approach to estimate fmy without assumptions on the number of compart-ments and on their magnetic properties, might be to calculate T2 spectrum[10,11]. Howeverin this case reliable estimation would require acquisition of relaxometry signals for a largenumber of TEs (making acquisition time unacceptably long for infants), including very shortTEs that were not achievable with EPI sequences. Recent acquisition sequences with ultra-short TE (UTE) might be helpful in the future to sample the T2-weighted signal over a widerrange of TEs while keeping a short acquisition time. Simulations further suggested that in thepresence of noise, using a 3-compartment model with fixed T1c and T2c could significantly
Fast fmy Quantification in Infants
PLOS ONE | DOI:10.1371/journal.pone.0163143 October 13, 2016 18 / 24
improve accuracy and reproducibility in determining compartments fractions, as compared toT2 spectrum[22].
Potential applications under pathological conditions. Although 3-compartment modelshave been previously applied to investigate pathologies [19,24,53,54,59,60], such as multiplesclerosis [60], autism [53] and partial deletions of chromosome 18q [54], one should be carefulwhen trying to apply the suggested approach to diseases. Indeed it might require includingadditional compartments (e.g., microvascular, tumor, inflammatory cells, gliosis, etc.) toaccount for pathological tissues [33]. For example, in demyelinating diseases, gliotic tissue (tis-sue matrix that replaces myelin, being filledwith water, sparse cells and macromolecules)might be modeled as a separate compartment; if not, it would likely contribute to the intra-/extracellular compartment, which has the most similar properties to gliotic tissue among the 3compartments. Consequently, applying the suggested approach to pathological conditionswould require taking into account possible additional compartments specific to the pathology,and re-calibrating the compartment relaxation times in patients.
In conclusion, our fmy quantification strategy overcame existing difficulties (long acquisi-tion/post-processing times) that might limit its practical application in infants, children andclinical patients. Although reliable comparison with previous studies [7,8] was not achievable,our infant fmy maps were able to capture myelin-related changes across early development, sug-gesting that the proposed approach was relevant at least for evaluation of normal maturation.
Supporting Information
S1 Fig. TI and TE sampling in the adult datasets. a: For the 3 calibration datasets, 30 to 60 TIvalues, and 47 to 60 TE values (plotted on a log scale) were used to acquire T1 and T2 relaxo-metry signals. Different TI/TE ranges were sampled with different steps, and higher samplingof low TI and TE values was performed. See also S1 Table. b: The initial full dataset for subject#3 contained 60 TI and TE data points. Reduced datasets (plotted on a log scale) were obtainedby progressively reducing the number of data points in a regular manner from 60 down to 10points, i.e. by removing/keeping every nth point from the initial dataset so as to have the desir-able number of data points (e.g. we kept every 2nd sampling point to have a reduced dataset of30 points, every 12th point to have a reduced dataset of 5 points. . .). These reduced datasetswere used to investigate whether the number of TI and TE sampling points impacted the esti-mation of T1c and T2c.(TIF)
S2 Fig. Convergence of the voxel-wisemodel fitting algorithm. a: The length of the searchintervals for T1c and T2c (between the upper and lower boundaries) is illustrated as a functionof time (in % from the initial total length, blue curve) in a typical voxel within white matter.The convergence required around 3 repetitions of the fitting procedure: each repetition is indi-cated with brackets, containing 10000 random solutions and taking around 25s. At the end ofeach repetition (arrows), the search intervals were contracted by selecting the best 100 solutions(over 10000) of T1c and T2c samples. For the first 90% samples of the next repetition (over10000), T1c and T2c values were randomly chosen from the contracted intervals. Boosts at theend of the second and third repetitions (at around 50 and 75s) corresponded to the remaining10% samples when T1c and T2c values were randomly chosen from the initial non-contractedintervals to avoid falling into a local minimum. Note that after the first contraction, the searchintervals already met the stopping criteria (length less than 1% of the initial search intervals).For each sample of T1c and T2c, we also presented (red curve) the length of the intervals corre-sponding to the on-going best 100 solutions considering all previous T1c and T2c samples. Thislength quickly decreases to 0, explaining the dramatic interval contraction at the end of the
Fast fmy Quantification in Infants
PLOS ONE | DOI:10.1371/journal.pone.0163143 October 13, 2016 19 / 24
first repetition. Besides, it is not strictly monotonic because at each step a better solution mightappear outside the previous interval, particularly at the beginning of the fitting procedure. b:Residuals of the model fitting (Eq 1–4) are presented for the same voxel as in a. After the firstrepetition and interval contraction, most solutions were quite close to the acceptance level (fit-ting error less than 1%), which was met after two further small contractions. This graph sug-gests that relaxing the stopping criteria might be possible to decrease the computation timewithout losing much precision.Similar convergence was observed in voxels of grey matter and CSF (fitting not shown).(TIF)
S3 Fig. Comparison of fmy maps generated with different upper search fmy boundaries.Forthe 3 calibration subjects, fmy maps generated at the calibration stage for different fmy upperboundary of 0.3 (a), 0.4 (b) and 0.5 (c) show differences in fmy amplitudes: higher boundary ledto higher fmy values, although the estimated T1c and T2c were similar (S2 Table). In the rightcolumn, histograms show fmy distributions across all voxels of the 3 subjects. The percentagesof common histogram area across the 3 subjects (82%, 85%, 79% for fmy of 0.3, 0.4 and 0.5respectively) suggested that the upper boundary of 0.4 had the biggest overlap, and thus, thehighest reproducibility across subjects.(TIF)
S4 Fig. Impact of the number of calibration data points on the estimation of T1c and T2c.For subject #3, T1c and T2c values of the 3-compartment model (mean ± standard deviationover the 10 central slices) were calculated with the calibration strategy using various numbersN of TI and TE sampling points (S1 Fig). When this number was higher than 25, T1c and T2c
values did not significantly differ from those calculatedwith N = 60 (ad-hoc paired t-testbetween the values from individual slices, � indicates significant difference where p<0.05).(TIF)
S1 Table. TI and TE sampling in the adult calibration datasets. For each calibration subject,the sampling schemes of TI and TE points (values and numbers) are detailed, as well as thetotal acquisition time. For example, for Subject #1, three sets of TI values and three sets of TEvalues were used, covering different ranges with different steps in order to provide higher sam-pling of low TI and TE values. Note that schemes differed across subjects, and that sets mightpresent overlapping ranges but different sampling values (e.g. TI sets for subject #3). See alsoS1 Fig.(DOCX)
S2 Table. T1c and T2c calibrated for different fmy upper search boundary. Mean and stan-dard deviations are computed over the 10 slices of the 3 subjects after the calibration stage.Note that T1c and T2c values are roughly the same, while standard deviations tend to be thelowest for the 0.4 upper boundary.(DOCX)
S1 Supporting Information. Comparison of fmy maps obtained in infants with ourapproach and withmcDESPOT sequences.The infant fmy maps were voxel-wise correlatedwith the age-matched fmy maps computed by another group from data acquired using mcDE-SPOT sequences [25] (http://www.babyimaginglab.com/Research_files/meanMWFMaps.zip).For that, infants’ anatomical T2w images were co-registered using affine transformations tothe 3D Pediatric T1w templates corresponding to the age-matched fmy maps. The resultingtransformations were applied to both infants’ T2w images and fmy maps, and registeredimages were correlated voxel-wise with the age-matched fmy maps. Strong voxel-wise
Fast fmy Quantification in Infants
PLOS ONE | DOI:10.1371/journal.pone.0163143 October 13, 2016 20 / 24

correlations (R2> 0.77) were observed for our fmy maps, and they were significantly higher(p<0.001, ad-hoc paired t-test) than for infants’ anatomical T2w images (R2> 0.67). Thissuggested high similarity in fmy values, which could not be explained simply by similarity inunderlying anatomical structures.(DOCX)
Acknowledgments
The authors thank the UNIACT clinical team for precious help in scanning the infants, andespecially Gaëlle Mediouni. This work was supported by the ELA Foundation, the FyssenFoundation, the “Ecole des Neurosciences de Paris” and the “Fondation de France”.
Author Contributions
Conceptualization: JD LHP CP.
Data curation: JD CP.
Formal analysis: SK.
Funding acquisition: LHP JD.
Investigation: JD GDL.
Methodology:SK JD CP.
Project administration: LHP JD.
Resources:CP LHP JD GDL.
Software: SK CP.
Supervision: JD LHP CP.
Validation: SK JD CP LHP.
Visualization: SK JD LHP.
Writing – original draft: SK JD.
Writing – review& editing: SK JD LHP CP.
References1. Bird CR, Hedberg M, Drayer BP, Keller PJ, Flom RA, Hodak JA. MR assessment of myelination in
infants and children: usefulness of marker sites. AJNR 1989; 10(4):731–40. PMID: 2505502
2. Staudt M, Schropp C, Staudt F, Obletter N, Bise K, Breit A, et al. MRI assessment of myelination: an
age standardization. Pediatr Radiol. 1994; 24(2):122–7. doi: 10.1007/BF02020169 PMID: 8078713
3. Bosnell R, Giorgio A, Johansen-Berg H. Imaging white matter diffusion changes with development and
recovery from brain injury. Dev Neurorehabilitation. 2008; 11(3):174–86. doi: 10.1080/
17518420802289065 PMID: 18781502
4. Beaulieu C. The basis of anisotropic water diffusion in the nervous system—a technical review. NMR
Biomed. 2002; 15(7–8):435–55. doi: 10.1002/nbm.782 PMID: 12489094
5. Dubois J, Dehaene-Lambertz G, Kulikova S, Poupon C, Huppi P, Hertz-Pannier L. The early develop-
ment of brain white matter: a review of imaging studies in fetuses, newborns and infants. Neurosci-
ence. 2014; 276: 48–71, doi: 10.1016/j.neuroscience.2013.12.044 PMID: 24378955
6. Laule C, Kozlowski P, Leung E, Li DKB, MacKay AL, Moore GRW. Myelin water imaging of multiple
sclerosis at 7 T: Correlations with histopathology. NeuroImage. 2008; 40(4):1575–80. doi: 10.1016/j.
neuroimage.2007.12.008 PMID: 18321730
Fast fmy Quantification in Infants
PLOS ONE | DOI:10.1371/journal.pone.0163143 October 13, 2016 21 / 24
7. Deoni SCL, Mercure E, Blasi A, Gasston D, Thomson A, Johnson M, et al. Mapping Infant Brain Myeli-
nation with Magnetic Resonance Imaging. J Neurosci. 2011; 31(2):784–91. doi: 10.1523/
JNEUROSCI.2106-10.2011 PMID: 21228187
8. Deoni SCL, Dean DC, O’Muircheartaigh J, Dirks H, Jerskey BA. Investigating white matter develop-
ment in infancy and early childhood using myelin water faction and relaxation time mapping. Neuro-
Image. 2012; 63(3):1038–53. doi: 10.1016/j.neuroimage.2012.07.037 PMID: 22884937
9. Lancaster JL, Andrews T, Hardies LJ, Dodd S, Fox PT. Three-pool model of white matter. J Magn
Reson Imaging. 2003; 17(1):1–10. doi: 10.1002/jmri.10230 PMID: 12500269
10. MacKay A, Whittall K, Adler J, Li D, Paty D, Graeb D. In vivo visualization of myelin water in brain by
magnetic resonance. Magn Reson Med. 1994; 31(6):673–7. doi: 10.1002/mrm.1910310614 PMID:
8057820
11. Whittall KP, MacKay AL, Graeb DA, Nugent RA, Li DK, Paty DW. In vivo measurement of T2 distribu-
tions and water contents in normal human brain. Magn Reson Med. 1997; 37(1):34–43. doi: 10.1002/
mrm.1910370107 PMID: 8978630
12. Kolind SH, Madler B, Fischer S, Li DKB, MacKay AL. Myelin water imaging: Implementation and devel-
opment at 3.0T and comparison to 1.5T measurements. Magn Reson Med. 2009; 62(1):106–15. doi:
10.1002/mrm.21966 PMID: 19353659
13. Laule C, Vavasour IM, Moore GRW, Oger J, Li DKB, Paty DW, et al. Water content and myelin water
fraction in multiple sclerosis. J Neurol. 2004 1; 251(3):284–93. doi: 10.1007/s00415-004-0306-6
PMID: 15015007
14. Levesque IR, Chia CLL, Pike GB. Reproducibility of in vivo magnetic resonance imaging-based mea-
surement of myelin water. J Magn Reson Imaging. 2010 23; 32(1):60–8. doi: 10.1002/jmri.22170
PMID: 20578011
15. Oh J, Han ET, Pelletier D, Nelson SJ. Measurement of in vivo multi-component T2 relaxation times for
brain tissue using multi-slice T2 prep at 1.5 and 3 T. Magn Reson Imaging. 2006; 24(1):33–43. doi: 10.
1016/j.mri.2005.10.016 PMID: 16410176
16. Madler B, Drabycz SA, Kolind SH, Whittall KP, MacKay AL. Is diffusion anisotropy an accurate monitor
of myelination? Magn Reson Imaging. 2008; 26(7):874–88. doi: 10.1016/j.mri.2008.01.047 PMID:
18524521
17. Hwang D, Du YP. Improved myelin water quantification using spatially regularized non-negative least
squares algorithm. J Magn Reson Imaging. 2009; 30(1):203–8. doi: 10.1002/jmri.21783 PMID:
19557738
18. Labadie C, Lee J-H, Rooney WD, Jarchow S, Aubert-Frecon M, Springer CS, et al. Myelin water map-
ping by spatially regularized longitudinal relaxographic imaging at high magnetic fields. Magn Reson
Med. 2013; 71(1):375–387. doi: 10.1002/mrm.24670 PMID: 23468414
19. Deoni SCL, Matthews L, Kolind SH. One component? Two components? Three? The effect of includ-
ing a nonexchanging “free” water component in multicomponent driven equilibrium single pulse obser-
vation of T1 and T2. Magn Reson Med. 2013; 70(1):147–54. doi: 10.1002/mrm.24429 PMID:
22915316
20. Deoni SCL, Rutt BK, Arun T, Pierpaoli C, Jones DK. Gleaning multicomponent T 1 and T 2 information
from steady-state imaging data. Magn Reson Med. 2008; 60(6):1372–87. doi: 10.1002/mrm.21704
PMID: 19025904
21. Deoni SCL. Correction of Main and Transmit Magnetic Field (B0 and B1) Inhomogeneity Effects in Mul-
ticomponent-Driven Equilibrium Single-Pulse Observation of T1 and T2. Magn Reson Med. 2011; 65
(4):1021–35. doi: 10.1002/mrm.22685 PMID: 21413066
22. Andrews T, Lancaster JL, Dodd SJ, Contreras-Sesvold C, Fox PT. Testing the three-pool white matter
model adapted for use with T2 relaxometry. Magn Reson Med. 2005; 54(2):449–54. doi: 10.1002/
mrm.20599 PMID: 16032666
23. Hwang D, Kim D-H, Du YP. In vivo multi-slice mapping of myelin water content using T2* decay. Neu-
roImage. 2010; 52(1):198–204. doi: 10.1016/j.neuroimage.2010.04.023 PMID: 20398770
24. Kwon OI, Woo EJ, Du YP, Hwang D. A tissue-relaxation-dependent neighboring method for robust
mapping of the myelin water fraction. NeuroImage. 2013; 74:12–21. doi: 10.1016/j.neuroimage.2013.
01.064 PMID: 23384527
25. Akhondi-Asl A, Afacan O, Mulkern RV, Warfield SK. T2-Relaxometry for Myelin Water Fraction Extrac-
tion Using Wald Distribution and Extended Phase Graph. Med Image Comput Comput-Assist Interv.
2014; 17(0 3):145–52. PMID: 25320793
26. Stikov N, Perry LM, Mezer A, Rykhlevskaia E, Wandell BA, Pauly JM, et al. Bound pool fractions com-
plement diffusion measures to describe white matter micro and macrostructure. NeuroImage. 2011;
54(2):1112–21. doi: 10.1016/j.neuroimage.2010.08.068 PMID: 20828622
Fast fmy Quantification in Infants
PLOS ONE | DOI:10.1371/journal.pone.0163143 October 13, 2016 22 / 24

27. Warntjes J, West J, Dahlqvist-Leinhard O, Helms G, Landtblom A-M, Lundberg P. Using multi-
parametric quantitative MRI to model myelin in the brain. In: Proc Intl Soc Mag Reson Med. 2011. p.
536.
28. Lawson CL, Hanson RJ. Solving Least Squares Problems. Philadelphia, Pa.: Society for Industrial
and Applied Mathematics; 1987. 350 p. doi: 10.1137/1.9781611971217
29. Dean DC 3rd, O’Muircheartaigh J, Dirks H, Waskiewicz N, Lehman K, Walker L, et al. Modeling healthy
male white matter and myelin development: 3 through 60 months of age. NeuroImage. 2014; 84:742–
52. doi: 10.1016/j.neuroimage.2013.09.058 PMID: 24095814
30. Duclap Schmitt, Lebois Riff, Guevara Marrakchi-Kacem, et al. Connectomist-2.0: a novel diffusion
analysis toolbox for BrainVISA. European Society for Magnetic Resonance in Medicine and Biology.
Lisbon, Portugal: Springer; 2012.
31. Poupon C, Dubois J, Marrakchi L, Brion V, Mangin J-F, Poupon F. Real-time EPI T1, T2 and T2* map-
ping at 3T. Proc 18th Annu ISMRM Meet. 2010.
32. Berger MF, Silverman HF. Microphone array optimization by stochastic region contraction. IEEE Trans
Signal Process. 1991; 39(11):2377–86. doi: 10.1109/78.97993
33. Guo J, Ji Q, Reddick WE. Multi-slice myelin water imaging for practical clinical applications at 3.0 T.
Magn Reson Med 70(3):813–822. doi: 10.1002/mrm.24527 PMID: 23132434
34. MacKay A, Laule C, Vavasour I, Bjarnason T, Kolind S, Madler B. Insights into brain microstructure
from the T2 distribution. Magn Reson Imaging. 2006; 24(4):515–25. doi: 10.1016/j.mri.2005.12.037
PMID: 16677958
35. Zhang J, Kolind SH, Laule C, Mackay AL. Comparison of myelin water fraction from multiecho T2
decay curve and steady-state methods. Magn Reson Med 2014; 73 (1):223–232. doi: 10.1002/mrm.
25125 PMID: 24515972
36. Smith SW. The scientist and engineer’s guide to digital signal processing. 1st ed. San Diego, Calif:
California Technical Pub; 1997. 626 p.
37. Gagunashvili ND. Comparison of weighted and unweighted histograms. arXiv:physics/0605123. 2006;
http://arxiv.org/abs/physics/0605123.
38. Dubois J, Kulikova S, Hertz-Pannier L, Mangin J-F, Dehaene-Lambertz G, Poupon C. Correction strat-
egy for diffusion-weighted images corrupted with motion: Application to the DTI evaluation of infants’
white matter. Magn Reson Imaging 2014; 32(8):981–992. doi: 10.1016/j.mri.2014.05.007 PMID:
24960369
39. Descoteaux M, Angelino E, Fitzgibbons S, Deriche R. Regularized, fast, and robust analytical Q-ball
imaging. Magn Reson Med. 2007; 58(3):497–510. doi: 10.1002/mrm.21277 PMID: 17763358
40. Perrin M, Poupon C, Cointepas Y, Rieul B, Golestani N, Pallier C, et al. Fiber tracking in q-ball fields
using regularized particle trajectories. Inf Process Med Imaging 2005; 19:52–63. doi: 10.1007/
11505730_5 PMID: 17354684
41. Kulikova S, Hertz-Pannier L, Dehaene-Lambertz G, Buzmakov A, Poupon C, Dubois J. Multi-paramet-
ric evaluation of the white matter maturation. Brain Struct Funct. 2015; 220(6): 3657–72. doi: 10.1007/
s00429-014-0881-y PMID: 25183543
42. Dubois J, Dehaene-Lambertz G, Perrin M, Mangin J-F, Cointepas Y, Duchesnay E, et al. Asynchrony
of the early maturation of white matter bundles in healthy infants: quantitative landmarks revealed non-
invasively by diffusion tensor imaging. Hum Brain Mapp. 2008; 29(1):14–27. doi: 10.1002/hbm.20363
PMID: 17318834
43. Flechsig P. Anatomie des menschlichen Gehirns und Ruckenmarks auf myelogenetischer Grundlage.
Leipzig: G. Thieme; 1920. 121 p.
44. Does MD, Gore JC. Compartmental study of T(1) and T(2) in rat brain and trigeminal nerve in vivo.
Magn Reson Med. 2002; 47(2):274–83. doi: 10.1002/mrm.10060 PMID: 11810670
45. De Santis S, Drakesmith M, Bells S, Assaf Y, Jones DK. Why diffusion tensor MRI does well only some
of the time: variance and covariance of white matter tissue microstructure attributes in the living human
brain. NeuroImage. 2014; 89:35–44. doi: 10.1016/j.neuroimage.2013.12.003 PMID: 24342225
46. Alonso-Ortiz E, Levesque IR, Pike GB. MRI-based myelin water imaging: A technical review. Magn
Reson Med. 2015; 73(1):70–81. doi: 10.1002/mrm.25198 PMID: 24604728
47. Bernstein MA, King KF, Zhou XJ. Handbook of MRI Pulse Sequences. Elsevier; 2004. p 1042. doi: 10.
1118/1.1904597
48. Melbourne A, Eaton-Rosen Z, Orasanu E, Price D, Bainbridge A, Cardoso MJ, et al. Longitudinal
development in the preterm thalamus and posterior white matter: MRI correlations between diffusion
weighted imaging and T2 relaxometry. Hum Brain Mapp. 2016. doi: 10.1002/hbm.23188 PMID:
26996400
Fast fmy Quantification in Infants
PLOS ONE | DOI:10.1371/journal.pone.0163143 October 13, 2016 23 / 24
49. Kunz N, Zhang H, Vasung L, O’Brien KR, Assaf Y, Lazeyras F, et al. Assessing white matter micro-
structure of the newborn with multi-shell diffusion MRI and biophysical compartment models. Neuro-
Image. 2014; 96:288–99. doi: 10.1016/j.neuroimage.2014.03.057 PMID: 24680870
50. Poduslo SE, Jang Y. Myelin development in infant brain. Neurochem Res. 1984; 9(11):1615–1626.
doi: 10.1007/BF00964595 PMID: 6521822
51. Kinney HC, Brody BA, Kloman AS, Gilles FH. Sequence of central nervous system myelination in
human infancy. II. Patterns of myelination in autopsied infants. Journal of neuropathology and experi-
mental neurology.1988; 47 (3): 217–234. doi: 10.1097/00005072-198805000-00003 PMID: 3367155
52. Yakovlev PI. Morphological criteria of growth and maturation of the nervous system in man. Research
Publications—Association for Research in Nervous and Mental Disease. 1962; 39: 3–46. PMID:
14008721
53. Deoni SCL, Zinkstok JR, Daly E, Ecker C, MRC AIMS Consortium, Williams SCR, et al. White-matter
relaxation time and myelin water fraction differences in young adults with autism. Psychol Med. 2015;
45(4):795–805. doi: 10.1017/S0033291714001858 PMID: 25111948
54. Lancaster JL, Cody JD, Andrews T, Hardies LJ, Hale DE, Fox PT. Myelination in children with partial
deletions of chromosome 18q. AJNR. 2005; 26(3):447–54. PMID: 15760848
55. Wachowicz K, Snyder R. A look at the transverse relaxation spectra of mammalian optic nerve at 3.0 T
and 11.7 T. in Proc 10th Annu ISMRM Meet. (2002).
56. Vavasour IM. Magnetic resonance of human and bovine brain. 1998 Dissertation, Univ. of British
Columbia.
57. Menon RS, Allen PS. Application of continuous relaxation time distributions to the fitting of data from
model systmes and excised tissue. Magn Reson Med. 1991; 20(2):214–27. doi: 10.1002/mrm.
1910200205 PMID: 1775048
58. Bertero M, Boccacci P, Pike ER. On the Recovery and Resolution of Exponential Relaxation Rates
from Experimental Data: A Singular-Value Analysis of the Laplace Transform Inversion in the Pres-
ence of Noise. Proc R Soc Lond 1982; 383(1784): 15–29. doi: 10.1098/rspa.1982.0117
59. Du YP, Chu R, Hwang D, Brown MS, Kleinschmidt-DeMasters BK, Singel D, et al. Fast multislice map-
ping of the myelin water fraction using multicompartment analysis ofT2* decay at 3T: A preliminary
postmortem study. Magn Reson Med. 2007; 58(5):865–70. doi: 10.1002/mrm.21409 PMID: 17969125
60. Raj A, Pandya S, Shen X, LoCastro E, Nguyen TD, Gauthier SA. Multi-Compartment T2 Relaxometry
Using a Spatially Constrained Multi-Gaussian Model. PLoS ONE. 2014; 9(6):e98391. doi: 10.1371/
journal.pone.0098391 PMID: 24896833
Fast fmy Quantification in Infants
PLOS ONE | DOI:10.1371/journal.pone.0163143 October 13, 2016 24 / 24