a new settlement for health and social care - king's fund · a new settlement for health and...
TRANSCRIPT

A new settlement for health and social careInterim report Chair: Kate Barker

This is the interim report of the independent Commission on the Future of Health and Social Care in England.
Commissioners
Chair: Kate Barker CBE, a business economist who is a former member of the Bank of England’s Monetary Policy Committee and now holds a number of non-executive posts
Geoff Alltimes CBE, chair of the Local Government Association’s multi-agency task group on health transition and previously Chief Executive of Hammersmith and Fulham Council and NHS Hammersmith and Fulham
Lord Bichard, cross-bench peer and Chair of the Social Care Institute for Excellence
Baroness Sally Greengross, cross-bench peer and Chief Executive of the International Longevity Centre UK
Julian Le Grand, Richard Titmuss Professor of Social Policy at the London School of Economics
International Adviser
Mark Pearson, Deputy Director, Employment Labour and Social Affairs, Organisation for Economic Co-operation and Development (OECD)
The King’s Fund Support Team
With grateful thanks to the following, who have provided invaluable support to the commissioners:
Nicholas Timmins – Rapporteur
Richard Humphries – Senior Lead
Clare Bawden – Project Manager
John Appleby – Economic Adviser
Becky Seale – Experts by Experience Group Co-ordinator
Experts by Experience Group
Eleni ChambersClenton FarquharsonBrian GumbleyHeather Hughes Becky HuxtableClaire JonesJohn LishSally-Ann MarcianoDominic Stenningand one other member who would prefer to remain anonymous
The views expressed in this report are those of the independent commission and do not necessarily represent the views of The King’s Fund.

A new settlement for health and social careInterim report Chair
Kate Barker
Commission on the Future of Health and Social Care in England

Published by
The King’s Fund
11–13 Cavendish Square
London W1G 0AN
Tel: 020 7307 2591
Fax: 020 7307 2801
www.kingsfund.org.uk
© The King’s Fund 2014
First published 2014 by The King’s Fund
Charity registration number: 1126980
All rights reserved, including the right of reproduction in whole or in part in any form
ISBN: 978 1 909029 28 6
A catalogue record for this publication is available from the British Library
Available from:
The King’s Fund
11–13 Cavendish Square
London W1G 0AN
Tel: 020 7307 2591
Fax: 020 7307 2801
Email: [email protected]
www.kingsfund.org.uk/publications
Edited by Anna Brown
Typeset by Grasshopper Design Company
Printed in the UK by The King’s Fund
The King’s Fund is an independent charity working to improve health and health care in England. We help to shape policy and practice through research and analysis; develop individuals, teams and organisations; promote understanding of the health and social care system; and bring people together to learn, share knowledge and debate. Our vision is that the best possible care is available to all.

Contents
© The King’s Fund 2014
List of figures vi
Frontispiece vii
Foreword viii
Preface ix
Introduction: A system no longer fit for purpose 1
1 Where we are and how we got here 7
Public debate clouded by poor understanding 8
Defying notions of equity 8
Sixty-six years on: 2014 is not 1948 9
Improved integration is now essential 12
Commissioning care is more fragmented 13
How did we reach the health and social care divide? 13
How have NHS sources of finance altered over the years? 14
The shifting boundary between the NHS and social care 16
Entitlements and boundaries have shifted markedly 20
The role of carers in the two systems 20
England and the United Kingdom’s place internationally 21
2 Living with an ageing society 22
Are we living longer, fitter lives, or longer, sicker ones? 22
The health costs of old age 23
What has been driving health care costs? 24
Ageing is already well under way 25
Will there be too few workers to pay for care? 26
All pensioners are no longer poor pensioners 28

3 Is health and social care affordable? 30
Health as a ‘luxury good’ 30
An ever-higher share of GDP? 32
Multiple upward spending pressures 34
The implications for government spending 36
Deficit reduction and spending cuts 37
4 Hard choices and options 39
Meeting the costs – options for change 42
Call for responses 54
Appendix A – The terms of reference for and work of the commission 55
Appendix B – Data 58
Appendix C – The international context: How much greener is the grass elsewhere? 60
References 67
Further reading 74
vi © The King’s Fund 2014
A new settlement for health and social care

vii© The King’s Fund 2014
Figure 1 Number of people with long-term conditions, projected rise 10
Figure 2 Number of finished consultant episodes (FCEs) by age 11
Figure 3 Number of residential care and nursing home places by sector, all ages 17
Figure 4 Trends in local authority, independent and NHS care provision, number of places 1980–2012 17
Figure 5 Number of people receiving publicly funded care, 2005/6–2012/13 18
Figure 6 Number of older people receiving different types of care, 2005/6–2012/13 19
Figure 7 NHS expenditure per head in England, by age group, 2012 23
Figure 8 Total health care spend as a percentage of GDP 1960–2010 (OECD countries) 24
Figure 9 Drivers of increased spending 25
Figure 10 Proportion of the UK population aged 65 and over, since 1901 26
Figure 11 Growth in number of older people in England by age, 2010–30 26
Figure 12 Old age dependency ratios 28
Figure 13 Income distribution 1979–2011, percentage 29
Figure 14 Total health care spending per capita against GDP per capita 2010 31
Figure 15 Total health care spending as a percentage of GDP 2010 31
Figure 16 Public’s priorities for extra government spending, where health is first and second priority 32
Figure 17 EU6 expenditure on health, 1970 to 2010 33
Figure 18 Future UK health and social care spending as share of GDP, 2012 and 2062 34
Figure 19 Current spending as a percentage of GDP (2012) and OBR long-term projected government spending to 2062 (NHS, long-term care, pensions; highest projections) 35
Figure 20 OBR long-term projected government spending to 2062 (NHS, long-term care, pensions; lowest projections) 35
Figure 21 OBR long-term government spending projections to 2062 as percentage of total government spending (NHS, long-term care and pensions; lowest projection) 36
Figure 22 OBR long-term government spending projections to 2062 as percentage of total government spending (NHS, long-term care and pensions; highest projection) 37
Figure 23 Projected resource against projected spending requirements to 2021 38
List of figures

viii © The King’s Fund 2014
‘It lifted the shadow of fear from the homes of millions.’Aneurin Bevan on the foundation of the NHS
Frontispiece
‘I have a social work qualification. I know how the health and social care system is supposed to work, but I was powerless to influence mam’s care at a distance. Nothing was joined up.’
Marie, social care planning manager
‘I am appalled by the whole system.’Becky, on navigating the funding boundary
between health and social care
for her 77-year-old father, 2012
‘The greatest gift a nation ever gave itself.’Lord [Peter] Hennessy, modern historian on the NHS

ix© The King’s Fund 2014
Background to the commission and the role of The King’s FundThe decision by The King’s Fund to establish the Commission on the Future of Health and Social Care in England arose from our Time to Think Differently programme which invited discussion and ideas about the kind of health and care services we will need in the future. This highlighted the fundamental differences in the way in which health and social care services have been delivered and paid for since 1948 and the fact that this has not kept pace with 65 years of social, technological and demographic change, including some major shifts in the burden of disease.
Various reviews of both the management and funding of health and social care have been undertaken over the years. The Care Bill currently before parliament will modernise the legal framework for social care and implement the Dilnot commission’s recommendation to cap the costs of social care to individuals. The Labour party is currently consulting on proposals to bring together the commissioning of health and social care. But none of these reviews or reforms has gone back to first principles to fundamentally re-examine the post-war settlement and to raise significant questions, for example, about entitlements, the balance of responsibilities between the individual and the state and the compatibility of universal and means-tested funding systems.
The King’s Fund concluded it was time to face these questions and invited Kate Barker to chair an independent commission to consider whether there are better ways of determining people’s entitlement to health, care and support and how these could be funded. The King’s Fund believes these are major issues that should be debated openly and hope that the commission’s work will influence policy thinking ahead of the next General Election and beyond. We asked the commission to produce an interim report in early 2014 and a final report by September 2014.
The King’s Fund is meeting the costs of the commission and has agreed its terms of reference and appointed its members; however, the terms of reference allow the commission to approach the task as it sees fit and to consider all options, on the basis of ‘nothing ruled in, nothing ruled out’. Our view is that doing nothing is not an option and, although both are a step in the right direction, neither the Dilnot commission’s proposals nor the Better Care Fund offer a sustainable basis for funding health and care in future.
We welcome the publication of the commission’s interim report and encourage you to respond to the conclusions it has reached and the questions on which it invites further comment. The report sets out a compelling case for change and identifies the hard choices that need to be faced. We hope that politicians of all parties will not duck these choices and recognise that a new settlement is long overdue. The King’s Fund will work with the commission in the coming weeks to engage with stakeholders to explore what this might mean and to raise awareness of an issue that touches all of our lives at some point.
Chris HamChief ExecutiveThe King’s Fund
Foreword

x © The King’s Fund 2014
The NHS faces a short-term funding crisis. At the same time, social care, arguably underfunded for many years, is set to come under increasing strain – publicly funded social care is available only for those with relatively high needs. The border between the two is widely recognised to be very imperfect, leading to confusion and frustration for patients and their carers, and wasting resources on administration. Life expectancy, family structures, medical treatments and technologies are all quite different from when Beveridge and Bevan devised the 1948 settlement for health and social care. It is time to think afresh – and establish a new settlement fit for today’s circumstances.
In this interim report, we set out (on p 43) the key criteria that we propose to use to assess the options which would move England towards this new settlement. Broadly, they consider transparency, equity, efficiency, the split between collective and individual responsibility and affordability. The evidence discussed here suggests that the present settlement fails on all of these criteria.
The stories that we have included, and many others we have heard, reveal just how much distress is created by the present system, and leads us to describe the health and social care systems as rubbing up against each other like bones in an open fracture. This will remain true even after the proposed reforms, following Sir Andrew Dilnot’s report on the funding of social care, are implemented in 2017. Sadly, the current lack of funding for social care is little understood by the public, and so is often an added source of stress when people are already in need. Greater transparency is badly needed.
The contrast between a health service free at the point of use, and a social care service that is means tested, and publicly funded only for those with heavy needs results in a lottery – the type of ailment you have will determine the financial support you get to cope with its effects. The outcome of this lottery is that there is no equity – similar needs do not receive equal treatment.
Efficiency is acutely hampered by a lack of integration in organisation – health is run by the NHS and social care by local authorities, with the two commissioned separately. This exacerbates the existing problems with different parts of the health service separately commissioned. The financial as well as the human price of this failing is illustrated by the 3,000 beds a day occupied by people who were fit to leave but stuck in hospital in January 2014 while funding or assessment was resolved.
We believe that England must move towards a single ring-fenced budget for health and social care, which is singly commissioned and within which entitlements are much more closely aligned. This would go a long way towards helping those presently struggling to weave their way through bureaucracy to understand and obtain their entitlements, and towards providing a level of social care support that meets the expectations of our society.
This vision can’t be achieved in one step. Our focus is on entitlement and funding. We do not believe that integration on its own would be sufficient – it would simply be another ‘make do and mend’ of two fundamentally different systems. Further, with social care
Preface

already underfunded and the NHS itself seemingly heading for financial crisis in the short term, the issue of funding must be addressed sooner rather than later.
In setting out the case for change, our report begins by describing the failure of the present settlement to respond to the rising number of people with multiple conditions and in need of social care, young as well as old. Patterns of ill health have changed so that there has been a rise in the numbers with some conditions such as dementia, and new technologies increasingly blur the line between health and social care.
While there is a tendency to think of the NHS as unchanged, there have been a number of shifts in the boundary between public and private funding in the post-war period. In general, these have restricted free access to social care and increased private payment for health care. The outcome is a position in which social care now depends very heavily on unpaid carers. England funds health care from the public purse to a similar extent as other countries with our level of income. But spending on social care seems to fall short on this measure.
One response is to argue that the health costs of a rising number of older people are simply unaffordable. But we should not throw up our hands in the face of this issue, as in fact it is largely advances in medical knowledge and technology that have raised costs in the health service. Ageing is less significant, with health care costs still concentrated in the last 18 months or so of life. And while there is a worry about old age dependency – too many old people compared to workers – in fact the proposed rises in pension age and greater participation of older people in work are changing this ratio in a favourable direction. Living longer is by and large good news.
However, it is true that health costs are likely to rise, and also true that as income levels rise, people tend to choose to spend more on health care. Recent estimates from the Office for Budget Responsibility suggest that in 2062/63 health, social care and pensions could together absorb almost 50 per cent of public spending and almost 20 per cent of GDP even on the basis of current entitlements. As the economy grows, we can spend more on health and still be able to spend more on other goods – but these projections suggest that to go further by improving public funding for social care will require hard choices.
In our view, the weight of evidence makes it clear that the present settlement lacks transparency, is inefficient, puts too much weight on individual rather than collective responsibility, and raises a significant moral concern about the lack of equity of treatment for similar levels of need. But effective change will require more than better integration and improved productivity. With financial strains already apparent, if we are to aim high at fairer entitlements and social care fit for the 21st century we have to tackle the issue of affordability.
The responses to our call for evidence suggested various candidates for better entitlements – for example, granting public funding for what is presently social care related to conditions such as dementia or Parkinson’s. A strong case can also be made for public funding for end-of-life care. We have not proposed any specific approach in this interim review and would be pleased to receive any further thoughts on how this should be approached.
But to do any of this means we have to look these hard choices squarely in the eye. To move in the directions we argue for will require some combination of higher taxation, charges for health care, or cuts in other areas of public spending. The final chapter of this report discusses a range of possible options. In most cases the commission has formed no settled view and so these options are put forward for debate. We are clear that increased health charges would be acceptable only if they were to fund demonstrable improvements in the overall funding available for health and social care. And tentatively we suggest that
xi
Preface
© The King’s Fund 2014

at least some of the funding should come from a pensioner population that on average is better off than its preceding cohorts.
However, we have decided that we would rule out tax relief on private medical insurance on equity and efficiency grounds. We are also minded not to support a wholesale switch to classic social insurance as this would be a disruptive change that international experience suggests is unlikely to yield significant benefits.
Between now and the final review in the autumn, we would very much welcome responses to the following series of questions:
1. Do you agree with our conclusion that a new settlement in health and social care is needed?
2. If so, do you support our proposition for a single, ring-fenced budget for health and social care which is singly commissioned, and within which entitlements to health and social care are more closely aligned?
3. Should the aim be to achieve more equal support for equal need, regardless of whether that support is currently considered as health or social care?
4. If your answer is yes to question three, should social care be more closely aligned with health care (that is, making more social care free at the point of use)? Or should health be aligned more closely with social care (that is reducing the extent to which health care is free at the point of use)?
5. Do you think that adequate funding for health and social care requires:i) Increased charges in the NHS? If so, for what?ii) Increased charges for social care? If so, for what?iii) Cuts to funds from other areas of public spending, re-allocating it to health and
social care? If so, from what? iv) An increase in taxation? If so, which taxes would you favour increasing?v) None of the above? If you answer yes to this, is it because you think that funding
for health and social care is adequate, and that extra demands can be met by using existing resources more efficiently? Or is it for some other reason?
vi) All of the above? If you answer yes to this, and think that elements of all or some of these changes may be needed, which mix would you favour, and to what degree?
These are large questions. But a failure to tackle them in a radical manner would be a failure to support many of those most in need.
Kate BarkerChairCommission on the Future of Health and Social Care in England
xii © The King’s Fund 2014
A new settlement for health and social care

1© The King’s Fund 2014
Clifford’s story, told by his daughter BeckyThis account and the others that follow are real, but some of the names have been changed.
Clifford is 77, very physically fit but has no cognitive understanding. He can be very difficult. After a very distressing emergency admission on to a mental health assessment unit, it was decided that he couldn’t go back home with Mum. Dad was assessed for continuing health care [CHC] funding – full funding by the NHS. This was declined.
His needs are complex and there were no care homes in my parents’ area which could meet all of Dad’s assessed needs for the amount that the local authority was willing to pay. The only home that agreed to take him was 22 miles away from Mum. In order to get there, my 73-year-old mother would have had to spend 2 hours on a bus, each way, changing 3 times on each journey. By attempting to place Dad further and further away from family and friends simply due to cost, his assessed need for family contact was not being met. I made a formal complaint to the county council’s head of consumer relations, and also to the head of legal services. Dad was reassessed for CHC and was granted it. We were obviously pleased with this result… but we couldn’t understand why, only six weeks earlier, he didn’t even meet the basic criteria.
Dad was subsequently placed in a home 4 miles away from where he has lived for 50 years, and where family and friends can visit him easily; he is visited around 4 to 5 times a week. I know that if I hadn’t fought this, Dad would now be in a home 22 miles away from family and friends, with perhaps visits once a week.
I could see the same situation happening to others on Dad’s ward, and I am appalled by the whole system and the way in which Dad was let down by his care co-ordination team.
Ray’s story, told by his daughter Sally-AnnMy father, Ray, who suffered from dementia, was admitted to hospital with pneumonia 11 weeks before he died. He was already known to social services with a care package in place, so we thought the process for discharging him would be pretty straightforward – how wrong we were!
He could not be left unsupervised as he was unable to do anything for himself. He was at risk of malnutrition, dehydration and pressure sores and prone to recurrent infections. None of this seemed to be defined as a health need, and it took five weeks to reach a decision about whether he was entitled to continuing health care as health and social care fought over who should pay. Where was the person in all of this?
It was decided that he didn’t qualify. But then began our next battle. Dad’s care package had to be arranged through the hospital’s social services team which meant that he could no longer have the care agency he had been using for the previous two years – which had given him the same carer every morning for five days a week. She had become like part of the family. The carer becomes part of your life – the first person
Introduction: A system no longer fit for purpose

you see after a sleepless night and the one who is always there for you day in and day out. For my mum, this was a huge blow. They were taking away the only familiarity and support they both so needed at this time. Mum felt like a stake had been driven through her heart. Her beloved Ray was dying and her carers were being taken away too. Bear in mind that the monthly bill for my dad’s care was running into four figures.
The community nursing team even tried one last attempt at getting continuing health care funding for Dad and even 24 hours before he died they turned him down. A visit once a day to change the pump, and a night sitter for his last three nights was the health-funded contribution. What I now ask is: why should anyone at the end of their life have to pay for their own care to die at home?
Marie, social care planning manager: her storyMy mother died of cancer last year, and for four years I was her long-distance carer, seven hours’ drive away.
Mam was classic ‘frail elderly’ – with heart disease, incontinent, and with other chronic conditions, experiencing repeat urinary tract infections, and constipation, leading to episodes of severe delirium which could come on over weeks and take sometimes months to lift completely.
Mam was admitted as an emergency 9 times over a period of 18 months – spending about 5 months in total as an inpatient. In between these episodes she was self-caring and fiercely independent. My life became one of emergency seven-hour dashes up the motorway and endless communication with social workers, primary and secondary care and her network of elderly friends.
The care she received in the teaching hospital to which she was so frequently admitted ranged from excellent to sometimes abusive. At times one GP visited her every day for a week to try to keep her out of hospital. But on virtually every admission it was assumed Mam had dementia. No one episode was ever linked to another. I had to write out sheets of paper saying, ‘X is self-caring when well. She has delirium, NOT dementia. This has happened before’. Often I was not believed.
The stress of being admitted to hospital would intensify Mam’s delirium to the point of needing full sedation with antipsychotics. I begged and pleaded for the PCT [primary care trust] to put in place care to keep her at home when she began to show symptoms – but was told there was nothing available and that a hospital admission was appropriate. But she had to get to the point of hallucinating for that.
I tried to argue that the financial cost of all these admissions, compared to putting flexible care around her at home for short periods, was wasting resources. This had no effect. After the ninth admission I insisted on a continuing health care assessment as a way to try to achieve this. But the PCT’s delaying tactics and outright lies made me abandon this, and I put my energies into getting her moved closer to me. I moved her into an extra-care housing scheme near to me, and she had no more admissions until the day of her death, with a happy and active 19 months of life before being diagnosed with metastasising cancer a week before she died.
I have a social work qualification. I know how the health and social care system is supposed to work, but I was powerless to influence Mam’s care at a distance. Nothing was joined up, with each part of the system only interested in their part of the problem. Primary, secondary and social care all worked separately, with the former two needing as much attention on integration as the latter.
2 © The King’s Fund 2014
A new settlement for health and social care

These are just three, heavily truncated accounts of what it is like to grapple with the separate, though theoretically conjoined, health and social care systems in England in the second decade of the 21st century. They highlight versions of the problems that the commission has heard time and again – in written evidence, in engagement events, and from our group of ‘experts by experience’, some of whom told us these stories. These problems affect not just older members of society but younger ones who have physical disabilities or behavioural and mental health conditions, along with those who care for families and friends of whatever age. Some of these accounts are harrowing and they should have no place in a modern, civilised system of care.
It is true, of course, that there are many examples where the different elements of health and social care work together far better than in the cases quoted above. But these are too few. Far too often, the health and social care systems are pulling in opposite directions.
The 1948 settlement introduced a National Health Service (NHS) that was free at the point of use. Social care remained heavily needs and means tested for a host of reasons – including there being many fewer older people then with much shorter life expectancies, among whom proportionately fewer had multiple conditions or dementia. The two parts of the care system were considered separately.
The origins of the NHS are complex. But its immediate triggers were William Beveridge’s 1942 report and the construction of the NHS Act of 1946 by Aneurin Bevan. Beveridge’s report was essentially about entitlements to social security. But he took as one of the key assumptions required to make his new social security system work that there would be a comprehensive National Health Service, open to all, and without a charge for treatment at any point. Bevan implemented that.
Were Beveridge to be examining entitlements to health and social care today, we suspect that he would be seeking something that was much better aligned to our current needs – needs which, as we shall show, have changed markedly since 1948. Were Bevan to be implementing a new care system, he would be articulating a very different settlement to the one that we currently have.
In the commission’s view the problems of the current settlement are systemic. They are essentially ones of alignment, and there are three aspects to that.
First, there is a lack of alignment in entitlements to health and social care in England.
Health and social care are subject to wildly different means of assessing need, and to very different tests of means. To put it at its simplest, health care remains broadly comprehensive and largely free at the point of use. By contrast social care is both heavily tested for need (only those with very high needs these days receive much in the way of publicly funded support) and it is heavily means tested. That will remain the case even assuming that the planned cap on care costs does take effect in three years’ time (under the Dilnot reforms). People with conditions that can involve very similar burdens, both for themselves and their families – cancer and dementia, for example – end up making very different contributions to the cost of their care. The battles over whether people qualify for NHS continuing care are the sharpest illustration of this. But they are far from the only ones.
Second, there is a lack of alignment between funding streams.
Health and social care are funded differently. The NHS, broadly speaking, is paid for out of general taxation and operates with a ring-fenced budget that has to be spent on health. Social care is funded through local authorities. They are heavily reliant on central
3
Introduction: A system no longer fit for purpose
© The King’s Fund 2014

government grant but, despite much national guidance and many rules, they still retain considerable discretion about how much they spend. The social care budget is not ring-fenced. Who pays for what is a source of constant friction between the NHS and local authorities. That in turn has a very real impact on those caught between the two.
Third, there is a lack of alignment in organisation.
Health and social care are commissioned separately. This leads to serious problems of co-ordination and integration. There are of course challenges still to be overcome in the integration of health care itself – between primary, community and secondary care, and between physical and mental health. But there are also pressing problems with integrating health and social care, which, if resolved, would help with the much-needed integration of the different aspects of health care.
In numerical and human terms, these problems of alignment are starkly illustrated by the 70,000 bed days used up in January 2014 alone, some 3,000 a day, because people were stuck in hospital despite being fit to leave. They were waiting variously for health or social care assessments, or public funding; in some cases, there was a lack of social care provision or of housing, or there were disputes about who should pay for their continued care (NHS England 2014).
This lack of alignment – in entitlements, funding and organisation – needs to be overcome if England is to get to a health and social care system fit for the present day.
The solution, we believe, is to have a single, ring-fenced budget for health and social care which is singly commissioned, and within which entitlements are much more closely aligned. This is our stake in the ground.
It has huge implications, some of which we will explore later, and some of which we will address in our final report. The commission would, however, note that the seamless service we envisage does not by any means imply a single, nationalised deliverer of care. It could involve one common form of commissioning from many diverse providers.
The commission appreciates that there is little appetite right now for another major restructuring of either the NHS or social care. To get to what we regard as the ideal future will not be easy. It will almost certainly have to be done in stages.
The commission’s terms of reference focused on the issues of entitlement and funding. Getting those right in our view is a necessary, though not on its own a sufficient, condition for getting the whole system to work better. But the commission is also acutely aware that getting entitlement and funding right – or at least improved – is not enough. The many deeply troubling tales of unco-ordinated care on the delivery side, a few of which are illustrated above, are testament to this.
Our view, however, is that attempting to sort out the delivery mechanisms without resolving the entitlement and funding questions may well produce some progress – as, it is hoped, the current integrated care pioneer programme and the Better Care Fund initiative will. But merely addressing the integration of services without tackling the entitlement and funding issues that lie behind them is likely to be the equivalent of applying repeated sticking plasters to a seeping wound, rather than the complete stitching together needed to heal it.
On top of the issues of alignment, the commission believes there is also a problem of adequacy. At its simplest, too little public money is spent on social care, particularly for conditions such as dementia, Parkinson’s disease and, for some people, care at the end of life. Too much is demanded of individuals and the friends and families who care for them.
4 © The King’s Fund 2014
A new settlement for health and social care

That has been the case for years in our view. But the long-term issues that we are seeking to address are being compounded by shorter-term ones. Social care has been subjected to draconian cuts as the coalition government has sought to reduce the deficit. In 2012/13, 26 per cent fewer people aged over 65 were receiving publicly funded social care, along with 24 per cent fewer younger disabled people, compared to 2008/9, the year in which the global financial crisis struck. The decline has been sharpest – 30 per cent – among those receiving care in their own home despite the fact that care at home is likely both to reduce the demand on the NHS and postpone entry to a residential or nursing home (Fernandez et al 2013a).
The reductions in spending and provision, according to the Personal Social Services Research Unit (PSSRU), ‘are almost certainly without precedent in the history of adult social care’ (Fernandez et al 2013a). Social services departments are already struggling to balance the books, with a third of directors of adult services projecting a deficit in this financial year (Appleby et al 2014). Yet there are further cuts in social services spending to come. Sandie Keene, the president of the Association of Directors of Adult Social Services (ADASS), has warned that ‘gazing into the next two years, without additional investment from that already planned, an already bleak outlook becomes even bleaker’ (ADASS 2013).
At a time when health and social care should be converging to meet the needs of the growing population with multiple conditions, the two systems are instead diverging, with publicly funded social care becoming a residual service available to those with only the very greatest needs.
On top of that, the NHS appears to be heading towards its own financial crisis. It has had no real-terms growth since 2010 once allowance is made for the transfer of funds to social care. A quarter of NHS foundation trusts are forecasting a deficit for this year. So are a third of the NHS organisations yet to become foundation trusts, including half of all acute trusts (NHS Trust Development Authority 2013). In 2015/16 the NHS will be transferring some £3 billion to social care – equivalent to the budgets of 6 medium-sized district general hospitals or around 10 smaller ones.
In other words, a crisis in social care is already with us, and another looks to be on the horizon for the NHS, at least in terms of finance. These short-term issues are not the ones that will be the main drivers of the recommendations we will make in our final report. But they do reinforce the need to tackle the systemic issues that we have identified.
Given that we believe spending on health and social care combined is inadequate in both the long and the short term that raises the question of affordability.
If it is accepted that the current arrangements are no longer fit for purpose, and if the country genuinely wants a high-quality seamless service for the 21st century, one able to cope with technological advance and an ageing society, then it has to be resourced.
Some of that resource may well come from greater productivity in both health and social care, and from better integration of the two. Some could be achieved by switching current spending from the health to the social care side. But the only other ways of getting to our goal are either a rise in taxation or new and/or higher charges for some elements of the health service.
In practice it is likely to require elements of all four – improved productivity, a switch in what is spent where, a greater willingness to pay tax for the combined service, and some new or higher charges – if the country is not to face a decline in the quality of care amid technological and medical advances, rising expectations and the demands of an ageing population. In other words, there are some hard choices to be made.
5
Introduction: A system no longer fit for purpose
© The King’s Fund 2014

Throughout the history of health and social care in England there has been a tension between what should be provided publicly, what should be provided privately, and what should be the role of carers and the voluntary sector. In other words, there is a tension between the role of the state and the taxpayer, and that of individuals and families.
We acknowledge that these tensions are unlikely ever to be permanently resolved. They are essentially a question of balance. If we wish to change the current settlement, we must be transparent about why changes are proposed, what the costs will be, and, as far as can be predicted, the likely effects.
We would therefore be immensely grateful if those who respond to our interim report are clear about the rationale and costs for any changes they propose.
6 © The King’s Fund 2014
A new settlement for health and social care

7© The King’s Fund 2014
‘The closest thing the English have to a religion,’ is how Nigel [now Lord] Lawson, the Conservative former chancellor of the exchequer, once famously described the NHS (Lawson 1992).
By contrast, the social care system in England is probably the least understood part of Britain’s welfare state. This is despite the fact that it has been subjected to two government enquiries (The Royal Commission on Long Term Care 1999; Commission on Funding of Care and Support 2011) into its funding – and much intense policy debate during the past 15 years.
When the social care system is understood – often too late to be of any help for the individuals and families concerned – it is less loved and more resented than the NHS.
The NHS is largely free at the point of use. Almost no one has to worry about medical bills. Thanks to the NHS, health care bankrupts nobody.
Social care, by contrast can consume large amounts of an individual’s or a family’s income and savings. Broadly speaking, under the current system individuals have to run their assets down to £23,250 before taxpayer assistance kicks in.
Where we are and how we got here
1
Summaryn The present system is poorly understood, and key aspects of it defy notions
of equity.
n Increased life expectancy has altered the burden of disease, both among older people and younger adults, with more people requiring both health and social care.
n That demands better integration, yet if anything health and social care are diverging rather than converging.
n There have been many changes since 1948 affecting entitlements to health and social care. The boundaries between the two have shifted, in general towards more private payment.
n Social care is heavily dependent on unpaid carers.
n On some measures, the United Kingdom spends broadly what might be expected on health, but appears to spend less than some comparable countries on social care.

Public debate clouded by poor understandingYet, despite the public debate, far too few people understand the extent to which individuals are responsible for their own social care. Nearly half of all those in care homes meet the entire cost from their own pocket and will continue to do so until their assets are run down to £23,250. Under the Dilnot reforms, due to take effect in 2017, that figure will rise to £118,000. But those with sufficient assets will still have to pay up to £72,000 for the lifetime costs of their eligible need for care. On top of this will be the costs of accommodation if they enter a nursing or residential home, up to a £12,000 a year limit. This is a level of individual contribution that would be unthinkable if it were applied to health.
Evidence gathered by the Dilnot commission showed that less than half the population understood that social care is means tested in this way. Seventeen per cent did not know how it was funded. Sixteen per cent thought it was free at the point of use, like the NHS. One reputable survey that Dilnot cited found that more than half the public think that social care will be free at the point of use when they need it (Ipsos MORI 2011).
Indeed, such is the misunderstanding of how social care works that some of the opposition to the Dilnot reforms came from people who believe they will be required for the first time to pay up to £72,000 for their care rather than the £72,000 being a cap (Mitchell 2013); and who fail to understand that under the present system a small minority face bills of £200,000 and more, costs that can require the sale of their home (Commission on Funding of Care and Support 2011).
Defying notions of equityThe Dilnot reforms are an undoubted step forward, albeit a limited one. The higher threshold for the means test, means that people will be able to keep £118,000 of assets, rather than the current £23,250, and still receive local authority funding. Above that, however, those who can will still have to meet the first £72,000 of the cost of their social care. In practice, individuals are likely to incur higher costs than the £72,000 cap implies, for a number of reasons. One is that the cap applies only to eligible needs – that is, those that a local authority assesses to be necessary. And those needs look likely to have to be ‘substantial’, the second highest of four categories of care that local authorities use, which stretch from ‘low’ through ‘moderate’ to ‘critical’. In addition, these costs will only be based on what the local authority would pay for that level of care, and that will in many cases be lower than the amount that individual ‘self-funders’ currently pay. As The King’s Fund said in evidence to the Health Select Committee, there is a high risk of ‘confusion, complexity and complaints’ occurring once that becomes clear (The King’s Fund 2013a). If ‘moderate’ needs were to be included, it is estimated that an additional 23 per cent of people would be helped at a cost of some £2 billion a year (Fernandez et al 2013b).
The Dilnot reforms do not address a key test of equity – one that might be described as equal support for equal needs, or at least as more equal support for similar needs. For example, we heard in evidence how patients and their families are puzzled, indeed bewildered, as to why dementia is viewed largely as a social care problem, and thus is heavily means tested, when its impact can be at least as devastating as cancer. Similarly, it is incredibly hard to draw a distinction between what is health care and what is social care around the end of life. There is little logical division between what is means tested under social care and what is free at the point of use as health care.
The argument that social care should remain so separate from health relies on one of the many paradoxes in the health and social care debate. Namely that people have saved for their old age in order to be able to look after themselves, and that capping the cost
8 © The King’s Fund 2014
A new settlement for health and social care

of social care is thus a subsidy to the better-off which protects inheritances rather than provides help to those most in need. Almost no one can be heard using those propositions to argue that the better-off should be paying for the cost of their NHS treatment, although that subsidy also protects inheritances.
Sixty-six years on: 2014 is not 1948Yet we should be applying similar tests, or at least ones that are much more closely aligned to health and social care given the way the world has changed since 1948.
Greater longevity
Back then, there were just 5.5 million people in the United Kingdom aged over 65 years – what is now effectively state pension age – and a mere 200,000 of them were over 85.
In 2011, by contrast, there were approaching 12 million people aged over 65, more than twice as many as in 1948. Some 1.4 million of them – 7 times as many as in 1948 – were aged over 85. The proportion aged over 65 has, in round numbers, grown from 1 in 9 of the population to just under 1 in 6.
In 1948 a 65-year-old woman could on average expect to live around 15 years more; a man 12 years. Today the figures are more than 24 and almost 22 years. By 2051, the years stretching beyond what is broadly the current state pension age are projected to be 25.9 for men and 28.3 for women (Office for National Statistics (ONS) 2012).
That means, the average 65-year-old today can expect to have more than a third of their life to date, and a quarter of their entire life, still ahead of them. In 1948 the equivalent figures were less than a quarter and somewhat less than a fifth.
This rising life expectancy has happily seen people, on average, living not just longer but healthier lives. Greater longevity is mostly a cause for celebration. Huge numbers of people in their sixties, seventies and eighties now have a level of activity, health and fitness of which their forebears could only have dreamed. Many of those diagnosed with diseases such as diabetes, or who are being treated for conditions such as raised cholesterol or blood pressure, remain highly active and contributing members of society.
Altered burden of disease
The sheer numbers of older people now mean that within that cohort there are many more frail people who live with multiple conditions that require either health or social care, or very often both. The increase in life expectancy has also led to a rise in the numbers of people suffering from what are sometimes termed the diseases of old age – the dementias and Parkinson’s disease, for example – conditions where social care is at least as crucial as health care.
There are no reliable long-run figures to illustrate this, chiefly because awareness of the issue has become most acute only in the past decade or so. Much of the data that does exist, both in the United Kingdom and internationally, is self-reported. That raises a number of questions, such as the reliability of self-reporting – with frail older people and people with dementia being less likely to respond to such surveys – and potential differences in an individual’s interpretation of definitions when self-reporting.
Nonetheless, a key source of self-reported data – the General Lifestyle Survey – does contain questions on long-term conditions dating back to 2000. It actually shows a small decline in those stating that they have either one or two long-term conditions, a finding that is consistent with people on average living longer and healthier lives. Between 2000
9
1: Where we are and how we got here
© The King’s Fund 2014
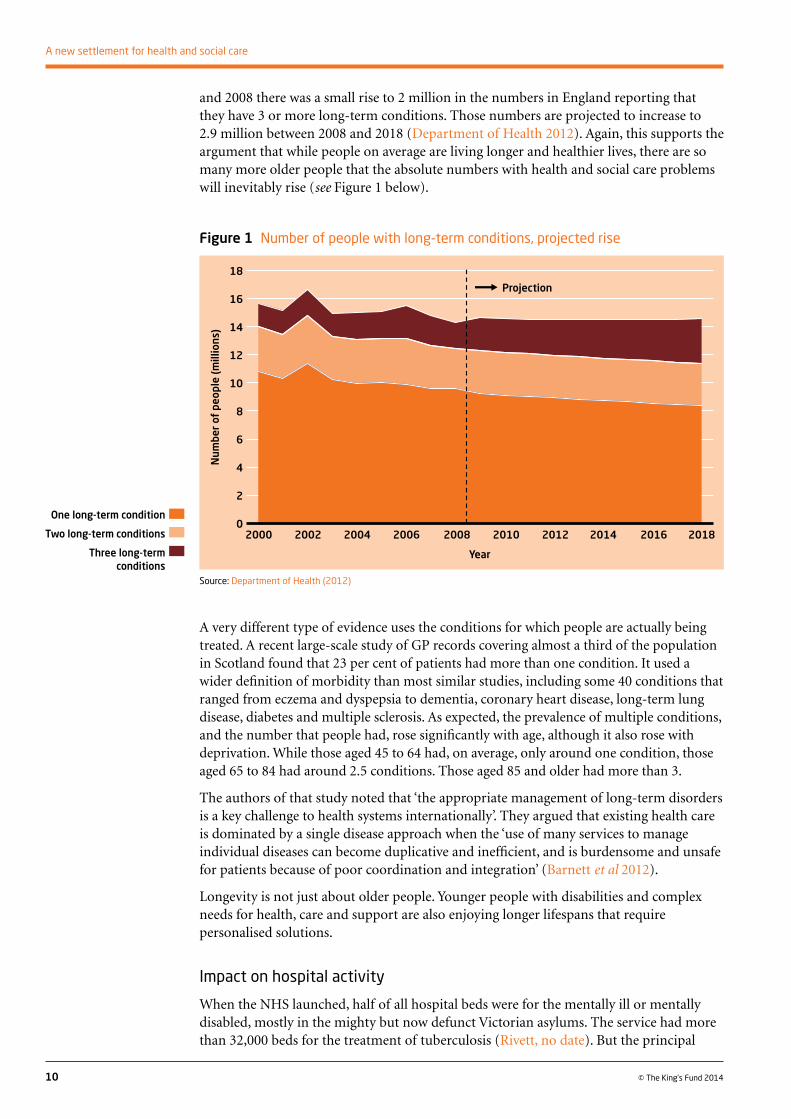
and 2008 there was a small rise to 2 million in the numbers in England reporting that they have 3 or more long-term conditions. Those numbers are projected to increase to 2.9 million between 2008 and 2018 (Department of Health 2012). Again, this supports the argument that while people on average are living longer and healthier lives, there are so many more older people that the absolute numbers with health and social care problems will inevitably rise (see Figure 1 below).
10 © The King’s Fund 2014
A new settlement for health and social care
A very different type of evidence uses the conditions for which people are actually being treated. A recent large-scale study of GP records covering almost a third of the population in Scotland found that 23 per cent of patients had more than one condition. It used a wider definition of morbidity than most similar studies, including some 40 conditions that ranged from eczema and dyspepsia to dementia, coronary heart disease, long-term lung disease, diabetes and multiple sclerosis. As expected, the prevalence of multiple conditions, and the number that people had, rose significantly with age, although it also rose with deprivation. While those aged 45 to 64 had, on average, only around one condition, those aged 65 to 84 had around 2.5 conditions. Those aged 85 and older had more than 3.
The authors of that study noted that ‘the appropriate management of long-term disorders is a key challenge to health systems internationally’. They argued that existing health care is dominated by a single disease approach when the ‘use of many services to manage individual diseases can become duplicative and inefficient, and is burdensome and unsafe for patients because of poor coordination and integration’ (Barnett et al 2012).
Longevity is not just about older people. Younger people with disabilities and complex needs for health, care and support are also enjoying longer lifespans that require personalised solutions.
Impact on hospital activity
When the NHS launched, half of all hospital beds were for the mentally ill or mentally disabled, mostly in the mighty but now defunct Victorian asylums. The service had more than 32,000 beds for the treatment of tuberculosis (Rivett, no date). But the principal
Source: Department of Health (2012)
Figure 1 Number of people with long-term conditions, projected rise
One long-term condition
Two long-term conditions
Three long-term conditions
18
16
14
12
10
8
6
4
2
0
Num
ber
of p
eopl
e (m
illio
ns)
Year
2000 2002 2004 2006 2008 2010 2012 2014 2016 2018
Projection

activity of primary and secondary care lay in maternity, childhood illnesses and getting the working-age population back to health and work. There were, quite simply, fewer older people to care for. Those needing longer-term care were divided into the ‘sick’ – some 90,000 of them – who were placed in hospital usually in the often grim ‘back wards’ of the NHS; and those merely needing ‘care and attention’ who went to means-tested residential care, usually the former workhouses or council-run homes. They totalled 42,000. Note just how small those numbers were – 132,000 in total.
The population has grown by 25 per cent since then, but these days, there are more than 462,910 places in residential and nursing homes in England alone (Care Quality Commission 2013). A further 1.1 million received publicly funded care in their own home or the community (Health and Social Care Information Centre 2013a).These figures do not include those who pay direct for such care themselves or those who are receiving care in hospital.
It of course remains true that the NHS continues to deal in maternity, childhood disease and treatment of the working-age population. But in contrast to 1948, its principal area of expenditure broken down by age is on those who have become entitled to the state pension.
There is no run of figures to illustrate this back to 1948, and even today there is no breakdown of spending by age in primary care. But by 2003/4, the last time that the Department of Health was able to produce these numbers, people aged over 65 made up only around 16 per cent of the population of England but they accounted for roughly 43 per cent of the expenditure on hospital and community services – with hospital and community health services making up well over two-thirds of all NHS expenditure (Department of Health 2006).
A key measure of hospital activity is the number of finished consultant episodes. It rose by 39 per cent in the decade between 2002/3 and 2012/13. But the number for those aged 65 to 74 years increased by 51 per cent, and for those aged 75 and over by 61 per cent (Health and Social Care Information Centre 2013b). In 1998/9, the proportion of finished consultant episodes received by those past state pension age was just under a third of the total. By 2012/13 it had reached 46 per cent (see Figure 2 below).
11
1: Where we are and how we got here
© The King’s Fund 2014
Source: Health and Social Care Information Centre (2013b). Adapted from data from the Health and Social Care Information Centre licensed under the Open Government Licence v.2.0.
Figure 2 Number of finished consultant episodes (FCEs) by age
200
180
160
140
120
100
80
60
40
20
0
FCEs
(Ind
ex, 2
00
2–3
=1
00
)
Year
2002–3
Total episodes
Age 0–14
Age 15–59
Age 60–74
Age 75+
2003–4
2004–5
2005–6
2006–7
2007–8
2008–9
2009–10
2010–11
2011–12
20012-13

Some of that increase reflects the ability of modern medicine to do more. But it also reflects failures in the health and social care system. There is now good evidence that at least 20 per cent of acute admissions to hospital are not strictly necessary, and that people could be cared for better in other settings, including at home. Such care will not always cost less, though frequently it will. But better integration between primary and secondary care, and better integration between health and social care, along with better arrangements between the two at the end of life, would either avoid many of these admissions in the first place, or would allow swifter discharge once treatment was completed. The problems of alignment between health and social care stop this from happening. Social and primary care that would prevent admissions in the first place is not available. Tussles between individuals and their families over the financial consequences of discharge to a care home, and between health and social care over whose budget the care should come from, also delay matters. Different funding streams, different entitlements under health and social care, and different organisations and commissioning arrangements all get in the way of a seamless service, with severe consequences for patients. So does the inadequacy of funding for social care, where the delay in making assessments for discharge must in part reflect a lack of resources.
Improved integration is now essentialAll this makes the case for improved integration of services. If the increase in the numbers with multiple conditions is a challenge for the NHS in ensuring better integration of its own services, that challenge is all the greater for health and social care combined, given that many of those affected by multiple long-term conditions require both those services.
It is, however, important to stress that this is not just an issue that affects frail older people. As well as the finding that the prevalence of multiple conditions rose with age, the Scottish study by Barnett and her colleagues (2012) also found that in absolute numbers, there were more younger people with two or more conditions than there were among those aged 65 or more – some 210,000 younger people against 195,000 aged 65 or more, among the 1.75 million patients whose records were studied. Many of these younger people had a mix of physical and mental ill health that also demands a better-aligned health and social care system.
Local authority spending on social care illustrates the challenge presented by younger people with disabilities, and their need for a seamless health and social care service. Barely more than half the spending goes on those aged over 65. Thirty per cent is spent on adults with learning disabilities under the age of 65 and 9 per cent on adults of the same age with physical disability – both being groups that need health as well as social care. A slightly smaller percentage is spent on people aged under 65 with mental health issues (Health and Social Care Information Centre 2013c). Medical advances have not just done more to help and sustain older people; they have also benefited many younger people with disability who in earlier times might not have survived childhood.
It has always been true that better integration of health and social care would be likely to produce a better experience and better outcomes. The two are heavily interdependent. The one can prevent, defer or alleviate the need for the other.
But the increase in the numbers with multiple conditions now demands that integration. In addition, medical advance and technology are starting to blur the lines between the two. ‘Telehealth’ allows the remote monitoring of conditions such as diabetes, congestive heart failure or chronic obstructive pulmonary disease (health care), while ‘telecare’ can establish whether someone has opened the fridge in the morning, or has had a fall (social care). When both can be provided in one piece of equipment, which part of this device
12 © The King’s Fund 2014
A new settlement for health and social care
and its associated services qualifies as free-at-the-point-of-use health care and which as means-tested social care?
Several of the responses to our call for evidence argued that housing also should be better integrated with health and social care needs. Detailed consideration of that is probably beyond the scope of this report, but it is an important issue for health and wellbeing boards to embrace.
Commissioning care is more fragmentedThe changing pattern of need requires greater integration – that is, much better alignment – in the commissioning of health and social care services. Yet, in recent years the tendency has been for that to become more fragmented.
Some 211 clinical commissioning groups currently commission acute hospital and community health services. Social care on the other hand is the responsibility of 152 completely separate local authorities, while NHS England is responsible for commissioning all primary care and specialist provision. The first two of these – social care and the clinical commissioning groups – are now tentatively linked through the nascent health and wellbeing boards. The different parts of these systems have different funding, governance and accountability arrangements. The Department of Health sets the national policy for social care, for example, but local authorities decide how much is actually spent locally, with a varying mixture of income from central government, local council tax and user charges.
The government is supporting a programme of integrated care pioneers in 14 places, and a £3.8 billion pooled budget – the Better Care Fund – aimed at promoting integration throughout England. These measures are welcome. But the Better Care Fund will initially account for just £3.8 billion worth of expenditure from a total health and social care budget that is closer to £120 billion. These plans are a start, but a modest one. They do not address the lack of alignment that we have identified between health and social care entitlements, and they come against the broader background outlined above of greater fragmentation overall in the commissioning of health and social care.
It is not surprising that these deepening fault lines between the NHS and social care systems are reflected in people’s experiences of them. Personal stories sent by individuals to this commission about the struggle that they and their families face in navigating the current divides – and evidence that the commissioners heard – illustrate that far too vividly (The King’s Fund 2013b).
How did we reach the health and social care divide?The origins of the divide stretch back into history, arguably originating in the Poor Law of 1601. Their ‘modern’ origin came in 1948 when the NHS was established, following the Beveridge report of 1942, and the National Assistance Act of 1946 also took effect. Health became a comprehensive, nationally run service, funded out of general taxation and entirely free at the point of use. The National Assistance Act formally abolished the Poor Law that since 1601 had been administered by local authorities. Social care, however, remained the responsibility of councils and its Poor Law origins can still be seen today in the fact that it remains both means tested and subject to tests of eligibility – individuals must have a certain level of ‘need’ to receive publicly funded help.
This has produced the simple shorthand that we use today – an NHS that is often described as a service that is tax-funded and essentially free at the point of use, while social care remains both heavily needs and means tested. The reality, however, is
13
1: Where we are and how we got here
© The King’s Fund 2014
appreciably more complex. Over the years there have in fact been significant shifts both ways across the health and social care boundary, while NHS sources of finance, and entitlements to free care, have also moved more than is generally appreciated.
It is worth exploring these at some length, if only to make the detailed case that the boundaries between health and social care have been nothing like as fixed between 1948 and now as many people believe. If the settlement has changed once – and it has changed many times in ways both large and small – then it can change again.
How have NHS sources of finance altered over the years?
Being free at the point of use was short-lived
In 1951, Bevan resigned over proposals to introduce charges for teeth and glasses, and in that year a one-shilling prescription charge was introduced – with no exemptions – along with a flat-rate charge for dentistry. The row over the introduction of charges was stupendous. But the world – and the NHS – did not come to an end.
Also for the first time, part of NHS funding came from National Insurance contributions rather than from general taxation. Indeed, contrary to the memory of many older generations, ‘the stamp’ or National Insurance did not pay for the NHS at the very beginning. Ever since 1951 around 80 per cent of NHS finance has in fact come from general taxation – a definition that includes income tax, VAT, corporation and inheritance taxes as well as various other duties, but which excludes National Insurance. The percentage has varied from a low of 74 per cent in 1962 to a high of 91 per cent in 1974. The numbers discussed here are set out in Appendix B, Figure B1 (see p 58), showing sources of finance for the NHS at the level of United Kingdom.
The 20 per cent that comes from other sources – chiefly National Insurance contributions and charges – has also fluctuated. Income from charges has ranged from just over 5 per cent of total NHS spending in 1954, and again for a brief period in the 1960s, to a low of 1.2 per cent today.
The changing balance between general taxation and National Insurance is significant. National Insurance in practice is largely a piece of government accounting. Paying it does entitle individuals to some specific (non-health) benefits such as a state pension. But there is in reality no accumulated National Insurance fund. The share of NHS income that is claimed to come from National Insurance has varied from as little as 6.4 per cent in 1956 to a high of 21.5 per cent when Gordon Brown increased it in 2004 as part of Labour’s drive to get NHS spending up to the EU average. It is worth observing that National Insurance is a more regressive way of funding the NHS than increasing general taxation. National Insurance is paid on only a portion of earnings, and there is a cap on contributions from the highest-earning employees.
Income from charges
The position on charging has also fluctuated over the decades. The numbers, which are set out in Figure B1 in Appendix B (see p 58), need to be treated with a bit of care. Until 1988 the income under ‘patients’ payments’ included ophthalmic charges; after that date, the provision of glasses was largely privatised other than for the most disadvantaged. Until 1994, the figures include payments for private patients – those treated in so-called NHS ‘pay beds’ – although when charges were at their peak of 5 per cent as a proportion of NHS income in the 1960s there was much less private practice than today. In earlier years, NHS dentistry was available more widely than it currently is, boosting the figures
14 © The King’s Fund 2014
A new settlement for health and social care

for NHS patient payments, although income from charges from NHS treatment still raises some £650 million a year, or 22 per cent of the cost of the NHS dental service.
For a brief period between 1965 and 1968 prescription charges were abolished. That produced a 16 per cent spike in the number of prescriptions written, but no one, other than anecdotally, was able to tell whether that was unmet need being met, or simply extra demand from unnecessary prescribing because prescriptions were free. When prescription charges were re-introduced, a set of exemptions came with them that remain broadly in place today – free for those past state pension age, for children, pregnant and nursing mothers and for those on means-tested benefits. There have been some changes since, for example patients with tuberculosis no longer pay prescription charges, and free prescriptions are now available to those aged over 60, rather than at state pension age.
As a result, some 40 per cent of the population are required to pay for their prescriptions, but in practice 89 per cent of prescriptions are dispensed free with those most likely to need pharmaceuticals being in the exempt categories, particularly children and older people. Even so, the NHS currently raises some £450 million in prescription charges a year in England.
Over the years there have been other, more minor, changes to the pharmaceutical regime. In 1985 a ‘limited list’ of drugs that could be prescribed on the NHS was introduced, effectively blacklisting some 1,800 drugs for which the NHS would no longer pay – mainly things like cough syrups, sun blocks, fortified wines, chocolate biscuits and some vitamins and minerals. Patients who wanted these had to pay for them privately. Precisely what is on the list has moved back and forth over the years. ‘Free’ dental treatment is now limited to those on working-age benefits in England; ‘free’ eye tests are available to a limited range of people, along with vouchers that cover the cost of cheap glasses for the most disadvantaged, but which can be topped up. Many people now pay privately both for teeth and glasses.
Even with these restrictions, the NHS dental service still cost £2.9 billion in 2012/13 with income from charges at £653 million covering about 22 per cent of the cost. The general ophthalmic service – glasses and contact lenses – cost £494 million in the same year.
It should also be noted that there is divergence between the four countries of the United Kingdom. Scotland now provides free eye tests for all, while Scotland, Wales and Northern Ireland provide free prescriptions, a change that – from an English perspective and from 2007 on – marginally distorts the numbers in Figure B1 for income from patients’ payments.
Other changes to NHS payments
It has been possible since 2009 for patients to pay for cancer drugs that the National Institute for Health and Care Excellence (NICE) has not approved without otherwise losing their right to free NHS care. It involves some complex arrangements about how and where patients receive these additional drugs as private patients in NHS facilities. These attempt to make a very fine distinction between whether the payment is a ‘top-up’ to NHS care, or whether it is an additional private treatment, in the same way that many people now pay for their dentistry, or for private physiotherapy, without that debarring them from other NHS care (Richards 2008). In practice it is commonly referred to as an NHS top-up as the drugs are paid for privately while treatment continues within the NHS. Its introduction caused anguished debate at the time. Some saw it as a fundamental breach of NHS principles that individuals should be able to pay within the NHS for a clinical treatment that others would not receive, even if they were technically being treated as a private patient at the time.
15
1: Where we are and how we got here
© The King’s Fund 2014

This top-up mechanism applies only to cancer drugs: not to other pharmaceuticals, implants or procedures. In fact the coalition government’s Cancer Drugs Fund took the steam out of the issue, largely removing the need for the top-up. Some 30,000 patients have received their cancer drugs free from the fund, and in practice this top-up mechanism has been little, if at all, used. The principle of NHS top-ups has, however, been established. While the Cancer Drugs Fund has recently been renewed, the whole issue would become live again were the fund to be discontinued or made less generous.
What all this tells us is that the boundaries of funding within the NHS – the mix of charges, general taxation and National Insurance, along with some significant changes to entitlement – have been more permeable than many believe. The boundary between health and social care, however, has been far more malleable than commonly understood.
The shifting boundary between the NHS and social care
The closure of the asylums
In 1961, Enoch Powell, the minister for health, made his famous ‘water towers’ speech announcing the closure of the Victorian asylums for the mentally ill and mentally disabled (that is, people with learning difficulties). It took more than 35 years for that to be fully achieved.
While NHS care remained free as people were moved over to treatment in the community, their housing and some other costs went into the means-tested housing benefit system. So those who could afford to pay their own rent with or without family support, or who were owner-occupiers, met those costs, which were effectively privatised. The state picked up the cost of accommodation for the most disadvantaged through housing benefit, rather than the NHS.
The closure of the ‘back wards’
Back in 1979 a couple of local authorities won test cases in which the then supplementary benefits system agreed to pay ‘board and lodging charges’ for people in voluntary care homes which were at the time in financial crisis.
These decisions, initially ones of local discretion, rapidly became national producing an explosion in costs that saw the bill for such social care accommodation rise from £10 million in 1979 to £2.5 billion by 1992. This was partly because the ageing of the population had begun in earnest, but also because an industry of private sector residential and nursing homes had emerged on the back of these payments.
Councils also began to take advantage of the availability of the benefit system to transfer ownership of their council-run care homes to the private and voluntary sectors. As a result the ownership of the sector looks like this today (see Figure 3, opposite).
The NHS also took advantage of this change. Long-stay beds in the back wards of NHS hospitals rapidly declined as tens of thousands of patients were transferred from free NHS care and into means-tested nursing and residential homes. Figure 4, opposite, shows the spectacular changes in ownership and location of care that resulted.
This was a switch on a large scale from NHS care (free at the point of use) to social care (means tested). It constituted a big change in entitlement, and in who pays, that has affected tens of thousands of people and cost hundreds of millions of pounds, in any given year. It is true that the standards in many modern nursing homes are higher than in many of the NHS back wards that they replaced. But it is a policy that was never announced by a minister. It was just done by the NHS, effectively by stealth. ‘A change
16 © The King’s Fund 2014
A new settlement for health and social care

that took place in an unplanned way without explicit debate, decision, or much scrutiny,’ as Richard Humphries, Assistant Director of Policy at The King’s Fund puts it (Humphries 2013).
NHS Continuing Healthcare
There has also been a long-running point of contention called NHS Continuing Healthcare. This is care for people who need nursing support but whose conditions are not ‘curable’. They need much more than just help with bathing and feeding, but doctors cannot resolve their condition. In practice, over the years, a large amount of continuing care has also been moved out of the NHS and into the means-tested sector. That has produced angry protests from the families of those who cannot but see that their relative still has significant health as well as social care needs, even if their condition is not remediable. It has led over the years to a number of court judgements, a scathing report from the Health Ombudsman, and a series of attempts to redefine what should remain as free NHS care, even if paid for in private provision, and what should be means tested.
17
1: Where we are and how we got here
© The King’s Fund 2014
Source: LaingBuisson (2013b)
Figure 3 Number of residential care and nursing home places by sector, all ages
Note: Surge in NHS places in 1988 is due to Korner classification changes.
Source: LaingBuisson (2013b)
Figure 4 Trends in local authority, independent and NHS care provision, number of places 1980–2012
Voluntary 14%
Private 78%
NHS 3%
Local authority 5%
Num
ber
of p
lace
s (0
00
s)
260240220200180160140120100
80604020
0
Year
19961998
20001990
19921994
20082010
20122002
20042006
19841986
19881980
1982
Independent residential care
Independent nursing homes
Local authority residential care
NHS long-stay beds

The latest redefinition came in 2007. The data for this area of care is not good, but provision looks very uneven around the country. Since 2009 there has been a 28 per cent growth in spending on NHS Continuing Healthcare; this encompasses a doubling of spend in the East of England and a reduction of a third in South Central – although how far it reflects the generosity of earlier provision is not clear.
Continuing Healthcare is one of the most acute illustrations of the problems of alignment in the current system. The different funding streams mean health and social care each have an interest in pushing the funding problem on to the other. The very different entitlements provide relatives and individuals with a personal financial interest in the outcome. The differing organisations mean patients and clients can see well-loved carers changed because health and social care contract with different providers, and contract to provide different services.
‘Needs testing’ social care has become much tougher
On the social care side, it is important to remember that it remains not just means tested but subject also to a test of need. Councils set their own criteria within a framework that is laid out in Department of Health guidance (Social Care Institute for Excellence 2013). In theory there are four thresholds of need used to define eligibility – low, moderate, substantial and critical. In 2005/6, 53 per cent of local authorities funded some people judged to have moderate needs. By 2012/13, as social care funding became increasingly constrained, just 13 per cent of councils were doing so, with needs having to be ‘substantial’ or ‘critical’ in all the other councils. As local authority spending continues to be squeezed hard as part of deficit reduction over the next few years, more councils may restrict needs to ‘critical’.
The reforms in the Care Bill currently before parliament are intended to standardise these tests into a national needs assessment which people will be able to take with them if they move from one local authority to another. The threshold for receiving help, however, looks likely to be pitched at ‘substantial’ – that is, towards the high end of the spectrum of need (Department of Health 2013).
Deficit reduction has also led to a marked decline in the number of people receiving publicly funded social care since 2008/9, most notably among older people where there has been a 27 per cent reduction, but also among younger people with disabilities where the decline is 17 per cent (see Figure 5 below).
18 © The King’s Fund 2014
A new settlement for health and social care
Source: Health and Social Care Information Centre (2013a). Adapted from data from the Health and Social Care Information Centre licensed under the Open Government Licence v.2.0.
Figure 5 Number of people receiving publicly funded care, 2005/6–2012/13
Num
ber
of p
eopl
e (0
00
s)
1,400
1,200
1,000
800
600
400
200
0
Year65 years and over
18–64 years
2005/6 2006/7 2007/8 2008/9 2009/10 2010/11 2011/12 2012/13
–27%
–17%

The decline, as Figure 6, above, illustrates, has been most pronounced for older people who receive care in their own homes (a 30 per cent reduction), rather than in a nursing or residential home. That is despite the fact that care at home is likely both to reduce the demand on the NHS, and postpone entry to long-term residential or nursing home care.
Even so, the numbers in residential care and nursing homes have also fallen. With further cuts to local authority spending to come, this is a sector that – if it’s not already in crisis – is heading into one that will see yet more people failing to get the support that they would have under previous assessments. Increasingly help with social care is being limited to those with the highest needs and the lowest means, whereas health care remains broadly a universal service accessed by the whole population.
At a time when the health and social care systems ought to be converging to meet the needs of frail older people and those with multiple conditions, they are in fact diverging, with social care becoming a residual service only for those with the very greatest needs.
Personal health and social care budgets
Finally there are personal budgets. In social care, people can take an actual or virtual budget for their care and choose how to spend it – topping it up if they wish to and can afford to.
Extensive pilots are also under way for personal budgets in health for long-term conditions. If they become widely adopted, it is difficult to see how anyone could be prevented from topping them up – that is, buying additional health care privately that goes beyond the agreed package. In practice, of course, some people already pay for physiotherapy and some other services privately. Even so, the introduction of personal budgets for health would effectively extend into another area of health care, the cancer drug top-up scheme that has been permitted since 2009. Patients would be able to top up their NHS provision without losing the right to their other NHS care and having to go entirely private.
19
1: Where we are and how we got here
© The King’s Fund 2014
Source: Health and Social Care Information Centre (2013a). Adapted from data from the Health and Social Care Information Centre licensed under the Open Government Licence v.2.0.
Figure 6 Number of older people receiving different types of care, 2005/6–2012/13
Num
ber
of o
lder
peo
ple
(00
0s)
1,200
1,000
800
600
400
200
0
Year
2005/6 2006/7 2007/8 2008/9 2009/10 2010/11 2011/12 2012/13
Community-based services
Residential care
Nursing homes
–19%
–11%
–30%

Entitlements and boundaries have shifted markedly What this brief and highly selective history demonstrates is that the boundaries within NHS funding, and the boundaries between health and social care have been far from fixed since 1948. In general, the shift has been to move more NHS care across into the means-tested social care domain costing many billions of pounds over the years – costs that now fall on individuals rather than the taxpayer, unless the individual’s income and assets are low enough to receive public funding. These shifts include the closure of the NHS long-stay wards and the Victorian asylums; the shift in continuing care; the deliberate privatisation of much of the community optical service; the much less widespread provision of NHS dentistry. In summary, entitlements have changed.
The movement, however, has not been entirely one way. Provision of NHS Continuing Healthcare has fluctuated, with some that had been moved into the means-tested sector at times returning once again to the NHS. Exemptions from charges for NHS prescriptions are much more generous now than they were for the first 20 years of the NHS’s existence. Even allowing for the change in entitlement, charges make up an appreciably smaller part of NHS income than they have at times in the past. However tentatively, the principle of NHS top-ups for cancer drugs and for those receiving personal budgets for health care has arrived, even if in practice that is currently very limited.
It is worth ending this particular section on entitlement and boundaries with a provocative thought. Health in part pushes care for those with dementia across into the means-tested social care domain because there is as yet no ‘cure’ for dementia. At some point in the future, however, a pharmaceutical or other treatment may become available that may not cure dementia but which may delay its onset or significantly mitigate its effects to a far greater extent than anything that is currently available. At that point that element of care, at least, will move back into health.
The role of carers in the two systemsIn terms of assessing where we are, the role of carers must be considered. The NHS and the social care systems in England have some 3 million paid staff between them. But they are far outnumbered by 6 million informal carers who provide at least some help each week to family or friends. Some 3 million people also undertake various kinds of voluntary work in health and social care settings (Naylor et al 2013). Without this vast unpaid workforce, health and social care would collapse. According to Carers UK, the numbers providing informal care of 50 hours per week or more has increased by 26 per cent over the past decade (Carers UK 2012). Contrary to some public perception, a significantly higher proportion of the UK population act as carers than in many other countries – more than 15 per cent, the third-highest proportion among 16 countries surveyed, and outstripped only marginally by Spain and Italy, according to an Organisation for Economic Co-operation and Development (OECD) survey (OECD 2011).
A growing number of people are now juggling work and caring, often acting as ‘sandwich carers’ – looking after their own children while caring for older or disabled loved ones. The government’s own Carers Strategy projects that by 2017 we will reach a tipping point where the numbers of older people needing care will outstrip the number of working-age family members currently available to meet the demand. Over the next 25 years, those numbers of carers may need to rise by a half (Department of Health 2010).
20 © The King’s Fund 2014
A new settlement for health and social care

England and the United Kingdom’s place internationallyAppendix C discusses how far the grass is greener elsewhere. There is also a background paper that has been prepared for the commission on the international context.
But, as we shall see in the main text, the United Kingdom spends roughly what would be expected on health when spending per head is set against national income per head. However, many countries that we might wish to compare ourselves against, for example France, Germany, the Netherlands, Sweden and Denmark, spend a larger share of GDP on health.
International comparisons of what is spent on health and the outcomes are a difficult enough undertaking, but the figures are far harder to compile and interpret for social care. Infuriatingly, the United Kingdom appears not to submit its data to the OECD in a way that allows direct comparisons on social care spending with other countries. What little that can be gleaned from the available OECD figures is that public spending on social care in the United Kingdom appears to be towards the lower end of the range for many, but not all, comparable countries.
21
1: Where we are and how we got here
© The King’s Fund 2014

22 © The King’s Fund 2014
Whenever the NHS hits a financial crisis – as it has done almost once a decade and sometimes more frequently – the argument is heard that an ageing population, technological advance and rising patient expectations are making health care somehow unaffordable and unsustainable. The same arguments can be applied to social care given the rising demand from the numbers suffering from multiple morbidity or conditions such as dementia requiring both health and social care. It is important here to attack a few myths and get the issues into perspective. Will an ageing society and the sheer cost of health and social care overwhelm us? We turn first to the impact of ageing society.
Are we living longer, fitter lives, or longer, sicker ones?This is a crucial question that clearly affects long-term health and social care costs. Ever since the 1980s there has been a long, and international, debate around the question (Fries 1980).
Surveys that involve self-reporting by individuals tend to show more people reporting some level of disability. That, however, at least in part reflects expectations. We all know someone frustrated that they cannot play tennis aged 70 as they could at 40. By contrast surveys that rely instead on medical assessment, or assessments of functionality, have shown that people are living longer without serious disability, and that when it occurs it does so towards the end of life. This is known as compression of morbidity. All these surveys have been subject to some limitations and they have produced mixed results, some indeed appearing to support the ‘longer but sicker’ hypothesis (Cutler et al 2013).
Cutler and colleagues at the National Bureau of Economic Research in the United States have recently produced by far the largest and most robust of these studies (Cutler et al 2013). It covers recipients of Medicare, the US federal-funded health system for older people. The samples are large and representative – more than 10,000 individuals per
Living with an ageing society2
Summaryn Increased life expectancy – and an ageing society – are not a cause for gloom.
n On average we are living longer but fitter, not longer but sicker.
n It is chiefly medical advance and technology, rather than ageing, that are pushing up health care costs.
n The support ratio – the numbers earning against those who are not – is not so bad when looked at dynamically.
n All pensioners are no longer poor pensioners. For at least the next decade, those reaching state pension age are significantly more affluent on average than their predecessors. And they pay tax.

annum. The study is long term, running from 1991 to 2009. It includes measures of self-reported disability, the presence of disease, and summary measures of actual function across 19 dimensions of health, with the findings linked to death records up to 2008.
It finds that there has been a reduction in the share of older people who report limitations on their activities of daily living. That is most marked among those with many years until death. Health status in the year or two prior to death has been relatively constant over time, but health three or more years before death has measurably improved. Disability-free life expectancy has been rising over time, while disabled life expectancy has been falling. For a typical 65 year old, life expectancy in this study rose by 0.7 years between 1991 and 2005, but disability-free life expectancy increased by 1.6 years. By contrast disabled life expectancy fell by 0.9 years. The clear conclusion is that ‘morbidity is being compressed into the period just before death. Disease-free survival increased as well, although so did survival with a major disease’ (Cutler et al 2013).
Compression of morbidity, the authors note, ‘would lead to longer life but less rapid medical spending increases than if life extension were accompanied by expanding morbidity’ (Cutler et al 2013). That does indeed seem to be the case.
The health costs of old age Nonetheless, older people do consume more health and social care on average as Figure 7 illustrates below. Health spending per head is concentrated on maternity and the early years, before dipping and then rising steadily as people age.
The average spent on someone aged 85 and over is roughly 10 times the amount spent per head on people aged 5 to 30. On the face of it, that implies that health care spending will rise inexorably and possibly uncontrollably as the numbers of ‘old old’ – the 85-plus cohort – double over the next 20 or so years, and the numbers aged 80 to 84 rise by 70 per cent.
However, there is evidence from studies from around the world – from the United States, Germany, Scotland, and the Netherlands – that a large part of the lifetime cost of health care, at least 25 per cent and possibly as much as 40 per cent, occurs in the last 18 months
23
2: Living with an ageing society
© The King’s Fund 2014
Source: Department of Health (2011)
Figure 7 NHS expenditure per head in England, by age group, 2012
Spen
d pe
r he
ad (£
)
3,000
2,500
2,000
1,500
1,000
500
0
Age group
35–39
40–44
45–49
20–24
25–29
30–34
65–69
70–74
80–84
75–79
85+
50–54
55–59
60–64
5–9
10–14
15–19
Births
0–4

or so of life. Not only that, it does so more or less regardless of the age at which people die. Indeed there is even some evidence that the costs of death are lower among the very old and for reasons that may not be due to age discrimination. As Raymond Tallis, Professor of Geriatric Medicine at Manchester University has argued, even healthy old people become frailer, ‘so it is possible that the stroke or heart attack that you might have survived with disability at age 70 will kill you at 90’ (Timmins 2008).
As Professor Chris Van Weel of the University of Nijmegen who conducted the Dutch study has argued, ‘it is dying, rather than old age, that implies high costs’ (van Weel and Michels 1997).
What has been driving health care costs?Across the developed world, health care costs have doubled over the past 50 years and they are projected to go on rising.
It is widely assumed that ageing has been a main factor in this. But as we have seen, ageing no longer need imply ill health. Instead there is a growing consensus among health economists that the chief driver in spending has been progress in medical knowledge and technology. Technology is defined here to include not just computers and new types of scanning or other equipment but what can be done with them – producing a continuing availability of new types of treatment that can be applied to people of any age. Even the briefest of lists of what is possible now that was not possible in 1948 makes the point – all forms of transplantation, renal dialysis, a huge range of vaccinations, a vastly increased range of antibiotics, entirely new pharmaceuticals for the treatment of mental illness, all forms of joint replacement, and so on.
Figure 9 opposite reflects the findings of two studies from the United States that have since been broadly supported by other academic analysis. Because they are US-based they include drivers of health cost that do not apply significantly in the United Kingdom such as rising real terms private insurance costs. But there is no reason to believe that the broad
24 © The King’s Fund 2014
A new settlement for health and social care
Source: OECD (2012b)
Figure 8 Total health care spend as a percentage of GDP, 1960–2010 (OECD countries)
Per
cen
t
20
18
16
14
12
10
8
6
4
2
0
Year1992
19941996
19982000
20021980
19821984
19861988
19902004
20062008
20101968
19701972
19741976
19781960
19621964
1966
UK 1960: 3.9% 2010: 9.6%
Germany 1960: 6.0% 2010: 11.6%Sweden
1960: 6.8% 2010: 9.6%
US 1960: 5.2% 2010: 17.6%

finding – the relative importance of the advance of medical knowledge and technology compared to the impact of ageing itself – does not apply in England.
This does not mean that ageing has no impact. Improvements in what medicine can do and the fact that people’s longer lives enable them to take advantage of those advances are clearly linked. Many more people, for example, now receive preventive treatment for raised blood pressure or cholesterol, or have treatment for diabetes. That has a cost, although often a low one per head given the generic drugs used. The treatment, despite the fact that these people are classed as having ‘a condition’ or ‘morbidity’, allows them to remain highly productive members of society, whether as workers or carers. It enables other larger-scale health or social care costs to be postponed, and indeed mitigates them as people enjoy still more years of disability-free life. Costs also rise with greater longevity because, for example, people now live long enough to have a second or even third hip replacement, medical advance making that possible when the early results from a second joint replacement used to be poor.
An ageing society does therefore have a cost, even if it is the availability of new medical technologies that is the chief driver. Having a country with more older people is not likely to overwhelm us – given the growing evidence to show that we are leading longer, fitter lives, and that lifetime health care costs are concentrated into the period before death, whenever that occurs. Undoubtedly it will lead to increased cost, but we are not all doomed simply because we are living longer.
Ageing is already well under wayIf ageing is a problem, it is important to recognise just how far the United Kingdom has already travelled in this regard. In 1901 fewer than 5 per cent of the population were aged over 65. By 1960 that proportion was 12 per cent. Fifty years on, it is 17 per cent in England. As the Dilnot report observed: ‘As a society, we have managed this change and continued to prosper’ (Commission on Funding of Care and Support 2011).
It is true that, for the first time, there are now more people aged over 65 in the United Kingdom than there are children under 15. Furthermore, the projections suggest that there will be a very significant increase among those aged 85 and over (see Figure 11 overleaf).
These are major changes to the demographic. They have led to serious concern over what is dubbed the ‘dependency ratio’ – the proportion of the population of working age whose taxes and broader economic contribution sustain those who are too young, too old or too poor to support themselves.
25
2: Living with an ageing society
© The King’s Fund 2014
Sources: Newhouse (1992) and Cutler (1995)
Figure 9 Drivers of increased spending
Spen
d pe
r he
ad (£
)
100
80
60
40
20
0 Newhouse (1992) Cutler (1995)
Attributed to technical change
Avoidable administrative expense
Relative medical price inflation
Income growth
Insurance
Ageing

Will there be too few workers to pay for care?Most concern has centred on the ‘old age dependency ratio’ – the proportion of those of working age, usually defined as 16 to 64, against those aged 65 years and older (ie, broadly state pension age). In the 1960s there were around 4 people of working age to each pensioner. By 2010 that ratio had fallen to 3.2 per pensioner. Projections suggested that it would drop to 2 by the middle of this century.
However, the Office for National Statistics (ONS) calculated in 2010 that the old age support ratio is now expected to be nearer 2.9 in 2051 thanks to planned increases in the state pension age to 66 by 2020, to 67 by 2028 and to 68 by 2038. The government has recently announced that the increase beyond the age of 67 will not be legislated for now. Instead it will be decided by a regular review of state pension age that will link its increase to life expectancy. That is still likely to raise it to 68 sometime in the 2030s. If life expectancy continues to rise, it is likely to reach 70 for those currently in their early 20s.
26 © The King’s Fund 2014
A new settlement for health and social care
Source: Dilnot (2011)
Figure 10 Proportion of the UK population aged 65 and over, since 1901
Per
cen
t
25
20
15
10
5
0
Year
19811991
20011951
19611971
20112021
20311921
19311941
19011911
Source: ONS (2009). Adapted from data from the Office for National Statistics licensed under the Open Government Licence v.2.0.
Figure 11 Growth in number of older people in England by age, 2010–30
Per
cen
t
100
80
60
40
20
0
Age
65–69 70–74 75–79 80–84 85+

The fact that legislative change can alter such an apparently key statistic provides a warning that its application needs to be handled with care. Increases in the state pension age tell us nothing about the proportion of people likely to work on past the current qualifying age. That will be affected by many factors – not least their health status and the broader standing of the economy.
At present only 12 per cent of men and 11.6 per cent of women work on past the current state pension age, many part-time. Those employment rates, however, have risen by 50 per cent since the early 1990s, and over the past decade those beyond state pension age have been one of the fastest growing sections of the workforce. Of course there will be differentials. It is plainly easier for an accountant or lawyer to work on in their sixties and seventies than it is for a road digger or builder.
There is growing criticism of the use of the old age dependency ratio as a simple measure of the impact of an ageing population. It is a static measure (how many people are aged over 65 compared to the remainder) that is then simply projected forward on the assumption that nothing else changes.
Jeroen Spijker and John MacInnes in a recent paper for the British Medical Journal entitled ‘Population ageing: the time bomb that isn’t’ argued that the ratio ‘counts neither the number of dependent older people nor the number who sustain them. It merely takes a cut-off point (the state pension age) and assigns adults to the two sides of the ratio accordingly. This might be useful as a rule of thumb if the relative size of these two age groups tracked the volume of old age dependency, but it does not’ (Spijker and MacInnes 2013).
The old age dependency ratio, they argue, defines all people above state pension age as dependent, regardless of their economic, social or medical circumstances. ‘This overlooks the fact that rising life expectancy makes these older people “younger”, healthier and fitter than their peers in earlier cohorts. Many have accumulated substantial assets. Currently over one million are still working, mostly part time, many with valuable experience or specialist knowledge. The spending power of the “grey” pound has risen inexorably. Many do volunteer work vital to the third sector or look after grandchildren’ (Spijker and MacInnes 2013).
Furthermore if people of all ages who are not employed are counted as dependents, then there are currently more dependents of working age than there are older people who do not work.
So in place of the standard old age dependency ratio, the authors suggest a more sensible measure would be to examine the numbers actually in work of whatever age, rather than simply use an arbitrary division by age. In addition, they suggest that if age were to be used, a better definition of the dependent older population would be those with a life expectancy of 15 years or fewer. They set that against long-term trends in employment. Here, they argue, later entry to employment as more people enjoy tertiary education, and earlier exit as more people have taken redundancy or early retirement, has been more than offset by the large rise in working mothers over the years. The overall effect is that the proportion of the population who are working (48 per cent) is similar to that seen 60 years ago (46 per cent).
The result, according to Spijker and MacInnes, is that the ‘real’ old age dependency ratio (the brown line in Figure 12 overleaf) is likely to be much lower than under the standard definition.
The authors argue that their lower projected dependency ratio is conservative since they have held employment rates constant over time, when in fact they expect them to increase for various reasons. ‘It is thus probable that our ratio will stabilise near its current level,’ they say (Spijker and MacInnes 2013).
27
2: Living with an ageing society
© The King’s Fund 2014
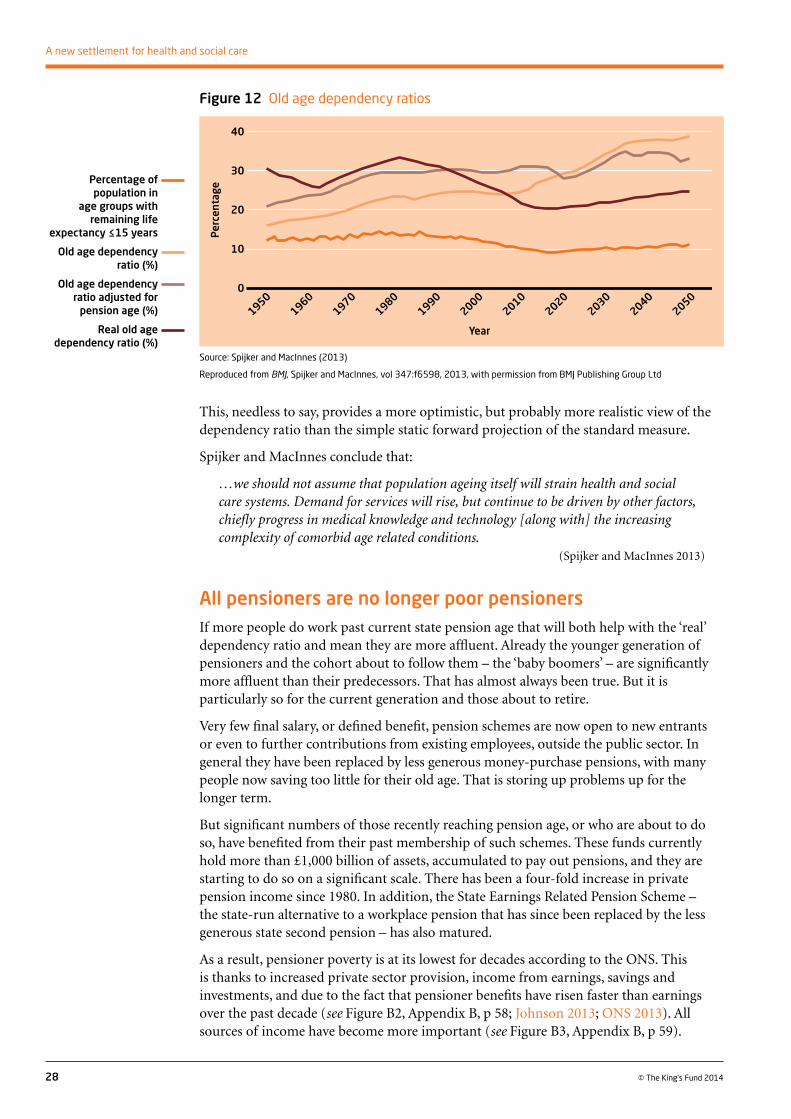
This, needless to say, provides a more optimistic, but probably more realistic view of the dependency ratio than the simple static forward projection of the standard measure.
Spijker and MacInnes conclude that:
…we should not assume that population ageing itself will strain health and social care systems. Demand for services will rise, but continue to be driven by other factors, chiefly progress in medical knowledge and technology [along with] the increasing complexity of comorbid age related conditions.
(Spijker and MacInnes 2013)
All pensioners are no longer poor pensionersIf more people do work past current state pension age that will both help with the ‘real’ dependency ratio and mean they are more affluent. Already the younger generation of pensioners and the cohort about to follow them – the ‘baby boomers’ – are significantly more affluent than their predecessors. That has almost always been true. But it is particularly so for the current generation and those about to retire.
Very few final salary, or defined benefit, pension schemes are now open to new entrants or even to further contributions from existing employees, outside the public sector. In general they have been replaced by less generous money-purchase pensions, with many people now saving too little for their old age. That is storing up problems up for the longer term.
But significant numbers of those recently reaching pension age, or who are about to do so, have benefited from their past membership of such schemes. These funds currently hold more than £1,000 billion of assets, accumulated to pay out pensions, and they are starting to do so on a significant scale. There has been a four-fold increase in private pension income since 1980. In addition, the State Earnings Related Pension Scheme – the state-run alternative to a workplace pension that has since been replaced by the less generous state second pension – has also matured.
As a result, pensioner poverty is at its lowest for decades according to the ONS. This is thanks to increased private sector provision, income from earnings, savings and investments, and due to the fact that pensioner benefits have risen faster than earnings over the past decade (see Figure B2, Appendix B, p 58; Johnson 2013; ONS 2013). All sources of income have become more important (see Figure B3, Appendix B, p 59).
28 © The King’s Fund 2014
A new settlement for health and social care
Source: Spijker and MacInnes (2013)
Reproduced from BMJ, Spijker and MacInnes, vol 347:f6598, 2013, with permission from BMJ Publishing Group Ltd
Figure 12 Old age dependency ratios
Per
cent
age
40
30
20
10
0
Year
20302040
20002010
20202050
19701980
19901950
1960
Percentage of population in
age groups with remaining life
expectancy ≤15 years
Old age dependency ratio (%)
Old age dependency ratio adjusted for
pension age (%)
Real old age dependency ratio (%)

As the Institute for Fiscal Studies (IFS) has demonstrated, the result is that median pensioner incomes – the mid-point of pensioner incomes – are now similar to those of the working-age population; pensioners are the least likely to be in the bottom fifth of the income distribution. This is a spectacularly different position to the one 30 years ago when more than 40 per cent of pensioners were in the bottom fifth of the income distribution and more than 66 per cent were in the bottom two-fifths (Johnson 2013). Today, as Figure 13 below shows, barely 10 per cent of pensioners are in the bottom fifth. More than 40 per cent are in the top half of the income distribution. In addition, around 75 per cent of those aged over 65 now own their own home, and, unlike most other age groups, their home ownership rates are rising.
29
2: Living with an ageing society
© The King’s Fund 2014
It is important not to overstate this shift. There remains, as Figure 13 shows, a wide range of income distribution among pensioners. Almost 3 million people rely on taxpayer support from the means-tested pension credit. Above them are significant numbers who are asset-rich – they own their own home – but who are relatively income poor. They also have few other savings. The fact remains, however, that the days when we should consider almost all pensioners to be poor pensioners are gone.
A longer-term problem may be looming due to low levels of pension saving among the current workforce. But for at least the next decade or so those people who are only just past state pension age are likely on average to be the most affluent pensioner generation yet – and by a very considerable margin.
It is also important to remember that these more affluent older people also pay tax. Roughly half of all pensioner income comes from the taxpayer through state pensions and other benefits – an appreciably smaller proportion than 30 years ago (Cribb et al 2013). As they spend that money, they pay VAT, council and other taxes, including in some cases income tax. Those with private pension income and/or savings and investments also pay these taxes and larger amounts of VAT given their higher spending on goods and services. So it is entirely wrong, as often happens in the public discourse, to see pensioners as purely a burden on the taxpayer. An element of their taxes – increasingly larger as more people work past the current state pension age – contributes to the cost of health and social care.
Source: Cribb et al (2013)
Figure 13 Income distribution 1979–2011, percentage
100
90
80
70
60
50
40
30
20
10
0
Per
cen
t
Parents and children Pensioners Working-age without children
1979 1996 2011 1979 1996 2011 1979 1996 2011
5th quintile (highest income)
4th
3rd
2nd
1st quintile (lowest income)
30 © The King’s Fund 2014
Whenever the future costs of health and social care are debated, the cry goes up that the NHS, which since 1948 has taken an ever larger share of national income and is projected to continue doing so, is becoming fiscally unaffordable or unsustainable.
Unaffordable is rarely defined clearly in these debates. It is usually code for ‘unaffordable by the taxpayer’. The argument is that if only the NHS ceased to be largely tax-funded and largely free at the point of use, then everything would suddenly become affordable.
That, of course, is not the case. Either people would pay privately for their health care or they would go without, whether through choice – they would value other goods and services more highly – or out of necessity because they lacked the means to pay for it. Reducing the scale and reach of a tax-funded NHS is therefore not an answer to everything. It does not make the present standard of health care suddenly ‘affordable’ to the nation at large.
Health as a ‘luxury good’If you plot how much countries spend per head on health care against their gross domestic product or national income per head, there is a notably strong correlation between the two. This is regardless of whether health is funded publicly or privately, through general taxation or social insurance. Figure 14, opposite, has been described, perhaps somewhat tendentiously, as ‘the most convincing chart in the whole of social science’.
Is health and social care affordable?
3
Summaryn It is often claimed that the ageing population is making health and social care
fiscally unaffordable.
n But health is a ‘luxury good’ – countries and people tend to spend proportionately more on it as they get richer.
n If the economy grows, more can be spent on health and social care, with more money still left over to spend on other things.
n This does not make life problem-free. The United Kingdom could be spending a quarter of its national income on health, long-term care and pensions by 2062 – though that is the worst-case scenario.
n There is more limited room than in the past to cut other areas of public expenditure in favour of health and social care.
n In addition, social care and possibly the NHS are heading into a shorter-term crisis.
n That implies hard choices, even before the improvements in adequacy and entitlement that we believe are necessary.

31
3: Is health and social care affordable?
© The King’s Fund 2014
What it and Figure 15 (above) tell us is something that people find instinctively hard to accept: that above a certain level of spend, health care is in fact what economists call a ‘luxury good’, not a ‘need’. Regardless of how it is paid for, richer countries not only spend more on health, as one might expect, but proportionately more (Figure 15).
This is unsurprising. Health, and the treatment and mitigation of illness, is something people value highly once they have basic food and shelter. Even for the most affluent, there are diminishing returns from the consumption of many other goods and services, but there is less of a diminishing return from expenditure that effectively treats illness, extends life or improves health and social care – or indeed from expenditure which people believe will fulfil those goals. To understand that one has only to look at the growing market in the United Kingdom for treatments that the NHS does not usually fund – routine vitamin supplements, homeopathy and a range of ‘alternative’ medicines and treatments whose clinical effectiveness is questionable.
As Robert Hall and Charles Jones, economists at Stanford University and the University of California, Berkeley, have argued, ‘as we get older and richer, which is more valuable: a third car, yet another television, more clothing – or an extra year of life?’ (Hall and Jones 2007).
There may of course be other factors driving this increase. Among them is the so-called Baumol effect, named after the US economist who pointed out that real salaries have risen over the years in human activities where there is little or limited room for productivity gain, unlike say in manufacturing. His original example applied to musicians where he argued that it still takes the same number to perform a string quartet as it did in the 19th century but pay has increased in real terms. Nursing remains nursing, and teaching is teaching despite some new technical aids. These are labour-intensive activities with limited room for productivity gain, but those performing these tasks still need to see real increases in pay in order to maintain a position in society that is sufficiently attractive for the jobs to be filled. That tends to drive up costs relative to those parts of the economy where significant productivity gains are possible – so over time they take a larger share of national income. That contributes to rising expenditure, but it does not destroy
Source: The King’s Fund analysis of OECD data (OECD 2013a) Source: The King’s Fund analysis of OECD data (OECD 2013a)
Figure 14 Total health care spending per capita against GDP per capita 2010*
Figure 15 Total health care spending as a percentage of GDP 2010*
Tota
l hea
lth
care
spe
nd p
er c
apit
a (U
S$, P
PP
)
Tota
l hea
lth
care
spe
nd a
s pe
rcen
tage
of
GD
P7,000
6,000
5,000
4,000
3,000
2,000
1,000
0
14
12
10
8
6
4
2
0
GDP per capita (US$’000s, PPP) GDP per capita (US$’000s, PPP)
0 10 20 30 40 50 60 0 10 20 30 40 50 60
UK
UK
R2 = 0.9075R2 = 0.44307
* (in US$, purchasing power parity, current prices) for OECD countries (excluding the United States and Luxembourg)

the striking correlation between higher income per head and proportionately higher spending on health.
Furthermore, the desire to spend more on health has been consistent in the United Kingdom. Throughout the 30 years of the British Social Attitudes Survey – the annual snapshot of what we think and who we think we are – health has consistently been the public’s first or second priority for extra government spending (see Figure 16 below).
32 © The King’s Fund 2014
A new settlement for health and social care
An ever-higher share of GDP?Forward projections of health expenditure do indeed, in every country, point to higher spending as a proportion of national income, often to the point where it is argued that this is ‘unsustainable’. It is perfectly possible, for example, to produce an extrapolation showing that if health expenditure in the United States – which spends by far the largest share of its GDP on health care – continues to grow at recent rates, it will consume the whole of the US economy by 2080. That is clearly impossible. To quote Stein’s law, ‘if something cannot go on forever, it will stop’. Something else will happen. For example, the marginal gain from extra spending on health will come to be seen as not worthwhile. Or perhaps some as yet unforeseen huge improvement in productivity will take place that will reduce that growth rate (Appleby and Harrison 2006).
But we are a long way from spending the entire economy on health and social care. Although there must be a limit to such spending, it is also true that there is the capacity to spend proportionately more so long as the economy grows in real terms as well. This does not rule out the need to make choices about spending and taxation. But it does suggest that there is more room for manoeuvre than some believe.
There are two ways to illustrate this.
At the end of the 1970s, health care across the world had been through the better part of two decades of unprecedented pharmaceutical and technological advance – the arrival of a wide range of antibiotics, of previously unavailable drugs for the treatment of anxiety, depression, and other mental health conditions, for the treatment of diabetes, high blood
Source: The King’s Fund analysis of NatCen Social Research data (NatCen Social Research 2013)
Figure 16 Public’s priorities for extra government spending, where health is first and second priority
Per
cen
t
90
80
70
60
50
40
30
20
10
0
Year
19992001
20031993
19951997
20052007
20091987
19891991
19831985
2011

pressure and much else. Joint replacement surgery had become possible along with all the techniques and technologies needed to allow the first kidney and then liver and heart transplants. Some of this advance – new vaccinations and treatments for tuberculosis for example – saved money. Much of it increased health care costs. By 1970 health care was taking close to 5 per cent of GDP in many industrialised democracies.
The United Kingdom faced these pressures. Richard Crossman, the Labour Secretary of State for Health and Social Services, warned in 1969 that ‘if you translate these figures [for the cost of social services generally, but notably including health care] into graphs and extrapolate the curve, the prospects before us are truly terrifying’ (Crossman 1969). Not long afterwards, David Owen, a health minister, calculated that if the nursing workforce continued to grow at the then current rate, half of the country would be employed as nurses by the early 21st century.
Projections suggested that if the trend of the previous couple of decades continued, in 40 years’ time – by around 2010 – health spending would be taking 10 per cent of GDP in many countries. That was widely seen to be impossible. Yet that is precisely what happened as Figure 17, below, shows.
The prime reason this happened without the world coming to an end is that the economy also grew. The size of the pie charts in Figure 17 has been adjusted to reflect the growth in overall GDP in the original six European Union (EU) countries. By 2010, their economies were around 2.5 times larger in real terms than in 1970. As a result, health spending was indeed taking a larger share of GDP, but it was taking a larger share of a much larger cake. Plenty of money – much more than in 1970 – remained to be spent on other things.
33
3: Is health and social care affordable?
© The King’s Fund 2014
The EU six have been chosen as the example to underline the point that all developed countries, not just England and the United Kingdom, have experienced this. UK spending on health in 1970 was just under 4 per cent of GDP. By 2010 it too had doubled to 8 per cent.
A similar analysis can be applied looking forward. The Office for Budget Responsibility (OBR) has made projections of UK spending to 2062. Beyond the first few years, it must be said, such projections are inevitably highly sensitive to the assumptions made about demography, productivity, immigration, economic growth and the like.
The OBR’s calculations, using its highest estimates, are that spending on health will rise from 8.1 per cent of GDP in 2012/13 to 14.5 per cent by 2062 and spending on long-term
Source: Commission analysis of OECD data
Figure 17 EU6 expenditure on health, 1970 to 2010
2010
1970
Health 4.7%
Health 10.4%
OtherOther

care (social care) will more than double as a share of GDP from 1.2 per cent to 3.0 per cent. Health and social care are thus projected to be taking 17.5 per cent of national income by 2062 against 9.3 per cent in 2012/13.
The economy is also projected to grow over that period, making these figures look less frightening. The larger share being taken by health and social care will still leave a lot more money, in real terms, to spend on other things than is the case today, as Figure 18 illustrates.
34 © The King’s Fund 2014
A new settlement for health and social care
These figures beg questions about the taxable capacity of the UK economy – how far governments can capture tax from its citizens. The case could also be made that other areas of public spending – defence, social housing or pensions – could grow faster than the economy as a whole. Clearly, if all areas of public spending were to do that, the position would become unsustainable. Public services would indeed be taking up the entire economy. So hard choices remain about how much should be spent on what.
But the figures do nonetheless make the point that health and social care are not in any realistic sense, currently or in the foreseeable future, either unaffordable or unsustainable. Spending on them is a matter of political will and individual choice, individual choice being expressed both by how much people choose to spend themselves, and by which politicians, making which promises, they choose to elect.
It is worth recalling that at the end of the 1990s there was a widespread view that politicians were unwilling significantly to raise public spending on the NHS. That led to a spate of reports by think tanks and others on alternative funding of the service. In fact, in 2000, Labour took the decision to double spending on the NHS in real terms to match the then EU average. That has broadly happened.
Multiple upward spending pressures Health and social care cannot be viewed entirely in isolation. They are only one element of public spending that will rise as the population ages. Spending on pensions will also increase for example. The OBR produces a projection for what it calls ‘age-related spending’. Figure 19, opposite, uses the OBR’s highest – ie, worst-case – scenario. Again the size of the pie charts has been adjusted to allow for the office’s projections of economic growth.
Notes: Highest projections; GDP in 2012/13 prices; LTC refers to long-term care.
Source: The King’s Fund calculations on OBR figures
Figure 18 Future UK health and social care spending as share of GDP, 2012 and 2062
£ m
illio
ns
6,000,000
5,000,000
4,000,000
3,000,000
2,000,000
1,000,000
0 2012/13 2062/3
Health (8.1%) and LTC (1.2%)
All other GDP (90.7%)
Health (14.5%) and LTC (3.0%)
All other GDP (82.5%)

Figure 19 suggests that, on the basis of the OBR’s highest projections, total public spending on health, social care and pensions will have risen from more than 15 per cent to more than 28 per cent of GDP by 2062. It is again worth noting that this still leaves a lot more money in real terms to spend on other things. It is also important to note that more than half of all NHS spending and virtually half of spending on social care go on those aged under 65.
Nonetheless more than a quarter of GDP being spent on pensions, health and social care – items chiefly consumed by older people – is a thought-provoking number.
The OBR also produces central and low projections. The starting point is the same as the 2012 figures above, but the low projection for 2062 looks like this:
35
3: Is health and social care affordable?
© The King’s Fund 2014
Under this scenario spending on health, pensions and long-term care accounts for only 19.6 per cent of GDP – just under a fifth. That is a less dramatic increase from the current 15 per cent, and indeed it is only a percentage point or two of GDP more than the United States currently spends on health alone. It must be stressed that these OBR figures are simply projections. But on neither the high nor low projection do the spending figures
Source: The King’s Fund analysis of Office for Budget Responsibility data (Office for Budget Responsibility 2013)
Source: The King’s Fund analysis of Office for Budget Responsibility data (Office for Budget Responsibility 2013)
Figure 19 Current spending as a percentage of GDP (2012) and OBR long-term projected government spending to 2062 (NHS, long-term care, pensions; highest projections)
Figure 20 OBR long-term projected government spending to 2062 (NHS, long-term care, pensions; lowest projections)
2062
NHS 14.5%
Other
Pensions 10.8%
Long-term care 3%
2012
NHS 8.1%
Pensions 6.0%
Other
Long-term care 1.2%
2062
NHS 8.8%
Other
Pensions 8.4%
Long-term care 2.4%
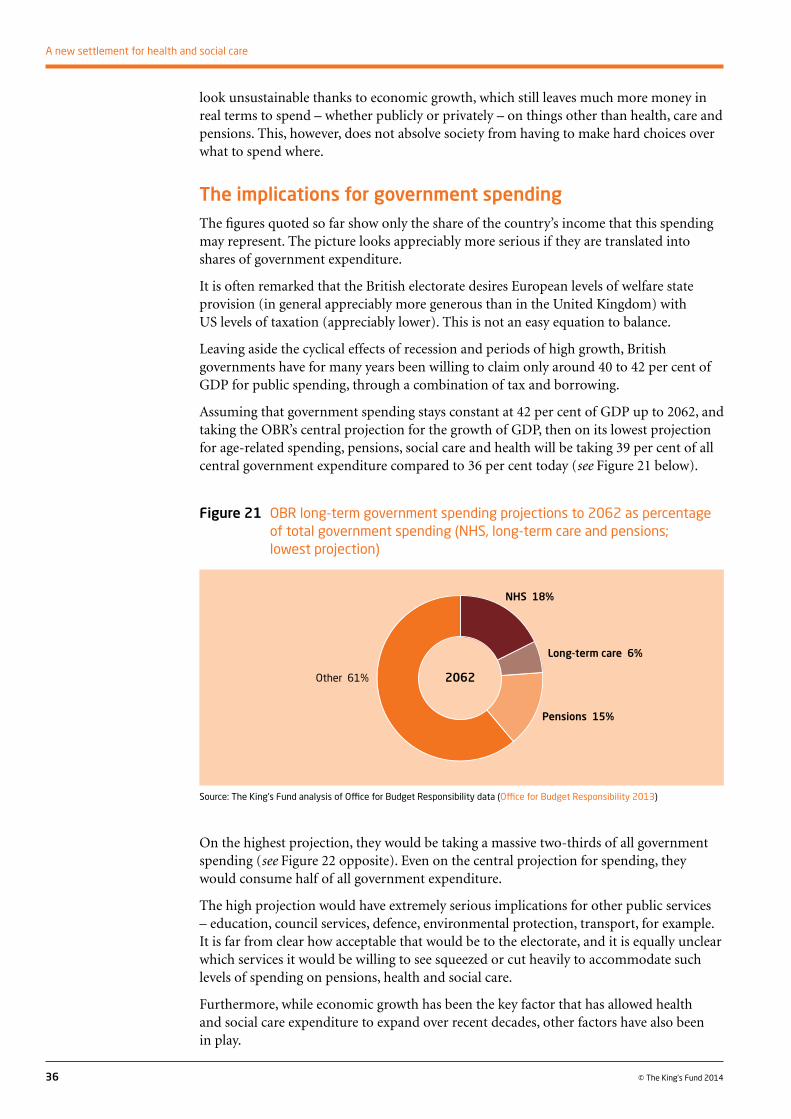
look unsustainable thanks to economic growth, which still leaves much more money in real terms to spend – whether publicly or privately – on things other than health, care and pensions. This, however, does not absolve society from having to make hard choices over what to spend where.
The implications for government spendingThe figures quoted so far show only the share of the country’s income that this spending may represent. The picture looks appreciably more serious if they are translated into shares of government expenditure.
It is often remarked that the British electorate desires European levels of welfare state provision (in general appreciably more generous than in the United Kingdom) with US levels of taxation (appreciably lower). This is not an easy equation to balance.
Leaving aside the cyclical effects of recession and periods of high growth, British governments have for many years been willing to claim only around 40 to 42 per cent of GDP for public spending, through a combination of tax and borrowing.
Assuming that government spending stays constant at 42 per cent of GDP up to 2062, and taking the OBR’s central projection for the growth of GDP, then on its lowest projection for age-related spending, pensions, social care and health will be taking 39 per cent of all central government expenditure compared to 36 per cent today (see Figure 21 below).
36 © The King’s Fund 2014
A new settlement for health and social care
On the highest projection, they would be taking a massive two-thirds of all government spending (see Figure 22 opposite). Even on the central projection for spending, they would consume half of all government expenditure.
The high projection would have extremely serious implications for other public services – education, council services, defence, environmental protection, transport, for example. It is far from clear how acceptable that would be to the electorate, and it is equally unclear which services it would be willing to see squeezed or cut heavily to accommodate such levels of spending on pensions, health and social care.
Furthermore, while economic growth has been the key factor that has allowed health and social care expenditure to expand over recent decades, other factors have also been in play.
Source: The King’s Fund analysis of Office for Budget Responsibility data (Office for Budget Responsibility 2013)
Figure 21 OBR long-term government spending projections to 2062 as percentage of total government spending (NHS, long-term care and pensions; lowest projection)
2062
NHS 18%
Other 61%
Pensions 15%
Long-term care 6%

Since the 1970s, Britain’s welfare state generally – a definition that here includes pensions, health and social care, benefits, education, and public support for housing – has typically taken around two-thirds of all government expenditure and a pretty constant share of GDP. That has in part been possible because the shape of the welfare state has changed. Government expenditure on housing, for example, was reduced significantly when the state chose to subsidise rents, rather than build council houses. The cost of higher education to the public purse has been constrained by replacing student grants with loans and requiring students progressively to contribute more to their fees.
In addition, since the early 1980s, the state no longer runs a whole raft of nationalised industries that required capital and, not infrequently, revenue subsidy (for example, running trains and planes; electricity, gas and water; coal or steel; vehicle manufacturing; telecoms, freight distribution or the Royal Mail). All these have been privatised. Some of these operations – notably rail – still receive significant elements of public subsidy. But far less public money is going into them than previously. There has also been a ‘peace dividend’ following the fall of the Berlin Wall that has seen defence expenditure fall from 3.9 per cent of GDP to 2.3 per cent.
That has provided headroom for spending on the welfare state generally and on health and social care in particular, while holding public spending broadly constant as a share of GDP.
It is worth noting that if public spending, cyclical effects aside, was held constant at 43 per cent of GDP until 2060, that would provide roughly an additional £15 billion a year in current terms – a sum equivalent to some 15 per cent of the NHS budget, and one that would rise over time with the growth in GDP.
Nonetheless, if public spending on health and social care continues to grow, and if governments continue to spend only around 42 per cent of GDP, it is difficult to see what else the state can withdraw from to enable that to happen.
Deficit reduction and spending cuts On top of the longer-term picture, there is a shorter- to medium-term problem – deficit reduction in the wake of the global financial crisis. The spending reductions that were announced in 2010 to deal with that are the ‘longest, deepest sustained period of cuts to public services’ since at least the Second World War, according to the Institute for Fiscal Studies (Chote 2010).
37
3: Is health and social care affordable?
© The King’s Fund 2014
Note: Figures do not add up to 100% due to rounding.
Source: The King’s Fund analysis of Office for Budget Responsibility data (Office for Budget Responsibility 2013)
Figure 22 OBR long-term government spending projections to 2062 as percentage of total government spending (NHS, long-term care and pensions; highest projection)
2062
NHS 35%Other 33%
Pensions 26%Long-term care 7%

To date, the coalition government has broadly protected health spending, even if it has far from protected social care. Since 2010, however, the NHS has been operating on a flat real-terms budget. In practice it is actually in decline as several billions of pounds have been transferred to social care.
That four-year freeze is in sharp contrast to the previous 60 years when expenditure increased on average by 3 to 4 per cent per annum in real terms, even if the increases at times fluctuated widely around that average.
The result is the so-called NHS ‘funding gap’ – not least because technological advance, ageing and rising public expectations have continued apace. Back in 2009 as it became clear that huge spending cuts were on the way, the NHS Chief Executive Sir David Nicholson calculated that on a budget of around £100 billion the service needed to make efficiency savings of between £15 billion and £20 billion from 2011 to 2014 (Nicholson 2009). It is uncertain how far that has been achieved, although a sustained public sector pay freeze has contributed significantly.
In January 2014, the Chancellor of the Exchequer George Osborne indicated that if the Conservatives win the next election, further significant reductions in public expenditure would follow to eliminate the deficit. Estimates of what that further period of austerity means in practice vary, but NHS England has suggested there could be a funding gap of an additional £30 billion to be filled by 2021. Others, using different assumptions, have put it at around £12 billion to £13 billion (Crawford and Emmerson 2012).
38 © The King’s Fund 2014
A new settlement for health and social care
Either way, the NHS faces a severe and continued financial challenge. The budget for social care has declined every year for the past four years, with significant reductions still to come. These cuts have already resulted in a 19 per cent fall in the number of older people receiving publicly funded social care. Both sectors feel they are heading into crisis.
So the essential messages here are optimistic in that economic growth means health and social care are not in any realistic sense either unaffordable or unsustainable, both in the past and into the reasonably foreseeable future. The fact that we are living longer is not going to overwhelm us. But there are some intense short-term pressures to be dealt with and some hard long-term and unavoidable choices ahead.
Health and social care will have to be cut back, taxes will have to rise, or those receiving care will have to pay more. In moving to the genuinely seamless health and social care service we desire, those pressures may well increase.
Source: NHS England (2013)
Figure 23 Projected resource against projected spending requirements to 2021
Total projected costs
Projected resource
£ b
illio
n
140
130
120
110
100
90
Financial year
2013/14 2014/15 2015/16 2016/17 2017/18 2018/19 2019/20 2020/21

39© The King’s Fund 2014
In this interim report we have concluded that there are three serious failures of alignment in England’s current health and social care system – a lack of alignment of entitlements, of funding streams, and of organisation, with the separate commissioning arrangements for health and social care compounding the first two problems.
Our solution is that England needs to move to single, ring-fenced budget for health and social care that is singly commissioned as one service. This will mean health and social care are no longer funded and commissioned separately, enabling entitlements to be brought more closely into line.
We also believe that there is a problem of adequacy. It is difficult to estimate how much more may need to be spent, and that is something we will seek to address in our final report. But it is our view that public spending on the social side of the two systems is too low, both now and in the foreseeable future. We would welcome others’ estimates of what additional spending might reasonably be needed. If spending is inadequate, however, that raises question of affordability.
For all that, the prize is big one – a much more seamless health and social care system fit for the 21st century. Existing divides – artificial and historical – between health and social care would largely be done away with, and entitlements would be more closely aligned. Through this, we would get closer to equal support for equal need, or similar support for similar need, regardless of whether what is needed is currently defined as health or social care.
Hard choices and options4
Summaryn There are serious problems of alignment in the current health and social care
system in England.
n There are also problems of adequacy.
n That in turn raises questions of affordability, which inevitably will involve some hard choices.
n Should we align health more closely with social care, or the other way around? Or a combination of both?
n The big broad options are: use existing resources more efficiently, raise more private funding, raise more public funding.
n We give examples of what each option might involve and a set of criteria by which we will judge change.
n Call for responses and further ideas.

We do not intend to try to provide the answer on how to get there in this interim report. But we hope that by the final report, we will be able to take the opening case studies presented here and point to improvements that our proposed new approach will bring. That will not solve all the problems that these decidedly moving vignettes pose. Many of the problems concern organisation of services, the detail of which we will leave to others. We do hope, however, to be able to argue that the changes we finally propose to entitlements and funding would have improved their situation.
Nor is it our intention to devise a new model commissioning system. In our view, it would not be productive for the country to get into a sterile debate about whether the NHS should take over the commissioning of health care or whether local authorities should be the commissioners of health. The advocates on either side will never be placated. We do note, however, that some, including the Health Select Committee, have suggested that the nascent health and wellbeing boards, which bring health and social care together, might be the vehicle for that (Public expenditure on health and social care: seventh report of session 2013–14).
While the prize is big, we acknowledge that it is unlikely to be achieved in one single step.
Regarding entitlements, therefore, the broad initial choice is whether to align social care more closely with health, or the other way around.
To align social care more closely with health, the possibilities include:
1. Making more of the most acute end of social care free at the point of use – for example, care for advanced dementia, Parkinson’s disease or end-of-life care.
2. Doing that but reducing the cost by taxing the benefit for health and social care. That could have the effect of providing all forms of care entirely free to those on low income while others would incur a progressive tax charge at their marginal rate. This poses some obvious problems. Some people receive care costing many tens or even hundreds of thousands of pounds, and some of them would face a tax bill of 40 or even 45 per cent of the benefit they receive. There might, however, be a way of eliminating such extremes. Views on how that might be made to work would be welcomed.
If health care is to be aligned more closely with social care, the possibilities include:
1. Applying the Dilnot principles to the NHS. In other words, individuals would be covered for the extremes of expenditure – the cap on expenditure – but they would pay an appreciable amount in contributions for health as well as for social care. Under Dilnot, the cap is to be set at £72,000 of lifetime expenditure on assessed needs. It might be possible to set a higher lifetime cap to include some health spending, although that would require a ‘taxi meter’ to add up health spending over a lifetime. A more practical approach might be to have an annual cap for a range of charges that might, for example, be set at £500 or £1,000. Depending on exemptions that could raise billions of pounds in additional funding. It is hoped that the Dilnot proposals will lead to a stronger insurance market to cover costs up to the cap; a capped set of charges for health could also produce developments in the insurance market. Indeed health savings plans, which smooth the cost of existing charges and payments for dentistry, optical and some other services already exist. A Dilnot-style approach, however, would involve: a. extending existing charges, and/orb. introducing new ones.
These two approaches, aligning health more closely with social care, or the other way round, are not mutually exclusive. A combination of both could be considered. There are
40 © The King’s Fund 2014
A new settlement for health and social care

obvious problems in making all social care free at the point of use. That would carry a huge cost to the taxpayer, while potentially destroying some of the basic bonds of society: the role of families and carers in supporting those closest to them at a time of need.
To underline that, and before exploring options for change to take us down these paths, it is worth spelling out the totality of spending on health and social care in England.
Calculating the total is not easy. Some figures – for example, ‘grey’ spending on social care where people pay families or friends or employ carers direct rather than through agencies – are simply unknown and have to be guessed at. Some of the data, while it should be updated shortly, is three to four years old. In some areas of spend there are UK statistics or estimates but not specifically English ones. Some double counting is hard to avoid, and some fairly crude assumptions have to be made.
With those qualifications, however, total spending on health and social care amounts to something in the region of £150 billion a year, or roughly 10 per cent of GDP. It is made up of:
Health expenditure
Department of Health spending in 2013/14 was £111 billion, which includes a number of central services: for example, training, research, central expenditure on public health and arm’s length bodies. Prescriptions and dental charges are included in that expenditure, raising about £1.1 billion in 2012/13. Income from private patients brought in just under £480 million. The department spent approaching £2.5 billion of the total on social care, £1.4 billion of that in grants to local authorities, with a further £1 billion being transferred from the NHS budget (Department of Health annual report and accounts 2012–13).
Of the department’s total expenditure, some £95.6 billion is spent by and through NHS England on largely clinical services, although just under £1 billion of that is part of the transfer to social care (NHS England 2013).
The private market for screening and for acute medical care – through private medical insurance, self-pay, NHS private patients, private screening and termination of pregnancy – amounted to some £6.42 billion in 2011. Of that, around £1 billion was NHS purchase of non-emergency operations from the private sector, with total private spending in this sector amounting to some £5 billion, once NHS purchase and NHS private patient payments (included in the Department of Health figures above) are excluded. Private general practice amounts to some £500 million (LaingBuisson 2013a).
All dentistry, including purely cosmetic dentistry, amounted to £7.2 billion in 2009/10 across the United Kingdom. Of that £5.3 billion is defined as dental treatment, of which £3.2 billion was NHS spending, and of that £2.73 billion in England. Of the total £4 billion spent on all private dentistry including cosmetic, £2.1 billion was defined as dental treatment, of which perhaps £1.8 billion was spending in England (LaingBuisson 2011a).
Non-prescription medicines, bought over-the-counter as general sale or pharmacy-only, amounted to around £2 billion in England in 2012. This figure does not include spending on items not legally defined as medicine: homeopathy or aromatherapy for example. (The figure comes from the Proprietary Association of Great Britain; the UK figure is £2.4 billion to which an England-to-UK population ratio of 0.84 has been applied (Proprietary Association of Great Britain, personal communication 2013).)
41
4: Hard choices and options
© The King’s Fund 2014

None of these numbers embraces a growing market in private physiotherapy, or a range of other treatments and therapies sometimes described as ‘alternative’ medicine such as chiropractic and acupuncture.
Social care expenditure
Public expenditure for adult social care by local authorities in England for 2012/13 is estimated at £17.1 billion, including client contributions (charges) of £2.5 billion, and the cash transferred from health (Health and Social Care Information Centre 2013c).
Private social care expenditure breaks down as follows (figures from 2011/12). Approximately £11 billion is spent on residential and nursing homes.1 Some £820 million goes on private hourly purchased domiciliary or nursing care. Some £300 million is spent on sessional/live-in care. Private payments for aids and adaptations might amount to some £350 million.2 There is also some element of a ‘grey economy’ of care that is paid for, but not purchased through established agencies, that may amount to £150 million (LaingBuisson 2013a).
These figures (for health and social care, public and private spending) give a round total of £150 billion of which some £122 billion was public expenditure and just under £28 billion private spending, with NHS charges included in the private-spending total.
Carers
Over and above this is the crucial role of carers – be they relatives or friends.
Putting a price on informal care is contentious. How many people spend time caring, and how much time they spend, is drawn from self-declared census and survey data. A University of Leeds study for Carers UK in 2011 costed a carer’s time at £18 an hour, or the average hourly cost of paid-for home care in England in 2009/10. This produced an estimated ‘value’ for informal care of £119 billion in 2011, more than the total spending on the NHS for that year (Buckner and Yeandle 2011).
Carers say that caring can be very rewarding, and, as Carers UK argues, many feel strongly about their contribution to society. But the costs can be considerable with carers themselves suffering ill health, or having to give up work or reduce their hours. Some struggle to make ends meet. Many feel they receive insufficient recognition or support (Buckner and Yeandle 2011).
Meeting the costs – options for changeThere will always be a balance to be struck between individual responsibility, the taxpayer’s contribution and the role played by family and friends. Whatever value or price is put on informal care, the whole of current direct expenditure on health and social care – both public and private – cannot be met through public spending. To do that would add around £30 billion to public expenditure or the equivalent of almost an 8-pence rise in the basic rate of income tax.
In our view, more needs to be spent, particularly on social care, to produce the more balanced, integrated system we seek, one in which entitlements are better aligned and
42 © The King’s Fund 2014
A new settlement for health and social care
1 Source LaingBuisson Care of older people market survey 2012/13. Tables 2.1 and 2.4. Rough adjustments made by multiplying some UK figures by 0.83 on advice from William Laing. This calculation makes no allowance for any charitable subsidy for voluntary and not-for-profit residential and nursing home places, private expenditure on which amounted to £2.2 billion in the United Kingdom, so approximately £1.8 billion in England.
2 Rule-of-thumb estimate derived from discussion with LaingBuisson.
some of the burden lifted from carers. The extra resource for that must come from somewhere, although it may not all need to be new money.
In this final section we set out options for change. Before we do so, however, we lay out the criteria against which, in our final report, we will judge proposals for any change to the health and social care settlement. They are:
n Are they equitable according to reasonable interpretations of equity?
n Do they deliver the highest quality of service from the available resources – a test that covers efficiency?
n Are they affordable now and likely to remain so under future demands for health and social care?
n Are they consistent with notions of individual and collective responsibility?
n Are they designed around, and are responsive to, the needs and preferences of users and carers?
n Are they transparent and capable of being clearly interpreted?
There are, of course, myriad ways of finding extra resources, but the broad options are:
1. using existing health and social care resources more efficiently
2. raising more private funding
3. raising more public funding.
Option 1 (more efficient use of existing resources)
Under this option, the possibilities include:
a. Productivity
Some of the extra resource may be achievable through greater productivity in both health and social care – in other words, getting better value for money out of the current £120 billion of public money currently spent on the two combined in England. Ask the question ‘is the current £120 billion being spent in the best possible way?’ and the answer is clearly ‘no’. There has, of course, to be a permanent search for efficiency and value for money, and continual change in the way services are provided as medical advance and other changes take effect. It would be as ludicrous for the NHS today still to have 36,000 TB beds, or keep people in hospital for days for procedures that can be done as day cases, as it would for benefit officers still to be handing out coal to poor pensioners as in the 1950s. What is provided and how it is organised has to adapt to changed circumstances in order for value for money and affordability to be achieved, and for spending on health and social care not to undermine the public finances.
In the NHS, as in all other health care systems, there are well-documented widespread variations in both costs and clinical outcomes. There will, of course, always be a spectrum of performance in any large health and social care system. But significantly greater value would be achieved if the costs and outcomes of the poorer performers were moved closer to those of the best. Equally, in social care, a recent Audit Commission study found unexplained variation in the costs of provision between similar councils. It calculated that such a variation could lead to improved value for money equivalent to more than £450 million if unexplained additional spending per head were reduced to the median in councils of similar type (Audit Commission 2013).
43
4: Hard choices and options
© The King’s Fund 2014

These would all be productivity gains leading to the existing money being better spent. New technologies may also help reduce costs – not just remote monitoring but possibly in the not-too-distant future, robotic assistance. A huge effort is under way to develop robots that might one day help in both health and social care. The use of apps and other internet-based tools remain in their infancy in both health and social care.
b. Shifting resources within health and social care to improve integration
A better-integrated system might be achieved by shifting resources out of acute hospital activity and into primary, community and social care. There is a widespread belief that better integration will itself provide additional cash for improved services. There is good evidence that where improved integration of health care, or health and social care, has occurred, both patient experience and outcomes improve (Thistlethwaite 2011; Bardsley et al 2013; Timmins and Ham 2013). There is, however, little evidence from the United Kingdom, the United States or elsewhere that improved integration is cash-releasing. Cost savings in the early years tend to be modest, and where financial gains do occur they sometimes emerge only after five or more years (Colla et al 2012; Bardsley et al 2013; Centers for Medicare & Medicaid Services 2013; Silow-Carroll and Edwards 2013). The current integrated care pilots may demonstrate otherwise.
c. End-of-life care
Care at the end of life is a contentious issue. As we have seen, a large slice of the lifetime cost of health care occurs in the final year or so of life, more or less regardless of the age at which people die. Many people express the wish to die at home but in fact die in hospital, and some relatives feel on occasion that there is excessive intervention. An independent review of palliative care commissioned by the government in 2010 recommended a series of pilots aimed at collecting the data needed to create a tariff for palliative care. Eleven such pilots have been launched. The review’s modelling, which the pilots will in part test, suggested that optimised services outside hospital – which will have a cost – could reduce the number of deaths in hospital by 60,000 by 2021, reducing hospital costs by some £180 million per annum (Hughes-Hallett et al 2011).
d. Rationing, or ‘limiting the NHS’
It is sometimes suggested that money could be saved – and perhaps more resource found for social care – by restricting the existing NHS package. This would entail reducing or eliminating access to certain procedures and treatments. It is often described as rationing, although the word is misused; rationing in fact means to give everyone a fixed portion of something without any particular assessment of need.
As a recent report from the Nuffield Trust argued at length, the idea has superficial attractions (Rumbold et al 2012). But experience from around the world shows it has distinct drawbacks, and to be far from always successful even as a means of cost containment.
The NHS already provides very little of the types of treatment most commonly suggested for exclusion – tattoo removal, for example, or various forms of cosmetic surgery not for repairing damage done by disease or accident, or in-vitro fertilisation as a treatment for infertility. All these conditions combined, however, along with the other ‘usual suspects’ for exclusion, amount to a tiny element of the NHS budget.
Creating a formally defined benefits package that sets out explicitly what the NHS does and does not cover would be a huge undertaking in the first place, as the Nuffield report argues, and there would be a major continuing exercise to keep it updated in the light of changing technologies and emerging evidence.
44 © The King’s Fund 2014
A new settlement for health and social care

Experiences from New Zealand, Chile, the US state of Oregon, Spain, Israel and Germany are not encouraging. There have been problems over enforcement and perverse outcomes in some cases. One of the best-known attempts to ration care was the Oregon approach that ranked treatments by priority and then set a cut-off decided by the budget available. It led to treatable cancer being excluded from the benefits package.
Furthermore, the NHS in practice already has a well-established and internationally respected method of deciding which treatments it should and should not provide in the form of the National Institute for Health and Care Excellence (NICE). It assesses the cost-effectiveness of new pharmaceuticals and technologies and makes recommendations on how freely they should be adopted. It also produces extensive guidelines on the best way to organise and deliver both health and social care services.
As a result, we endorse the Nuffield Trust’s conclusion that an attempt to create a national benefits package should not be made on the grounds it would be technically challenging to develop and enforce; would limit local autonomy and appropriate clinical judgement; would be vulnerable to lobbying and political pressure; and could well produce perverse and unintended outcomes. Likewise, a recent report from The King’s Fund concluded that the case is ‘weak’ for a national ‘menu’ of what the NHS provides (Maybin and Klein 2012).
Each of these approaches – improved productivity, improvements in end-of-life care, better integration, and ensuring that NHS money is spent on what is cost-effective – either will, or is likely to, release at least some resources that can be used in better ways. On their own, however, they are unlikely to provide the sums that we believe need to be injected into health and social care. That leads us on to the harder choices.
Option 2 (raising more private funding)
Under both options 2 and 3 – raising more private, or more public, funding – there are of course myriad possibilities. We have set out some of the more obvious ones, although in responses to this report the commission would welcome any other evaluated and costed ideas.
Most of the possibilities we outline come with only limited comments on their merits or demerits as we are keen to hear the views of others. In a few cases, however, we do present our initial conclusions on them.
The possibilities for raising more private funding include the following.
a. New or extended NHS charges
The commission underlines that it would certainly not support these merely as a means of raising more money for the NHS. But some may want them considered as one element of any new settlement that better aligns entitlements in health and social care.
The United Kingdom is unusual in both its low level of charges, and in its low level of total private expenditure on health – although the prescription charge in England is relatively high by international standards (see Appendix C, p 60, and the background paper The social care and health systems of nine countries, www.kingsfund.org.uk/barkerinterim). There are many options for extending existing charges, or for introducing new ones, and it must be stressed that in the broad-brush calculations that follow, no allowance was made for administration costs – which would vary by charge – or for bad debts or behavioural change (ie, alterations in demand either way in the face of a new or extended charge). There are various methods for extending existing charges:
45
4: Hard choices and options
© The King’s Fund 2014

n Acknowledge the fact that all pensioners are no longer poor pensioners. Remove the blanket exemption from prescription charges for those aged over 60, restricting free prescriptions for older people to those on pension credit. With the qualifications above that might raise around £1.5 billion.
n Do the same but increasing the exemption age to 65, and thereafter increasing it in line with rises in the state pension age. That would raise appreciably more money over time, but the Department of Health has no robust estimate of what that would be (Hansard (House of Lords Debates) 2014).
n Raise the prescription charge within existing rules – for example, from its current £8.05 (April 2014) to say £10, with a matching increase in the existing pre-payment certificate. This could perhaps raise £100 million.
n Removing all exemptions (including older people, younger people on low income, for maternity and for those who qualify on medical grounds), but lowering the prescription charge to 45 pence so that it still raised the current £450 million. Approximately 1 billion prescriptions are dispensed annually (Health and Social Care Information Centre 2013d). So a £1.45 charge with no exemptions would raise additional revenue of approximately £1 billion and a £2.45 charge around £2 billion a year.
It is important to note that there is already a pre-payment certificate available which limits the cost of prescription charges to either £29.10 for three months or £104 for a year. For someone who needs two medicines a month and has to pay, the saving on the annual certificate is £80 a year and £270 for someone needing four medicines a month (NHS Business Services Authority 2012). Removing exemptions need not expose people to unlimited bills for their medication. The charge for the pre-payment certificate could be altered in line with a revised charging regime, and electronic prescribing should make it possible for the cap to kick in automatically rather than people having to guess or know their medicine needs in advance.
n Extend charges for dentistry. NHS dental charges already raise some £650 million a year, covering more than 20 per cent of the cost of the service. The commission sees little room for extending those.
There are also options for introducing new charges. For these, a £10 charge has generally been used purely as a way of illustrating what various levels of charging could raise.
n A charge to visit the GP. This could be nominal (say £5) or substantial (£25). Countries such as New Zealand and Sweden have such a charge at the higher end of that range. There would doubtless be exemptions. Without exemptions, a £10 charge for visiting the GP, seeing a practice nurse or other primary care professional, or having a GP telephone consultation would raise around £3 billion, perhaps £2 billion if the charge were limited to seeing the GP. In England, a charge to visit the GP would almost certainly need to be accompanied by a charge to visit Accident and Emergency (A&E), without which demand on already overloaded A&E departments would rise. Charging £10 for A&E attendances might raise another £220 million.
n A charge for outpatient attendance. A £10 charge with no exemptions and the qualifications mentioned, may raise some £700 million a year, rising to £800 million if those who do not attend were also charged.
n A charge for hospital stays or hospital treatment. In the social care system, people are responsible for their accommodation costs whether they receive care at home or in a home, until the means tests limits are reached. Under the Dilnot reforms, residents will remain responsible for the first £12,000 of accommodation costs in a nursing or residential home. To align health care charges more closely to those in social care,
46 © The King’s Fund 2014
A new settlement for health and social care
there could be a charge per night for hospital stays – in effect for accommodation and meals. Partly due to medical advance, the average length of stay is falling – down from 7.9 days to 5.2 days over the past decade. So this would likely be a diminishing source of revenue over time, particularly if better integration reduces avoidable admissions. It would require a substantial administrative system. Before those costs, a £10 charge for each day in hospital, or day case, might raise around £500 million. A much simpler approach administratively would be a flat-rate charge per hospital procedure, whether as a day case, inpatient or outpatient, providing a nominal contribution to the costs. A £10 charge for each ‘finished consultant episode’ – a key measure of NHS hospital activity – might raise £180 million, or for each hospital ‘procedure’ some £100 million. A £50 charge would raise something closer to £900 million or £500 million respectively.
All new or extended charges could be made subject to an annual cap (as is the case, in pre-paid form, for prescription charges) either individually or cumulatively. That would reduce the revenue but ensure no one faced overwhelmingly large bills for health care.
b. Develop an insurance market and other financial products
An aspiration of the Dilnot commission was that once a cap was set on lifetime-assessed needs for social care, an insurance market would develop (to help cover the first £72,000 of costs, and the £12,000-a-year limit on accommodation costs). That has yet to happen perhaps unsurprisingly as the Dilnot reforms are not due to take effect until 2017, and the industry says it needs final details. Some are sceptical that such products will be developed (Lloyd 2014). The government and the insurance industry have recently launched a joint statement of intent on how they hope that will happen (Department of Health and the Association of British Insurers 2014). Were new charges to be introduced for NHS care, the commission hopes that the insurance market would also respond to that, with products possibly covering the spectrum of health and social care. It notes that health cash plans, which help smooth the cost of dentistry, optical products and some other types of health care, already exist. The financial services industry is also seeking to revive equity release plans to cover the costs of social care, and there have been proposals for care bonds and disability-linked annuities to provide cash for care (Lloyd 2014). These are all possibilities.
c. Provide tax relief on private medical insurance
The standard argument for tax relief is that more people taking out private medical insurance would lead to more people being treated in the private sector thus ‘lifting a burden’ off the NHS. That would leave it able to concentrate its resources on those unable or unwilling to pay. Australia – partly because it has a long history of mixed public and private funding for health care – is the country that has most actively pursued that policy in recent years. Its effects are disputed, but there are some very critical analyses of its overall effectiveness and there has been a high cost in foregone government revenue. As a result, the scale of tax relief there has recently been reduced (Robertson et al 2014).
There are various arguments against this for the UK context. First, since the 1980s, successive UK governments have operated on the principle that the state should not subsidise loss-making private sector enterprise, or businesses that cannot operate in the market.
The UK private health sector, as outlined in the background paper The UK private health market (see www.kingsfund.org.uk/barkerinterim), is unusual in its structure. It is expensive by international standards. It is capacity-constrained, not least because it shares its medical workforce with the NHS. Even in a more globalised market for medical practitioners, limits remain over the extent to which the medical workforce in the United Kingdom can be augmented – a fact illustrated by the Labour government’s
47
4: Hard choices and options
© The King’s Fund 2014

initial insistence that staffing for the independent sector treatment centres it introduced had to come from outside the country. That policy was partly driven by a desire to seek salaried skills in those centres, rather than paying the premium rates that NHS consultants seek in the private sector (see The UK private health market, www.kingsfund.org.uk/barkerinterim). It was also aimed at avoiding diversion of medical resources from the NHS, thus providing genuine additional capacity. In time, however, the policy was dropped, partly to seek better integration of the centres into NHS services, partly because such a policy of purely overseas recruitment was difficult to maintain.
In a capacity-constrained market, tax relief for private medical insurance is likely to result in inflation in the costs of a product that is already expensive as a limited supply of labour takes advantage of an increase in demand. If increasing demand pushed up pay more generally in the private health sector – for nurses, for example – that would over time be likely to translate into pressure for higher pay in the NHS.
There would be a considerable ‘deadweight’ cost as all those who currently have private medical insurance received relief on their premiums before there was any increase in the uptake of insurance. Given that it is chiefly those of working age who benefit from private medical insurance, it would enhance health care spending, quite possibly at higher prices, in the age range where there is least ‘need’ for health care. In other words there would be a ‘healthy/wealthy’ effect. Those of working age in employment, who have a relatively low demand for health care, would be subsidised to ‘opt out’ of the NHS by going private. The NHS would retain responsibility for older people, children and the chronically ill, on whom the bulk of spending goes – but there would be a lower tax take to fund that. For most in this latter group of patients, the premiums, even with tax relief, would be prohibitive even if pre-existing conditions did not exclude them from cover (see The UK private health market, www.kingsfund.org.uk/barkerinterim). In other words the government would lose a lot of income from the healthy and wealthy, via the tax relief, but the NHS would not lose a lot of business.
The United Kingdom has some limited experience in this area. Tax relief for private medical insurance was introduced for those aged over 60 at the level of basic-rate relief in 1989. It proved extremely poor value for money. It was abolished in 1997 by the incoming Labour government. At the time, it ‘saved’ the government £135 million in tax relief for the 550,000 people who were taking advantage of it, according to the Institute for Fiscal Studies. Its analysis found that somewhere between 2,500 and 7,000 people gave up their private medical insurance as a result of a 29.9 per cent increase in its cost as the tax relief disappeared. The increase in demand on the NHS, it calculated, would have been ‘substantially lower’ than the £135 million cost to government of the subsidy (Emmerson et al 2001).
The study also asked whether such a rebate could ever be self-financing in terms of reduced demand on the NHS. It concluded that ‘this is unlikely to be the case, largely because a subsidy would benefit current holders of PMI (private medical insurance) while the saving to the NHS would only stem from the additional policies that would be sold due to the subsidy’ (Emmerson et al 2001, p 62).
Tax relief for private medical insurance significantly breaches two of our criteria for assessing changes. It would not be equitable, and given the structure of the private medical sector it would not be an efficient use of resource. The risks of a genuinely two-tier level of care are obvious, beyond the current differentiations in access for those who currently hold private medical insurance, or pay themselves for private treatment.3
48 © The King’s Fund 2014
A new settlement for health and social care
3 The NHS is not a single-tier system at present. There are widespread variations in the quality, cost and effectiveness of care within it. The same, however, applies to the private sector. For instance, Bupa in 2006 estimated that health care costs in private hospitals could be lowered by almost a third if three-quarters of consultants adopted the same clinical practices as the most efficient quarter of consultants (LaingBuisson 2011b, p 170).

It would also reinforce the divide between health and social care funding that we wish to abolish. In addition, there is some evidence that those who hold private medical insurance are less willing to support increases in public spending on health, when a key strength of the NHS is that it operates in effect as one giant, compulsory insurance pool. Tax relief for PMI could reduce the willingness of those taking advantage of it to contribute to a service that most still in fact rely on at the minimum, for emergency care, and in most cases for mental health, maternity and primary and community care. We also take the view that having articulate middle-class patients using the NHS helps underpin its quality. We share the view of the Prime Minister David Cameron, who in a speech at The King’s Fund in 2006 declared that ‘we should not use taxpayers’ money to encourage the better-off to opt out, when rising expectations demanded a better NHS for everyone’ (Cameron 2006).
This is a change we are not minded to support.
d. Introduce a ‘patient passport’
For similar reasons, the commission is also not minded to support ideas along the lines of the ‘patient passport’ that was Conservative Party policy at the general election of 2005. It was in relation to the patient passport that Mr Cameron made the remarks quoted above. Under this proposal, patients would be able to take the average cost of their treatment in the NHS and spend it in the private sector, topping that up if need be to afford the cost of private sector care. Given private sector costs, it would almost certainly need to be topped up. It suffers from many of the same drawbacks as tax relief on private medical insurance.
e. Remove tax disincentives on health and wellbeing programmes
The commission would stress that it is not opposed to private medical treatment per se. It is happy to see a thriving private sector operating alongside the NHS. It just believes that it should not be subsidised by the taxpayer.
Tax changes have also been advocated for employer health and wellbeing programmes. More than 140 million working days a year are lost to sickness absence in the United Kingdom and a significant but not unrealistic reduction in that could increase economic output by more than £150m, according to an independent, but government-commissioned, review (Black and Frost 2011). Given that people in full-time work spend around half their waking time there, the workplace is an obvious location within which to promote health and wellbeing, and to provide early interventions to deal with stress, depression, obesity and musculoskeletal conditions that can lead to absence.
Employers themselves have begun to see benefits of such programmes in terms of recruitment, retention and business output. Over time they could quite possibly postpone and/or diminish health and social care costs, by tackling smoking, excess alcohol consumption, diet and the absence of physical activity. At present, however, early interventions such as physiotherapy or counselling are taxable for employees as a benefit in kind.
A government review has recommended relief at the basic rate of tax. The coalition is currently completing a consultation on a proposal that both goes further and less far (HM Treasury 2013). It is planning to introduce a tax exemption for interventions once an employee has been certified as being off work for a specified period – currently four weeks is proposed. In the interests of simplicity it will apply at marginal rates of tax, not just the basic rate, but it will be capped at £500 per employee per year. The commission would be interested to hear if there is a strong case for going further.
49
4: Hard choices and options
© The King’s Fund 2014

Option 3 (raise more public finance)
There are at least two large-scale (macro) changes here, plus a huge array of possible more micro ones. The large-scale changes include:
a. Introducing a hypothecated tax for health and social care
This could be a purely presentational measure, but it could also be a revenue-raising one. The argument in favour is that people would see more clearly how much of their tax was going to health and social care.
In 2010/11 National Insurance in the United Kingdom raised some £101 billion. Add in another £16 billion from tobacco, wine and spirit duties – what might be dubbed ‘sin taxes’ – and the £117 billion total gets within sight of the £120 billion or so of public money spent on health and social care in England. That raises the possibility that these taxes, with some adjustment, could be used as an earmarked ‘health and social care tax’.
There is a superficial attraction to such ideas, and indeed – as in some parts of the United States – other ‘sin taxes’ on sugary drinks or unhealthy fatty foods could be added in, with the revenue spent on health and social care.
These ideas are not without their problems, however. It is true that the link between what people pay in National Insurance and the benefits they receive as a direct result has become progressively weaker over the past 40 years. However, paying National Insurance does still bring some benefit to those who become unemployed, although less so than in the past. It also qualifies people for state pensions and some other benefits. A way would have to be found of retaining qualification for those if National Insurance became a health and social care tax.
Furthermore, the Treasury has a long-standing dislike of hypothecated taxes for reasons which some on the commission share. The objections are that the tax base rarely moves in line with the spending needed. In addition, too much hypothecation may leave taxes for less popular purposes, such as welfare for some, or defence for others, facing the issue of more reluctance to pay. But the idea still has attractions, and the commission would be interested in worked-up ideas of how a hypothecated tax might be adopted.
b. A wholesale switch to classic social insurance
A switch to a classic social insurance model is sometimes advocated, on two grounds. First, like hypothecation, it might make the cost of the health and social care system more transparent to taxpayers; and second, it is used in some continental countries that on some measures appear to perform better than the NHS – although in each of those cases it should be noted that they also spend more.
However, as set out in Appendix C, p 60, on the international context, there is no good evidence that any particular form of health care funding produces consistently better results than any other. As a recent OECD study notes:
…there is no health care system that performs systematically better in delivering cost-effective health care. In fact, the efficiency estimates vary more within country groups sharing similar institutional characteristics than between groups. Countries performing well can be found in all groups, and countries doing poorly are also present in most groups. In other words, big-bang reforms are not warranted.
(OECD 2010)
In the context of a big switch to social insurance – the precise design of which would be a huge undertaking – we endorse the OECD view. We are also minded not to go down this route on economic grounds. Classic social insurance involves a tripartite system in which
50 © The King’s Fund 2014
A new settlement for health and social care

employers and employees pay in and the state – the taxpayer – also contributes. In other words, a significant part of the cost of health care is met by a tax on wage-earners. In our case, given that we want a single, ring-fenced, public budget for health and social care that would mean a significant part of the cost of both health and social care was met by such a tax, and probably by a reduction in the revenue received from expenditure taxes.
In an increasingly globalised economy, this would be the wrong route to go down – not least because of the potential effects of an ageing population on the support ratio of workers to non-working pensioners. In addition, it is highly uncertain that the outcome would be better services for patients, and it is reasonably likely that the switch would damage the UK economy. In so far as there has been change in the mainland European health care systems that use social insurance, it has been to introduce more general taxation into them to help relieve the burden on employers. The commission is therefore minded to recommend against such a move.
It also notes that in the most intensive government review of alternative funding arrangements made public in the past 66 years – the Conservative review of the NHS under Margaret Thatcher in 1988 – the then chancellor Nigel (now Lord) Lawson, who was at the heart of it, concluded that seeking to change the NHS from tax funding to any of the systems used elsewhere in the world would ‘simply be out of the frying pan and into the fire,’ later adding ‘and not such a bad frying pan after all’ (Lawson 1992).
That does not mean that there may not be a role in future for some form of social insurance in this area. But it does mean that the commission does not believe that there should be one that puts a large element of the cost on employment taxation.
There are numerous other ways in which more public finance could be raised for health and social care, including simply increasing general taxation. Among the more targeted possibilities are:
a. Diverting existing benefits
n Attendance Allowance is already part of social care, but is paid through the benefit system rather than through social care funding. It is a non-means-tested benefit that assists those who need frequent help or constant supervision during the day, or supervision at night, or both. It also provides help to people who are terminally ill. It currently costs £4.46 billion in England and reaches far more people than the social care system itself – some 1.3 million against the 530,000 who receive local authority-supported domiciliary care. Means testing it would raise small amounts initially but perhaps £1.5 billion by 2020 and more than £2 billion by 2025. Alternatively, its value could be frozen, saving perhaps £800 million by 2020. Or it could be subject to income tax though relatively few of its recipients pay tax (Lloyd 2014).
n Means test the winter fuel allowance and free TV licences for the over-75s at the level of the pension credit, and divert the money into health and social care. That could raise about £1.4 billion a year, according to the IFS paper Pensioners and the tax and benefit system (Adams et al 2012).
n ‘Free’ bus passes and concessionary travel. These cost around £1 billion in 2010/11, although not all of this was for free bus passes for the older generation (Adams et al 2012, p 22). Given the different authorities that provide it, means testing it would be difficult. However, it might be possible to tax higher-rate taxpayers on the benefit, given that they all fill in self-assessment forms.
There is a broader argument that other elements of age-related spending – for example, pensions – could be diverted into health and social care given that spending on older people is taking a rising proportion of all government expenditure. However, spending on
51
4: Hard choices and options
© The King’s Fund 2014
pensions and other benefits for those past state pension age is usually there for a well-defined purpose – usually income support. Re-allocation would be politically contentious. We note, however, that new or extended charges, and some of the propositions that follow, would have the indirect effect of diverting such spending into health and social care.
b. Changes to the tax regime for pensions4
n Levy National Insurance contributions on private pensions in payment. This is a complex issue with the arguments clearly set out in the IFS paper (Adams et al 2012, pp 29–31). Employees pay National Insurance on their pension contributions when they pay into them, but not on the pensions they receive. That position could be reversed, and the IFS estimates that each 1 per cent of National Insurance contributions levied on pensions in payment would raise £350 million – the standard rate of employee National Insurance is 12 per cent. Its introduction overnight would imply double taxation on pensions in payment given that National Insurance contributions (NICs) will have already been paid on the contributions. Phasing it in would have up-front costs.
n Levy National Insurance contributions on employer contributions to pensions. Employer contributions are currently exempt from National Insurance and are the only major form of employee remuneration that escapes such contributions. The IFS has argued that ‘it is hard to justify extraordinarily generous NICs treatment of employer pension contributions’ (Emmerson 2014). Making National Insurance payable on such contributions would raise an estimated £10.8 billion a year, assuming employer contributions continued at the same level.
n Scrap the ‘tax-free’ pension lump sum. Individuals can take 25 per cent of whatever pension funds they have built up as a tax-free lump sum on retirement. It is effectively a ‘bonus’ that people receive in exchange for having had the foresight to contribute to a pension. For the relatively few people who have saved the maximum that the taxpayer will subsidise through pension tax relief, it is worth £312,500 tax-free. Scrapping it would bring in another £2.5 billion in tax revenue (Emmerson 2014).
n Restrict tax relief on pension contributions to the basic rate of tax. Potentially this could raise a large sum – some £9.5 billion a year according to the IFS. It would, however, be administratively complicated, and it would be likely to have big behavioural effects on pension saving. There are many intermediate steps possible between the status quo and complete abolition of higher-rate relief – for example introducing a ‘matching grant’ for pension saving that is more generous than basic relief but less generous than the current higher marginal rates (Agulnik and Le Grand 1998). Depending on the design, these intermediate steps could raise some additional revenue – though much less than £9 billion – while still leaving in place a significant tax incentive to save.
c. Apply National Insurance to those working on past state pension age
At present, those working past state pension age do not pay either employee’s or self-employed National Insurance, although their employers do. Removing the exemption would raise some £800 million a year, according to the IFS (Adams et al 2012). The amount would fall as state pension age increases, but it is equally likely that there will be an off-setting rise as more people work on as state pension age rises.
52 © The King’s Fund 2014
A new settlement for health and social care
4 These options pre-date the changes to pension taxation outlined in the March 2014 Budget, which have not been taken into account.

d. Forgiveness of capital gains tax at death
Assets that are bequeathed to another individual at death are exempt from capital gains, with the base price taken to be the value of the asset at the point of inheritance if that individual later sells it. This relief reduced capital gains tax revenues by £600 million in 2011/12, according to HM Revenue and Customs (HMRC), and it is a benefit that goes only to wealthy estates, according to the IFS. It produces, according to the Mirrlees Review of the tax system, ‘bizarre distortions’ encouraging people to hold on to assets until they die rather than sell them.
e. Increase inheritance tax
Inheritance tax currently raises just less than £3 billion a year. Changes that the current government has made to its thresholds, partly in response to Dilnot, will raise that to around £4 billion by 2017/18. The commission would like to believe there is scope to go further as a contribution towards a more generous health and social care system. Inheritance tax is currently levied on estates worth more than £325,000 for a single person, although that figure can double where married or civil partners have passed on their allowance. These thresholds have been frozen until at least 2017/18 to help meet the costs of the Dilnot reforms. As the increase of £1 billion in revenue illustrates, it is freezing or lowering the threshold that raises serious sums of money. Increasing the rate at which it is paid – already 40 per cent – would be likely to increase revenue by only some £100 million a year for each 1 per cent increase, according to HMRC (HMRC, no date).
Inheritance tax, however, is plagued by tax avoidance. The wealthiest can indulge in tax planning to avoid it to the point where it has repeatedly been described as almost a voluntary tax for those at the upper end of the wealth distribution. Thus it is mainly paid by those with relatively modest estates. Were serious efforts to be put into reducing the scope for tax planning and avoidance, inheritance tax could make a significant contribution to extra funds for health and social care. We would be interested to hear about ways this could be done.
f. Levies on death
Aside from inheritance tax there are other ways of reclaiming an element of health and social care costs on death. These have perjoratively been described as ‘death taxes’, although inheritance tax can itself be viewed as a death duty or ‘death tax’ as well as a tax on the inheritors of estates. Under the Dilnot proposals, to avoid individuals having to sell their homes, the government is committed to an approach where charges that are due for social care can be rolled up and paid out of the estate of the deceased. Such an approach might also be adoptable for additional charges for the NHS, were they to be introduced.
g. Impose VAT on private health care
Private health care is currently, in the main, exempt from VAT, although private medical insurance is subject to 6 per cent insurance premium tax. Imposing VAT at the standard rate on private treatment might raise £1.3 billion.
There are of course many other tax changes that could be made, and we welcome suggestions for those and for other ways of raising private finance, or for using existing resources more effectively. We note that some of the possibilities we have raised would have implications for Scotland, Wales and Northern Ireland, as a number of them are matters still reserved for the UK government.
We have tended – though not exclusively – to concentrate on suggestions for raising public finance that would have some impact on the older generation. We have done so
53
4: Hard choices and options
© The King’s Fund 2014

because we have some sympathy with the view of the Dilnot commission that if extra revenue is to be raised, at least some of it should come from them. First because they are among those who will benefit most from a seamless, integrated, ring-fenced and larger health and social care budget. If our final proposals were to involve some rebalancing of what is paid for in health and social care, they may pay a bit more for health care but will benefit significantly from improved provision of social care. Second, because, as we have noted, those now close to state pension age and the recently retired are so much notably more affluent on average than their predecessors – even if in the much longer run that may cease to be the case due to the current crisis in pension saving. In 10 to 20 years’ time that crisis may mean that, if some of these proposals were to be adopted, the precise sources of public revenue would have to change.
Call for responsesIn this interim report we have argued that the current health and social care settlement in England is no longer fit for purpose. The time has come to move beyond what The King’s Fund has argued for some years now – that we need to think differently about health and social care. We now need to act differently.
In response to this interim report we would warmly welcome views on five issues:
1. Do you agree with our conclusion that a new settlement in health and social care is needed?
2. If so, do you support our proposition for a single, ring-fenced budget for health and social care which is singly commissioned, and within which entitlements to health and social care are more closely aligned?
3. Should the aim be to achieve more equal support for equal need, regardless of whether that support is currently considered as health or social care?
4. If your answer is yes to question three, should social care be more closely aligned with health care (that is, making more social care free at the point of use)? Or should health be aligned more closely with social care (that is reducing the extent to which health care is free at the point of use)?
5. Do you think that adequate funding for health and social care requires:i) Increased charges in the NHS? If so, for what?ii) Increased charges for social care? If so, for what?iii) Cuts to funds from other areas of public spending, re-allocating it to health and
social care? If so, from what? iv) An increase in taxation? If so, which taxes would you favour increasing?v) None of the above? If you answer yes to this, is it because you think that funding
for health and social care is adequate, and that extra demands can be met by using existing resources more efficiently? Or is it for some other reason?
vi) All of the above? If you answer yes to this, and think that elements of all or some of these changes may be needed, which mix would you favour, and to what degree?
54 © The King’s Fund 2014
A new settlement for health and social care
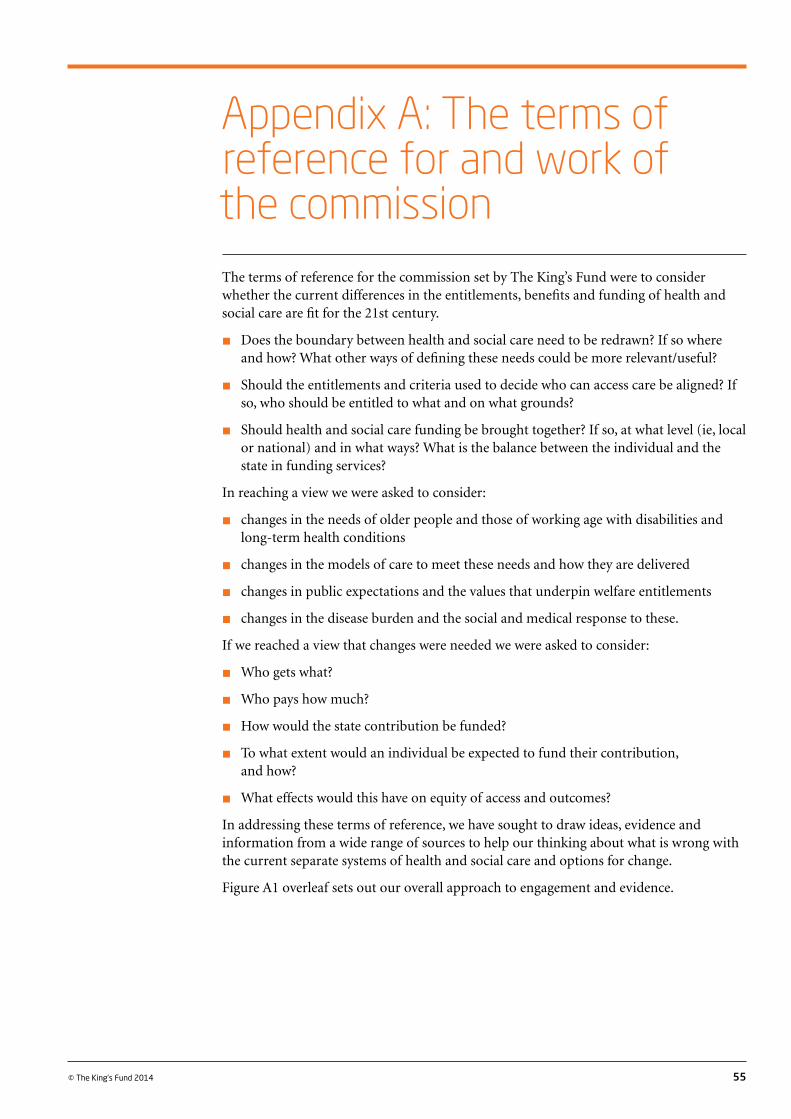
55© The King’s Fund 2014
The terms of reference for the commission set by The King’s Fund were to consider whether the current differences in the entitlements, benefits and funding of health and social care are fit for the 21st century.
n Does the boundary between health and social care need to be redrawn? If so where and how? What other ways of defining these needs could be more relevant/useful?
n Should the entitlements and criteria used to decide who can access care be aligned? If so, who should be entitled to what and on what grounds?
n Should health and social care funding be brought together? If so, at what level (ie, local or national) and in what ways? What is the balance between the individual and the state in funding services?
In reaching a view we were asked to consider:
n changes in the needs of older people and those of working age with disabilities and long-term health conditions
n changes in the models of care to meet these needs and how they are delivered
n changes in public expectations and the values that underpin welfare entitlements
n changes in the disease burden and the social and medical response to these.
If we reached a view that changes were needed we were asked to consider:
n Who gets what?
n Who pays how much?
n How would the state contribution be funded?
n To what extent would an individual be expected to fund their contribution, and how?
n What effects would this have on equity of access and outcomes?
In addressing these terms of reference, we have sought to draw ideas, evidence and information from a wide range of sources to help our thinking about what is wrong with the current separate systems of health and social care and options for change.
Figure A1 overleaf sets out our overall approach to engagement and evidence.
Appendix A: The terms of reference for and work of the commission
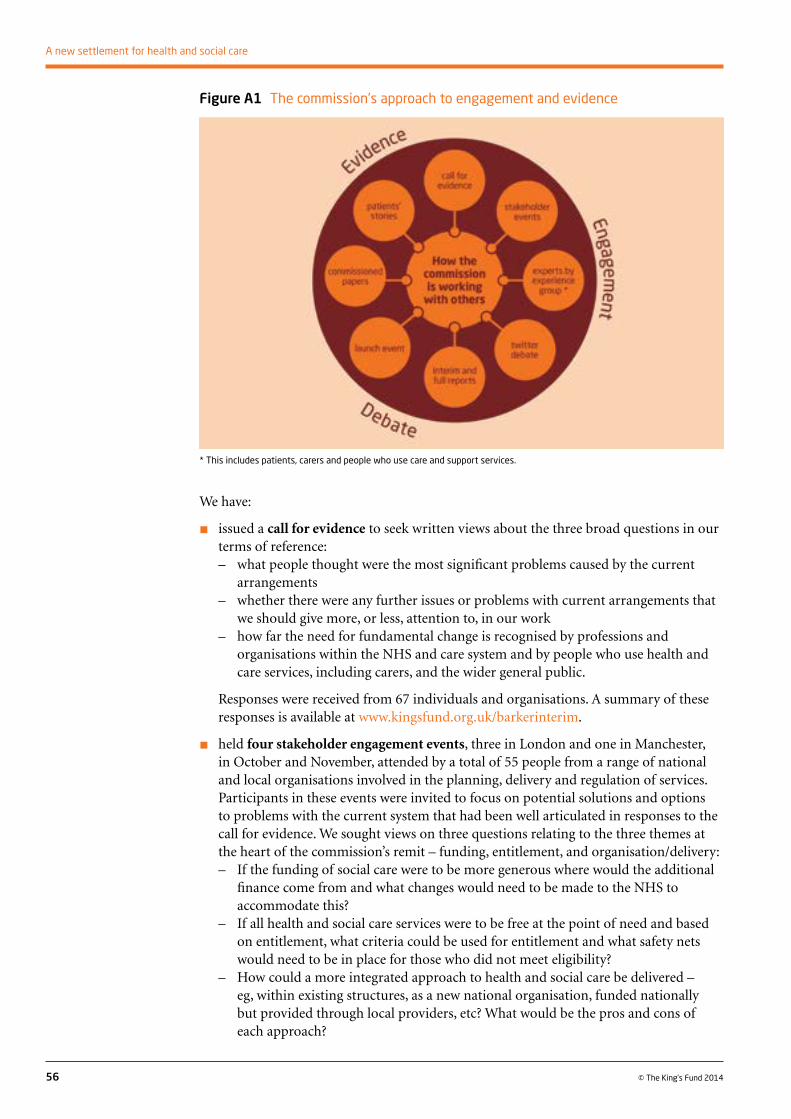
We have:
n issued a call for evidence to seek written views about the three broad questions in our terms of reference:– what people thought were the most significant problems caused by the current
arrangements– whether there were any further issues or problems with current arrangements that
we should give more, or less, attention to, in our work– how far the need for fundamental change is recognised by professions and
organisations within the NHS and care system and by people who use health and care services, including carers, and the wider general public.
Responses were received from 67 individuals and organisations. A summary of these responses is available at www.kingsfund.org.uk/barkerinterim.
n held four stakeholder engagement events, three in London and one in Manchester, in October and November, attended by a total of 55 people from a range of national and local organisations involved in the planning, delivery and regulation of services. Participants in these events were invited to focus on potential solutions and options to problems with the current system that had been well articulated in responses to the call for evidence. We sought views on three questions relating to the three themes at the heart of the commission’s remit – funding, entitlement, and organisation/delivery:– If the funding of social care were to be more generous where would the additional
finance come from and what changes would need to be made to the NHS to accommodate this?
– If all health and social care services were to be free at the point of need and based on entitlement, what criteria could be used for entitlement and what safety nets would need to be in place for those who did not meet eligibility?
– How could a more integrated approach to health and social care be delivered – eg, within existing structures, as a new national organisation, funded nationally but provided through local providers, etc? What would be the pros and cons of each approach?
56 © The King’s Fund 2014
A new settlement for health and social care
Figure A1 The commission’s approach to engagement and evidence
* This includes patients, carers and people who use care and support services.

A summary of these discussions is available at www.kingsfund.org.uk/barkerinterim. The events were enhanced by the use of graphic facilitation – by Anna Geyer of New Possibilities – to capture visually the ideas and issues that were raised. Video interviews with some of leaders who attended the events can be found at: www.kingsfund.org.uk/barkercommission
n established an advisory group of ‘experts by experience’ to ensure that the commission’s thinking is rooted in an understanding of the lived experience of people with a mixture of health and social care needs; their experience of the current health and care systems and their ideas about options for different arrangements. Commissioners have benefited immensely from meeting with the experts and receiving their comments on current and future arrangements already. The input of the experts will be even more important as commissioners move towards the decisions that will form their final recommendations. The membership of the group is provided at the beginning of the report. In addition to the evidence of the experts by experience group, we were pleased to receive stories from individual patients and service users, as part of the call for evidence.
n commissioned four papers to help our knowledge and thinking about particular issues. They are published alongside this report (www.kingsfund.org.uk/barkercommission):– The social care and health systems of nine countries describes models of entitlement
to and funding of health and care in other advanced countries, including any recent reform initiatives and key issues and challenges facing each country. We have benefited from the advice of Mark Pearson, Head of Health at OECD, as our international adviser.
– Attitudes to health and social care draws together survey data, polling and engagement exercises to help us understand the public’s views about how health and social care is funded, the entitlements they currently have and how they might view potential changes to these existing arrangements.
– Options for funding care, written by James Lloyd of the Strategic Centre, identifies and evaluates a range of potential sources of revenue to fund expenditure on social care, including options involving the use of NHS resources and the potential implications for the integration of commissioning, funding and delivery.
– Social values in health and social care, written by Professor Anthony Culyer of York University, discusses the importance of moral values in considering different approaches to designing, delivering and funding health and social care, recognising that policy decisions cannot be based on economic or technical analysis alone.
n held nine formal meetings as well as attending the above events and other meetings
n made available a variety of material about our work on the Barker Commission website including a set of infographics about the future of health and social care (www.kingsfund.org.uk/audio-video/commission-future-health-and-social-care-england-infographics) and an audio-visual slideshow about the shifting nature of the health and social care divide (www.kingsfund.org.uk/audio-video/nicholas-timmins-shifting-nature-health-and-social-care-divide).
57
Appendix A: The terms of reference for and work of the commission
© The King’s Fund 2014

58 © The King’s Fund 2014
Appendix B: Data
Source: Office of Health Economics (2014)
Note: This compares pensioners’ net income before housing costs with the rise in average earnings – a measure that ignores other sources of income for those in work. It nonetheless illuminates how well pensioners have done on average over the past decade.
Source: Department for Work and Pensions (2013)
Figure B1 NHS sources of finance, 1949–2011Highs and lows of various finance sources highlighted
Figure B2 Real growth in pensioners’ incomes and working-age earnings, since 1996/7
Per
cen
t1
99
8/9
= 1
00
(bef
ore
hous
ing
cost
s)
100
90
80
70
60
50
40
30
20
10
0
150
140
130
120
110
100
90
80
Year
Year
19972000
20032006
19791982
2001/2
2007/8
2000/1
2006/7
2003/4
2009/10
2002/3
2008/9
2005/6
2011/12
2004/5
2010/11
19851988
19911994
20091961
1964
1998/9
19671970
1999/00
19731976
19491952
1996/7
19551958
1997/8
Taxation
NHS contribution from National Insurance
Patients’ payments
Average Earnings Index after inflation
Pensioners’ net real income growth
1974: 91%
1962: 74%
1956: 6.4%
1960–62: 5%1954: 5%
2004: 21.5%
2011: 1.2%

59
Appendix B: Data
© The King’s Fund 2014
Source: Cribb et al (2013)
Figure B3 Pensioner income sources by pensioner income quintile
900
800
700
600
500
400
300
200
100
0
-100
Cont
ribu
tion
to
inco
me
(£ p
er w
eek)
Pensioner income quintile
1 2 3 4 5 All 1 2 3 4 5 All
1978–80 2011–12
State pensions and other benefits
Private pensions
Savings and investments
Earnings and self-employment income
Other
Deductions
Source: OECD (2011)
Figure B4 Caregiving varies by country and type of help provided: percentage of the population reporting to be informal carers providing help with activities of daily living
Per
cen
t
20
18
16
14
12
10
8
6
4
2
0
Country
Austra
lia
Netherla
nds
Czech
Republic
France
Switzerla
nd
Germany
Belgium
Ireland
United K
ingdom
Denmark
Austria
Poland
Sweden
Greece
Italy
Spain
8.08.7
9.3 9.810.3
10.7 10.8 11.0 11.2 11.412.0 12.1
14.615.2 15.3
16.2

60 © The King’s Fund 2014
This simple question is remarkably difficult to answer – despite the emergence over recent decades of an industry of academics, consultants, think tanks and international organisations seeking to address it.
Medicine long ago became a globalised activity with clinicians learning new techniques and treatments from each other across the world. There has been much learning about the management and organisation of services (Bate et al 2008). But whole system comparisons are fraught with difficulty, plagued by different definitions of data, by what weight to give to which factor of assessment, and by the fact that measuring health outcome from treatment remains in its infancy even as it becomes increasingly sophisticated.
Recent attempts at whole system comparisonsProbably the most heroic attempt to compare health systems was made by the World Health Organization in 2000. Using a number of measures that included outcomes, responsiveness, fairness of financial contributions and health expenditure per head, it ranked 191 countries producing a result that put France at the top, the United Kingdom at 18 and the United States at 37. San Marino at 3, Singapore at 6 and Oman at 8 all out-performed the United Kingdom and the United States on the measures chosen (WHO 2000). The exercise was so controversial that the organisation has never repeated it.
On measures of the burden of disease – with health care as well as lifestyle having an effect on that – the United Kingdom emerged as 12th among 19 developed countries in a recent study (Murray et al 2013). Comparisons for the outcome of treatment for particular conditions – cancer, heart disease or diabetes, for example – produce mixed results. The United Kingdom sometimes scores quite highly on these and sometimes distressingly low. Relating either of these last two types of result to the funding and entitlements in particular health systems is remarkably difficult.
Academics tend to divide health-funding systems into three broad categories: the tax-funded systems like those in the United Kingdom, New Zealand and many of the Nordic countries; social insurance systems such as in France and Germany; and those more heavily reliant on private health insurance such as the United States and the Netherlands.
No country, however, has a pure version of any of these systems. To a greater or lesser extent, they all contain a mix. Thus in the United States, which relies heavily on employer-based and individual private insurance, half of all health spending is in fact tax-financed, chiefly through Medicare, the federally financed programme for older people, Medicaid, the programme for the most disadvantaged, and the Veterans Administration which cares for former armed services personnel. Even the United Kingdom, which by international standards has little in the way of charges for health care in the public system, still raises more than £1 billion a year from charges for prescriptions, dentistry and other services (Department of Health annual report and accounts 2012–13). In recent years, in so far as there has been change, both France and Germany have been injecting more general taxation in to their social insurance-based approach.
Appendix C: The international context: How much greener is the grass elsewhere?

61
Appendix C: The international context: How much greener is the grass elsewhere?
© The King’s Fund 2014
There is no good evidence that any one of these approaches offers clear-cut advantages over the others in terms of the results produced.
A recent OECD study grouped health care systems into a somewhat more sophisticated set of categories and then attempted to measure their efficiency – efficiency being only one measure of a health system’s effectiveness, but an important one in terms of value for money (OECD 2010).
* Calculated using data envelopment analysis, see OECD (2010)
Source: OECD (2010)
Figure C2 Efficiency per country as measured by potential gains in life expectancy
Pot
enti
al g
ains
in li
fe e
xpec
tanc
y (y
ears
, DEA
)*
Country groups (see Figure C1, above)
0 1 2 3 4 5 6
5
4
3
2
1
0
SVK
BEL
GRCLUX
SWE
DNKHUN
NLD
FRA
AUT
TURESPPRT
IRL
NOR
DEU
CAN
CZE
FINGBR
NZL
CHEAUS KOR
JPN ISL
MEX
POLITA
Source: OECD (2010)
Figure C1 Groups of countries sharing broadly similar institutions
Reliance on market mechanisms in service provision Mostly public provision and public insurance
Private insurance for basic coverage
1
Germany Netherlands Slovak Republic Switzerland
Private insurance beyond the basic coverage and some gate-keeping
2
Australia Belgium Canada France
Little private insurance beyond the basic coverage and no gate-keeping
3
Austria Czech Republic Greece Japan Korea Luxembourg
No gate-keeping and ample user choice of providers
4
Iceland Sweden Turkey
Public insurance for basic coverage Gate-keeping
Limited user choice of providers and soft budget constraint
5
Denmark Finland Mexico Portugal Spain
Ample user choice of providers and strict budget constraint
6
Hungary Ireland Italy New Zealand Norway Poland United Kingdom

62 © The King’s Fund 2014
A new settlement for health and social care
Major changes to health care funding are rareSave for times of war or revolution – either physical or intellectual – it is very rare for a country fundamentally to change the way it finances its health care.
Examples of war include the United Kingdom, whose model for health care emerged out of the sense of solidarity engendered by the Second World War and out of the Beveridge report, the last in a long chain of reports and analyses that had called for a public medical service. Big changes were made to the way health care was financed in Eastern European countries after the fall of the Berlin Wall.
There are exceptions to the war and revolution theory. The Netherlands has moved, over 20 years, from a classic social insurance model to one that looks much more like a compulsory privatised funding system and Ireland appears to be heading down a similar path.
But even when countries have made significant changes, they are frequently a development of pre-existing arrangements. For example, the introduction of Medicare and Medicaid in the United States in the 1960s did involve a large increase in tax-funded health care. But even those programmes, Medicaid in particular, have roots that go back much further (Moore and Smith 2006). It is also notable that the major change the United States is currently undergoing with ‘Obamacare’ involves extending private insurance to the uninsured, with subsidies, rather than simply introducing a new, entirely federally funded system – again reflecting its existing arrangements. Equally Australia made a big switch to tax relief for private medical insurance but had always had a significant private sector that enjoyed some tax relief.
This is what academics call ‘path dependency’. The way a country organises its health and social care is heavily dependent on its history, culture and small ‘p’ politics. This can be illustrated in small ways, as well as when looking at system design. For example, in New Zealand, most patients pay a significant sum to see the GP – £20 to £25 and more for out-of-hours. Yet in Canterbury, New Zealand, for example, a 24-hour GP surgery treats as many patients a year out-of-hours as the local accident and emergency (A&E) department as patients are willing to pay £30 to £40 for a visit because they always have (Timmins and Ham 2013). The suspicion in the United Kingdom would be that a significant charge for out-of-hours GP care would be likely to result in even more patients flooding to A&E out-of-hours, because patients are not used to paying to see the doctor.
Recent examples of changes in social care fundingIt is true that when it comes to social care, there are examples of more radical changes in funding structures, introduced to try to adapt to ageing societies. Germany introduced a separate social insurance scheme for long-term care in 1995, though again building on its tradition of social insurance. France, which uses social insurance for health, introduced a tax-funded scheme for long-term care in 2002. Japan, which for health has a social insurance approach mainly run through employers, introduced a separate long-term care insurance in 2000 which is half funded by employee and pensioner contributions and half by taxation. The commission remains interested in the potential of a social insurance scheme for social care, but fears it would cut across its goal of producing a more seamless health and social care system.
The essential point remains that fundamental changes in funding – such as, for example, switching England from a tax-funded system to a social insurance one – are rare and difficult, and it is not clear that they would be guaranteed to offer significant benefit.

63
Appendix C: The international context: How much greener is the grass elsewhere?
© The King’s Fund 2014
UK spending on health compared to international levelsIn terms of expenditure on health care – and given the important qualifier that there is no ‘right’ level – the United Kingdom spends at slightly above the average for the 27 EU countries (9.6 per cent of GDP against the EU-27 average of 9 per cent).
This still leaves the United Kingdom spending appreciably less than some countries that many people in England might wish to compare themselves against – the Netherlands at 12 per cent, France and Germany at 11.6 per cent, Canada at around 11 per cent, New Zealand, Denmark, Austria and Portugal, for example. These relatively small percentage differences are large sums of money – 1 per cent of GDP in the United Kingdom is around £15 billion.
Relatively little private spending in United KingdomWhat is also notable from this data is that out of total health spending, public and private combined, the United Kingdom spends relatively little privately – with the definition of private here including NHS charges, private medical insurance and private out-of-pocket expenditure, plus spending on over-the-counter medicines.
The United Kingdom spends just 1.6 per cent of GDP privately against an EU average of 2.4 per cent. Some of the tax-funded Scandinavian countries are close to the UK figure –
1 Total expenditure only. 2 Data refers to 2010. 3 Data refers to 2008.
Source: OECD Health Statistics (2013a)
Figure C3 Total health expenditure as share of GDP, 2011 (or nearest year)
Current
Capital
Per
cent
age
of G
DP
20
18
16
14
12
10
8
6
4
2
0
Country
17.7
11.911.6
11.311.2 11.0 10.9 10.810.5
10.3 10.2
9.6 9.5 9.4 9.3 9.3 9.3 9.2 9.1 9.0 9.0 8.9 8.9 8.9 8.98.5
7.9 7.9
0
7.7 7.5 7.5 7.4
6.1
6.9
5.9
6.6
5.2
6.2
3.9
6.2
2.7
United Sta
tes
Netherla
nds
France
Germany
Canada
Switzerla
nd¹
Denmark
Austria
Belgium
New Zealand
Portugal
Japan²
Sweden
United K
ingdom
OECD34Spain
Norway
Italy
Greece
Iceland¹
Finland
Austra
lia²
Ireland
Brazil
¹
Slovenia
South Afri
ca¹
Slovak R
epublic
Hungary
Israel¹
Chile
Czech
Republic
Korea
Poland
Luxe
mbourg
Russian Federa
tion¹
Mexico1,2
Turkey³
Estonia
China¹
India¹
Indonesia
¹

64 © The King’s Fund 2014
A new settlement for health and social care
Denmark, Sweden and Norway for example. But Germany, Austria, France and Spain all spend at least a percentage point of GDP more – around £15 billion more in UK terms.
Like all health figures, these need some qualification. Private spending in England will be higher than the UK average as the vast bulk of private practice takes place in England rather than in Scotland, Wales or Northern Ireland. England still has prescription charges while Scotland and Wales were reducing theirs prior to abolishing them in 2010. Other qualifications lie around the type of private spending in other countries. Private health care is relatively small scale in many Scandinavian countries, but in both Sweden and Norway, for example, there is a charge for visiting the GP.
Table C1 Total health expenditure as share of GDP, 2010, ranked by private health spending
Total Public Private
Greece 10.2 6.1 4.2
Cyprus 7.4 3.2 4.2
Serbia 10.4 6.4 4.0
Switzerland 11.4 7.4 3.9
Portugal 10.7 7.1 3.7
Slovak Republic 9.0 5.8 3.2
Bulgaria (2009) 7.2 4.0 3.2
Malta 8.6 5.7 3.0
Montenegro 9.1 6.1 3.0
Ireland 9.2 6.4 2.8
Latvia (2009) 6.8 4.1 2.8
France 11.6 9.0 2.7
Germany 11.6 8.9 2.7
Hungary 7.8 5.0 2.7
Austria 11.0 8.4 2.6
Belgium2 10.5 8.0 2.6
FYR of Macedonia 7.1 4.5 2.6
Spain 9.6 7.1 2.5
Slovenia 9.0 6.6 2.5
EU-27 9.0 6.5 2.4
Finland 8.9 6.6 2.3
Lithuania 7.0 5.1 2.0
Italy 9.3 7.4 1.9
Poland 7.0 5.0 1.9
Sweden 9.6 7.7 1.8
Iceland 9.3 7.5 1.8
Denmark 11.1 9.5 1.7
Netherlands1 12.0 9.6 1.6
United Kingdom 9.6 8.0 1.6
Turkey (2008) 6.1 4.4 1.6
Norway 9.4 8.1 1.4
Luxembourg3 (2009) 7.9 6.6 1.3
Estonia 6.3 5.0 1.3
Czech Republic 7.5 6.3 1.2
Romania 6.0 4.8 1.2
Croatia 7.8 6.6 1.2
1 In the Netherlands, it is not possible to clearly distinguish the public and private share related to investments. 2 Public and private expenditures are current expenditures (excluding investments).3 Health expenditure is for the insured population rather than resident population.
Source: OECD (2012a)
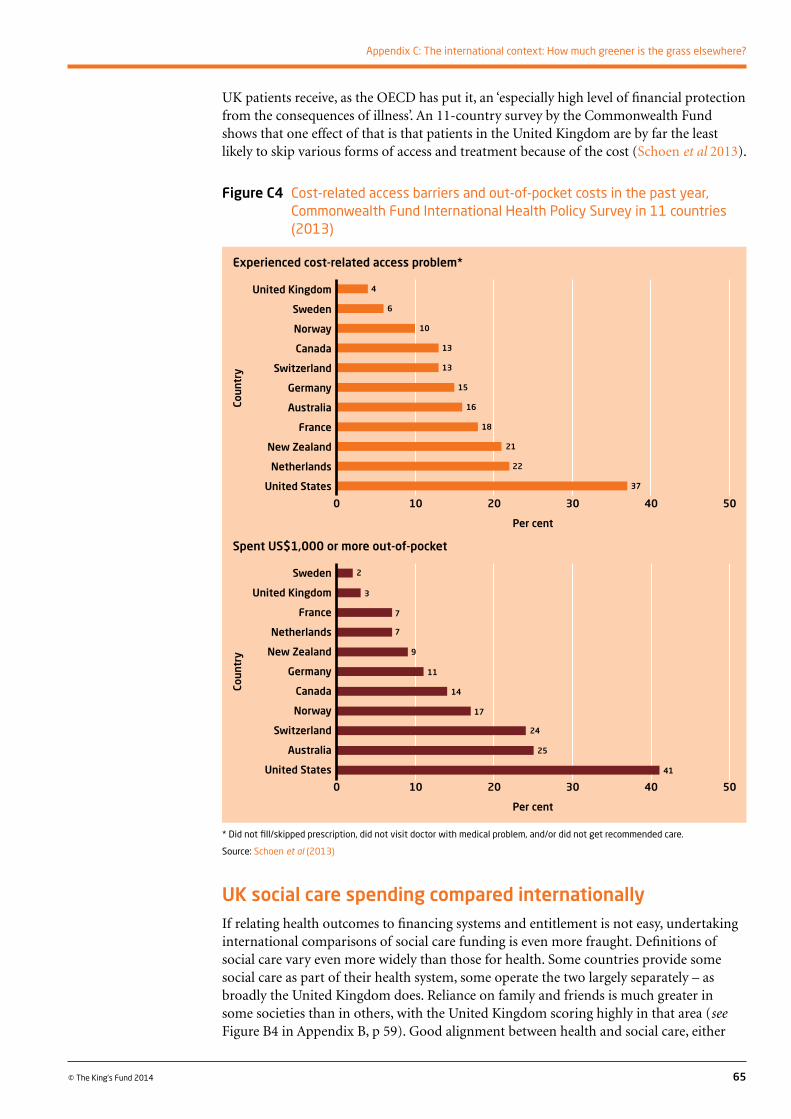
65
Appendix C: The international context: How much greener is the grass elsewhere?
© The King’s Fund 2014
UK patients receive, as the OECD has put it, an ‘especially high level of financial protection from the consequences of illness’. An 11-country survey by the Commonwealth Fund shows that one effect of that is that patients in the United Kingdom are by far the least likely to skip various forms of access and treatment because of the cost (Schoen et al 2013).
UK social care spending compared internationallyIf relating health outcomes to financing systems and entitlement is not easy, undertaking international comparisons of social care funding is even more fraught. Definitions of social care vary even more widely than those for health. Some countries provide some social care as part of their health system, some operate the two largely separately – as broadly the United Kingdom does. Reliance on family and friends is much greater in some societies than in others, with the United Kingdom scoring highly in that area (see Figure B4 in Appendix B, p 59). Good alignment between health and social care, either
* Did not fill/skipped prescription, did not visit doctor with medical problem, and/or did not get recommended care.
Source: Schoen et al (2013)
Figure C4 Cost-related access barriers and out-of-pocket costs in the past year, Commonwealth Fund International Health Policy Survey in 11 countries (2013)
Experienced cost-related access problem*
Spent US$1,000 or more out-of-pocket
0 10 20 30 40 50
Per cent
United Kingdom
Sweden
Norway
Canada
Switzerland
Germany
Australia
France
New Zealand
Netherlands
United States
Coun
try
0 10 20 30 40 50
Per cent
Sweden
United Kingdom
France
Netherlands
New Zealand
Germany
Canada
Norway
Switzerland
Australia
United States
Coun
try
6
10
13
13
15
16
18
21
22
37
3
2
7
7
9
11
14
17
24
25
41
4

66 © The King’s Fund 2014
A new settlement for health and social care
in terms of funding or organisation is rare. The spread of spending in relation to GDP and income per capita is far wider than for health spending alone. Added to that, the UK government in recent years has failed to provide figures to the OECD in a way that allows the types of international comparison on social care spending that are available for health.
The best that seems to be available is average spending on what the OECD describes as long-term care between 2006 and 2010.
This shows that, at 0.9 per cent of GDP, the United Kingdom spent fractionally above the OECD average of 0.8 per cent but appreciably less than some comparable countries – the Netherlands at 2.3 per cent, Denmark at 2.2 per cent, Norway at 2.1 per cent, New Zealand at 1.3 per cent, Canada and Belgium at 1.2 per cent, France at 1.1 per cent – with most of these countries also spending an appreciably larger share of GDP on health. The UK figure of 0.9 per cent compares, however, to Germany (0.9), Sweden (0.7) and Spain (0.5).
What little that can be gleaned from these figures is that public spending on social care in the United Kingdom appears to be towards the lower end of the range for many comparable countries.
Table C2 Average spending as percentage of GDP on long-term care, 2008–10
Average 2008–2010
Australia 0.0
Austria 1.1
Belgium 1.7
Canada 1.2
Chile 0.0
Czech Republic 0.3
Denmark 2.2
Estonia 0.2
Finland 0.8
France 1.1
Germany 0.9
Greece 0.5
Hungary 0.3
Iceland 1.7
Israel 0.5
Ireland 0.4
Italy 0.7
Japan 0.7
Korea 0.3
Luxembourg 0.9
Mexico 0.0
Netherlands 2.3
New Zealand 1.3
Norway 2.1
Poland 0.4
Portugal 0.1
Slovak Republic 0.0
Slovenia 0.7
Spain 0.5
Sweden 0.7
Switzerland 1.2
Turkey 0.0
United Kingdom 0.9
United States 0.5
Source: OECD (2013b)
67© The King’s Fund 2014
References
Adams S, Browne J, Johnson P (2012). Pensioners and the tax and benefit system. Institute for Fiscal Studies briefing note 130. Available at: www.ifs.org.uk/publications/6207 (accessed on 3 March 2014).
Agulnik P, Le Grand J (1998). ‘Tax relief and partnership pensions’. Fiscal Studies, vol 19, pp 403–28.
Appleby J, Harrison T (2006). Spending on health care: how much is enough? London: The King’s Fund. Available at: www.kingsfund.org.uk/publications/spending-health-care (accessed on 3 March 2014).
Appleby J, Humphries R, Thompson J, Jabbal J (2014). How is the health and social care system performing? January 2014. Quarterly monitoring report. London: The King’s Fund. Available at: www.kingsfund.org.uk/publications/how-health-and-social-care-system-performing-january-2014 (accessed on 3 March 2014).
Association of Directors of Adult Social Services (2013). ‘Social care funding: a bleak outlook is getting bleaker’. ADASS website. Available at: www.adass.org.uk/index.php?option=com_content&id=914&Itemid=489 (accessed on 3 March 2014).
Audit Commission (2013). Social care for older people: using data from the VFM profiles. London: Audit Commission. Available at: www.audit-commission.gov.uk/2013/07/audit-commission-analyses-cost-of-social-care-for-older-people-in-a-value-for-money-briefing/ (accessed on 3 March 2014).
Bardsley M, Steventon A, Smith J, Dixon J (2013). Evaluating integrated and community based care: how do we know what works? London: Nuffield Trust. Available at: www.nuffieldtrust.org.uk/publications/evaluating-integrated-and-community-based-care-how-do-we-know-what-works (accessed on 3 March 2014).
Barnett K, Mercer SW, Norbury M, Watt G, Wyke S, Guthrie B (2012). ‘Epidemiology of multimorbidity and implications for health care, research and medical education: a cross sectional study’. The Lancet, vol 380, no 9836, pp 37–43. Available at: www.thelancet.com/journals/lancet/article/PIIS0140-6736(12)60240-2/fulltext (accessed on 3 March 2014).
Bate P, Mendel P, Robert G (2008). Organizing for quality: the improvement journeys of leading hospitals in Europe and the United States. London: Nuffield Trust. Available at: www.nuffieldtrust.org.uk/publications/organizing-quality-improvement-journeys-leading-hospitals-europe-and-united-states (accessed on 3 March 2014).
Black C, Frost D (2011). Health at work: an independent review of sickness absence. Cm 8205. London: Department for Work and Pensions. Available at: www.gov.uk/government/publications/review-of-the-sickness-absence-system-in-great-britain (accessed on 3 March 2014).
Buckner L, Yeandle S (2011). Valuing carers 2011: calculating the value of carers’ support. London: Carers UK. Available at: www.carersuk.org/professionals/resources/research-library/item/2123-valuing-carers-2011 (accessed on 3 March 2014).

68 © The King’s Fund 2014
A new settlement for health and social care
Cameron D (2006). Speech on health at The King’s Fund, London, 4 January 2006.
Care Quality Commission (2013). The state of health care and adult social care in 2012/13. London: CQC. Available at: www.cqc.org.uk/sites/default/files/media/documents/cqc_soc_report_2013_lores2.pdf (accessed on 5 March 2014).
Carers UK (2012). Facts about carers 2012. Policy briefing. London: Carers UK. Available at: www.carersuk.org/media/k2/attachments/Facts_about_carers_Dec_2012.pdf (accessed on 5 March 2014).
Centers for Medicare & Medicaid Services (2013). Pioneer accountable care organizations succeed in improving care, lowering cost. Baltimore, Maryland, US: Centers for Medicare & Medicaid Services.
Chote R (2010). ‘Post budget presentation: opening remarks’. London: Institute for Fiscal Studies. Available at: www.ifs.org.uk/budgets/budgetjune2010/chote.pdf (accessed on 4 March 2014).
Colla CH, Wennberg DE, Meara E, Skinner JS, Gottlieb D, Lewis VA, Snyde CM, Fisher ES (2012). ‘Spending differences associated with the Medicare physician Group Practice Demonstration’. Journal of the American Medical Association, vol 308, no 10, pp 1015–23. Available at: https://jama.jamanetwork.com/Issue.aspx?journalid=67&issueID=24854&direction=P (accessed on 3 March 2014).
Commission on Funding of Care and Support (2011). Fairer care funding: the report of the Commission on the Funding of Care and Support. Available at: http://webarchive.nationalarchives.gov.uk/20130221130239/http://www.dilnotcommission.dh.gov.uk/our-report/ (accessed on 3 March 2014).
Crawford R, Emmerson C (2012). NHS and social care funding: the outlook to 2021/22. London: Nuffield Trust. Available at: www.nuffieldtrust.org.uk/publications/future-NHS-spending (accessed on 3 March 2014).
Cribb J, Hood A, Joyce R, Phillips D (2013). Living standards, poverty and inequality in the UK: 2013. London: Institute for Fiscal Studies. Available at: www.ifs.org.uk/comms/r81.pdf (accessed on 4 March 2014).
Crossman RHS (1969). Paying for the social services. Herbert Morrison memorial lecture. London: Fabian Society.
Cutler DM (1995). Technology, health costs, and the NIH. Paper prepared for the National Institutes of Health Roundtable on the Economics of Biomedical Research. Cambridge, MA: Harvard University and the National Bureau of Economic Research.
Cutler DM, Ghosh K, Landrum MB (2013). Evidence for significant compression of morbidity in the elderly US population. Working paper 19268. Cambridge, Massachusetts, US: National Bureau of Economic Research. Available at: www.nber.org/papers/w19268 (accessed on 3 March 2014).
Department for Work and Pensions (2013). Framework for the analysis of future pension incomes. London: Department for Work and Pensions. Available at: www.gov.uk/government/uploads/system/uploads/attachment_data/file/254321/framework-analysis-future-pensio-incomes.pdf (accessed on 6 March 2014).
Department of Health, Association of British Insurers (2014). Social care funding: statement of intent. London: Department of Health. Available at: www.gov.uk/government/publications/social-care-funding-industry-and-government-statement-of-intent (accessed on 3 March 2014).

69
References
© The King’s Fund 2014
Department of Health annual report and accounts 2012–13. HC 46. London: The Stationery Office. Available at: www.gov.uk/government/uploads/system/uploads/attachment_data/file/229996/Annual_Report.pdf (accessed on 3 March 2014).
Department of Health (2013). Draft national minimum eligibility threshold for adult care and support: discussion document. London: Department of Health. Available at: www.gov.uk/government/publications/draft-national-eligibility-criteria-for-adult-care-and-support (accessed on 3 March 2014).
Department of Health (2012). Long term conditions compendium of information, 3rd ed. Leeds: Department of Health. Available at: www.gov.uk/government/uploads/system/uploads/attachment_data/file/216528/dh_134486.pdf (accessed on 3 March 2014).
Department of Health (2011). Exposition book 2011–12 [online]. Department of Health website. Available at: www.gov.uk/government/publications/exposition-book-2011-2012 (accessed on 13 March 2014).
Department of Health (2010). Recognised, valued and supported: next steps for the carers strategy. London: Department of Health. Available at: www.gov.uk/government/publications/recognised-valued-and-supported-next-steps-for-the-carers-strategy (accessed on 3 March 2014).
Department of Health (2006). Departmental report 2006. Cm 6814. Available at: www.gov.uk/government/uploads/system/uploads/attachment_data/file/272276/6814.pdf (accessed on 18 March 2014).
Dilnot A (2011). ‘Findings of the Commission on Funding of Care and Support’. Slideshow. The King’s Fund website. Available at: www.slideshare.net/kingsfund/andrew-dilnot-on-the-findings-of-the-commission-on-funding-of-care-and-support (accessed on 5 March 2014).
Emmerson C (2014). ‘Taxation of private pensions’ in Emmerson C, Johnson P, Miller H, IFS green budget 2014, pp 221–39. London: Institute for Fiscal Studies. Available at: www.ifs.org.uk/publications/7072 (accessed on 3 March 2014).
Emmerson C, Frayne C, Goodman A (2001). Should private medical insurance be subsidised? London: Institute for Fiscal Studies. Available at: www.ifs.org.uk/docs/private_med.pdf (accessed on 3 March 2014).
Fernandez J-L, Snell T, Wistow G (2013a). Changes in the patterns of social care provision in England: 2005/6 to 2012/13. PSSRU discussion paper 2867. London: Personal Social Services Research Unit, London School of Economics. Available at: www.pssru.ac.uk/publication-details.php?id=4561 (accessed on 3 March 2014).
Fernandez J-L, Snell T, Forder J, Wittenberg R (2013b). Implications of setting eligibility criteria for adult social care services in England at the moderate needs level. PSSRU Discussion Paper 2851. London: Personal Social Services Research Unit, London School of Economics. Available at: www.pssru.ac.uk/archive/pdf/dp2851.pdf (accessed on 17 March 2014).
Fries JF (1980). ‘Aging, natural death, and the compression of morbidity’. New England Journal of Medicine, vol 303, pp 130–35.
Hall RE, Jones CI (2007). ‘The value of life and rise in health spending’. Quarterly Journal of Economics, vol 22, no 1, pp 39–72.
Hansard (House of Lords Debates) (2014). 20 January 2014, col WA 84–85. Available at: www.parliament.uk/business/publications/hansard/lords/by-date/#session=73895&year=2014&month=0&day=20 (accessed on 3 March 2014).

Health and Social Care Information Centre (2013a). ‘Community care statistics, social services activity, England – 2012–13, final release’. Health and Social Care Information Centre website. Available at: www.hscic.gov.uk/searchcatalogue?productid=13822&topics=1%2fSocial+care%2fSocial+care+activity&sort=Relevance&size=10&page=1#top (accessed on 5 March 2014).
Health and Social Care Information Centre (2013b). Hospital episode statistics: admitted patient care 2012–13. Leeds: Health and Social Care Information Centre. Available at: www.hscic.gov.uk/catalogue/PUB12566/hosp-epis-stat-admi-summ-rep-2012-13-rep.pdf (accessed on 3 March 2014).
Health and Social Care Information Centre (2013c). Personal social services: expenditure and unit costs, England 2012–13. Leeds: Health and Social Care Information Centre. Available at: www.hscic.gov.uk/catalogue/PUB13085/pss-exp-eng-12-13-fin-rpt.pdf (accessed on 3 March 2014).
Health and Social Care Information Centre (2013d). ‘Prescriptions dispensed in the community, statistics for England 2002–2012’. Health and Social Care Information Centre website. Available at: www.hscic.gov.uk/catalogue/PUB11291 (accessed on 3 March 2014).
HMRC (no date). ‘Direct effects of illustrative changes’. HMRC website. Available at: www.hmrc.gov.uk/statistics/expenditures/table1-6.pdf (accessed on 3 March 2014).
HM Treasury (2013). Tax exemption for employer expenditure on health-related interventions: summary of responses. London: HM Treasury. Available at: www.gov.uk/government/consultations/implementation-of-a-tax-exemption-for-employer-expenditure-on-health-related-interventions-recommended-by-the-new-health-and-work-assessment-and-advis (accessed on 3 March 2014).
Hughes-Hallett T, Craft A, Davies D (2011). Funding the right care and support for everyone. Report of the Independent Palliative Care Funding Review. London: Department of Health. Available at: www.gov.uk/government/publications/independent-palliative-care-funding-review (accessed on 3 March 2014).
Humphries R (2013). Paying for social care: beyond Dilnot. London: The King’s Fund. Available at: www.kingsfund.org.uk/publications/paying-social-care (accessed on 3 March 2014).
Ipsos MORI (2011). ‘Public opinion research on social care funding: a literature review on behalf of the Commission on the Funding of Care and Support’ in Fairer care funding: supporting documents. Available at: http://webarchive.nationalarchives.gov.uk/20130221130239/https://www.wp.dh.gov.uk/carecommission/files/2011/07/Volume-III-Supporting-documents.pdf (accessed on 3 March 2014).
Johnson P (2013). Pensioner incomes in the UK. Presentation to first CEPAR annual conference, 2 July 2013. Available at: www.ifs.org.uk/conferences/pensioner_incomesUK_pj2013.pdf (accessed on 3 March 2014).
LaingBuisson (2013a). Laing’s healthcare market review 2012/13. London: LaingBuisson.
LaingBuisson (2013b). Care of older people market survey. London: LaingBuisson.
LaingBuisson (2011a). Dentistry market report 2011. London: LaingBuisson.
LaingBuisson (2011b). Laing’s healthcare market review 2010/11. London: LaingBuisson.
LaingBuisson (2010). Laing’s healthcare market review 2009/2010. London: LaingBuisson.
Lawson N (1992). The view from No. 11: memoirs of a Tory radical. London: Bantam Press.
70 © The King’s Fund 2014
A new settlement for health and social care

71
References
© The King’s Fund 2014
Lloyd J (2014). Options for funding care. Paper for Commission on Health and Social Care. Available at: www.kingsfund.org.uk/barkerinterim (accessed on 19 March 2014).
Maybin J, Klein R (2012). Thinking about rationing. London: The King’s Fund. Available at: www.kingsfund.org.uk/publications/thinking-about-rationing (accessed on 3 March 2014).
Mitchell M (2013). Speech on the Dilnot Commission at Institute for Government seminar, 24 October 2013.
Moore JD, Smith DG (2006). ‘Legislating Medicaid: considering Medicaid and its origins’. Health Care Financing Review, vol 27, no 2, pp 47–52. Available at: www.cms.gov/Research-Statistics-Data-and-Systems/Research/HealthCareFinancingReview/downloads/05-06Winpg45.pdf (accessed on 3 March 2014).
Murray CJL, Richards MA, Newton JN, Fenton KA, Anderson HR, Atkinson C, Bennett D, Bernabé E, Blencowe H, Bourne R, Braithwaite T, Brayne C, Bruce NG, Brugha TS, Burney P, Dherani M, Dolk H, Edmond K, Ezzati M, Flaxman AD, Fleming TD, Freedman G, Gunnell D, Hay RJ, Hutchings SJ, Ohno SL, Lozano R, Lyons RA, Marcenes W, Naghavi M, Newton CR, Pearce N, Pope D, Rushton L, Salomon JA, Shibuya K, Vos T, Wang H, Williams HC, Woolf AD, Lopez AD, Davis A (2013). ‘UK health performance: findings of the Global Burden of Disease Study 2010’. The Lancet, vol 381, no 9871, pp 997–1020.
NatCen Social Research (2013). ‘30th British Social Attitudes report’. BSA website. Available at: www.bsa-30.natcen.ac.uk/ (accessed on 4 March 2014).
Naylor C, Mundle C, Weaks L, Buck D (2013). Volunteering in health and care: securing a sustainable future. London: The King’s Fund. Available at: www.kingsfund.org.uk/publications/volunteering-acute-trusts-england (accessed on 5 March 2014).
Newhouse JP (1992). ‘Medical care costs: how much welfare loss?’ Journal of Economic Perspectives, vol 6, no 3, pp 3–21.
NHS Business Services Authority (2012). ‘Prescription prepayment certificates’. NHS Business Services Authority website. Available at: www.nhsbsa.nhs.uk/1127.aspx (accessed on 3 March 2014).
NHS England (2014). ‘Delayed transfers of care (DTOC) by reason, England’. NHS England website. Available at: www.england.nhs.uk/statistics/wp-content/uploads/sites/2/2013/05/LA-Type-B-December-2013-Xkucc.xls (accessed on 3 March 2014).
NHS England (2013). The NHS belongs to the people: a call to action – the technical annex. London: NHS England. Available at: www.england.nhs.uk/ourwork/qual-clin-lead/calltoaction/ (accessed on 3 March 2014).
NHS Trust Development Authority (2013). Service and financial performance of the NHS trust sector for the period ending 30 November 2013. Paper E, Board meeting, 23 January 2014. Available at: www.ntda.nhs.uk/wp-content/uploads/2013/12/Paper-E-Service-Financial-Performance-30-Nov13.pdf (accessed on 3 March 2014).
Nicholson D (2009). The year: NHS chief executive’s annual report for 2008–09. London: Department of Health. Available at: www.healthcare-today.co.uk/doclibrary/documents/pdf/215_the_year_2008-09.pdf (accessed on 3 March 2014).
OECD (2013a). ‘OECD health statistics’. OECD iLibrary website. Available at: www.oecd-ilibrary.org/social-issues-migration-health/data/oecd-health-statistics_health-data-en (accessed on 13 March 2014).

OECD (2013b). Public spending on health and long-term care: a new set of projections. Economic policy paper no 6. Available at: www.oecd.org/eco/growth/public-spending-on-health-and-long-term-care.htm (accessed on 3 March 2014).
OECD (2012a). Health at a glance: Europe 2012. Paris, France: OECD. Available at: www.oecd.org/health/healthataglanceeurope.htm (accessed on 3 March 2014).
OECD (2012b). ‘OECD health data 2012 – frequently requested data’. Organisation for Economic Co-operation and Development website. Available at: www.oecd.org/health/health-systems/oecdhealthdata.htm (accessed on 19 March 2013).
OECD (2011). Help wanted? Providing and paying for long-term care. Paris, France: OECD. Available at: www.oecd.org/health/health-systems/helpwantedprovidingandpayingforlong-termcare.htm (accessed on 3 March 2014).
OECD (2010). Health care systems: getting more value for money. Economics department policy note 2. Paris, France: OECD. Available at: www.oecd.org/eco/healthcaresystemsefficiencyandpolicysettings.htm (accessed on 3 March 2014).
Office for Budget Responsibility (2013). Fiscal sustainability report, July 2013. London: Office for Budget Responsibility. Available at: http://budgetresponsibility.org.uk/fiscal-sustainability-report-july-2013/ (accessed on 13 March 2014).
Office for National Statistics (2013). ‘Pension trends, chapter four, the labour market and retirement’. Office for National Statistics website. Available at: www.ons.gov.uk/ons/rel/pensions/pension-trends/chapter-4--the-labour-market-and-retirement--2013-edition/index.html (accessed on 3 March 2014).
Office for National Statistics (2012). ‘Pension trends, chapter two, population change’. Office for National Statistics website. Available at: www.ons.gov.uk/ons/rel/pensions/pension-trends/chapter-2--population-change--2012-edition-/index.html (accessed on 3 March 2014).
Office for National Statistics (2009). ‘2008-based population projections’. ONS website. Available at: www.ons.gov.uk/ons/rel/npp/national-population-projections/2008-based-projections/index.html (accessed on 5 Mar 2014).
Office of Health Economics (2014). ‘Expenditure data’. Office of Health Economics website. Available at: www.ohe.org/page/health-statistics/access-the-data/expenditure/data.cfm (accessed on 13 March 2014).
Public expenditure on health and social care: seventh report of session 2013–14. HC 793. House of Commons Health Committee. London: The Stationery Office. Available at: www.publications.parliament.uk/pa/cm201314/cmselect/cmhealth/793/793.pdf (accessed on 3 March 2014).
Richards M (2008). Improving access to medicines for NHS patients: a report for the Secretary of State for Health. London: Department of Health. Available at: http://webarchive.nationalarchives.gov.uk/20130107105354/http://www.dh.gov.uk/en/Publicationsandstatistics/Publications/PublicationsPolicyAndGuidance/DH_089927 (accessed on 3 March 2014).
Rivett G (no date). ‘Introduction: the inheritance of the NHS’. National Health Service History website. Available at: www.nhshistory.net/intro1.htm (accessed on 3 March 2014).
Robertson R, Gregory S, Jabbal J (2014). The social care and health systems of nine countries. Background paper for the Commission on the Future of Health and Social Care in England. London: The King’s Fund. Available at: www.kingsfund.org.uk/barkerinterim (accessed on 19 March 2014).
72 © The King’s Fund 2014
A new settlement for health and social care

73
References
© The King’s Fund 2014
Rumbold B, Alakeson V, Smith PC (2012). Rationing health care: is it time to set out more clearly what is funded by the NHS? London: Nuffield Trust. Available at: www.nuffieldtrust.org.uk/publications/rationing-health-care (accessed on 3 March 2014).
Schoen C, Osborn R, Squires D, Doty MM (2013). Access, affordability, and insurance complexity are often worse in the United States compared to 10 other countries. New York, US: Commonwealth Fund. Available at: www.commonwealthfund.org/~/media/Files/Publications/In%20the%20Literature/2013/Nov/1716_Schoen_access_affordability_2013_intl_survey_HA_WebFirst_11_13_13_ITL_v2.pdf (accessed on 3 March 2014).
Silow-Carroll S, Edwards JN (2013). Early adopters of the accountable care model: a field report on improvements in health care delivery. New York, US: Commonwealth Fund. Available at: www.commonwealthfund.org/Publications/Fund-Reports/2013/Mar/Early-Adopters-Accountable-Care-Model.aspx (accessed on 3 March 2014).
Social Care Institute for Excellence (2013). Fair access to care services: prioritising eligibility for care and support. London: Social Care Institute for Excellence. Available at: www.scie.org.uk/publications/guides/guide33/ (accessed on 3 March 2014).
Spijker J, MacInnes J (2013). ‘Population ageing: the time bomb that isn’t’. British Medical Journal, vol 347:f6598.
The King’s Fund (2013a). Evidence submission: Health Select Committee’s inquiry into public expenditure on health and social care [online]. Available at: www.kingsfund.org.uk/publications/briefings-and-responses/evidence-submission-hsc-inquiry-public-expenditure (accessed on 5 March 2014).
The King’s Fund (2013b). ‘Personal stories’. The King’s Fund website. Available at: www.kingsfund.org.uk/projects/commission-future-health-and-social-care-england/patient-stories (accessed on 3 March 2014).
The Royal Commission on Long Term Care (1999). With respect to old age – long term care: rights and responsibilities. Cm 4192-I. London: The Stationery Office. Available at: http://collections.europarchive.org/tna/20081023125241/http:/www.royal-commission-elderly.gov.uk (accessed on 3 March 2014).
Thistlethwaite P (2011). Integrating health and social care in Torbay: improving care for Mrs Smith. London: The King’s Fund. Available at: www.kingsfund.org.uk/publications/integrating-health-and-social-care-torbay (accessed on 3 March 2014).
Timmins N (2008). ‘Growing ranks of elderly add to costs dilemma’. Financial Times, 2 July. Available at: www.ft.com/cms/s/0/85202166-47bb-11dd-93ca-000077b07658.html#axzz2v6JigdUE (accessed on 5 March 2014).
Timmins N, Ham C (2013). The quest for integrated health and social care: a case study in Canterbury, New Zealand. London: The King’s Fund. Available at: www.kingsfund.org.uk/publications/quest-integrated-health-and-social-care (accessed on 3 March 2014).
van Weel C, Michels J (1997). ‘Dying, not old age, to blame for costs of healthcare’. The Lancet, vol 350, no 9085, pp 1159–60.
World Health Organization (2000). The world health report 2000: health systems – improving performance. Available at: www.who.int/whr/2000/en/ (accessed on 3 March 2014).

74 © The King’s Fund 2014
See, for discussion of finished consultant episodes, an international study by The Oak Group. www.oakgroup.com
For a good guide to the history of NHS continuing care see:
Powell T (2011). Background to the National Framework for NHS Continuing Healthcare. House of Commons library note SN/SP/4643. Available at: www.parliament.uk/briefing-papers/SN04643.pdf (accessed on 3 March 2014).
For an account of the tax treatment of workplace health support see:
BUPA (2012). Getting Britain fit for the recovery. Available at: www.bupa.com/media/480492/workforce_health_final_report_18_09_12.pdf (accessed on 3 March 2014).
For recent debate on hypothecated tax see:
Finkelstein D (2014). ‘A separate NHS tax would rein in spending’. The Times, 8 January.
Pearce N (2014). ‘How an NHS tax could tackle the funding crunch in health and social care’. Blog. IPPR website. Available at: www.ippr.org/?p=1261&option=com_wordpress&Itemid=17 (accessed on 3 March 2014).
For origins of the NHS and Beveridge’s role in it see:
Timmins N (2001). The five giants: a biography of the welfare state. London: HarperCollins.
Further reading