a new multi-directional direct simple shear testing …€¦ · laboratory techniques, equipment...
TRANSCRIPT

13th World Conference on Earthquake Engineering Vancouver, B.C., Canada
August 1-6, 2004 Paper No. 2083
A NEW MULTI-DIRECTIONAL DIRECT SIMPLE SHEAR TESTING DATABASE
Annie KAMMERER1, Jiaer WU2, Michael RIEMER3, Juan PESTANA3, and Raymond SEED3
SUMMARY This paper presents the development of a comprehensive modeling-quality cyclic simple shear testing database composed of tests performed on fully-saturated samples of Monterey 0/30 sand. This newly developed database is composed of two series. The first consists of a comprehensive series of uni-directional tests incorporating a variety of relative densities and confining pressures. The second series consists of tests performed under a variety of multi-directional stress paths, including a number of stress paths never before examined in the laboratory. The bi-directional series is focused on soils that exhibit dilatant behavior (i.e. medium to high-density soils). The database is designed such that the uni-directional series serves as a comprehensive baseline against which to compare the results of the multi-directional series. Together, they represent an unmatched resource for both the development and calibration of 3-dimensional constitutive models and understanding the behavior of liquefiable soils under both uni-directional and multi-directional loading.
INTRODUCTION In recent years, significant research effort has been focused on developing state-of-the-art constitutive soil models capable of accurately and reliably predicting the cyclic and permanent deformations of liquefiable materials over the small to moderate strain range (<1m). Unfortunately, the development and use of advanced constitutive soil models for liquefiable soils is being hampered by a lack of the high-quality laboratory testing for use in the validation of existing models and development of new ones. In particular, very little modeling-quality testing has been performed on: a) liquefiable materials experiencing multi-directional stress (or strain) paths, b) medium dense to dense sand that exhibits dilative behavior and c) materials under initial “driving” shear conditions as would be found in sloping ground or under a structure. To address this need for modeling-quality data a program of simple shear testing was performed on medium to high relative density, fully saturated samples of Monterey 0/30 sand. The newly developed database that resulted is composed of two complementary series. The first is a comprehensive series of
1 Senior Geotechnical Engineer, Arup, San Francisco, California, USA. [email protected] 2 Project Engineer, URS Corporation, Oakland, California, USA. [email protected] 3 Professor, University of California, Berkeley, California, USA. [email protected]

uni-directional tests incorporating a variety of relative densities and confining pressures. In the second series, a variety of previously unexplored multi-directional stress paths were imposed. These stress paths can be separated into three general categories: linear, oval/circular, and figure-8, as shown schematically in Figure 1. Tests were performed both with and without an initial static driving shear stress in order to replicate in-situ loading conditions on soils elements under both sloping and level ground conditions. This series is focused on soils that exhibit dilatant behavior (i.e. medium to high-density soils). The database is designed such that the uni-directional series serves as a comprehensive baseline against which to compare the results of the multi-directional series. Together, these series represent an unmatched resource for understanding the behavior of liquefiable soils.
Level Ground
Sloping Ground
Initial static driving forceDynamic loading
Ishihara & Yamazaki (1980) Boulanger et al. (1995)
Figure 1: Schematic illustration of idealized multi-directional Loading The results of this testing program addressed two ultimate goals. The first is the development of insight into the behavior of liquefiable soils under generalized loading conditions. The second is the development of modeling-quality laboratory data quantitatively describing the behavior of liquefiable soils for use in model development and calibration. The attainment of both goals required specialized sample preparation and testing techniques to be developed such that both the sample fabric and the imposed loading replicated typical in-situ conditions. Results from these tests have proven useful for enhancing current understanding of liquefaction behavior by allowing for a more complete theory to emerge. This new 3-D theory greatly expands current understanding of liquefaction behavior and elucidates some areas in which the current theory and practice can be misleading or unconservative. Of particular interest are the topics of pore pressure generation, permanent displacements, and dilational lock-up in medium density sands. This paper does not present discussion of the lessons that can be learned from this testing series. Instead, the focus has been placed on topics related to testing procedures and database development. For a more complete discussion of the results of this testing program, the reader is directed to recent work by Kammerer, Wu and colleagues [1, 2, 3, 4]. In addition, a companion paper in this conference [5] discusses strain development under multi-directional loading.

LABORATORY TECHNIQUES, EQUIPMENT & MATERIAL Simple Shear Testing While triaxial testing has historically been the most commonly used laboratory test, triaxial data is not ideal for either of the goals of this study. This is because the instantaneous 90 degree change in the orientation of the principal stress axes is substantially different from in situ seismic loading in which a smooth rotation of the principal stress stresses occurs. Instead, the most reliable, highest-quality liquefaction data is produced by torsional shear and simple shear devices. While both of these systems has its benefits and drawbacks, they are valuable tools for both basic and advanced research when careful design of procedures and equipment are applied. Together, torsional shear and simple shear testing can address many of the questions regarding behavior of liquefiable soils. Unfortunately, the geometric constraints of hollow cylinder torsional samples prevent their use for bi-directional testing. Simple shear testing was instead chosen for this project for several reasons, including the high quality of data that can be produced, the uniformity of the sample, and the ability to impose shearing on the sample in both horizontal directions. Equipment and Boundary Conditions Testing was performed in the U.C. Berkeley Bi-directional Simple Shear Device (shown in Figures 2 and 3) [6]. This device has been designed to impose shear in both horizontal directions through the use of two custom designed systems: a two-directional track bearing system and a three-piston servo-controlled loading system. This geometric flexibility coupled with the ability to tests fully saturated samples (through the application of chamber and back pressures) makes this device exceptionally useful for testing liquefiable materials under three-dimensional loading conditions. This device was designed to meet three objectives: (1) the capability of uni- and bi-directional monotonic and cyclic loading, (2) low mechanical compliance and (3) a sealable chamber for lateral support and saturation purposes. Several upgrades of this apparatus were later performed in 1998. For this study, the system was reconditioned and the device frame was further air-tightened.
Figure 2: UC Berkeley bi-directional Simple Shear Device For this testing series, 100mm (4-inch) diameter, 20mm (¾-inch) high, circular, clean sand samples were constructed using a wet-pluviation technique. The samples were back-pressures saturated until B-values of 0.95 were reached to assure full saturation during testing. The samples were contained in NGI-style wire-reinforced latex membranes that hold the sample diameter constant to assure that Ko conditions are

maintained. While this method does a good job of assuring Ko conditions throughout the test, the actual lateral pressures applied to the sample are unknown. A chamber pressure (lower than the anticipated lateral pressure in the sample) was applied to minimize the load carried by the wires in the reinforced membranes.
COMPONENTS1. Pressure Chamber2. Pressure Supply3. Servo Valves4. Servo Control Signals
11. Parallel Piston12. Transverse Pistons13. Vertical Piston14. Track Bearings
1
2
2
2
3
3
8
1112
13
4
45
143
3
11
12
12
13
5. Data Out6. Vertical LVDTs7. Horizontal LVDTs8. Vertical Load Cell
9. Parallel Load Cells(Course and finecells in parallel)
10. Transverse Load Cells
Figure 3: Schematic illustration of UC Berkeley Bi-Directional Simple Shear Device Load control was used for both the horizontal shear stresses and the vertical normal stress. This differs from the most common testing method (typically performed on dry samples) in which a constant height is maintained and the vertical load is allowed to drop. The benefit of this new method is that it allows for a direct measure of pore pressure to be recorded during testing. In the traditional method, the drop in vertical load is assumed to be equal to the pore pressure that would occur in a fully saturated sample. The traditional method is adequate for most purposes because it is often only the number of cycles to liquefaction that is desired. However, a comparison of data collected using the two methods indicated that there seemed to be differences in behavior if individual cycles were examined. Because this data was intended for the development of constitutive models, the behavior at each point in the test should be as close to the true in-situ behavior as possible. As a result, the new testing method was used. It is well known that the principal problem with simple shear devices is their tendency to rock due to the lack of complementary shear stresses. This problem is addressed in the design of this device in three ways. First, very stiff track bearings are used in all three orthogonal directions to limit the compliance of the system. Secondly, a sample diameter to height ratio of more than five (D/H>5) limits non-uniformity within the active region of the sample. Lastly, three vertical LVDTs (which measure displacement) that are arranged in a triangle provide a direct measure of rocking during each test. For the cases where an initial horizontal static shear stress was applied to replicate sloping ground conditions (i.e. α>0), the horizontal stress was applied incrementally in proportion to the vertical load applied. This assured that the sample was not artificially sheared during sample preparation. Because the behavior of dense sands is stress-strain (and not frequency) dependent, a frequency of 0.1 Hz (Period=10 sec) was used during testing to allow for increased control by the pneumatic closed-loop loading system

and more accurate pore pressure measurements. Data was taken every 0.2 seconds resulting in 50 data points per cycle. Material Testing was performed on Monterey #0/30 sand, a highly uniform, medium sized, sub-rounded beach sand that was further prepared by the washing of the material over a #200 sieve to remove fine material. The D50 for the material is 0.36mm, the Cu is 1.29, and the Cc, is 0.98. A minimum void ratio of 0.541 was determined by the modified Japanese method and a maximum void ratio of 0.885 was determined by the dry tipping method. The gradation curve for this material is provided in Figure 5.
0%
20%
40%
60%
80%
100%
0.11
Bin 1Bin 2Bin 3Bin 4
Percent Passing
mm
Figure 5: Gradation curve for Monterey 0/30 sand
OVERVIEW OF TEST SERIES PERFORMED The Uni-Directional Baseline Testing Series The database of tests developed consists of two complementary series. A comprehensive uni-directional test series was performed simultaneously and in conjunction with the bi-directional testing series in order to develop a well-verified basis from which to assess the influence of a load in a second horizontal direction. A total of 81 uni-directional cyclic simple tests with level ground conditions were included in this data set. Another 14 uni-directional cyclic tests with initial static driving shear stress were also performed in order to study the liquefaction triggering and post-liquefaction behavior of sands under sloping ground conditions. These tests were performed with three levels of effective overburden pressure, as shown in Table 1. Testing parameters provided in the table include the relative density, cyclic stress ratio and effective initial vertical stress, in addition to the general degree of slope relative to the loading level. An example of the triggering curves produced by this series is shown in Figure 6. The uni-directional series has been used to investigate appropriate failure definitions [3] and empirical tools for estimation of post-liquefaction settlement and shear strain [2]. For this testing program, failure was defined as 3% single amplitude or 6% double amplitude strain.

Table 1: Summary of Uni-Directional Testing Performed Initial vertical effective stress = 40kPa
Dr<55% 55%>Dr>70% 70%>Dr Degree of Slope
Test Dr (%) CSR Test Dr (%) CSR Test Dr (%) CSR
α/CSR <5%
80j 63j 47j 73j 82j 17j 72j 68j 62j
38 40 45 46 47 48 49 50 50
0.16 0.17 0.29 0.22 0.22 0.16 0.17 0.16 0.20
60j 7j 46j 78j 83j 65j 61j 66j
56 58 61 63 63 63 66 67
0.26 0.32 0.24 0.28 0.41 0.37 0.24 0.35
64j 108j 67j 69j
107j 70j 71j 75j
74 74 75 78 78 81 82 87
0.32 0.40 0.29 0.22 0.44 0.42 0.48 0.44
5%< α/CSR<10%
49j 48j 74j 81j
33 33 39 38
0.17 0.23 0.18 0.13
10%<α/CSR<30% 50j 38 0.14
Initial vertical effective stress = 80kPa Dr<55% 55%>Dr>70% 70%>Dr
Degree of Slope Test Dr (%) CSR Test Dr (%) CSR Test Dr (%) CSR
α/CSR <5%
43j 21j 24j 23j 41j 42j 20j 77j
124j 38j 15j
31 34 43 43 44 44 45 46 49 50 54
0.18 0.17 0.14 0.20 0.15 0.16 0.25
0.175 0.31 0.22 0.20
19j 25j 28j 59j 16j 79j
125j
55 56 56 58 59 60 64
0.32 0.34 0.25 0.22 0.17 0.23 0.43
36j 33j 35j 37j 30j
105j 31j 34j
109j 110j
32j
70 71 75 77 77 78 79 80 81 81
82
0.23 0.34 0.45 0.21 0.36 0.37 0.41 0.29 0.37 0.42
0.40
5%< α/CSR<15% 44j 45j 22j
34 37 40
0.16 0.11 0.10
30%<α/CSR<40% 39J 45 0.22 118J 113J
60 64
0.18 0.25
40%<α/CSR<75% 116J 117J 40J
44 46 50
0.17 0.14 0.22
114J 111J
60 66
0.24 0.17
α/CSR>75% 120J 123J 122J
47 48 48
0.17 0.14 0.13
119J 112J 115J
61 63 63
0.15 0.16 0.24

Table 1 (cont.): Summary of Uni-Directional Testing Performed
Initial vertical effective stress = 180kPa
Dr<55% 55%>Dr>70% 70%>Dr
Test Dr (%) CSR Test Dr (%) CSR Test Dr (%) CSR Degree of Slope
α/CSR<5%
All test are approximately level
ground
88j 104j 102j 103j 90j 92j
45 50 51 54 54 55
0.16 0.22 0.18 0.20 0.18 0.18
93j 84j 85j 86j 87j 89j
60 63 64 65 65 66
0.18 0.22 0.25 0.30 0.34 0.16
101j 95j
106j 96j 99j
100j 94j 91j
78 78 81 81 81 83 84 85
0.21 0.27 0.47 0.35 0.37 0.44 0.36 0.36
0.0
0.1
0.2
0.3
0.4
0.5
0.6
1 10 100 1000
Number of Cycles to 6% Double Amplitude Shear Strain
Cyc
lic S
tres
s R
atio
, CS
R
40 kPa initial effective vertical stress
80 kPa initial vertical effective stress
180 kPa initial vertical effective stress
Dr = 45%
Dr = 60%
Dr = 80%
Dr = 35%
Figure 6: Triggering Curve for Monterey 0/30 Sand The Bi-Directional Testing Series In the bi-directional series, a variety of previously unexplored multi-directional stress paths were examined. These stress paths can be separated into three general categories: linear, oval/, and figure-8, as shown in Figure 1. Tests were performed both with and without an initial static driving shear stress in order to replicate in-situ loading conditions on soils elements under both sloping and level ground conditions. Additionally, the major axis of the three loading types was oriented in both the dip and strike directions. The bi-directional series is summarized in Table 2. The schematics in the left column of the table represent the stress path categories shown schematically in Figure 1. The four additional columns
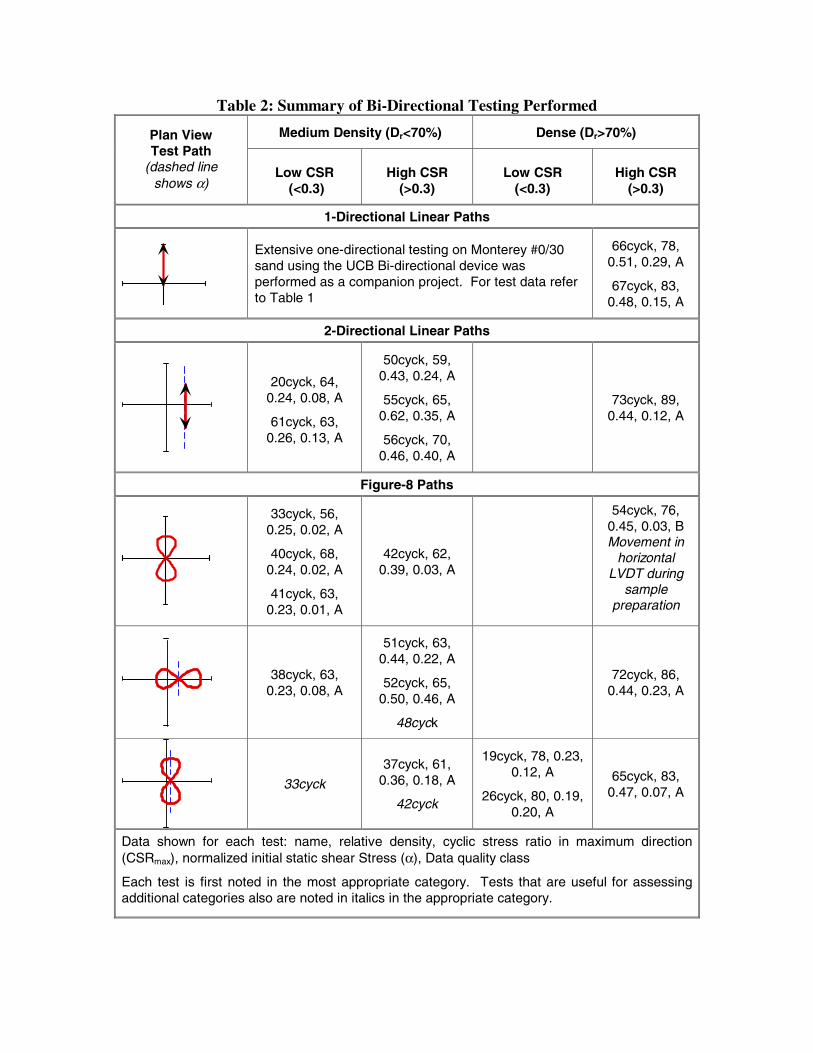
Table 2: Summary of Bi-Directional Testing Performed
Medium Density (Dr<70%) Dense (Dr>70%) Plan View Test Path
(dashed line shows α)
Low CSR (<0.3)
High CSR (>0.3)
Low CSR (<0.3)
High CSR (>0.3)
1-Directional Linear Paths
Extensive one-directional testing on Monterey #0/30 sand using the UCB Bi-directional device was performed as a companion project. For test data refer to Table 1
66cyck, 78, 0.51, 0.29, A
67cyck, 83, 0.48, 0.15, A
2-Directional Linear Paths
20cyck, 64, 0.24, 0.08, A
61cyck, 63, 0.26, 0.13, A
50cyck, 59, 0.43, 0.24, A
55cyck, 65, 0.62, 0.35, A
56cyck, 70, 0.46, 0.40, A
73cyck, 89,
0.44, 0.12, A
Figure-8 Paths
33cyck, 56, 0.25, 0.02, A
40cyck, 68, 0.24, 0.02, A
41cyck, 63, 0.23, 0.01, A
42cyck, 62, 0.39, 0.03, A
54cyck, 76, 0.45, 0.03, B Movement in
horizontal LVDT during
sample preparation
38cyck, 63, 0.23, 0.08, A
51cyck, 63, 0.44, 0.22, A
52cyck, 65, 0.50, 0.46, A
48cyck
72cyck, 86,
0.44, 0.23, A
33cyck
37cyck, 61, 0.36, 0.18, A
42cyck
19cyck, 78, 0.23, 0.12, A
26cyck, 80, 0.19, 0.20, A
65cyck, 83, 0.47, 0.07, A
Data shown for each test: name, relative density, cyclic stress ratio in maximum direction (CSRmax), normalized initial static shear Stress (α), Data quality class
Each test is first noted in the most appropriate category. Tests that are useful for assessing additional categories also are noted in italics in the appropriate category.

Table 2 (cont.): Summary of Bi-Directional Testing Performed
Medium Density (Dr<70%) Dense (Dr>70%) Plan View Test Path
(dashed line show α)
Low CSR (<0.3)
High CSR (>0.3)
Low CSR (<0.3)
High CSR (>0.3)
Oval/Circular Paths
23cyck, 68, 0.21, 0.02, A
30cyck, 68, 0.23, 0, A
31cyck, 65, 0.25, 0, A
43cyck, 48, 0.12, 0, A
44cyck, 68, 0.40, 0.02, A
34cyck, 70, 0.35, 0.02, A
58cyck, 80, 0.27, 0.05, B Large drop in one vertical
LVDT
68cyck, 82, 0.44, 0.05, A
23cyck
35cyck
49cyck, 61, 0.45, 0.24, A
59cyck, 55, 0.38, 0.19, A
34cyck
25cyck, 75, 0.22, 0.23, A
60cyck, 73, 0.46, 0.21, A
69cyck, 87, 0.48, 0.24, A
71cyck, 86, 0.47, 0.14, A
35cyck, 67, 0.23, 0.08, A
36cyck, 69, 0.22, 0.12, A
45cyck, 58, 0.25, 0.27, A
46cyck, 68, 0.23, 0.11, A
57cyck, 60, 0.25, 0.16, A
27cyck
47cyck 63cyck, 79,
0.26, 0.13, A
53cyck, 72, 0.42, 0.42, A
70cyck, 85, 0.46, 0.42, A
Miscellaneous Paths (all medium density, low CSR)
MISC Half-circle
32cyck, Dr =62%, B
Cropped oval 27cyck, Dr =66%, A 47cyck, Dr =58%, A
Cropped figure-8 48cyck, Dr =62%,
A
Data shown for each test: name, relative density, cyclic stress ratio in maximum direction (CSRmax), normalized initial static shear Stress (α), Data quality class
Each test is first noted in the most appropriate category. Tests that are useful for assessing additional categories also are noted in italics in the appropriate category.

separate the tests into “bins” based on stress level and density. Several parameters are shown for each test. These include the relative density (Dr), cyclic stress ratio in the principal direction (CSRmax), and the normalized initial static shear stress (α-value). The initial confining pressure (σ’c) was 80kPa for all tests in the bi-directional series. To assist those using the database for research purposes, a data quality classification (DQC) is also noted. The “A” classification denotes data of highest reliability. The “B” classification denotes data that is deemed less reliable. The reasons for the lower designation for each test are provided. In addition, some tests are also noted in multiple load path categories. Each test is first noted with the relevant information in the most appropriate category. Tests that are of interest in additional load path categories are then also noted in an italic font in the appropriate secondary category. As an example, a test may have an α-value very close to zero but may be strongly affected by the small shear that does exist due the particular stress path imposed. In this case the test would be shown in the level ground category, but would also be noted in italics in the appropriate sloping ground category. The database is available for download at www.ce.berkeley.edu/~kammerer or through the GeoEngineering office at the University of California, Berkeley.
PARAMETER AND TESTING DEFINITIONS Numerous terms and parameters have traditionally been used to describe both the state of a sample and the loading applied. However, some parameters require further specification to remove ambiguity arising from multi-directional loading. Other parameters must be newly developed altogether. Several common terms have been made more precise by the addition of subscripts that include “dip”, “strike”, “X”, “Y”, “max”, and “min”. The first two subscripts relate to sloping ground tests and indicate the direction of the initial static shear stress (or slope) and the direction perpendicular to the initial stress, respectively, as shown on Figure 7. The terms dip and slope are used because they have unambiguous geology-based definitions and can be related to the fundamental conditions of an real site of interest. If no slope exists the terms “X” and “Y” are used to differentiate the two horizontal directions. These subscripts describe parameters relative to static directional properties of a site. The terms “max” and “min” can relate to a wide variety of parameters and can indicate the maximum direction (e.g. CSRmax) or the maximum absolute values within a given cycle (e.g. γmax). In developing these parameters, care has been taken to assure that they can be extended to irregular loading without confusion.
N
E
S
W
90o
Dip
Strike
equalelevationlines
Sampleload path
site θα
α
Figure 7: Bi-Directional Parameter Definitions
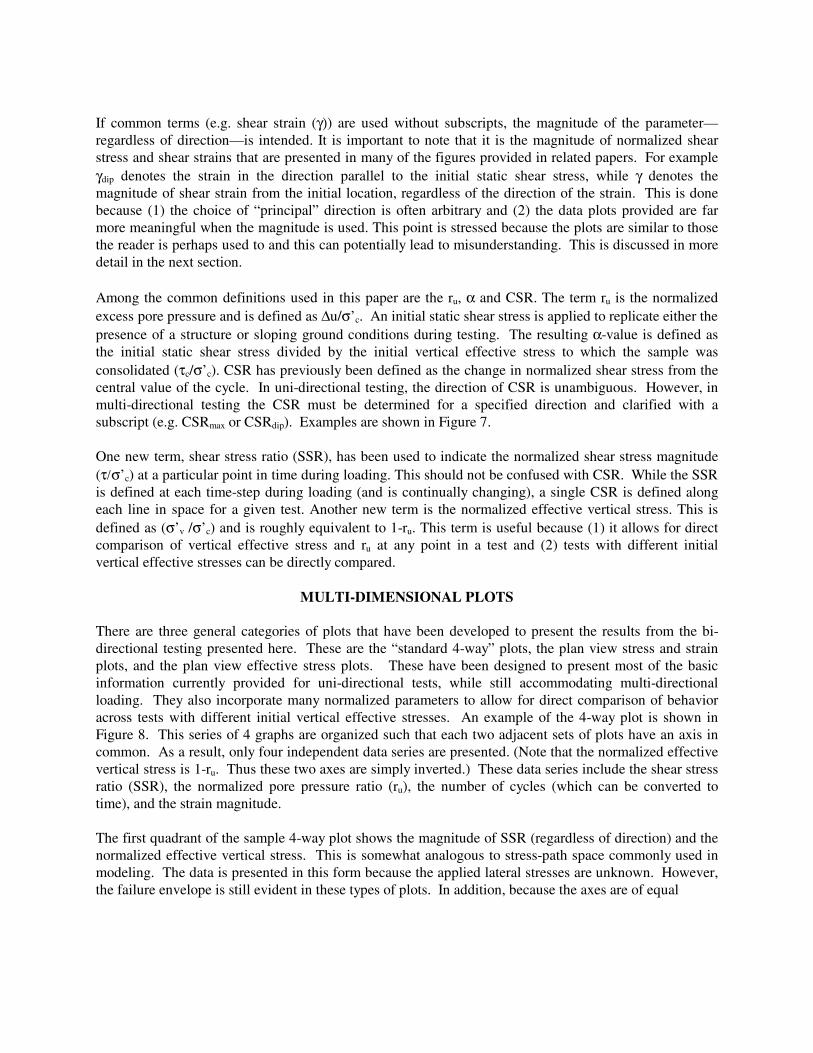
If common terms (e.g. shear strain (γ)) are used without subscripts, the magnitude of the parameter—regardless of direction—is intended. It is important to note that it is the magnitude of normalized shear stress and shear strains that are presented in many of the figures provided in related papers. For example γdip denotes the strain in the direction parallel to the initial static shear stress, while γ denotes the magnitude of shear strain from the initial location, regardless of the direction of the strain. This is done because (1) the choice of “principal” direction is often arbitrary and (2) the data plots provided are far more meaningful when the magnitude is used. This point is stressed because the plots are similar to those the reader is perhaps used to and this can potentially lead to misunderstanding. This is discussed in more detail in the next section. Among the common definitions used in this paper are the ru, α and CSR. The term ru is the normalized excess pore pressure and is defined as ∆u/σ’c. An initial static shear stress is applied to replicate either the presence of a structure or sloping ground conditions during testing. The resulting α-value is defined as the initial static shear stress divided by the initial vertical effective stress to which the sample was consolidated (τc/σ’c). CSR has previously been defined as the change in normalized shear stress from the central value of the cycle. In uni-directional testing, the direction of CSR is unambiguous. However, in multi-directional testing the CSR must be determined for a specified direction and clarified with a subscript (e.g. CSRmax or CSRdip). Examples are shown in Figure 7. One new term, shear stress ratio (SSR), has been used to indicate the normalized shear stress magnitude (τ/σ’c) at a particular point in time during loading. This should not be confused with CSR. While the SSR is defined at each time-step during loading (and is continually changing), a single CSR is defined along each line in space for a given test. Another new term is the normalized effective vertical stress. This is defined as (σ’v /σ’c) and is roughly equivalent to 1-ru. This term is useful because (1) it allows for direct comparison of vertical effective stress and ru at any point in a test and (2) tests with different initial vertical effective stresses can be directly compared.
MULTI-DIMENSIONAL PLOTS There are three general categories of plots that have been developed to present the results from the bi-directional testing presented here. These are the “standard 4-way” plots, the plan view stress and strain plots, and the plan view effective stress plots. These have been designed to present most of the basic information currently provided for uni-directional tests, while still accommodating multi-directional loading. They also incorporate many normalized parameters to allow for direct comparison of behavior across tests with different initial vertical effective stresses. An example of the 4-way plot is shown in Figure 8. This series of 4 graphs are organized such that each two adjacent sets of plots have an axis in common. As a result, only four independent data series are presented. (Note that the normalized effective vertical stress is 1-ru. Thus these two axes are simply inverted.) These data series include the shear stress ratio (SSR), the normalized pore pressure ratio (ru), the number of cycles (which can be converted to time), and the strain magnitude. The first quadrant of the sample 4-way plot shows the magnitude of SSR (regardless of direction) and the normalized effective vertical stress. This is somewhat analogous to stress-path space commonly used in modeling. The data is presented in this form because the applied lateral stresses are unknown. However, the failure envelope is still evident in these types of plots. In addition, because the axes are of equal

0.0
0.2
0.4
0.6 0 0.2 0.4 0.6 0.8 1 1.2
SSR
(τ/
σ'c )
Norm. Eff. Vertical Stress (σ'v/σ'
c)
0.0
0.2
0.4
0.60 5 10 15 20
Shear Strain, γ (%)
0
10
20
30
-0.200.20.40.60.81
Excess Pore Pressure Ratio (ru)
Num
ber
of C
ycle
s
0
10
20
30
0 5 10 15 20
Shear Strain, γ (%)
ms46cyckDr = 68%
Figure 8: Standard 4-way plot for Test#Ms46cyck (CSRmax=0.23 α=0.11)
scale in these plots, the friction angle can also be assessed. The second quadrant is essentially the stress-strain plot. Admittedly, it is typically difficult to read for many of the bi-directional tests. Again, the magnitudes are plotted, rather than the values in one or both directions. It is important to recognize that the plot is a 2-dimensional representation of what is really 3-dimensional information. Therefore, this plot should not be used to assess the hysteric loss of energy in the test. The third and fourth quadrants show the normalized pore pressure (ru) and the shear strain (γ) as the test progresses. When these two final sets of data are presented outside the 4-way plot they are often used to compare tests. In these cases, typically the ru,max and γmax values for each cycle are provided instead of ru and γ for visual clarity. Care should be taken when viewing the 4-way and other “standard” plots as misunderstandings can result. For example, because the strain plots often reduces deformations in two dimensions into a single value, information is lost, as shown schematically in Figure 9. The top axis shows the horizontal stresses in plan view for two different bi-directional stress paths. The middle axis shows typical (though idealized) horizontal strains that would result from these load paths (also in plan view). The lowest axis shows how these strains would look when presented on a standard plot showing γ versus the number of cycles or time. Clearly, the strain information provided on the standard 4-way plots alone is insufficient to fully describe the actual strains the sample undergoes, although the information can be very useful. To prevent misunderstanding, plan view strain plots (as in Figure 10) should be provided in conjunction with the standard strain plot shown in Figure 8. It is recommended that the reader compare Figures 8 and 10 if unclear. As another example, the plot of SSR versus normalized vertical effective stress (in Figure 8) could be misunderstood as indicating a CSR of approximately 0.11 (i.e. (0.34-0.12)/2). Figure 10 clearly shows that this is not the case and that the plan view plot should be used. In addition, because strain magnitude is always positive and non-directional, the strains in the 4-way plot cannot be used to determine the (single or double amplitude) strain range achieved during a given cycle.

Plan ViewStresses
Plan ViewStrains
StrainMagnitude (γ)
StrainMagnitude (γ)
Tim
e
Tim
e
Figure 9: Typical stress and strain plots for two bi-directional tests
-0.4
-0.2
0
0.2
0.4
-0.4 -0.2 0 0.2 0.4
SSR
Stri
ke
SSRdip
-15
-10
-5
0
5
-5 0 5 10 15
Stra
in (
%)
Strain (%)
Ms46cyckα=0.11D
r=68%
Figure 10: Plan view stress and strain plots for Test#Ms46cyck The second set of plots used to present the data provides the shear stresses and strains in plan view, as shown in Figure 10. The stresses are normalized and presented as shear stress ratio values (e.g., SSRdip and SSRstrike). To allow for rapid visual assessment, the two orthogonal axes are of equal scale in each plot. The degree of both stress rotation and stress release is readily apparent. The relationship between the general stress path category and the initial static shear stress is also easily discerned by noting the location of the zero axis as compared to the center of loading. For example, the α-value is 0.11 for the test

in Figure 10. Examination of the plan view plots can provide insight into the relation between stresses and strains in two-directional loading. The final type of plot provided is the plan view effective stress plot, which presents the vertical effective stress throughout a single post-liquefaction cycle. An example of this plot is provided in Figure 11 for the same test shown in Figures 8 and 10. The diameter of the bubble represents the value of the normalized effective vertical stress and the center of the bubble is located at the horizontal shear stresses corresponding to that point. This can be seen by comparing Figures 10 and 11. The normalized effective vertical stress is provided instead of the ru value because it allows for better visualization of pore pressure behavior around the origin, which is the area of primary interest. In addition negative values at times exist in the ru data, making plotting problematic. The cycle shown for each of the tests is that which occurs immediately after the limiting pore pressure, ru,lim, has been reached.
SSRdip
-0.4 -0.2 0.0 0.2 0.4
SSR
stri
ke
-0.4
-0.2
0.0
0.2
0.4Cycle 20
bubble diameter = σ'v/σ'v,i
Figure 11: Plan view effective stress plot for Test#Ms46cyck A complete set of these plots are provided for each bi-directional test in the appendix of Kammerer et al. (2002) [1]. In addition, each type of plot uses the same range for all samples. For example, each test is plotted on a plan view stress path plot of equal size and with a SSR range of 0.9. The center point moves depending on the specific range of the data. This allows for direct comparison of every test. Appendix B of Wu et al. (2003) provides “traditional” 4-way plots for all uni-directional tests performed.
CONCLUSIONS This paper presents a newly developed comprehensive modeling-quality cyclic simple shear testing database composed of both a uni-directional series and a unique bi-directional series. Together, these series represent an unmatched resource for both constitutive model develop and calibration and for understanding the behavior of liquefiable soils under both uni-directional and multi-directional loading. In the process of analyzing the data, a number of limitations in current standard plot types, definitions and notations were recognized and addressed. A final key element of this research is assuring easy access of the data to the research community through downloadable digital data and publications.

ACKNOWLEDGEMENTS Financial support for the multi-directional tests was provided by the NSF, CAREER award CMS-9623979, by the Pacific Earthquake Engineering Research Center (project 2051999), by a National Science Foundation Graduate Research Fellowship and an EERI/FEMA NEHRP Graduate Research Fellowship. Continued support of the project download site has been provided by the Civil and Environmental Engineering Department of the University of California, Berkeley. On-going support for publication and presentation of this research is provided by Ove Arup and Partners California, LTD (ARUP). The uni-directional testing series was sponsored in part by the National Science Foundation, and by a Parker Davies Trask Memorial Scholarship and a H. Bolton Seed Memorial Fellowship. Financial support from the Pacific Earthquake Engineering Research Center’s Program of Applied Earthquake Engineering Research of Lifeline Systems supported by the State Energy Resources Conservation and Development Commission and the Pacific Gas & Electric Company is acknowledged.
REFERENCES 1. Kammerer, A.M, Pestana, J.M. and Seed, R.B. (2002) "Undrained Response of Monterey 0/30 Sand
Under Multidirectional Cyclic Simple Shear Loading Conditions", Geotechnical Engineering Research Report No. UCB/GT/02-01, University of California, Berkeley, July 2002.
2. Wu, J., Seed, R.B. and Pestana, J.M. (2003) "Liquefaction Triggering and Post Liquefaction Deformations of Monterey 0/30 Sand under Uni-Directional Cyclic Simple Shear Loading", Geotechnical Engineering Report No. UCB/GE-2003/01, April 2003, Univ. of California, Berkeley
3. Wu, J., Kammerer, A.M., Riemer, M.F., Seed, R.B., and Pestana, J.M.(2004), “Laboratory Study of liquefaction triggering criteria”, Proceedings, 13th World Conf. on Earthquake Engr., Paper 2580, Vancouver, Canada,
4. Kammerer, A. M., Seed, R.B., Wu J., Riemer M. F., and Pestana J. M. (2004) “Pore Pressure Development in Liquefiable Soils Under Bi-Directional Loading Conditions”, Proceedings, 11th Int. Conf. on Soil Dynamics and Earthquake Engineering and 3rd Intl. Conf. On Earthquake Geotechnical Engineering, Vol.2 P.697
5. Kammerer, A.M., Wu, J., Riemer, M.F., Pestana, J.M., and Seed, R.B.(2004), “Shear Strain Development In Liquefiable Soil Under Bi-Directional Loading Conditions”, Proceedings, 13th World Conf. on Earthquake Engr., Paper 2081, Vancouver, Canada
6. Boulanger, R. W., Chan, C. K., Seed, H. B., and Seed, R. B. (1993). “A low-compliance bi-directional cyclic simple shear apparatus.” Geotech. Testing J., 16(1), 36-45.
7. Ishihara, K. and Yamazaki, F. (1980). “Cyclic simple shear tests on saturated sand in multi-directional loading.” Soils and Foundations, 20(1), 45-59.
8. Boulanger, R. W. and Seed, R. B. (1995). “Liquefaction of sand under bi-directional monotonic and cyclic loading.” J. Geotech. Engng., ASCE, 121(12), 870-878.
9. Boulanger, R. W., Seed, R. B., Chan, C. K., Seed, H. B., and Sousa, J. B. (1991). “Liquefaction behavior of saturated sands under uni-directional and bi-directional monotonic and cyclic simple shear loading.” Rep. No. UCB/GT-91/08, University of California, Berkeley.
10. Harder, L. F. and Boulanger, R. W. (1997). “Application of Kσ and Kα Correction Factors.” Rep. No. NCEER-97-0022, NCEER, Buffalo.
11. Vaid, Y. P. and Finn, W. D. L. (1979). “Static shear and liquefaction potential.” J. Geotech. Eng. Div., ASCE, 105 (GT10), p.1233