a new lyotropic liquid crystalline system: … · iii abstract a new lyotropic liquid crystalline...
TRANSCRIPT

A NEW LYOTROPIC LIQUID CRYSTALLINE SYSTEM:
OLIGO(ETHYLENE OXIDE) SURFACTANTS WITH TRANSITION METAL
COMPLEXES (M(H2O)nXm) AND THE SYNTHESIS OF
MESOPOROUS METAL SULFIDES
A THESIS
SUBMITTED TO THE DEPARTMENT OF CHEMISTRY
AND THE INSTITUTE OF ENGINEERING AND SCIENCES
OF BILKENT UNIVERSITY
IN PARTIAL FULFILLMENT OF THE REQUIREMENTS
FOR THE DEGREE OF
MASTER OF SCIENCE
By
ÖZGÜR ÇELİK
July 2001

ii
I certify that I have read this thesis and in my opinion it is fully adequate, in scope and
in quality, as a thesis of the degree of Master of Science
Asst. Prof. Dr. Ömer DAĞ
I certify that I have read this thesis and in my opinion it is fully adequate, in scope and
in quality, as a thesis of the degree of Master of Science
Prof. Dr. Atilla AYDINLI
I certify that I have read this thesis and in my opinion it is fully adequate, in scope and
in quality, as a thesis of the degree of Master of Science
Asst. Prof. Dr. Margarita KANTCHEVA
Approved for the Institute of Engineering and Sciences
Prof. Dr. Mehmet Baray
Director of Institute of Engineering and Sciences

iii
ABSTRACT
A NEW LYOTROPIC LIQUID CRYSTALLINE SYSTEM:
OLIGO(ETHYLENE OXIDE) SURFACTANTS WITH TRANSITION METAL
COMPLEXES (M(H2O)nXm) AND THE SYNTHESIS OF
MESOPOROUS METAL SULFIDES
ÖZGÜR ÇELİK
M.S. in Chemistry
Supervisor: Asst. Prof. Dr. Ömer Dağ
July 2001
In this study a new templating method, which can be used to synthesise
mesporous materials, has been developed. The main objective of this work is to form
organic mesophase in the presence of inorganic salts. This is an organic-inorganic
hybrid mesophase, which can be used to template the growth of inorganic materials.
Here for the first time, a new lyotropic liquid crystalline (LLC) system has been
presented from oligo (ethylene oxide) type surfactant and transition metal aqua
complexes.
The temperature and the metal aqua complex concentration range of the
complex/surfactant mixtures have been determined, where the mixtures have a liquid
crystalline (LC) phase. Here, the complex refers to Ni(NO3)2·6H2O, Co(NO3)2·6H2O,
Zn(NO3)2·6H2O, Cd(NO3)2·4H2O, and CoCl2·6H2O and the surfactant is
C12H25(CH2CH2O)10OH, (C12EO10). The addition of the metal aqua complexes

iv
directly to the surfactant produces a LC phase. The LC phase obtained from the
mixture of these two is more stable than the LC phase obtained from a mixture of free
water and surfactant. The FT-IR and UV-Vis absorption, Polarised Optical
Microscopy (POM) and Powder X-ray Diffraction measurements show that the
coordinated water molecules mediate the formation of the LC phase. Our observations
also show that the coordinated water molecules make a stronger interaction with
ethylene oxide (EO) chains than free water molecules.
The LC templating approach, which is demonstrated as a new system has been
used for synthesis of meso-structured metal oxides, metal sulphides and even metal
mesh. From all these studies, it is well known that in order to maintain LC phase the
metal ion concentration should correspond to metal ion to surfactant mole ratio below
0.8. However, this work shows that the amount of metal aqua complex concentration
can be increased up to a 6.5 complex to surfactant mole ratio by maintaining the
integrity of the hexagonal and/or cubic structure of the LC phase. This may open a
new area for the realisation of new mesostructured materials with better qualities and
much higher yields.
In the first part of the thesis, the thermal and structural properties of the new
LLC phase has been established by using polarized optical microscopy (POM) with
an attached hot plate, PXRD, FT-IR and UV-Vis absorption methods. In the second
part, the new phase has been used as a template to synthesise mesoporus metal
sulfides. The second part of the thesis deals mainly with the structure and synthesis of
mesostructured CdS and ZnS. It has been demonstrated that the LC phase of

v
Zn(NO3)2·6H2O, and Cd(NO3)2·4H2O in oligo(ethylene oxide) surfactant survive
partially during the reaction with H2S to produce the corresponding metal sulfides.
Keywords: Lyotropic liquid crystal, mesophases, transition metal aqua complexes,non-ionic surfactants, mesoporous materials, metal sulfides.

vi
ÖZET
YENİ BİR LİYOTROPİK SIVI KRİSTAL SİSTEMİ:
OLİGO(ETİLEN OKSİD) YÜZEY-AKTİFLER İLE GEÇİŞ METAL
KOMPLEKSLERİ (M(H2O)nXm) VE MEZOGÖZENEKLİ METAL SÜLFÜRLERİN
SENTEZLENMESİ
ÖZGÜR ÇELİK
Kimya Bölümü Yüksek Lisans Tezi
Tez Yöneticisi: Asst. Prof. Dr. Ömer Dağ
Temmuz 2001
Bu çalışmada mezogözenekli malzemelerin sentezlenmesinde kullanılabilecek,
yeni bir kalıplama metodu geliştirildi. Bu çalışmanın ana amacı organik mezo fazı
inorganik tuzlarla hazırlamaktır. Bu, yeni inorganik malzemelerin oluşumunu
kalıplamada kullanılabilir, bir organik-inorganik melez mezo fazdır. Oligo (etilen
oksid) yüzey-aktifi ve geçiş metallerinin sulu komplekslerinden oluşan yeni bir
liyotropik sıvı kristal (LSK) sistemi, ilk kez bu çalışmada sunulmaktadır.
Metal kompleks/yüzeyaktif karışımlarının, sıvı kristal fazı içeren örneklerinde
sıcaklık ve metal sulu komplekslerin derişim aralıkları belirlenmiştir. Burada
kompleksler; Ni(NO3)2·6H2O, Co(NO3)2·6H2O, Zn(NO3)2·6H2O, Cd(NO3)2·4H2O, ve
CoCl2·6H2O tuzları ve yüzey-aktif; C12H25(CH2CH2O)10OH, (C12EO10) molekülüdür.
Metal sulu komplekslerinin yüzey-aktife direkt eklenmesi, LSK fazını

vii
oluşturmaktadır. Bu ikisinin karışımından elde edilen sıvı kristal (SK) faz, serbest su
ve yüzey-aktif karışımında elde edilen SK fazından daha kararlıdır. Polarize optik
mikroskobu (POM), PXRD, ve FT-IR ve UV-Vis soğurma spektroskopisi ölçümleri
SK fazının koordine olan su molekülleri tarafından yönlendirildiğini döstermektedir.
Ayrıca gözlemlerimiz, koprdine olan su moleküllerinin serbest su moleküllerine
nazaran, etilen oksit zinciri ile daha kuvvetli etkileşim içinde olduğunu göstermiştir.
Tamamen yeni bir sistem olan, SK kalıplama metodu mezo-yapılı metal oksit,
metal sülfür ve hatta metal ağların sentezlenmesinde bir süredir kullanılmaktadır. Bu
çalışmaların hepsinde, bilinen şu ki, metal iyon derişimi, SK fazı koruyarak,
metal/yüzey-aktif mol oranında 0.8 den daha yukarıya çıkılamamıştır. Fakat bu
çalışmada metal/yüzeyaktif mol oranının, altıgensel ve/veya kübik SK fazını
koruyarak, 6.5’e kadar yükseltilebileceği gösterilmiştir.
Bu çalışmanın birinci kısmında, POM, PXRD ve FT-IR ve UV-Vis soğurma
metodları kullanılarak, yeni SK sisteminin ısıya bağlı ve yapısal özellikleri
saptanmıştır. Bu çalışmanın ikinci kısmında, yeni sistem metal sülfürlerin
sentezlenmesinde kalıp olarak kullanıldı. Bu tezin ikinci kısmı CdS ve ZnS
sentezlenmesi ve yapısıyla ilgilidir. Ayrıca Oligo (etilen oksit) yüzey-aktif
içerisindeki Zn(NO3)2·6H2O, ve Cd(NO3)2·4H2O komplekslerin metal sülfürleri
oluşturmak için H2S ile reaksiyonları sırasında SK fazının tam olarak korunmadığı
açığa çıkarıldı.

viii
Anahtar kelimeler: Liyotropik sıvı kristal, mezofaz, geçiş metalleri ve sulukompleksleri, nötral yüzey-aktifler, mezogözenekli malzemeler,metal sülfürler.

ix
ACKNOWLADGEMENT
I would like to express my deep gratitude to Asst. Prof. Dr. Ömer DAĞ for his
encouragement and supervision throughout my studies.
I would like to thank to Mr. Murat GÜRE (Bilkent University Department Of
Physics) and Mr. Erdem YAŞAR (Kırıkkale University Department Of Physics) for
their help and support for recording SEM and TEM images, respectively.
I am very thankful to Ol’ga SAMARSKAYA, Özlem DEMİR, Sinan BALCI
A.Çağrı ATEŞİN, and all present and former members of Bilkent University
Chemistry Department for their kind helps and supports during all my study.
I whis to thank to Ahmet GÜNAY, for his help in preparation of some of the
samples.

x
TABLE OF CONTENTS
1.INTRODUCTION……………………………………………………………………..1
1.1. FROM BULK TO MOLECULAR MATERIALS……………………………….1
1.2. LIQUID CRYSTALS…………………………………………………………….6
1.3. MESOPOROUS INORGANIC MATERIALS…………………………………12
1.4. LIQUID CRYSTALLINE PHASE; TEMPLATE FOR INORGANIC
MATERIALS……………………………………………………………………20
2.EXPERIMENTAL……………………………………………………………………23
2.1.MATERIALS…………………………………………………………………….23
2.2.SYNTHESIS……………………………………………………………………..23
2.2.1.Synthesis of Liquid Crystal Phase of Inorganic Salts……………………...23
2.2.2. Synthesis of CdS and ZnS………………………………………………...24
2.3.INSTRUMENTATION………………………………………………………….25
2.3.1. Polarized Optical Microscopy……………………………………………..25
2.3.2. X-Ray Diffraction…………………………………………………………26
2.3.3. FT-IR Spectroscopy……………………………………………………….27
2.3.4. UV-VIS Spectroscopy…………………………………………………….27
2.3.5. Scanning and Transmission Electron Microscopies (SEM and TEM)……28
3.RESULTS AND DISCUSSIONS…………………………………………………….29
CHAPTER-1…………………………………………………………………………29

xi
3.1.1. Lyotropic Liquid Crystalline (LC) Phase Behavior of Poly(oxyethylene)
Type Nonionic Surfactants with Transition Metal Aqua Complexes as a
Second Component……………………………………………………….29
3.1.2. Polarised Optical Microscopy (POM) and Thermal Properties…………...34
3.1.3.PXRD Analysis…………………………………………………………….43
3.1.4.FT-IR Spectral Studies……………………………………………………..54
3.1.5.Vis-Near-IR Spectral Studies………………………………………………74
CHAPTER-2…………………………………………………………………………77
3.2.1.Synthesis of Mesoporous Metal Sulfides…………………………………..77
3.2.2. FT-IR Spectral Analysis…………………………………………………..78
3.2.3. X-Ray Analysis……………………………………………………………80
3.2.4. SEM and TEM Analysis…………………………………………………..84
3.2.5.UV-Vis Spectral Analysis………………………………………………….86
4.CONCLUSION……………………………………………………………………….92
5.REFERENCES………………………………………………………………………..95

xii
LIST OF TABLES
1. PORE-SIZE REGIMES AND REPRESENTATIVE POROUS INORGANIC
MATERIALS……………………………………………………………………12
2. THERMAL PROPERTIES AND COMPOSITION OF MX2/NO
MIXTURES……………………………………………………………………...36
3. THERMAL PROPERTIES OF FOR MX2/NO MIXTURES WITH FREE
WATER. THE SURFACTANT/WATER IS 50 WT %. M; Ni(H2O)62+,
Co(H2O)62+, AND X; NO3
-, Cl–…………………………………………………42
4. FIRST AND SECOND DIFFRACTION LINES OF HIGH MX2/NO MOLE
RATIOS OF Cd AND Zn SAMPLES…………………………………………...52
5. DIFFRACTION LINES AND THEIR ASSIGNMENTS FOR VARIOUS
MX2/NO MOLE RATIOS. M= Cd(H2O)42+, Co(H2O)6
2+, Zn(H2O)62+, Ni(H2O)6
2+ ,
X= NO3-, Cl-……………………………………………………………………..53
6. VIBRATIONAL FREQUENCIES (cm-1) AND ASSIGNMENTS OF
NITRATES………………………………………………………………………61
7. IR PEAKS AND THEIR ASSIGNMENT OF POE IN SOLID AND IN
MOLTEN STATE, SURFACTANT (C12H25(CH2CH2O)10OH), AND
CoCl2.6H2O/SURFACTANT MIXTURE………...…………………………......67
8. OPTICAL BAND GAPS OF MESOPOROUS CdS AND ZnS SYNTHESIZED
WITH DIFFERENT MX2/NO MOLE RATIOS AND THE BULK VALUES….89

xiii
LIST OF FIGURES
1. Representative phase transition, from solid to liquid crystal and then to liquid
phase…………………………………………………………………………………..7
2. Various types of surfactants…………………………………………………………...8
3. General lyotropic liquid crystalline phases, formed when a solvent and amphiphilic
macromolecules are mixed…………………………………………………………..10
4. Schematic phase diagram for C16TMABr in water………………………………….11
5. Formation of microporous and mesoporous molecular sieves by using short and long
alkyl chains…………………………………………………………………………..14
6. Two possible pathways for LCT mechanism………………………………………...15
7. Hydrolysis and polymerization-condensation reactions of silica alkoxide…………..18
8. Lyotropic liquid crystalline phases used as structure directing media (Template)…..21
9. Glass cells, used in the synthesis of metal sulfides. The cell A used for the synthesis
of thin film samples on a quartz substrate and the cell B (shlenk) used for large
quantities……………………………………………………………………………..25
10. Representation of structure of LC phase formed directly with metal aqua complexes
by the help of hydrogen bonding…………………………………………………….32
11. POM images of (a) Ni(NO3)2.6H2O/No hexagonal, (b) Co(NO3)2.6H2O/No hexagonal,
(c) Cd(NO3)2.4H2O/No hexagonal, (d) cubic phase of Cd(NO3)2.4H2O/No with a mole
ratio of 3.6…………………………………………………………………………....35
12. Temperature profiles for Co and Ni complexes with C12EO10….…………………...38
13. Temperature profiles for Cd and Zn complexes with C12EO10……………………….39

xiv
14. Temperature profiles for MX2/No mixtures with free water. The surfactant/water is 50
wt %. M; Ni(H2O)62+ , Co(H2O)6
2+ and X; NO3-, Cl-………………………………..41
15. Schematic representation of X-ray diffraction from atomic planes………………….43
16. First three diffraction lines of hexagonal structure……………………….………….44
17. X-ray diffractogram of Cd(NO3)2.4H2O/Surfactant, mole ratio is; 2………………..45
18. PXRD patterns of Cd(NO3)2.4H2O/Surfactant, with increasing mole ratios………...46
19. X-ray diffractogram of Ni(NO3)2.6H2O/Surfactant, mole ratio is; 2.6………………47
20. X-ray diffractogram of Ni(NO3)2.6H2O/Surfactant, with increasing mole ratios……48
21. X-ray diffractogram of (A) Co(NO3)2.6H2O/Surfactant, mole ratio is; 2.6, (B)
Co(NO3)2.6H2O/Surfactant, with increasing mole ratios…………………………….49
22. X-ray diffractogram of (A) CoCl2.6H2O/Surfactant, mole ratio is; 2.2, (B)
CoCl2.6H2O/Surfactant, with increasing mole ratios………………………………...50
23. X-ray diffractogram of (A) Zn(NO3)2.6H2O/Surfactant, mole ratio is; 2.6, (B)
Zn(NO3)2.6H2O/Surfactant, with increasing mole ratios…………………………….51
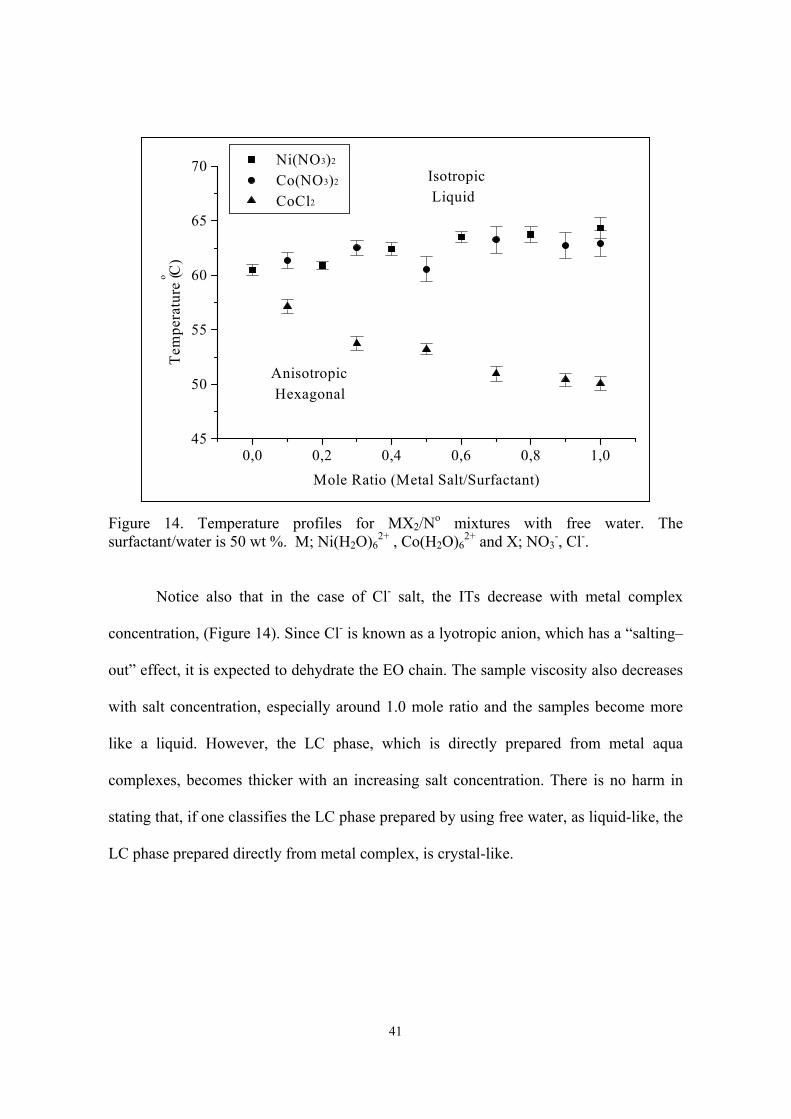
24. FT-IR spectra of (a) pure (molten) surfactant, (b) surfactant/water (50 wt %), (c)
Cd(NO3)2.4H2O/surfactant, mole ratio of 2………………………………………….55
25. FT-IR spectra of (a) pure (molten) surfactant, (b) surfactant/water (50 wt %), (c)
Cd(NO3)2.4H2O/surfactant, mole ratio of 2…………………………………………56
26. FT-IR spectra of (a) pure (molten) surfactant (b) CoCl2.6H2O/ surfactant, mole ratio
is 2, (c) Co(NO3)2. 6H2O/ surfactant, mole ratio is 2, (d) Co(NO3)2. 6H2O crystal…57
27. FT-IR spectra of (a) pure (molten) surfactant (b) Zn(NO3)2.6H2O/ surfactant, mole
ratio is; 0.5, (c) Ni(NO3)2.6H2O/ surfactant, mole ratio is; 0.5, (d) Co(NO3)2.6H2O/

xv
surfactant, mole ratio is; 0.5, (e) Cd(NO3)2.4H2O/ surfactant, mole ratio is; 2. All
sample contain 50 wt % water with respect to surfactant……………………………59
28. FT-IR spectra of (a) pure (molten) surfactant (b) CoCl2.6H2O/ surfactant, mole ratio
is; 2, (c) Co(NO3)2.6H2O/ surfactant, mole ratio is; 2, (d) Co(NO3)2.6H2O crystal…60
29. Trans and gauche conformers of 1,2-dimethoxyethane and GTTG conformer of -
OCH2CH2OCH2CH2O- group………………………………………………………..62
30. FT-IR spectra of (a) pure (molten) surfactant, (b) surfactant/water (50 wt %), (c)
CoCl2.4H2O/ surfactant, mole ratio is; 2……………………………………………..63
31. FT-IR spectra of (a) pure (molten) surfactant, (b) surfactant/water (50 wt %), (c)
Cd(NO3)2.4H2O/surfactant, mole ratio is 2…………………………………………..64
32. FT-IR spectra of (a) pure (molten) surfactant (b) Cd(NO3)2. 4H2O/ surfactant, mole
ratio is; 2, (c) CoCl2.6H2O/ surfactant, mole ratio is; 2………………...……………66
33. Representation of helical structure of POE, GTTG conformation. Blue ; C, red ; O,
white ; H……………………………………………………………………………..68
34. IR spectrum of CoCl2.6H2O/Surfactant with the mole ratio of (a) 1.4, (b) 1.8, (c) 2.2,
(d) 2.6, (e) 3.0………………………………………………………………………..69
35. IR spectrum of Co(NO3)2.6H2O/Surfactant with the mole ratio of (a) 1.2, (b) 1.6, (c)
2.0 (d) 2.4, (e) 2.8, (f) 3.2……………………………………………………………70
36. IR spectrum of Zn(NO3)2.6H2O/Surfactant with the mole ratio of (a) 1.2, (b) 1.6, (c)
2.0 (d) 2.4, (e) 2.8, (f) 3.2……………………………………………………………71
37. IR spectrum of Ni(NO3)2.6H2O/Surfactant with the mole ratio of (a) 1.2, (b) 1.6, (c)
2.0, (d) 2.6, (e) 3.0…………………………………………………………………...71

xvi
38. IR spectrum of Cd(NO3)2.4H2O/Surfactant with the mole ratio of (a) 1.2, (b) 1.6, (c)
2.0, (d) 2.6, (e)3.0……………………………………………………………………72
39. IR spectrum of MX2/No with the mole ratio of 2, M: (a) Ni, (b) Zn, (c) Co (d) Cd…73
40. Vis-Near-IR spectrum of various Ni(NO3)2.6H2O/surfactant mixtures (a) 0.1 M
Ni(NO3)2.6H2O solution, (b) 1.4, (c) 2.0, (d), 2.6……………………………………74
41. Vis-Near-IR spectrum of various Co(NO3)2.6H2O/surfactant mixtures (a) 0.1 M
Co(NO3)2.6H2O solution, (b) 1.4, (c) 2.0, (d), 2.6…………………………………...75
42. A; IR spectum of Cd(NO3)2.4H2O/No (a) After H2S exposure, (b) before H2S
exposure. B; after washing…………………………………………………………...79
43. A; IR spectum of Zn(NO3)2.6H2O/No (a) After H2S exposure, (b) before H2S
exposure. B; after washing…………………………………………………………...80
44. X-ray diffractograms of (a) before H2S gas exposure, (b) after washing (pure CdS),
(c) after H2S gas exposure (CdS in organic matrix). Cd(NO3)2.4H2O/surfactant mole
ratio is 6.5……………………………………………………………………………81
45. X-ray diffraction patterns of (a) before H2S gas exposure, (b) after H2S gas exposure
(ZnS in organic matrix), (c) after washing (pure ZnS), Zn(NO3)2.6H2O/surfactantmole
ratio is; 4……………………………………………………………………………..82
46. Wide angle diffractogram of CdS after washing. Synthesised from
Cd(NO3)2.4H2O/surfactant mole ratio is 1.5. ………………………………………..83
47. SEM image of CdS after washing the samples, showing the morphology of the
mesostructured CdS………………………………………………………………….84
48. TEM image of washed CdS sample, showing the mesoporosity in the sample……..85

xvii
49. Absorption spectrum of CdS. Synthesised from Cd(NO3)2.4H2O/surfactant mole ratio
is 1.8………………………………………………………………………………….88
50. Absorption spectrum of ZnS. Synthesised from Zn(NO3)2.6H2O/surfactant mole ratio
is 2.4………………………………………………………………………………….88
51. Absorption spectrum of CdS (A) and ZnS (B) synthesized from different MX2/No
mole ratios……………………………………………………………………………90

1
1. INTRODUCTION
1.1.From Bulk to Molecular Materials
The synthesis of well-defined, monodispersed nanoparticles, in the 1-100 nm
range, has attracted great attention in the materials community, because the nanoparticles
have properties in between atoms and bulk materials. Therefore the research on nano-
structured materials has developed very rapidly over last decade. The materials
community is looking for new materials for specific purposes. The major aim of the
current research in materials chemistry is to be able to control the synthesis in a
molecular level to design materials with novel property [1].
The nano-structures are assemblies of bonded atoms that have dimensions in the
range of 1 to 100 nanometers (nm). In bulk materials, the property is determined by the
bulk atoms. However, if we reduce the particle size of any material to nanometers, the
surface atoms become effective in determining the electronic [2], optic [3], catalytic [4]
and magnetic [5] properties of the materials, because the thermodynamic properties of the
atoms at interior is different than the atoms at the surface. The nanoparticles also show
reversible metal-insulator transitions due to inter-particle interactions, which may be
controlled by adjusting size of the particles and the inter-particle distance between the
particles by capping with ligands. While the bulk materials are considered to be spherical,
in nanoparticles shape is very important and may influence the optical properties of, for
instance, the metal nano-particles [6]. The factors are [7]:

2
● number of atoms on the surface to be close to the number of atom in the
interior.
● the ratio of the surface energy to the total energy to be close to unity.
● conduction or valance electrons to be confined to a small length of volume
(Particle in 3-D box).
As we reduce the size of the particles, the surface area of the particles and the
interface between particles and surroundings increase. Therefore, the surface free energy
of the particles increases [8]. This makes the colloidal particles very unstable [8]. The
small particle stability depends only on the secondary minimum [8] in their potential
energy diagram. At the secondary minimum point, the nanoparticles are meta-stable.
Therefore, the bare nanoparticles are not stable by themselves. However a stabilizer,
which is a ligand, reduces this excess free energy and organizes the nano-particles with
each other to form super-lattices. When the bare metal particles make contact with each
other, the immediate reaction is an aggregation [8]. The coordinated ligands or adsorbed
surfactant onto the surface of the clusters prevent the aggregation. The ordered
superlattices, which are composed of micrometer-sized particles, have been known in
colloid chemistry for quite a long time [8]. This is also not a new strategy for biological
systems, because from proteins to viruses, they all have nanometer dimensions.
There are many synthetic methods reported in the literature that have been applied
to synthesize ordered, monodisperse metal superlattices in the literature. Self-assembly
[9], for example, which is a spontaneous assembly process of molecules into a stable
3
structure and non-covalently joined aggregates, is one of the mostly applied methods for
size and shape tailoring. The ordered precipitation of a ligand stabilized Au has been
extensively studied [9-13]. For instance, the AuCl4- solution in water-toluene yields
colloidal micro emulsions upon reducing with sodium borohydride [9]. These colloidal
particles were stabilized with dodecanethiol, C12H25SH [10], and dithiol to synthesize
gold monolayer over a substrate [11]. These thiol derivatives coordinate to the gold
nanoparticles and protect them from coalescence. Gas-phase synthesis of bare clusters
followed by solution phase encapsulation with aryl ditihols or aryl diisonitriles has also
been applied to Au nanoparticles [12]. The basic steps in colloidal self-assembly [12-13]
of nanoparticles are:
i) synthesis of ultra-fine metal clusters with uniform diameter.
ii) adsorption of self assembled monolayer of organic surfactant on the surface of
these particles to prepare macro molecular entities.
iii) displacement of organic surfactant with a molecular interconnect that bonds
adjacent particles without destroying the order.
The colloidal pathway is widely used to prepare nanoparticles.
Inorganic/surfactant composites, dispersible in a suitable dispersion, give colloidal metal
particles stabilized in water-in-oil micro emulsions [14]. These micro emulsions have
been used as micro reactors to synthesize desired materials [15]. Polymeric processes
have also been applied. For instance, the block co-polymer micelles have been used as a
reaction vessel to prepare monodispersed particles. In these methods, the particle size is
determined by host-guest effects [16-17]. The use of 3-D crystalline superlattices [18],

4
such as zeolites, which control the geometry and shape of the nanoparticles, have been
widely demonstrated in the literature [18]. Porous glasses, [19] STM tips, [20] epitaxial
methods [21] have also been applied to get materials with desired dimensions and
geometry.
The reaction conditions are very important to obtain monodispersed crystalline
nanoparticles. For example, in the synthesis of CdS, CdSe, CdTe [22], which are capped
with tri-n-octylphosphine and tri-n-octylphosphine oxide, the modulation of reaction
temperature gives a homogenous size distribution. Different reaction conditions [23] may
lead to a distinct morphology, such as faceted crystals to ordered thin films. It is also
possible to obtain cubic [24], hexagonal [25] and triangular [26] nanocrystals depending
on the structure of the micro reactor, which is basically an organic template.
The small metal islands, separated by a barrier (stabilizer) with enhanced stability
may show very different behaviors compared with their bulk counterparts.
Semiconductors and metals, which are smaller than the diameter of bulk Bohr exciton,
show drastic changes in their electronic properties, due to zero dimensionality [27]. The
nanoparticles are better photoemitters [28] than their bulk counterparts, due to three-
dimensional confinement of electrons and holes within a particle (size quantization). The
band gap depends strongly on the particle size. For example, CdSe [28] nanoparticles
with different sizes emit from 450 nm to 650 nm, blue to red portion of the
electromagnetic spectrum.

5
The catalytic properties of colloidal particles and metal clusters have also been
extensively studied for a long time [4]. Most of the small metal clusters and colloids have
better catalytic properties compared to the bulk counterparts. The metal sols show
increasing catalytic activity with decreasing particle size [29], due to increased number of
active sites on the surface. However in some cases, like in H2-D2 exchange reaction by Pt
catalyst [30] the particle size has opposite effects. This is due to increase in the binding
energy of the molecular species on the surface of platinum nanoparticles by the decreased
particle size. As a consequence the reaction activation energy increases.
The semiconductor quantum dots have been used in photo-catalytic reactions to
increase the quantum yield, because the band gap can be tuned by changing the size of
the particles [31]. Therefore, the electron and hole redox potential can be tuned to achieve
increased redox power [31]. For example, NO3- reduction [31] has been achieved by the
CdS nano-crystals at natural pH, which is impossible, by bulk CdS.
Naturally, magnetic particles smaller than 10 nm are usually super paramagnetic
and behave as single magnetic domain. For example, Co nanoparticles synthesized, from
organometallic precursor, show larger magnetic moment per atom compared to the bulk
cobalt [32]. It has also been reported [33] that, the saturation magnetization is not only
depended on the size of the particles but also on the surface and structural characteristics
of the particles. The 2-D arranged nanoparticles have different magnetic behaviors than
the ones dispersed in solution [34].

6
As a result of their unique properties, molecule-based materials are very attractive
and represent rapidly developing area of materials chemistry. New methodologies for
synthesis and characterization of novel materials are growing very rapidly.
1.2. Liquid Crystals
Generally, three phases of the matter are considered to be solids, liquids and
gasses. Due to strong forces between the molecules, all the molecules have rigid
arrangement in solid state, because each molecule occupies a certain place (positional
order). Also the molecules are oriented in a specific direction (orientational order).
Because of the highly ordered arrangement, the attractive forces are additive. In liquid
state, molecules are neither occupy a specific average position nor remain oriented in a
particular direction. Therefore, the attractive forces are not additive. The molecules in gas
phase have less order than the molecules in the liquid phase. Therefore, the forces
between the molecules are not strong enough to hold the molecules together.
The liquid crystalline (LC) state is the fourth state of the matter and it has
properties of both liquid and solid states. When the solids melt they lose their positional
and orientational order. However in LC phase positional order may be lost but molecules
or aggregates in LC phase still have some orientational order [35], as shown in Figure
1[35].
7
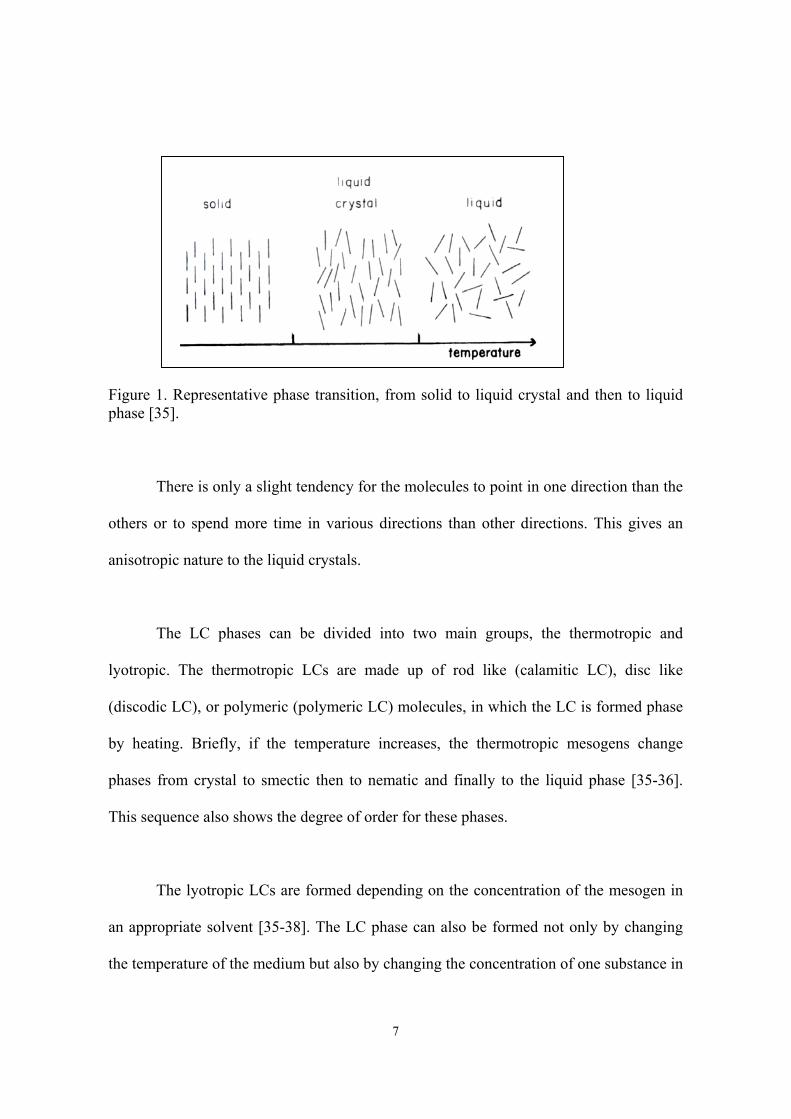
Figure 1. Representative phase transition, from solid to liquid crystal and then to liquidphase [35].
There is only a slight tendency for the molecules to point in one direction than the
others or to spend more time in various directions than other directions. This gives an
anisotropic nature to the liquid crystals.
The LC phases can be divided into two main groups, the thermotropic and
lyotropic. The thermotropic LCs are made up of rod like (calamitic LC), disc like
(discodic LC), or polymeric (polymeric LC) molecules, in which the LC is formed phase
by heating. Briefly, if the temperature increases, the thermotropic mesogens change
phases from crystal to smectic then to nematic and finally to the liquid phase [35-36].
This sequence also shows the degree of order for these phases.
The lyotropic LCs are formed depending on the concentration of the mesogen in
an appropriate solvent [35-38]. The LC phase can also be formed not only by changing
the temperature of the medium but also by changing the concentration of one substance in

8
another. In this study, the lyotropic LCs are studied, therefore only lyotropic LC phase
will be explained in detail.
The lyotropic liquid crystals (LLC) can be obtained by mixing surfactant and
water (as solvent). The surfactants have dual character and so called as amphiphilic
molecules, which have both hydrophilic (affinity for water) and hydrophobic (affinity for
oil) parts. The surfactants are surface-active molecules, which reduce the surface tension
of the solvent [39]. As a result, the surfactants adhere to the solvent surface [39]. Water is
the main solvent used. The surfactants have dual character (Figure 2) because the non-
ionic surfactants have long alkyl chains (tails) which is hydrophobic and a hydrophilic
polyoxyethylene (-CH2CH2O-, POE) head group.
Figure 2. Various types of surfactants
R
O
O
O
O
O
O
O
OH
O
S
R O
OO
-Na
+
H
H
N+
R
H Cl- Cationic
Anionic
Non ionic

9
There are various kinds of surfactants as shown in Figure 2. They can be
classified as anionic, cationic, amphoteric and non-ionic based on the type of their head
group. The anionic and cationic surfactants are electrolytes and they give the charge to
the adsorbed surface and align alkyl group away from the surface.
If a surfactant is added to water, the amphiphilic surfactant molecules orient
themselves at the air/water interface. In order to reduce water-hydrocarbon interaction,
the hydrocarbon tail orients itself toward air [35-39]. As a result, addition of surfactant
reduces the surface tension of water until a point where it stays constant. Adding more
surfactant will cause phase separation like benzene-water mixture. However neither
complete phase separation nor molecularly dispersed solution occurs. The surfactant
molecules self-assemble to create a micro phase in which the hydrocarbon chains
sequester themselves inside the aggregate and the polar head groups orient themselves
toward the aqueous phase. This is the point where micellisation is discerned and is called
critical micelle concentration (CMC). As shown in Figure 3, the addition of surfactant to
the solvent first produces dissolved surfactant molecules and upon increasing the
surfactant concentration leads to formation of micelles. Further increase in surfactant
concentration leads to the ordered mesostructures.

10
Figure 3. General lyotropic liquid crystalline phases, formed when a solvent andamphiphilic macromolecules are mixed.
The surfactants form reverse micelles (head group inside the micelle) in organic
solvents, and micelles (head group outside the micelle) in polar solvents. Such phases are
characterised by having some physical properties of both crystalline and fluid structures.
These phases will have at least one dimension, which is highly ordered and, as a result,
will exhibit relatively sharp x-ray diffraction patterns and optical birefringence.
Lamellar
Hexagonal
Cubic
Increasing Surfactant Concentration
Hydrophilic Head
Hydrophobic Tail

11
Figure 4. Schematic phase diagram for C16TMABr in water [40].
The amphiphilic molecules are associated physically not chemically [35-39], so
that they can change the size or shape of their microstructure in response to small
changes in concentration, salt content, temperature, pH, and pressure. Therefore, it is
possible to get different kind of mesophases and mesostructures by changing the
surfactant concentration and/or temperature, see Figure 4 [40].
Surfactant Concentration wt %

12
1.3. Mesoporous Inorganic Materials
Porous materials have very important features due to their micro structures, which
enable to obtain high surface area. As a result, these materials may get enhanced catalytic
activity and adsorption capacity. A lot of research has done to tailor the pore size and
shape. Many mesoporous materials have been synthesized [41] in different pore-size and
shape regimes, (see Table 1).
Table 1. Pore-size regimes and representative porous inorganic materials [41].
The zeolites with three-dimensional microporous framework structures are known
for a long time. The frameworks forming the channels and the cavities are constructed
from linked tetrahedra with many elements, which form MO4 in their structure (M = Al,
Si, P, Be, Ga, Ge, Zn). The different ways in which these tetrahedra are connected
produce different type of three-dimensional crystalline frameworks and so form different
zeolites. Due to the periodic structure of these crystalline solids, they exhibit an
extremely narrow pore size distribution and are very important in size-selective catalysis

13
[42], ion exchange (water softener in detergents) [43], desiccation, sorption [43] etc. For
example, zeolite films are used as stable gas-separation inorganic membranes and sensors
[44]. Also the use of zeolite frameworks has been extended to application as nanoreactors
[18] in the host-guest chemistry. These zeolites modified with various metals and
semiconductors (nano-scale inclusion chemistry) have potentials in electronic and optical
applications [44]. Typical areas of applications are: [45] 1) selective adsorption of large
organic molecules, 2) catalysis such as processing of tar sand, and 3) the high distillates
of crude oils to valuable low-boiling products.
There has been growing interest in the extension of microporous size dimensions
and the applications of zeolites to mesoporous size-regimes. Therefore, there have been
studies to carry the crystallinity and well–defined pore size distribution of zeolites to the
mesoporus regime by using quaternary ammonium salts [46-47]. However, these attempts
did not give desired results. Pillaring clay minerals [48], has been used as a method to
synthesize mesoporous materials. The clays are naturally occurring three-layer sheet
silicates. The structure of these clays has a net negative charge resulting from substitution
either the tetrahedral (Al3+, Fe3+ for Si4+) or octahedral (Fe2+, Mg2+ for Al3+) sites. The
charges are compensated by alkaline or alkaline earth metal ions. These metal ions can be
ion-exchanged for larger oligomeric cations [48]. The calcination of the exchanged
materials leads to connection of layers by these pillars. The pillaring increases the surface
area of the layered clay minerals [42], however majority of the pore size is in micro-
porous range due to small size of oligomeric cations.

14
Recently, Kresge et al. and Beck et al. [49-50] synthesised mesoporous molecular
sieves which is named as MCM-41 (MCM stands for Mobil’s Composition of Matter).
They have applied a liquid crystal templating approach to synthesise these materials in
the hexagonal, MCM-41, cubic, MCM-48 and lamella, MCM-50 forms. Here the
template is not small alkyl chain quaternary directing agents, which have been used in the
synthesis of zeolites, but self-assembled supramolecular quaternary ammonium ions as
shown in Figure 5 [63].
Figure 5. Formation of microporous and mesoporous molecular sieves by using short andlong alkyl chains [63].
These long chain quaternary ammonium salts are used as surfactants, which can
form various kind of supramolecular assemblies in different water/surfactant ratios. One
of the best features of the MCM family is the ability to tailor the pore size and shape.

15
Using the surfactant with different alkyl chain length leads to mesoporous materials with
different pore size and shape [49-50].
There are many mechanisms [41], which have been proposed by different
research groups to explain the formation of mesoporous silica framework. The Mobil
researchers have proposed the liquid crystalline templating mechanism for first time [49-
50]. Two kinds of pathways are assumed (see Figure 6 [41]);
1) the aluminosilicate precursor species occupy the space between a preexisting
hexagonal lyotropic liquid crystals (LC) phase and deposited on the micellar
rods of the LC phase, (see the LC section).
2) the inorganics mediate the ordering of the surfactants into the hexagonal
arrangement, (see next section).
Figure 6. Two possible pathways for LCT mechanism [41].

16
A “charge density model” was later proposed by Stucky et al. [51] based on their
X-ray analysis. In this model, the mesophase formation results from strong Coulombic
interaction between the surfactant and silicate species at the micelle interface.
A generalized liquid crystal templating mechanism [52] later has been proposed
based on electrostatic interaction between a given inorganic precursor (I) and the
surfactant head group (S). In this model, the synthesis of MCM type mesoporous
materials was based on the condensation of cationic surfactant (S+) and anionic inorganic
species (I-). However various charge matching pathways which are (S-I+), (S+X-I+) X= Cl-
, Br- or (S-M+I-) M= Na+, K+ are employed to get mesoporous materials [52]. In highly
acidic media (pH<2) the silicate species are cationic (I+) but cationic surfactant (S+) can
be used to synthesize mesoporous materials because anionic counter ion X- can behave as
buffer between the S+ and I+. Therefore X- mediates formation of mesoporous silica. The
resulting materials are known as “acid prepared mesostructures” or SBM materials
[41,52]. The SBM-1, for cubic, SBM-3, for 2D hexagonal and SBM-2, for 3D hexagonal
structures have different pore wall thickness and framework charge due to different
precipitation conditions compared with base-derived mesoporous materials. The SBM-2
is the regularly caged mesoporus silica, however the other mesoporus silica structures
posses uniform pore channels but not cages [53].
In contrast to the charge matching methods, the mesoporous materials have also
been synthesised using neutral templates [54]. This method is based on hydrogen bonding
and self-assembly between natural primary amine micelle (So) and neutral inorganic

17
precursor (Io). In contrast to the previous methods SoIo pathway allows facile recovery of
the template by a simple solvent extraction. Natural alkyl amines are costly and toxic and
consequently they are not suited to large-scale synthesis of mesoporous structures. The
non-ionic poly ethyleneoxide, CnH2n+1(CH2CH2O)mOH, (PEO) surfactants are used to
mediate the mesoporus structures [55]. The PEO type surfactants are biodegradable and
also offer synthetic versatility. In this method, it is possible to prepare mesoporous metal
oxides that are not accessible by electrostatic templating method. The metal alkoxides
that readily hydrolyze to the corresponding metal oxide can be templated by PEO type
nonionic surfactants [55].
The lyotropic liquid crystalline phase as a templating media was first used by
Attard et al. [56] for the synthesis of mesoporous silicates. Here, the sol-gel synthesis of
the inorganic nanostructure takes place in the ordered environment of a bulk surfactant
mesophase. The polycondensation of water-soluble silicates confined within the aqueous
domains of a microphase-separated medium yields monolithic mesoporous silicates. This
method has an advantage of having a high degree of control over the structure. These
monolithic silica materials are large crack-free objects. The continuous silica films with
large cage and pore structures have been synthesised [57-58] by poly(ethylene oxide)-
block-poly(propylene oxide)-poly(ethylene oxide) triblock copolymers. It is possible to
extend the pore size up to 300 Å [59] and get various type of mesoporous structure [60]
by changing the type of copolymer. Note also that the PEO type surfactants and
amphiphilic block copolymers enabled to synthesise [61-62] mesoporous TiO2, ZrO2,
Al2O3, Nb2O5, Ta2O5, WO3, HfO3, SnO3, Pt, CaHPO4, CdS, and ZnS inorganic materials.

18
The EO units in the surfactant complex with inorganic ions through weak coordination,
and forms a mesoscopic structure [61-62].
Both sol-gel derived oxides and oxide molecular sieves are usually prepared from
oxide gels. In a certain sense, both can be regarded as sol-gel derived oxides, differing
only in their degree of structural ordering [63-64]. In sol-gel derived oxides, neither the
oxide framework nor the pore structure is ordered. The mesoporous oxide molecular
sieves have ordered and uniform pores. As shown in Figure 7, the hydrolysis and then
polymerisation-condensation reaction produce amorphous oxide framework. However
usage of supramolecular structure directing agents produce well ordered structures with
adjustable pores.
Figure 7. Hydrolysis and polymerization-condensation reactions of silica alkoxide.
The hybrid mesoporous materials have also been synthesised to change the
properties of bare mesoporous materials [65-66]. These hybrid organic-inorganic groups
can be inside the inorganic framework [65] or over the pore wall [66].
OR Si OR
OR
OR
+ H2O OR Si OH
OR
OR
+ ROH Hydrolysis
OR Si OH
OR
OR
+ ORSiHO
OR
OR
O Si O
O
O
O Si
O
O
+ H2O Condensation

19
Polymerization-condensation reactions can be acid or base catalyzed and both
pathways gives different structures and pore sizes [65-66]. Adjusting reaction conditions
can give desired materials. Also functionalizing the pore walls of the mesoporous
structures gives many materials with unique properties [67]. The functionalization may
be done by co-condensation of original silica source, tetraethoxysilane, with derivatives
of silanes [67] or through ion exchange [68]. There are numerous reports that concern
the modification of the internal surfaces of MCM type materials with a variety of metals
and non-metals. These composite materials can open new areas for application. For
example MCM-41 modified with nano-structured Si [69], CdSe [70], or GaN [71], may
have application in optoelectronic devices. The mesoporous materials modified with
LiCF3SO3 [72], shows high ionic conductivities at room temperature. The Ag
nanoclusters in mesoporus [73] materials show drastic changes in optical properties.
Now, for the synthesis of better molecular devices and nanoelectronics, chemist
faced with extension of mesoporous materials beyond the oxides. The synthesis of metal
sulfides is still not developed very well. The problem is mainly in the method of
synthesis, because the reaction of metal precursors with H2S is fast and does not allow
controlling the morphology and the particle size. The first LC templated CdS, which has
been synthesized in the presence of non-ionic surfactant, [74-77] gave hexagonally
ordered mesostructure. The syntheses of microporous metal sulfides have also been
reported [78-79]. However, these used LC templating methods have some drawbacks,
like low metal ion concentration. Therefore, new methods are essential in order to
improve the materials quality and property.

20
1.4. Liquid Crystalline Phase; Template for Inorganic Materials
Designing new molecular materials with novel properties is a newly growing
scientific and technological area [1]. The templating step is crucial in order to be able to
make materials with desired shape and size. In template based synthesis, inorganic
materials copy the shape and the size of the organic template [80]. The organic templates
enable to manipulate the microstructure at molecular level, such as biomaterials [81]
semiconductor materials synthesised in phosphatylcholine vesicles, nano reactors, [82]
and lamellar liquid crystalline phase [83]. In a newly growing area, the 3D photonic
crystals, [84] silica colloidal crystals have been used as a template to replicate interstitial
void space, in the form of high refractive index materials. As stated in the previous
sections, the liquid crystalline phase is used as a template for sculpting and shaping
mesoporous materials [41,49-50,52-53,55,58,74-77].
The organic template is a building block and forms a network. It directs the
structure of the inorganic material during the synthesis. This ordered network has
periodic voids. If it is possible to carry the polymerisation and condensation reactions of
the inorganic precursors in these voids, it allows to mimic the shape and size of organic
building block. Removing organic template from inorganic matrix leaves porous
inorganic material in desired shape and pore size. There are several factors that are
important [40] to copy the template: (1) the nature of the interaction between the template
and embedding matrix, (2) the ability of the matrix to conform to the template, (3) the
relative sizes of the template and the primary units used to construct the matrix.

21
Figure 8. Lyotropic liquid crystalline phases used as structure directing media (Template)[109a].
The supramolecular surfactant molecules form aggregates when mixed with
solvent. These aggregates (micelles) produce the liquid crystalline (LC) phase. In the LC
phase templating approach, see Figure 8 [109], the inorganic precursor polymerizes or the
reaction takes place in the polar region of the template. Therefore, inorganic matrix
mimics the shape and the size of LC phase, depending on which type of LC phase is
used. The interactions between the surfactant and the inorganic precursors, depending on
the surfactant type, can be electrostatic (if anionic or cationic surfactant is used) or
hydrogen-bonding type (if non-ionic surfactant is used) [85]. Also changing the length of
alkyl group of the surfactant molecule changes the sizes of the miceller rods, therefore it
is possible to change the pore size of the inorganic material. However, this templating
method is mostly applicable to the synthesis of mesoporous silica [41,49-50,52-54] and
also other metal oxides [61-63]. In order to be able to synthesise other inorganic
materials, such as metal sulfides in desired size and shape, new templating methodologies
should be developed.

22
In this thesis, for the first time, we demonstrate that the LC phase of non-ionic
surfactants can be formed using aqua complexes of transition metals. In this content, the
second component, water, which is the solvent in lyotropic LCs, is replaced by
coordinated water molecules. Unlike of the free water molecules, the coordinated water
molecules organize the surfactant molecules into more stable structures (hexagonal and
cubic). The LC behaviour of the non-ionic surfactant, C12H25(CH2CH2O)10OH, in the
presence of Ni(II), Co(II), Cd(II), and Zn(II) and the formation of mesoporous CdS and
ZnS have been demonstrated. These structures (cubic and hexagonal) template the
synthesis of mesoporous metal sulfides.

23
2.EXPERIMENTAL
2.1.Materials
All chemicals and solvents were reagent grade and used as received without any
further treatment.
The surfactant used throughout this work, homogeneous polyoxyethylene 10
lauryl ether (C12E10), is commercially available from Sigma, Germany. Cobalt (II) nitrate
hexahydrate (Co(NO3)2·6H2O, 98 % pure) , cobalt(II) chloride hexahydrate (CoCl2·6H2O,
98 % pure) and hydrogen sulfide (H2S, 99.5 %pure) were obtained from Aldrich,
Germany. Nickel (II) nitrate hexahydrate (Ni(NO3)2·6H2O, 97 % pure), zinc (II) nitrate
hexahydrate (Zn(NO3)2·6H2O, 99 % pure) and cadmium (II) nitrate tetrahydrate
(Cd(NO3)2·4H2O, 99 % pure ) were obtained from Merck, Germany.
2.2. Synthesis
2.2.1. Synthesis of liquid crystal phase of inorganic salts
All samples were prepared by direct mixing the surfactant,
C12H25(CH2CH2O)10OH (represented No), and metal complex salts (Co(NO3)2·6H2O,
CoCl2·6H2O, Ni(NO3)2·6H2O, Zn(NO3)2·6H2O, and Cd(NO3)2·4H2O, (which are denoted
as MX2) in solid phase. One gram surfactant (1.595x 10⁻³ mole) is mixed with metal

24
salts, in mole ratios of (MX2/No); 0.1-7.0. Then, the mixture was either heated up to
isotropisation temperature of the sample or dissolved in acetone which can be pumped
out under vacuum to obtain homogenous mixtures. However, most of the samples used
through out this work were prepared by heating over the melting point and shaking
constantly then cooling to room temperature (RT). This heating and cooling cycles were
repeated several times to achieve homogeneity. Finally, the samples were kept below
their isotropisation temperature (IT) for several hours. However over heating, especially
in the case of (Cd(NO3)2·4H2O) samples, may destroy the desired liquid crystal (LC)
phase.
The surfactant-water-metal salt samples were prepared by mixing 50:50 wt % of
water and surfactant (1gr water, 1gr surfactant) and then CoCl2·6H2O),
(Co(NO3)2·6H2O)) and (Ni(NO3)2·6H2O) salts are added to this mixture with a MX2/No
mole ratio 0.0-5.0. The same procedure, which was applied to the water free samples,
was used to homogenize the samples.
2.2.2. Synthesis of CdS and ZnS
First, the liquid crystal phase, containing Cd(NO3)2·4H2O and Zn(NO3)2·6H2O
complexes have been prepared as described above. The thin films of the LC phases were
prepared on quartz substrates and then these samples were exposed to H2S gas in a
specially designed, evacuated glass cell. (Figure 9). This gives CdS and ZnS film
samples over quartz substrates. Another pathway is that the samples prepared in a shlenks
25
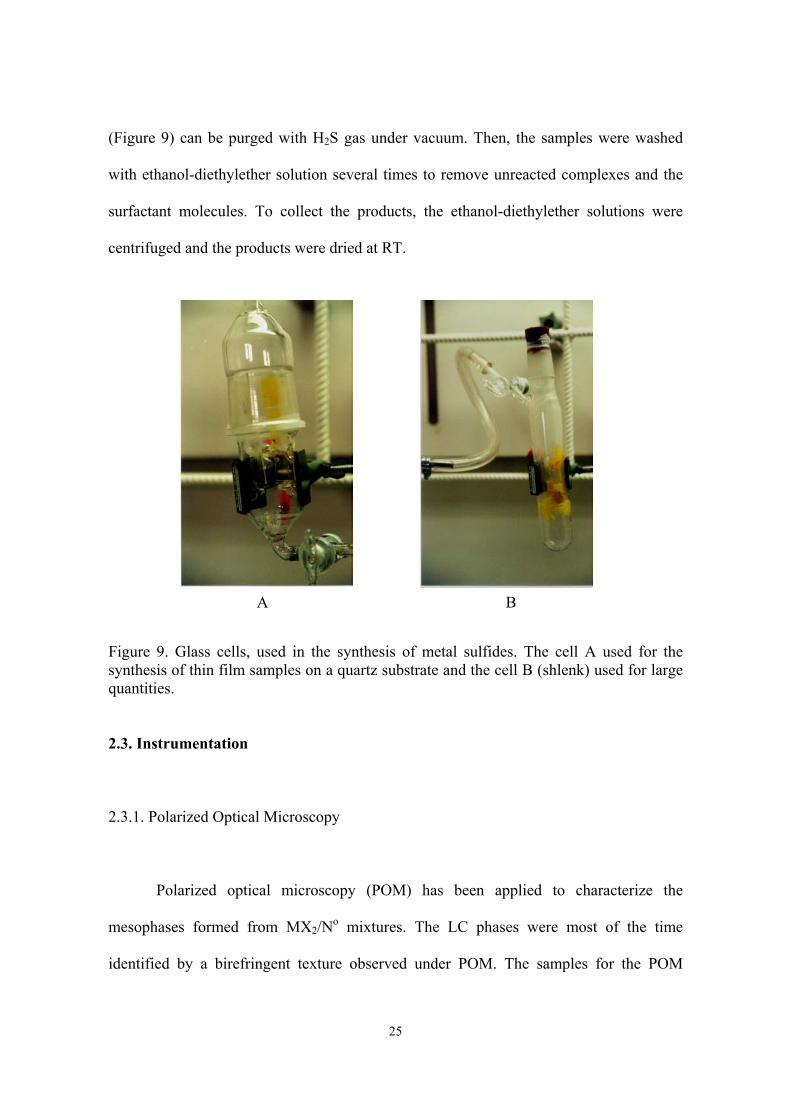
(Figure 9) can be purged with H2S gas under vacuum. Then, the samples were washed
with ethanol-diethylether solution several times to remove unreacted complexes and the
surfactant molecules. To collect the products, the ethanol-diethylether solutions were
centrifuged and the products were dried at RT.
Figure 9. Glass cells, used in the synthesis of metal sulfides. The cell A used for thesynthesis of thin film samples on a quartz substrate and the cell B (shlenk) used for largequantities.
2.3. Instrumentation
2.3.1. Polarized Optical Microscopy
Polarized optical microscopy (POM) has been applied to characterize the
mesophases formed from MX2/No mixtures. The LC phases were most of the time
identified by a birefringent texture observed under POM. The samples for the POM
A B

26
images were prepared by sandwiching the LLC samples in between two glass slides, and
heating it above its IT, and then cooling to RT.
The POM images were recorded in transmittance mode on a Meije Techno
ML9400 series Polarising Microscope with reflected and transmitted light illumination,
using covergent white light between parallel and crossed polarisers. The thermal
properties of the mixtures were studied using a Leica Microscope Heating Stage 350
attached to the above microscope. The hot-stage was operated with 3 oC/min heating rate.
The attached hot-stage was calibrated against the melting point of naphthalene, which is
80 oC.
Stereo microscope Stemi 2000 from Carl Ziess Jena GmbH with halogen lamp
6V/10W equipped for bright field and phase contrast was used to record the images.
Power of the objective was 10x/0.25.
2.3.2. X-Ray Diffraction
The powder x-ray diffraction, PXRD, patterns were collected on a Rigaku
Miniflex diffractometer using a high power Cu-Kα source operating at 30kV/15mA. The
samples, which are in the LC phase, were prepared on a 0.5 mm glass sample holder. The
PXRD patterns were recorded twice for each sample. The first measurements were
carried on a less ordered sample (un-oriented) and the second one was carried using a
sample heated up to IT and cooled back to RT to obtain well ordered LC phase

27
(oriented). This was found to be essential in order to see all diffraction lines. The PXRD
patterns of ZnS and CdS powder samples were recorded with a 0.2 mm glass sample
holder. All the measurements were recorded using 0.20 theta/min scan rate and 0.01 data
interval the 2θ range between 1.0 and 10.0. Between 1.0 and 10.0 2θ, the scan rate was
1.00 theta/min and at higher theta values, the scan rate was 4 theta/min.
2.3.3. FT-IR Spectroscopy
The transmission FT-IR spectra were recorded with a Bomem Hartman MB-102
model FTIR spectrometer. A standard DTGS detector was used with a resolution of 4
cm-1 and 128 scan for all samples. The MX2/No samples were prepared as a thin film over
a Si(100) wafer surface. The samples, MX2:No:H2O, prepared using 50 wt %
water/surfactant were sandwiched between two Si(100) wafers. The IR spectra of the
powder CdS and ZnS samples were recorded as KBr pellets. The IR spectra of the
powder CdS and ZnS samples were also recorded by preparing colloidal dispersion of the
sample with ethanol and by evaporating several drops of this suspension over a Si(100)
wafer. The FT-IR spectra of all of the samples were recorded in 200-4000 cm-1 range.
2.3.4. UV-VIS Spectroscopy
UV-Vis absorption spectroscopy was used for characterization and also to obtain
information about the electronic properties of the mesostructured CdS and ZnS. The UV-
Vis spectra were recorded using a Varian Cary 5 double beam spectrophotometer with
28
150 nm/min speed with a resolution of 2 nm over the wavelength range from 1400 to 200
nm. The UV-Vis absorption measurements were recorded using thin films of
mesotructured CdS and ZnS samples over quartz slides and the MX2 /No samples were
sandwiched between two glass slides.
2.3.5. Scanning and Transmission Electron Microscopies (SEM and TEM)
The TEM images were recorded at 300 kV using a JEOL 3010. TEM specimen of
metal sulfide is prepared under ambient conditions by depositing a droplet of ethanol-
metal sulfide suspension on to carbon films supported on copper grid.
The SEM images were recorded at 16 and 25 kV using a JEOL 6400. The SEM
specimen of the metal sulfide is prepared under ambient conditions by depositing a
droplet of ethanol-metal sulfide suspension onto a gold coated silica wafer.

29
3.RESULTS AND DISCUSSIONS
CHAPTER 1
3.1.1. Lyotropic Liquid Crystalline (LC) Phase Behavior of Poly(oxyethylene) Type
Nonionic Surfactants with Transition Metal Aqua Complexes as a Second
Component.
We have studied the liquid crystal (LC) phase behavior of different transition
metal aqua complexes, MYx.nH2O (M= Co2+, Ni2+, Cd2+, Zn2+, Fe2+,) (Y= NO3-, Cl-,
SO42-, CH3COO-), with polyoxyethylene type nonionic surfactants (No). The mixing of
MYx.6H2O with No, depending on the concentration range and type of counter ion, has
produced a new phase. It is well known [35-36] that amphiphilic molecules form
lyotropic LC phase depending on amphiphile concentration in water solution. Here, water
molecules are the second component for such LC phases. The lyotropic LC phase occurs,
because the oil-like tail group (in this work, C12H25-) of the surfactant tends to minimize
the interaction with water and forms micelle in diluted water solutions. However, the
polar EO groups (-(CH2CH2O)10OH) tend to stay outside the micelle. Usually, the metal
complexes were added to the media as a third or forth component of the mixture [74-77,
83,86-87]. In such systems, the LC phase is obtained by using water, where the polar-

30
apolar interactions organise the structure and determine the structure type. In these
studies, it is widely accepted that metal salts dissolve in the water (polar) region.
This approach has also produced numerous solid materials with mesoprous
structures. It is well established that, for example, the polymerization of silica species
takes place in polar region of the LC phase and the final product is the cast of the LC
structure [56]. This method has also been used to synthesise various inorganic solid
materials [88-89]. Here the LC phase is a structure-directing agent (template). However,
in all these procedures, there is a well-known problem. The addition of electrolytes to the
pre-constructed LC phase would affect the shape of micelles and mostly reduce the
stability of the LC phase [90-95]. Therefore dilute concentrations of metal salts have been
used in the synthesis of mesoporous CaPO4, CdS, ZnS, [74-77,83] by preserving the LC
phase [96-97]. Attard et al. has shown a stabilisation of the LC phase in the presence of
hexachloroplatinicacid (HCPA) as the third component [98]. Again in this study, the LC
phase was constructed from free water, and salt concentration was very low [98].
The inorganic electrolytes can be classified into two groups [99-100] according to
their effect on mutual solubility of water and No. The first, lyotropic, reduces the mutual
solubility between surfactant and water (salting out effect) such as Cl- and SO42- ions; and
the second hydrotropic, increases the mutual solubility between the surfactant and water
(salting in effect) such as NO3- and ClO4
- ions [99-100]. This effect had been first studied
by Hofmeister more than a century ago [101]. According to his observations the mutual
solubility is decreased by the electrolyte (inorganic solids) in the order of; SO42->HPO4
2-

31
>CrO4->CO3
2->Cl->Br->NO3->I-> ClO4
->SCN-. These additives reduce or increase the
hydrophilicity of the surfactant. The studies on discontinuous cubic [102] and hexagonal
[103] phases revealed that the addition of NaCl reduces the melting and cloud point
(reduction of stability) of the LC phase. This is believed to be due to dehydration of the
polyethylene oxide (EO) chain. Also note that lyotropic salts cause the effective cross-
sectional area per one surfactant molecule to shrink in hexagonal phase due to
dehydration of EO chain. However, if NaSCN is added, the melting point shows almost
no change at low concentrations but decreases at higher concentrations [102-103]. In
addition it is well known that [104] some electrolytes make water a better solvent
(structure breakers) and some make water a poorer solvent (structure makers) for EO
chain. The structure breakers disrupt the association of water molecules and the structure
makers enhance it as shown below:
nH2O (H2O)n
The structure breaking anions [91] I- and SCN-, have low electronegativity, high
polarizability and weak electrostatic fields, therefore they disrupt the structure of water
and “salt in” the surfactant. However the SO42- and PO4
3- anions have high
electronegativity and low polarizability therefore they “salt out” the surfactant [91].
In this work, we demonstrate the construction of a LC phase directly from metal
aqua complexes. The coordinated water molecules mediate the formation of the LC
phase. It is well known [105] that crown ethers can form different kind of hydrogen

32
bonding with the metal aqua complexes, as shown in Figure 10. Our surfactant molecule
has an EO chain, that acts like crown ethers, forms hydrogen bonds with metal aqua
complexes. This interaction organises the surfactant molecules into hexagonally ordered
rods that build the LC hexagonal structures, illustrated in Figure 10.
Figure 10. Representation of structure of LC phase formed directly with metal aquacomplexes by the help of hydrogen bonding.
We observed the same trend as it is given in Hofmeister series. The Cl-, SO42- and,
H3CCOO-salts of metal complexes did not produce the LC phase with the surfactant.
These salts are lyotropic and reduce the hydrophilicity of the EO chain of the surfactant.
Therefore, the solubility of these metal complexes in surfactant is very low and the
mixtures undergo complete phase separation (as pure surfactant and complex crystals).
However, the LC phase can be constructed with water in the presence of a very low
concentration of the transition metal salts of lyotropic anions. Because of high

33
concentration of free water, these salts dissolve in the water region and the LC phase can
tolerate small amount of these lyotropic anions. However, there is no free water used, in
our systems therefore such lyotropic counter anion effects on hydrophilicity of EO chain
can be directly observed. No mutual solubility of the Cl-, SO42- and, H3CCOO- salts of
these transition metal hexahydrate complexes is observed. However, the metal nitrates
are hydrotropic salts, and they increase the solubility. Therefore, relatively high solubility
between No and MYx.nH2O has been observed. Due to the hydrogen bonding between the
coordinated water and No, the LC phase is constructed. In contrast to the previous works,
we have increased the salt concentration. In addition, we observed a higher LC phase
stability with an increasing salt concentration up to a saturation point.
In the Fe(NO3)3.nH2O/No systems, the LC phase is not stable in that the oxidative
reduction of EO chain [106] with Fe(III) ion takes place. Due to low hydrophilicity of EO
chain by Cl-, SO42- and, H3CCOO- counter ions; the salts of metal aqua complexes were
excluded from this study. However, CoCl2.6H2O is an exception, because it undergoes
dehydration followed by dimerization reaction and forms CoCl42- ion. In this complex,
the counter ion is no longer Cl- but is CoCl42-. The CoCl4
2- ion also behaves similarly to
the NO3- ion. Upon mixing CoCl2.6H2O with No, one observes a sharp color change from
reddish pink to blue, which is a good indication of CoCl42- ion [107].
The LC phase behaviours of Co(NO3)2·6H2O, Ni(NO3)2·6H2O, Zn(NO3)2·6H2O,
CoCl2·6H2O and, Cd(NO3)2·4H2O salts with polyoxy ethylene type nonionic surfactant
have been extensively studied.

34
3.1.2. Polarised Optical Microscopy (POM) and Thermal Properties
The polarised optical microscopy (POM) is a very powerful tool in the
determination of the structure of liquid crystals. An optical texture generated by liquid
crystals and other mesophases enables us to identify the structure type. Anisotropic
mixtures or materials have different indices of refraction in different directions. This
birefringence allows us to see different textures for different anisotropic LC samples. For
example, a hexagonally ordered LC phase produces a focal conic fan texture between
cross polars, and cubic phase does not produce any kind of a texture. The POM images
obtained between cross polars of this phase are completely black (no light passes through
the analyzer of the microscope) Figure 11.
The POM images of most of the samples studied in this work show very similar
textures. In the Ni(NO3)2.6H2O, Co(NO3)2.6H2O, and CoCl2.6H2O samples, we observed
focal conic fan texture, Figure 11, between 1.2 and 3.2 MX2/No mole ratios. This is an
indication of a hexagonally ordered LC structure. Above this concentration range, the
mixtures undergo crystallization. Depending on the metal complex, the crystallization
starts at different mole ratios. For example, the crystallization starts at 3.4, 3.6, 3.2, mole
ratios for Ni(NO3)2.6H2O, Co(NO3)2.6H2O, and CoCl2.6H2O, respectively. At higher
concentrations of these complexes, the LC phase is still present, but it is mixed with the
salt crystals. However, the fresh samples of higher concentrations may show a
homogeneous LC phase but are stable only for several hours. All measurements were
recorded 24 hours after preparation.

35
Figure 11. POM images of (a) Ni(NO3)2.6H2O/No hexagonal, (b) Co(NO3)2.6H2O/No
hexagonal, (c) Cd(NO3)2.4H2O/No hexagonal, (d) cubic phase of Cd(NO3)2.4H2O/No witha mole ratio of 3.6. The scale bar is 200 µm.
The Zn(NO3)2.6H2O (ZnX2) and Cd(NO3)2.4H2O (CdX2) salts show different
behaviours when compared with the other three metal complexes. They also show a focal
conic fan texture, Figure 11, under the POM. The CdX2/No and ZnX2/No mixtures are
optically anisotropic between the ranges of 1.4-3.2 and 1.2-3.4, respectively. The
mixtures do not show crystallization above these mole ratios but they are optically
isotropic at RT. The ZnX2/No mixture shows LC phase till 5.0 mole ratio. However it is
not very stable, in that it crystallizes within one day.
A B
C D

36
The CdX2/No mixtures do not show any crystallization up to a 7.0 mole ratio.
However, around the 7.0 CdX2/No mole ratio, the mixture seems to decompose from gel
phase (mesophase) to a liquid phase. The CdX2/No and ZnX2/No mixtures do not show
focal conic fan texture above a 3.0 and 3.2 mole ratio, respectively at RT. They have
completely dark appearance, between the cross polars Figure 11, at RT. This may be an
indication of a cubic phase. The high viscosity and no fluidity also support this proposal
(also see, the section on PXRD).
Table 2. Thermal properties and composition of MX2/No mixtures. Start is starting andend is end point of hexagonal phase.
Transition Metal Aqua Complexes Isotropisation Temperature (oC)MX2/N0
(mole) Ni(NO3)2 Co(NO3)2 CoCl2 Zn(NO3)2 Cd(NO3)21,1 27-30,41,2 31-31,9 38-391,3 32-34,31,4 33,3-34 35-35,8 29-31 49,8-51 48,3-49,81,5 45-48,4 56-591,6 50,5-51,3 47-48,2 41,2-42,8 66-67 62-63,31,7 53,5-55,11,8 64,5-67 59-60,8 49,5-50,7 70,2-72 71-73,11,9 68,5-69,52 72,7-74,8 67,2-68,9 60,8-62,3 75,5-77,5 81,2-83
2,1 74,5-76,12,2 79-81,2 76,7-79,3 64,5-66,7 79-80 89-912,3 82-842,4 82,3-83,5 79,5-80,5 78,5-80,3 84,5-86,5 94-96,32,5 87-88,72,6 88,4-90 88,3-90,3 79,9-81,8 86,5-88,3 97-100,52,8 89,7-90,2 89,3-91,3 88-91 87,5-90 100,5-105,53 91-91,7 91-93,5 93,5-96 86-90 102-106
3,2 84,5-85 92-95,5 Crystalization 82,5-90,5 42,5-50 (start)110-114,3(end)
3.4 Crystalization 92-95,5 35-45 (start)84,5-90 (end)
3.6 Crystalization 50-55 (start)80,5-83 (end)
51-60 (start)110-113 (end)
3.8 71,5-85 (start)106,5-115 (end)
4.0 50,5-65 (start)80-83 (end)
37
The thermal properties of these lyotropic LC mixtures were determined using a
hot stage attached to the microscope. The phase transition, from a LC phase to a liquid
phase or from a cubic phase to a hexagonal phase then to a liquid phase, temperatures
were determined for a broad range of MX2/No mixtures. Note that the anisotropic
mixtures show optical birefringence between cross polars while the melts are isotropic,
which show no texture between the cross polars. The isotropisation temperatures (IT)
were determined by watching the disappearance of the characteristic texture, using POM.
The ITs for metal complexes studied in this work are given in Table 2. In the table, the
first temperature is where anisotropy starts to disappear during heating and the second
temperature is where anisotropy starts to appear again during the cooling. The cubic
phase starts to appear above 3.0 and 3.2 mole ratio for the CdX2/No and ZnX2/No
mixtures, respectively. This phase is optically isotropic and shows a phase transition to an
anisotropic phase. Therefore it is possible to determine the anisotropisation temperature
(AT). Above 4 mole ratio for the CdX2/No and ZnX2/No mixtures, only the cubic phase
starts to appear (no hexagonal phase). The cubic phase is optically isotropic, therefore it
is not possible for us to determine the phase transition temperatures of these mixtures by
using POM.
The ITs show a constantly increasing trend with complex concentrations. This
contradicts with previous observations [76,83,91]. The disappearance of the LC phase at
high salt concentrations was observed for hydrotropic salts. Note also that, as stated in
previous works, [76,91] the addition of hydrotropic salts does not affect the IT a lot, also
our observations on the samples, which are prepared with free water show the same

38
result. However, our new approach, yields stable LC phase until the saturation point. As
shown in Figure 12 for Co and Ni complexes the IT increases with increasing MX2/No
mole ratio. For the Ni(NO3)2.6H2O, Co(NO3)2.6H2O, and CoCl2.6H2O salts, the 3.0
MX2/No mole ratio appears to be the saturation point. Note also that there is a small
decrease above this point, and then the crystallization starts.
Figure 12. Temperature profiles for Co and Ni complexes.
The CdX2/No and ZnX2/No mixtures do not show hexagonal fan texture after 3.0
and 3.2 at RT, respectively. Above these mole ratios, the samples are optically isotropic.
However, when they are heated, they display a phase transition from the isotropic to
anisotropic, which shows a focal conic fan texture, see Table 2. Like other metal
complexes, the ITs increase with the salt concentration. Between a 3.0 and 3.6 mole ratio
1,0 1,5 2,0 2,5 3,0 3,520
30
40
50
60
70
80
90
100 Isotropic Liquid
Anisotropic Hexagonal
Ni(NO3)2.6H2O Co(NO3)2.6H2O CoCl2.6H2O
Tem
pera
ture
(o C)
Mole Ratio (Metal Salt/Surfactant)

39
the LC phase has a melting point over 100 oC, which is very high compared with the LC
phase prepared by adding the free water and salt as a third component. The ZnX2/No and
CdX2/No mixtures are optically isotropic at all temperature above mole ratios of 4.0 and
3.8, respectively.
Figure 13. Temperature profiles for Cd and Zn complexes withC12EO10.
1,0 1,5 2,0 2,5 3,0 3,5 4,040
50
60
70
80
90
100
110
120
Isotropic Cubic
Anisotropic Hexagonal
Isotropic Liquid
Cd(NO3)2.6H2O
Tem
pera
ture
(o C)
Mole Ratio (Metal Salt/Surfactant)
1,0 1,5 2,0 2,5 3,0 3,5 4,0
30
40
50
60
70
80
90
100
Isotropic Cubic
Anisotropic Hexagonal
Isotropic Liquid
Zn(NO3)2.6H2O
Tem
pera
ture
(o C)
Mole Ratio (Metal Salt/ Surfactant)

40
They do not show any phase change. The saturation point is reached at a mole
ratio of 5 for the ZnX2/No mixture. However, it is not stable more than 24 hours and
crystallizes within a day Figure 13.
The CdX2/No mixtures do not show crystallization up to a mole ratio of 7, but it
appears that this concentration does not have a LC phase. At these concentrations, the
samples are isotropic at RT. Therefore the POM is useless for determining whether there
is a mesophase or not. We used powder x-ray diffraction, PXRD, to establish the
mesophase and LC behaviour of the high concentrations. It was determined that the
CdX2/No shows LC phase behavior up to a 6.5 mole ratio (see text for PXRD). This is a
very high salt concentration compared with the metal ion concentration applied in
conventional method [74-77, 83] (the maximum concentration achieved so far is around
0.8 MX2/No mole ratio).
To make our point clear, the LC phase was also constructed in free water (50/50
wt %), then Ni(NO3)2.6H2O or Co(NO3)2.6H2O, or CoCl2.6H2O salt is added to this
mixture. The ITs were recorded in the same way as before. As it is shown in Table 3 and
Figure 14, the Ni(NO3)2.6H2O and Co(NO3)2.6H2O salts have very little effect on the
isotropisation temperature. The LC phase surfactant/water (50 wt %) has an IT around
60oC. There is only 4-5 oC increase in ITs in a broad range of the salt concentrations.
Because there are many free water molecules in the mixtures, the metal complex are
solvated, therefore the surfactant molecules have very little interaction with the metal
aqua complexes and all the salt is in free ions form, see text for FT-IR.
41
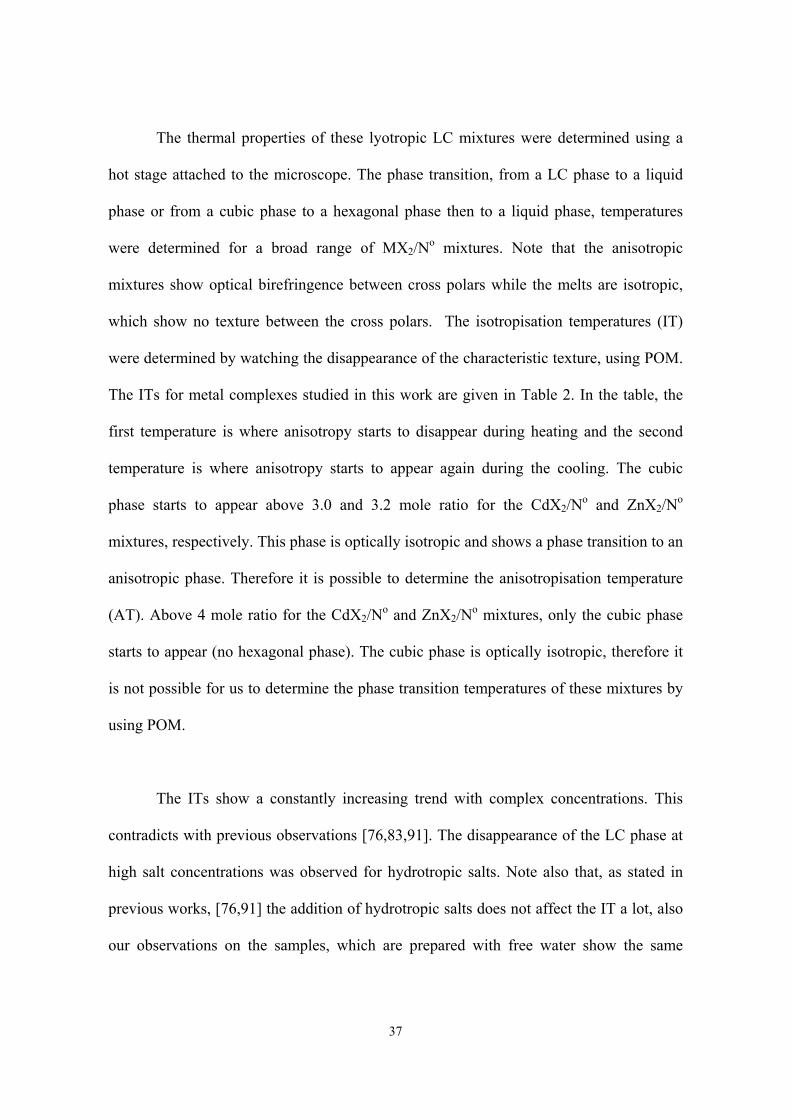
Figure 14. Temperature profiles for MX2/No mixtures with free water. Thesurfactant/water is 50 wt %. M; Ni(H2O)6
2+ , Co(H2O)62+ and X; NO3
-, Cl-.
Notice also that in the case of Cl- salt, the ITs decrease with metal complex
concentration, (Figure 14). Since Cl- is known as a lyotropic anion, which has a “salting–
out” effect, it is expected to dehydrate the EO chain. The sample viscosity also decreases
with salt concentration, especially around 1.0 mole ratio and the samples become more
like a liquid. However, the LC phase, which is directly prepared from metal aqua
complexes, becomes thicker with an increasing salt concentration. There is no harm in
stating that, if one classifies the LC phase prepared by using free water, as liquid-like, the
LC phase prepared directly from metal complex, is crystal-like.
0,0 0,2 0,4 0,6 0,8 1,045
50
55
60
65
70
Anisotropic Hexagonal
Isotropic Liquid
Ni(NO3)2
Co(NO3)2
CoCl2
Tem
pera
ture
(o C)
Mole Ratio (Metal Salt/Surfactant)

42
Table 3. Thermal Properties of for MX2/No mixtures with free water. TheSurfactant/Water is 50 wt %. M; Ni(H2O)6
2+, Co(H2O)62+, and X; NO3
-, Cl–.
Transition Metal Aqua Complexes ITsTemperature (oC)MX2/N0-H2O
(mole) Ni(NO3)2 Co(NO3)2 CoCl20,0 60,50,1 61,35 57,150,2 60,90,3 62,5 53,750,4 62,40,5 60,55 53,20,6 63,50,7 63,25 50,950,8 63,750,9 62,7 50,41,0 64,35 62,9 50,05
The lyotropic LC phase occurs, because the oil-like tail group of the surfactant
tends to reduce the interaction with the water molecules to a minimum and forms micelle
in dilute water solutions. On the other hand, the polar EO groups (-(CH2CH2O)10OH)
tend to stay outside the micelle. If one compares the ITs, it is clear that the hydrogen
bonding interaction between the coordinated water and surfactant is much stronger than
the hydrogen bonding between the free water molecules and the surfactant.

43
3.1.3.PXRD Analysis
The powder X-ray diffraction (PXRD) is a powerful technique in establishing
the meso-phase and the structure type. It provides information about the crystallinity
and degree of order in the samples. In the crystalline samples, X-rays are reflected
from the parallel lattice planes spaced d apart (d-spacing). Constructive interferences
of the reflected beams give us a diffraction line according to Bragg’s law, given
below
nλ = 2d Sin θ
Figure15. Schematic representation of X-ray diffraction from atomic planes [109b].
In general, the crystalline samples have order in atomic scales, therefore any
reflection will be due to the spacing of parallel atomic planes (Figure 15). In
mesoscopic materials, micellar aggregates (rods) form ordered meso-structures
(hexagonal, cubic, lamella), and has dimensions in the nano-meter range. Therefore,
X-rays will be diffracted from these ordered molecular aggregates, which diffracts at

44
small angles, mostly within the 1-10 2θ range (Figure 16). The diffraction lines
obtained from these ordered molecular rods give the type of structure of the
mesophase.
Figure 16. First three diffraction lines of hexagonal structure [109a].
PXRD pattern of the mixtures prepared in this study display the first three
lines of a hexagonal structure around 48, 28, and 24 Å d-spacings. However, some of
the samples display up to 5 diffraction lines corresponding to (100), (110), (200),
(210) and (300) associated with P6m 2D-hexagonal symmetry [108]. For 2D-
hexagonally (P6m) ordered structures, the assigned [108-109a] reciprocal spacing, 1/
dhk, ratios of XRD lines, are 1, 31/2, 2, 71/2, 3, 121/2, 131/2, 4 . The diffraction lines
observed in our samples generally coincide well with this assignment. However in
some samples, only (100) and (200) lines were observed. This has been observed in
many meso-structured materials and explained that the (110) is missing due to the

45
orientation of the micellar rods in one direction [110]. Note that, this has been
observed in mesoporous silica materials, [111-112] for instance, rubbing the substrate
in a parallel direction yields silica channels highly oriented in one direction. These
samples, prepared on Si(100) surface, also give a diffraction pattern without (110) and
(210) lines. However, it has been observed that crushing these highly oriented
samples or destroying the orientation results in a strong (100) with relatively weak
(110), (200) and (210) lines [111-112].
Figure 17. X-ray diffractogram of Cd(NO3)2.4H2O/Surfactant, mole ratio is; 2
As shown in Figure 17, only (100) and (200) lines are observed from the
Cd(NO3)2.4H2O/No mixtures. However, from some of the samples, a weak (300) line
is also observed. This is most likely due to the high orientation of meso-channels
parallel to the sample holder. Heating and cooling the samples between IT and RT
yield highly oriented samples, which display a very intense (100) line. However, any
0 2 4 6 8 100
1000
2000
3000
4000
(*10)
200
100
Inte
nsity
2Θ

46
of the CdX2/No samples, oriented or un-oriented, do not display the (110) and (210)
lines. With the help of the POM images, it is possible to determine that these samples
have 2D-hexagonal structures. At higher concentrations of cadmium salt, two signals
corresponding to (100) and (200) diffraction lines are again observed. In order to
assign the structure type, at least three lines are required. With the help of the POM
images observed from these samples, the correct structure type can be assigned. The
samples with high concentrations of cadmium salt (MX2/No> 3.2) display completely
dark image between the cross polars, which means they are isotropic. The
bicontinious cubic phase is also isotropic, however the lamellar and hexagonal phases
are anisotropic. Therefore higher concentrations of Cd salt can be easily assigned to a
cubic phase.
Figure 18. PXRD patterns of Cd(NO3)2.4H2O/Surfactant, with increasing mole ratios.
0 2 4 6 8 10
6.5
6.0
5.04.5
2.82.42.01.6
Nor
mal
ized
Inte
nsity
2Θ

47
Figure 18 shows the normalized diffraction lines of Cd(NO3)2.4H2O/surfactant
with increasing salt concentration. There is a clear shift at the first diffraction line to
lower 2θ values. The d-spacing obtained from (100) line, increases with an increasing
salt concentration.
Figure 19. X-ray diffractogram of Ni(NO3)2.6H2O/Surfactant, mole ratio is; 2.6
The Ni(NO3)2.6H2O/Surfactant mixtures generally show five diffraction lines
around 48, 28, 24, 18, and 16 Å which are assigned to (100), (110), (200), (210) and
(300) respectively, see figure 19. These coincide well with the d-spacing ratios for the
2D-hexagonal structure. Also note that the birefringence that is observed in Ni
samples can be assigned to a hexagonal phase, and it will be used as a reference to
assign structures for the other samples, which show just one or two diffraction lines.
0 2 4 6 8 10-10000
0
10000
20000
30000
40000
50000
60000
70000
80000
300210(*40)
200110
100
Intensity
2Θ

48
In all samples, excluding those with high concentrations of zinc and cadmium
salts, the same optical texture is observed under the POM between the cross polars.
There is no correlation between the d-spacings observed and the metal concentration
in the nickel samples, see Figure 20.
Figure 20. X-ray diffractogram of Ni(NO3)2.6H2O/Surfactant, with increasing moleratios.
0 2 4 6 8 10
3.0
2.6
2.2
1.8
1.4
Rel
ativ
e In
tens
ity
2Θ

49
Figure 21. X-ray diffractogram of (A) Co(NO3)2.6H2O/Surfactant, mole ratio is; 2.6,(B) Co(NO3)2.6H2O/Surfactant, with increasing mole ratios.
The Co(NO3)2.6H2O samples, which generally display three diffraction lines,
and are assigned to the (100), (200), and (300) of the 2D-hexagonal structure, are
shown in Figure 21. The samples are highly oriented parallel to the sample holder in
that the (110) and (210) lines are not observed. However, the POM images indicate
that the samples have a hexagonal fan-textures between cross polars. Note also that
the d-spacing does not have any correlation with an increasing salt concentration.
The CoCl2.6H2O/surfactant samples also do not display more than two
diffraction lines. These two lines have been assigned to the (100) and (200) diffraction
line of the 2D-hexagonal phase, according to their d-spacing ratios, Figure 22. At
higher mole ratios, there is only one line in the PXRD patterns. However, by referring
to their POM images, the structure type for high concentration can be assigned to a
hexagonal phase.
2 4
3.0
2.6
2.2
1.8
1.4
Relat
ive In
tensit
y
2Θ2 4 6 8 10
0
5000
10000
15000
20000
25000
30000
35000
*20300200
100Int
ensit
y
2Θ
A B

50
Figure 22. X-ray diffractogram of (A) CoCl2.6H2O/Surfactant, mole ratio is; 2.2, (B)CoCl2.6H2O/Surfactant, with increasing mole ratios.
The CoCl26H2O/surfactant mixtures display diffraction lines similar to those
of Co(NO3)26H2O/surfactant and Ni(NO3)26H2O/surfactant samples. They also do not
show any correlation between the d-spacing and the complex concentration.
As shown in Figure 23, the Zn(NO3)2.6H2O/surfactant samples generally show
five diffraction lines. The POM images and the d-spacing ratios reveal that zinc
samples have a 2D-hexagonal structure up to 3.4 mole ratio of MX2/No. These lines
are assigned to the (100), (110), (200),(210), and (300) of the 2D-hexagonal structure,
Figure 23. As observed in the oriented thin mesoporous silica film samples by Ozin
et.al [110] and later by others [111-112], crushing the oriented film samples bring the
(110) and (210) lines, upon loosing the orientation. Upon breaking the orientation in
our samples, we have observed the (110) and (210) lines of the hexagonal structure.
2 4 6 8 10
2.6
2 .2
1 .8
1 .6
Rel
ativ
e In
tens
ity
2Θ
2 4 6 8 10
0
5000
10000
15000
20000
*10200
100
Inte
nsity
2Θ
B
A

51
The diffraction patterns in Figure 23 A were recorded using a thin film in the oriented
form (prepared by heating to IT and cooling to RT) and using thin film in the
disordered form (prepared by packing the sample from the vial as in the disordered
form). The disordered form can be easily obtained for these samples by mixing the
oriented sample at room temperature. These samples are very soft in that mixing or
stirring with a spatula or pressing with a glass slide can easily break the orientation. In
these un-ordered samples, the diffraction lines originating from (100) and (200) are
not as intense as in the oriented samples, sometimes the (200) lines completely
disappear in the diffraction patterns, see Figure 23. However, this procedure creates a
neat orientation of the samples with respect to X-ray beam and detector in that the
(110) and (210) signals appear in the diffraction pattern. This is a very well
established procedure to determine the structure type of the oriented thin film samples
[110-112].
Figure 23. X-ray diffractogram of (A) Zn(NO3)2.6H2O/Surfactant, mole ratio is; 2.6,(B) Zn(NO3)2.6H2O/Surfactant, with increasing mole ratios.
2 4 6 8 10
0
2000
4000
6000
8000
10000
*10*5
300
200110
100
Inten
sity
2Θ2 4
5.0
4.0
2.62.2
1.4
Relat
ive In
tensit
y
2Θ
A B

52
The Zn samples also show a correlation between the d-spacing and the
concentration of the complex. As shown in Figure 23, the first diffraction line shifts to
lower angles, therefore the d-spacing increases by increasing the zinc salt
concentration, but there is no linear correlation between the concentration and the d-
spacing.
Table 4 shows the first and second diffraction lines of Cd and Zn samples,
which have high metal/surfactant mole ratio (MX2/No > 4.0). Their structures are
assigned as cubic, but with two lines it is not possible to determine the space group of
the cubic phase, therefore the diffraction lines are not assigned to any plane.
Table 4. First and second diffraction lines of high MX2/No mole ratios of Cd and Znsamples
Metal Salts Diffraction Lines
Mole ratios 2theta d-value (Å) 2theta d-value(Å)
Cd/Surf4.5
1.810 49.00 3.570 24.70
Cd/Surf5.0
1.800 49.04 3.630 24.32
Cd/Surf6.0
1.710 51.62 3.430 25.74
Cd/Surf6.5
1.690 52.23 3.350 26.35
Zn/Surf4.0
1.670 52.86 3.320 26.59
Zn/Surf5.0
1.630 54.15 3.280 26.91
The diffraction lines, their 2-theta and d-spacing values, of all the samples
prepared throughout this work are listed in Table 5. The assignments were done

53
according to the d-spacing ratios. Generally, the samples have d-spacing ratios, given
at the beginning of this section, for a 2D-hexagonal structure with a space group of
P6m.
Table 5: Diffraction lines and their assignments for various MX2/No mole ratios. M=Cd(H2O)4
2+, Co(H2O)62+, Zn(H2O)6
2+, Ni(H2O)62+ , X= NO3
-, Cl-.
Metal Salts hkl planesMole ratio 100 110 200 210 300
2theta d-value(Å)
2theta
d-value(Å) 2theta d-value
(Å) 2theta d-value(Å) 2theta d-value
(Å)Cd/surf 1.4 2.010 43.92 3.940 22.41Cd/surf 1.6 1.960 45.04 3.810 23.17Cd/Surf 2.0 1.910 46.21 3.940 22.41Cd/Surf 2.4 2.080 42.44 4.030 21.91Cd/Surf 2.8 1.950 45.27 3.940 22.41 5.860 15.07
Ni/Surf 1.4 1.790 49.31 3.570 24.73Ni/Surf 1.8 1.740 50.73 3.170 27.85 3.550 24.87 4.400 20.07 5.370 16.44Ni/Surf 2.2 1.820 48.50 3.030 29.13 3.560 24.80 4.550 19.40 5.300 16.66Ni/Surf 2.6 1.830 48.23 3.050 28.94 3.610 24.45 4.550 19.40 5.310 16.63Ni/Surf 3.0 1.760 50.15 2.950 29.92 3.420 25.81 4.290 20.58 5.090 17.35
CoNO3/surf 1.4 1.770 49.87 3.550 24.87CoNO3/surf 1.8 1.840 47.97 3.560 24.80CoNO3/surf 2.2 1.780 49.59 3.520 25.08 5.340 16.53CoNO3/surf 2.6 1.740 50.73 3.490 25.29 5.230 16.88CoNO3/surf 3.0 1.850 47.71 3.640 24.25 5.390 16.38
CoCl/surf 1.4 1.840 47.97 3.590 24.59CoCl/surf 1.8 1.760 50.15 3.580 24.66CoCl/Surf 2.2 1.710 51.62 3.450 25.59CoCl/Surf 2.6 1.920 45.97CoCl/Surf 3.0 1.740 50.73
Zn/Surf 14 1.950 45.27 3.790 23.29Zn/Surf 18 1.900 46.46 3.800 23.23 4.720 18.71 5.700 15.49Zn/Surf 2.2 1.810 48.77 3.090 28.57 3.620 24.39 4.630 19.07 5.620 15.71Zn/Surf 2.6 1.810 48.77 3.090 28.57 3.610 24.45 4.700 18.79 5.650 15.63Zn/Surf 3.0 1.830 48.23 3.000 29.42 3.530 25.01 5.330 16.57

54
3.1.4.FT-IR Spectral Studies
FT-IR spectroscopy is extensively used to obtain information about the
structure of non-ionic surfactants in the presence of metal complexes [113]. A free
poly oxyethylene, POE type surfactant, such as the one used throughout this work,
C12H25(CH2CH2O)10OH, shows drastic changes in conformation upon mixing with
water [114]. This is due to the interaction between polar head group of the surfactant
and water molecules. The Raman [115] or FT-IR [113-114,116-117,121-122]
spectroscopic techniques are very useful to elucidate these local structural and
conformational changes. These structural changes may even take place by heating,
therefore all the measurements were carried out at RT throughout this work. Thus any
conformational changes on the POE backbone are due to the hydrophilic interactions
between the surfactant head group and water molecules, which are coordinated to a
transition metal center.
It is the general trend that the FT-IR spectra of transition metal
hydrates/surfactant (represented as MX2/No) mixtures display drastic changes in most
regions of the spectrum. Therefore, it is better to divide the spectrum into several
segments and examine in detail. Some of the regions and their assignments [114] are
listed as: (1) the broad band at around 3200-3700 cm-1 due to ν-(OH) stretching
(symmetric and anti symmetric), (2) the symmetric and antisymmetric stretching of C-
H at around 3000-2850 cm-1, (3) the CH2 scissoring vibrations at 1500-1450 cm-1, (4)
the CH2 wagging vibrations, symmetric with respect to C2 axis of OCH2- CH2O, at
1420-1389 cm-1, (5) the CH2 wagging vibrations, antisymmetric with respect to C2

55
axis of OCH2- CH2O, at 1380-1320 cm-1, (6) the CH2 twisting vibrations, symmetric
with respect to C2 axis of OCH2- CH2O, at 1310-1270 cm-1, (7) the CH2 twisting
vibrations, antisymmetric with respect to C2 axis of OCH2-CH2O, at 1280-12300 cm-1,
(8) the hybridized vibrations of skeletal stretching (C-O and C-C stretching) and the
CH2 rocking at 1160-810 cm1, (9) the skeletal deformation vibrations (CCO and COC
bending and C-O and C-C torsion) below 600 cm-1.
Figure 24. FT-IR spectra of (a) pure (molten) surfactant, (b) surfactant/water (50 wt%), (c) Cd(NO3)2.4H2O/surfactant, mole ratio of 2.
The most informative regions for the conformational changes are the region of
the hybridized vibrations of the –CH2CH2O- (EO) skeleton, the CH2 scissoring,
wagging, and twisting regions. It is also clear to see the effect of the hydrogen
bonding, (Figure 24) in the OH stretching region. The ν-(OH) stretching vibrations for
molten surfactant, surfactant/water (50 wt %) and CdX2/No mixtures are observed at
3480 cm-1, 3425 cm-1 and 3370 cm-1 respectively, (Figure 24). The terminal ν-(OH)
group of the surfactant has stretching vibrations at around 3480 cm-1 [116]. The
addition of water shifts the water bands (free and crystallohydrate) to a lower energy,
3000 3500 4000
3370
3425
3480 cba
Rel
ativ
e In
tens
ity
W avenum ber (cm-1
)
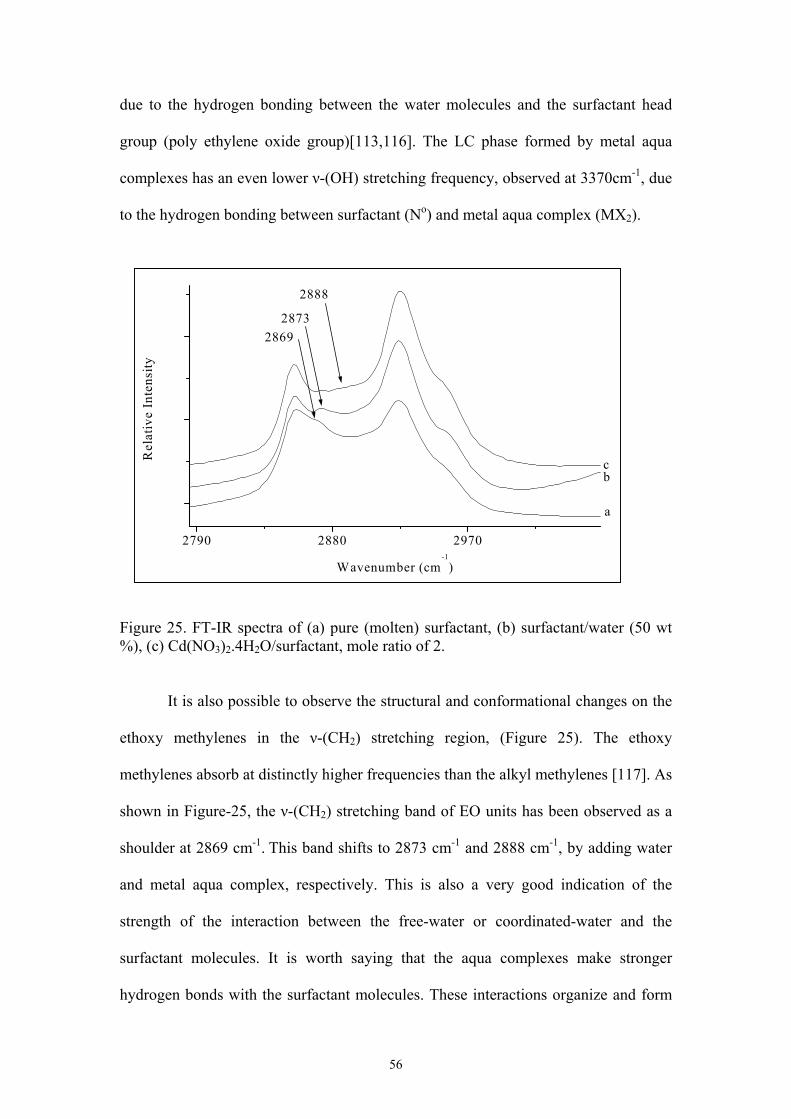
56
due to the hydrogen bonding between the water molecules and the surfactant head
group (poly ethylene oxide group)[113,116]. The LC phase formed by metal aqua
complexes has an even lower ν-(OH) stretching frequency, observed at 3370cm-1, due
to the hydrogen bonding between surfactant (No) and metal aqua complex (MX2).
Figure 25. FT-IR spectra of (a) pure (molten) surfactant, (b) surfactant/water (50 wt%), (c) Cd(NO3)2.4H2O/surfactant, mole ratio of 2.
It is also possible to observe the structural and conformational changes on the
ethoxy methylenes in the ν-(CH2) stretching region, (Figure 25). The ethoxy
methylenes absorb at distinctly higher frequencies than the alkyl methylenes [117]. As
shown in Figure-25, the ν-(CH2) stretching band of EO units has been observed as a
shoulder at 2869 cm-1. This band shifts to 2873 cm-1 and 2888 cm-1, by adding water
and metal aqua complex, respectively. This is also a very good indication of the
strength of the interaction between the free-water or coordinated-water and the
surfactant molecules. It is worth saying that the aqua complexes make stronger
hydrogen bonds with the surfactant molecules. These interactions organize and form
2790 2880 2970
2888
28732869
cb
a
Rel
ativ
e In
tens
ity
Wavenumber (cm-1
)

57
more ordered and stable LC phases. The temperature profiles, as it was shown in the
previous section, also prove this, see Figure 12 and 14. Figure 25 shows that, while
going from the molten surfactant to the MX2/No mixture, the signals become better
resolved and sharper. It also shows that, the intensity of the antisymmetric stretching
of the ν-(CH2) group increases. The broadening of methylene stretching bands can be
explained by the conformational disorder, (will be discussed later).
Figure 26 . FT-IR spectra of (a) pure (molten) surfactant (b) CoCl2.6H2O/ surfactant,mole ratio is 2, (c) Co(NO3)2. 6H2O/ surfactant, mole ratio is 2, (d) Co(NO3)2. 6H2Ocrystal.
The NO3- ion has a very broad signal at around 1400 cm-1 and it covers almost
all of the CH2 scissoring, wagging, and twisting regions. Therefore it prevents us from
obtaining information about conformational changes in this region of the spectrum.
However the NO3- ion signals also provide information about the local interactions
between the metal complex and the nature of the NO3- ions. In order to understand
fully the EO signal, it is crucial to examine the NO3- ion signals first. Figure 26
clearly shows that the NO3- ion in the crystalline metal nitrates has a broad single
1200 1300 1400 1500 1600 1700
dcba
14681385
1303
W avenumber (cm-1
)
Rel
ativ
e In
tens
ity

58
band at around 1385 cm-1 and the free nitrate ion in water solution is observed at
around 1350 cm-1, which is due to the doubly degenerate antisymmetric NO stretching
[118]. When the metal aqua complex is mixed with the surfactant, this broad signal
splits into two sharp signals, which are centered at around 1303 cm-1 and 1468 cm-1.
Such kind of splitting has been observed for bounded NO3- ions [118-119]. This
shows that the nitrate anions are not free but that they interact with metal aqua
complex cation. Most likely, there are two kinds of nitrate ions in LC phase; one is the
dissociated NO3- (free nitrate) and the other is the associated NO3
- (ion-pair). When
NO3- counter anion makes ion-pair it lowers its symmetry from D3h to C2v, therefore
the doubly degenerate single peak splits into two peaks [118] Another possibility of
splitting of NO3- signals can enter to the coordination sphere and coordinate to metal
the center like [M(H2O)4(NO3)2] or [M(H2O)5NO3]+. However, there is no evidence
for the coordination of NO3- ions to the metal center, observed from the Vis-Near-IR
absorbance measurements, (see Vis-Near-IR section).
The spectra of molten surfactant and the CoCl2.6H2O/surfactant mixtures are
also shown in Figure 26. The two spectra, obtained from molten surfactant and
CoCl2.6H2O/surfactant, also confirm that the two intense peaks at 1303 and 1468 cm-1
originate from NO3- ions. Note also that, the FT-IR spectra after addition of the
CoCl2.6H2O complex to the surfactant does not display the big changes in the CH2
scissoring wagging, and twisting vibrational region. As shown in Figure 27, in the
case of the LC phase prepared with free water and aqua complexes, added as a third
component, the two strong NO3- peaks at around 1300-1460 cm-1 are not observed.
There is a single broad peak around 1350 cm-1, which is due to the free NO3- ion. This
shows that the metal aqua complex dissolves in the water region. However there is no

59
free water molecules in the system established in this thesis work, therefore, the NO3-
ions are in closer contact with the metal complex cations.
The C-O stretching around 1100 cm-1 in the ternary system has a very little
shift to lower energy with respect to MX2/No system. This demonstrates that the metal
complex has weaker interaction with the EO group in the ternary system. See also the
thermal properties of the ternary systems in previous section. The metal complex in
ternary system is solvated in the water region, but if the LC phase is prepared directly
from metal complex (binary system) the metal aqua complexes mediates the LC phase
formation.
Figure 27. FT-IR spectra of (a) pure (molten) surfactant (b) Zn(NO3)2.6H2O/surfactant, mole ratio is; 0.5, (c) Ni(NO3)2.6H2O/ surfactant, mole ratio is; 0.5, (d)Co(NO3)2.6H2O/ surfactant, mole ratio is; 0.5, (e) Cd(NO3)2.4H2O/ surfactant, moleratio is; 2. All sample contain 50 wt % water with respect to surfactant.
The other NO3- signals, which are marked, are also shown in Figure 28. The
peak, located around 1044 cm-1 as a shoulder, is due to the symmetric NO stretching
[118]. The band is shifted to a lower frequency in comparison to the Co(NO3)2 aqua
1000 1200 1400 1600 1800
e
d
cba
Rel
ativ
e In
tens
ity
W avenumber (cm-1
)
60
complex. Note also that this band overlaps with some other signals originated from
the surfactant molecules, (Figure 28). The sharp signal, which is located around 810
cm-1, is due to the out of plane bending mode of the nitrate ion [118], which is also
shifted to a lower frequency.
Figure 28 . FT-IR spectra of (a) pure (molten) surfactant (b) CoCl2.6H2O/ surfactant,mole ratio is; 2, (c) Co(NO3)2.6H2O/ surfactant, mole ratio is; 2, (d) Co(NO3)2.6H2Ocrystal.
Around 750 cm-1, the nitrate ion has another signal, due to an ONO bending
mode [118]. It is difficult to assess whether this band shifts to a higher or a lower
energy due to the broad feature of Co(NO3)2.6H2O aqua complex at around 800 cm-1.
The shifts observed in these spectra, are also good indications for the interactions of
the nitrate anions with the metal aqua complex cations and also likely an indicator of
the interactions with the surfactant molecules. A list of vibrational frequencies and
assignments of metal aqua complex salts with the NO3- counter anion are given in
Table 6.
400 500 600 700 800 900 1000 1100 1200
750810
1044
d
c
ba
Rel
ativ
e In
tens
ity
W avenumber (cm-1
)
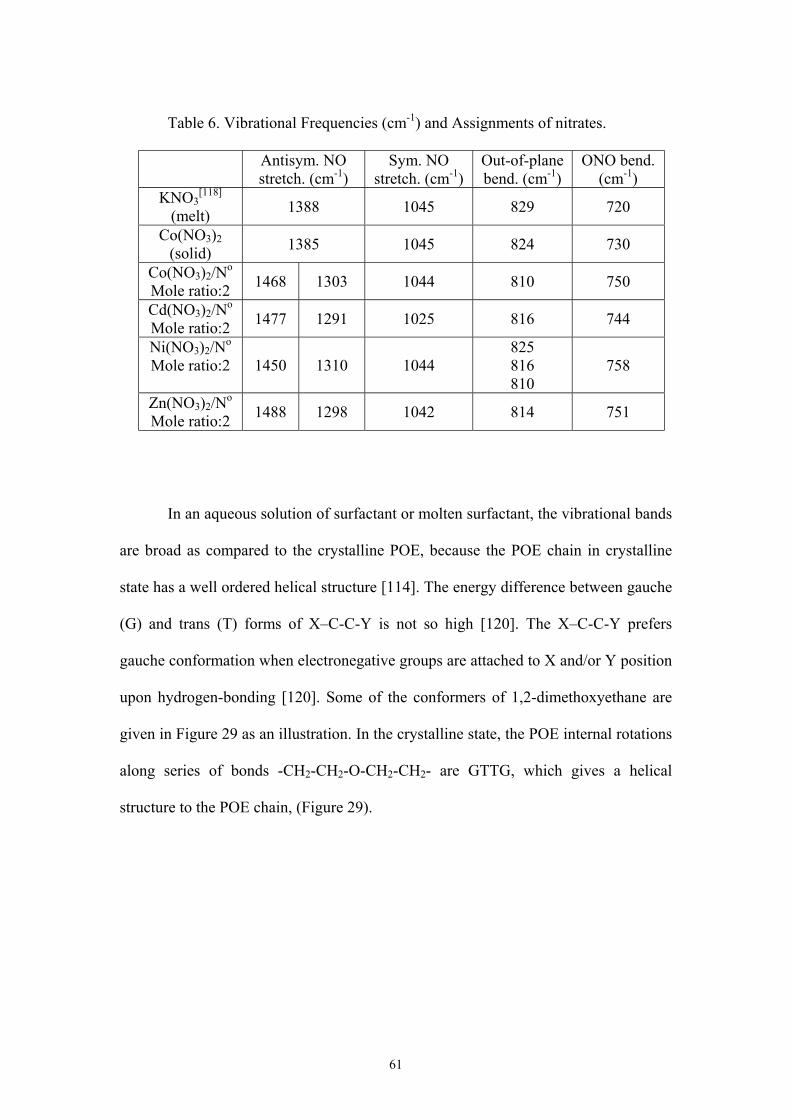
61
Table 6. Vibrational Frequencies (cm-1) and Assignments of nitrates.
Antisym. NOstretch. (cm-1)
Sym. NOstretch. (cm-1)
Out-of-planebend. (cm-1)
ONO bend.(cm-1)
KNO3[118]
(melt) 1388 1045 829 720
Co(NO3)2(solid) 1385 1045 824 730
Co(NO3)2/No
Mole ratio:2 1468 1303 1044 810 750
Cd(NO3)2/No
Mole ratio:2 1477 1291 1025 816 744
Ni(NO3)2/No
Mole ratio:2 1450 1310 1044825816810
758
Zn(NO3)2/No
Mole ratio:2 1488 1298 1042 814 751
In an aqueous solution of surfactant or molten surfactant, the vibrational bands
are broad as compared to the crystalline POE, because the POE chain in crystalline
state has a well ordered helical structure [114]. The energy difference between gauche
(G) and trans (T) forms of X–C-C-Y is not so high [120]. The X–C-C-Y prefers
gauche conformation when electronegative groups are attached to X and/or Y position
upon hydrogen-bonding [120]. Some of the conformers of 1,2-dimethoxyethane are
given in Figure 29 as an illustration. In the crystalline state, the POE internal rotations
along series of bonds -CH2-CH2-O-CH2-CH2- are GTTG, which gives a helical
structure to the POE chain, (Figure 29).

62
Trans Gauche
CH2 CH2
O CH2
CH2
O
O
G
G
TTCH3
CH3
O
CH2 CH2
O
CH3CH3 OO
CH2 CH2
GTTG
Figure 29. Trans and gauche conformers of 1,2-dimethoxyethane and GTTGconformer of -OCH2CH2OCH2CH2O- group.
The addition of a metal aqua complex to the POE type non-ionic surfactant
induces conformational changes in the EO backbone. Figure 30 shows the CH2
scissoring, wagging, and twisting regions. However, this region does not respond a lot
to the conformational changes. The ν-(CH2) scissoring band, which is around 1465
cm-1, does not show any change with the addition of water or metal aqua complex.
The band at around 1350 cm-1 has been assigned [114] to the antisymmetric, CH2
wagging vibration of -CH2-CH2-. The CH2 wagging vibration appears at around 1380-
1350 cm-1, if the C-C bond with gauche (G) conformer and at around 1355-1320 cm-1,
if it has a trans (T) conformer.

63
Figure 30 . FT-IR spectra of (a) pure (molten) surfactant, (b) surfactant/water (50 wt%), (c) CoCl2.6H2O/ surfactant, mole ratio is; 2
The band located at around 1350 cm-1 is most likely due to the gauche
conformer but this band may also contain a small extent of trans conformer as well,
(Figure 30). The band at 1325 cm-1 was assigned [114] to the trans conformation of
the C-C bond. This band loses its intensity and shifts to a higher energy in the
presence of water. However, upon addition of a metal aqua complex, this band almost
disappears, Figure 30. This is a clear indication of a trans to gauche conformational
change of a C-C bond. The symmetric twisting vibrations of CH2, associated with the
gauche and trans conformer around a C-O bond, are expected at 1310-1290 cm-1 and
1295-1270 cm-1, respectively. Therefore, the band is located at around 1301 cm-1, see
Figure 30, is originated from the gauche conformer. Note also that, the antisymmetric
twisting vibrations of the O-CH2-CH2-O segment at around 1265-1250 cm-1 and
1245-1230 cm-1 are assigned [114] to the TGG and TGT conformers, respectively.
The band, which is observed at around 1251 cm –1, most likely originates from the
1200 1300 1400 1500
12511301
1350
1325
c
b
a
Rel
ativ
e In
tens
ity
W avenum ber (cm-1
)

64
TGG conformer, (Figure 30). These two, symmetric and antisymmetric twisting
vibration modes of the CH2-CH2 units show that, in the MX2/No mixtures, not all of
the EO chain has GTTG conformer for the -CH2-CH2-O-CH2-CH2- units like in
crystalline POE [114]. However some of the C-O bonds have G conformation as well.
Figure 31. FT-IR spectra of (a) pure (molten) surfactant, (b) surfactant/water (50 wt%), (c) Cd(NO3)2.4H2O/surfactant, mole ratio is 2.
The skeletal stretching modes (C-O and C-C stretching) and the CH2 rocking
modes give IR bands in at around, 1160-810 cm-1. The CO stretching vibrations
between 1160-1050 cm-1 do not show any conformational dependence [114].
However, they show dependence on hydrogen-bonding [113]. As shown in Figure 31,
the ν-(CO) stretching band for the molten surfactant is at 1115 cm-1 and shifts to 1100
cm-1 and 1087 cm-1, in the presence of water and metal aqua complex, respectively.
When hydrogen-bonding occurs, the electron density of the C-O bond decreases,
therefore a shift to a lower energy is observed [113]. It is also known that the size of
900 950 1000 1050 1100 1150
953
950
948
1087
1100
1115
cba
Rel
ativ
e In
tens
ity
Wavenumber (cm-1
)

65
the shift shows the strength of the hydrogen-bonding [113]. The LC phase prepared
by metal complexes has a lower C-O stretching vibration frequency than the LC phase
prepared with free water. This indicates that hydrogen bonding in MX2/No mixtures is
stronger, therefore the electron density on a C-O bond is lower. The shift of the band
around 1100 cm-1 due to C-O stretching to a lower frequency proves this. Here, also,
coordinated water molecules can make hydrogen-bonding just with EO chain but free
water molecules makes hydrogen-bonding also with each other and form small
aggregates. Because of the interaction between the free water molecules, they make
less hydrogen-bonding compared to coordinated water molecules. In the previous
section, see Figure 12 and 14, it was indicated that the LC phase prepared with metal
aqua complexes has higher isotropisation temperature. The spectroscopic evidence
observed here also supports our temperature profile results obtained using POM.
There is one peak located at 948 cm-1 for molten surfactant, see Figure 31. The
IR bands in the 950-945 cm-1 region have been assigned to the CH2 rocking vibration
and to the TGT conformation of O-CH2-CH2-O unit of POE [114,116]. Also note that,
the band width of this peak decreases with an increasing its intensity, by adding water
or a metal aqua complex. This shows that the surfactant has a helical structure
although not as perfect as in crystalline POE, that has some T conformation in OCH2-
CH2O unit. However the addition of water or metal aqua complex makes the
surfactant molecules more ordered in the LC phase because they have a sharper and
more intense peaks at around 950 cm-1. This means that the water or metal aqua
complexes decreases the T conformer percentage and increases the G conformer
percentage.

66
Figure 32 . FT-IR spectra of (a) pure (molten) surfactant (b) Cd(NO3)2. 4H2O/surfactant, mole ratio is; 2, (c) CoCl2.6H2O/ surfactant, mole ratio is; 2.
The spectral range, 900-800 cm-1, has been assigned to the CO stretching and
CH2 rocking modes [114,121]. Figure 32 shows that the surfactant has a weak and
broad signals, which cover almost the entire region from 800-900 cm-1. This band
becomes narrower and sharp after the addition of the metal aqua complexes. In this
region, the bands above 825 cm-1 are assigned to the G conformer and the bands at
around 810 cm-1 are assigned to the T conformer of the OCH2-CH2O unit [114,121-
122]. However, there is a sharp and relatively intense signal of the NO3- counter anion
at around 810 cm-1, in the case of the Cd (NO3)2 salt, therefore it is difficult to obtain
information about the conformation of the EO units in this region.
Note that, in the case of CoCl26H2O/Surfactant, there is a peak at around 846
cm-1, which indicates the surfactant molecules have a G conformer. Also note that
700 800 900
c
b
a722
839858
846R
elat
ive
Inte
nsity
W avenumber (cm-1
)

67
there is no peak around 810 cm-1 for CoCl2.6H2O/No system. This shows that there is
no appreciable amount of T conformer of the surfactant in the LC phase of these
mixtures. The increase in peak intensity and centring above 825 cm-1 indicates that the
surfactant conformation changes from T to G [114,121-122].
All IR peaks and their assignment of POE in solid and in molten state, are
given in Table 7. Also IR peaks and their assignment of surfactant
(C12H25(CH2CH2O)10OH), used in this work, and the CoCl2.6H2O/Surfactant mixture
are given in Table 7.
Table 7. IR peaks and their assignment of POE in solid and in molten state, surfactant(C12H25(CH2CH2O)10OH), and CoCl2.6H2O/Surfactant mixture.vs; very strong, s;strong, m; medium, w; weak, vw; very veak, sh; shoulder.
IR Wavenumbers (cm-1) and Vibrational Assignmnts between 1500-800 cm-1
POE solid state[114]
POE melt[114]
No (this work) CoCl2.6H2O/No 2 (this work)
Assignments
1470 m1463 m1457 m1453 w
1460 m1484 sh1466 m1457 m
1466 m1457 m
CH2scissoring
1415 w1364 m1345 m
1352 m1326 w
1378 w1350 m1325 w
1378 w1350 m CH2 wagging
1283 m1244 m1236 w
1296 m1249 m 1298 m
1250 m1301 m1251 m CH2 twisting
1149 s1119 s1102 vs1062 m
1140 sh1107 s1038 m992 w
1144 sh1116 vs1040 sh994 w
1135 sh1098 vs
C-O stretch,C-C stretch, CH2 rock
963 s947 m 949 w 946 m CH2 rock
844 s945 m915 m855 m
883 w845 w
881 w846 m
C-O stretchCH2 rock
810 sh 809 vw CH2 rock, CH2 twist
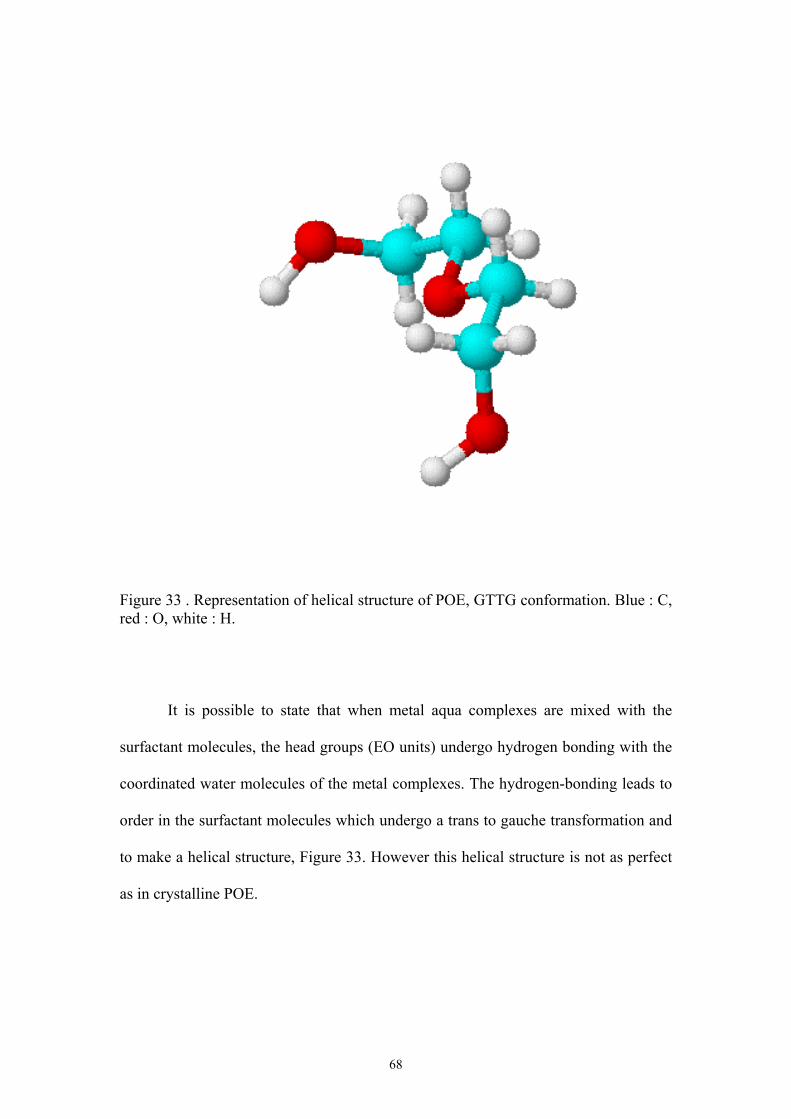
68
Figure 33 . Representation of helical structure of POE, GTTG conformation. Blue : C,red : O, white : H.
It is possible to state that when metal aqua complexes are mixed with the
surfactant molecules, the head groups (EO units) undergo hydrogen bonding with the
coordinated water molecules of the metal complexes. The hydrogen-bonding leads to
order in the surfactant molecules which undergo a trans to gauche transformation and
to make a helical structure, Figure 33. However this helical structure is not as perfect
as in crystalline POE.
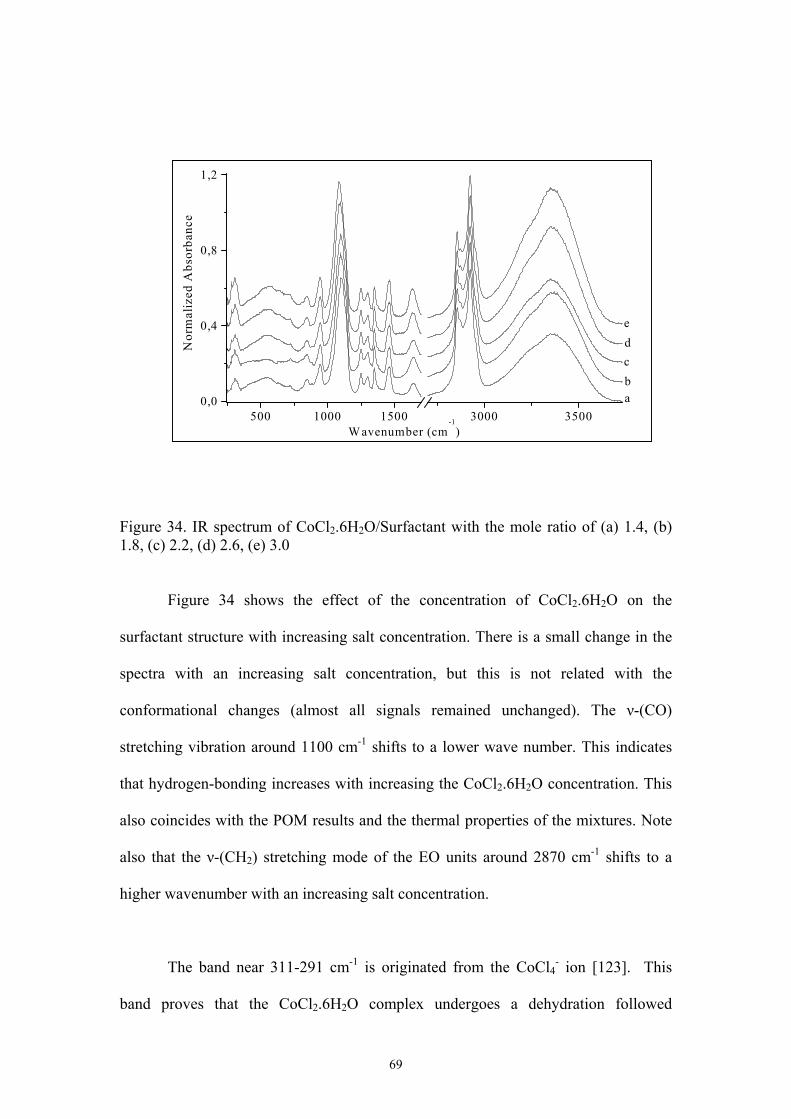
69
Figure 34. IR spectrum of CoCl2.6H2O/Surfactant with the mole ratio of (a) 1.4, (b)1.8, (c) 2.2, (d) 2.6, (e) 3.0
Figure 34 shows the effect of the concentration of CoCl2.6H2O on the
surfactant structure with increasing salt concentration. There is a small change in the
spectra with an increasing salt concentration, but this is not related with the
conformational changes (almost all signals remained unchanged). The ν-(CO)
stretching vibration around 1100 cm-1 shifts to a lower wave number. This indicates
that hydrogen-bonding increases with increasing the CoCl2.6H2O concentration. This
also coincides with the POM results and the thermal properties of the mixtures. Note
also that the ν-(CH2) stretching mode of the EO units around 2870 cm-1 shifts to a
higher wavenumber with an increasing salt concentration.
The band near 311-291 cm-1 is originated from the CoCl4- ion [123]. This
band proves that the CoCl2.6H2O complex undergoes a dehydration followed
500 1000 1500 3000 35000,0
0,4
0,8
1,2
edcba
Nor
mal
ized
Abs
orba
nce
W avenumber (cm-1
)

70
dimerization reaction and forms CoCl4-, which behaves very differently from the Cl-
ion. Therefore the LC phase can be obtained using CoCl2.6H2O complex.
Figure 35. IR spectrum of Co(NO3)2.6H2O/Surfactant with the mole ratio of (a) 1.2,(b) 1.6, (c) 2.0 (d) 2.4, (e) 2.8, (f) 3.2
Figure 35 shows the spectra of the Co(NO3)2.6H2O/surfactant mixtures. The
broad feature of the NO3- counter anion around 1350 cm-1 predominates in the spectra,
where the peaks become broader with increasing metal aqua complex concentration.
This is likely due to increasing the number of free nitrate ion in comparison to
associated nitrate ion. The ν-(CO) stretching mode at around 1100 cm-1, shifts to a
lower energy with increasing salt concentrations. The ν-(CH2) stretching mode of EO
units, at around 2870 cm-1, shifts to a higher energy at higher metal complex
concentrations. Also note that the splited antisymmetric stretching of the NO3- band,
which is located around 1300 and 1460 cm-1, shows a small change at higher
concentrations. These two bands get closer at higher concentrations. The amount of
splitting decreases with increasing metal aqua complex concentrations. This is most
likely due to an increase of the free NO3- counter anion at higher concentrations.
800 1000 1200 1400 1600 3000 3500
0,0
0,7
1,4
fe
dcba
Nor
mal
ized
Abs
orba
nce
W avenum ber (cm-1
)

71
Figure 36 . IR spectrum of Zn(NO3)2.6H2O/Surfactant with the mole ratio of (a) 1.2,(b) 1.6, (c) 2.0 (d) 2.4, (e) 2.8, (f) 3.2
The Zn(NO3)2.6H2O/surfactant mixtures as shown in Figure 36, have almost
the same changes as in the case of Co(NO3)2.6H2O/surfactant system with an
increasing salt concentration.
Figure 37. IR spectrum of Ni(NO3)2.6H2O/Surfactant with the mole ratio of (a) 1.2,
(b) 1.6, (c) 2.0, (d) 2.6, (e) 3.0
1 0 0 0 1 5 0 0 3 0 0 0 3 5 0 0
0 ,0
0 ,7
1 ,4
fedcba
Nor
mal
ized
Abs
orba
nce
W av en u m b er (cm-1
)
8 0 0 1 0 0 0 1 2 0 0 1 4 0 0 1 6 0 0 3 0 0 0 3 5 0 0
0 ,0
0 ,6
1 ,2
fed
bc
a
Nor
mal
ized
Abs
orba
nce
W a v e n u m b e r (c m-1
)

72
The Ni(NO3)2.6H2O/surfactant mixtures, as shown in Figure 37 have the same
changes as those of the Co and Zn samples. However, in the case of the
Ni(NO3)26H2O/surfactant, the peaks are broader than other metal complexes. This
indicates that the Ni complexes are behaving differently than other metal complexes.
If one carefully inspects the spectra of the samples prepared using nickel complex, the
peak at around 1400 cm-1 due to a free nitrate ion is much more intense than in the
other metal systems. This means that the solubility of the nickel salt is higher and the
nitrate ions stay as in the free ion form.
However in the case of the Cd(NO3)2.4H2O/surfactant, Figure 38, in addition
to the changes that occur in the other metal complexes, the peaks become relatively
sharper, more intense and some signals are better resolved.
Figure 38. IR spectrum of Cd(NO3)2.4H2O/Surfactant with the mole ratio of (a) 1.2,(b) 1.6, (c) 2.0, (d) 2.6, (e)3.0
500 1000 1500 3000 3500
0,0
0,7
1,4
edcba
Nor
mal
ized
Abs
orba
nce
W avenumber (cm-1
)

73
This means that Cd(H2O)42+ ions form well ordered structures with the surfactant
molecules. This is also consistent with the POM and thermal analysis results that the
ITs are relatively higher in the case of the cadmium samples, see Figure 12 and 13.
Figure 39. IR spectrum of MX2/No with the mole ratio of 2, M: (a) Ni, (b) Zn, (c) Co(d) Cd.
Figure 39, shows the comparison of all metal complexes in the 650-1750 cm-1
region. Note also that the doubly degenerate NO3- antisymmetric stretching, which
splits into two peaks around 1300 cm-1 and 1460 cm-1, displays visible changes from
complex to complex. This clearly shows that the major interaction of the nitrate ions
is with the metal complex, as in the form of ion-pairs. However, we also demonstrated
that there is no ligand exchange reaction, taking place between the coordinated water
molecules and nitrate ions. This has been proven using UV-Vis absorption
spectroscopy.
800 1000 1200 1400 1600
d
c
ba
Rel
ativ
e In
tens
ity
W avenumber (cm-1
)

74
3.1.5.Vis-Near-IR Spectral Studies
The electronic absorption spectrum of transition metal aqua complexes gives
valuable information regarding the changes in the coordination number, type of ligand
and the geometry of the complexes. Any of these changes affect the electronic
structure of the complexes and therefore the spectral features.
The Vis-Near-IR spectra were recorded for Ni(H2O)62+ and Co(H2O)6
2+ at
various concentrations in the LC phase and those in the pure water in the 400-1400
nm region, see Figure 40 and 41. These peaks originate from d-d transitions [124],
metal centred, and do not respond to the composition of the mixtures. The spectra for
the LC phases were recorded by sandwiching the samples between two glasses or two
quartz windows. The spectra for the water solutions were recorded in 1 cm quartz
cuvets. The spectral changes clearly indicate that there is no ligand substitution
reaction, which may occur between the surfactant molecules or nitrate ions and the
metal aqua complexes.
Figure 40. Vis-Near-IR spectrum of various Ni(NO3)2.6H2O/surfactant mixtures (a)0.1 M Ni(NO3)2.6H2O solution, (b) 1.4, (c) 2.0, (d), 2.6
400 600 800 1000 1200 1400
0.0
0.4
0.8
1.2
1.6
2.0
2.4
2.8
dcba
Abs
orba
nce
λ nm

75
Figure 41. Vis-Near-IR spectrum of various Co(NO3)2.6H2O/surfactant mixtures (a)0.1 M Co(NO3)2.6H2O solution, (b) 1.4, (c) 2.0, (d), 2.6
The only change observed is in the intensity, which increases with increasing
metal aqua complex concentration. Therefore it is obvious that the coordinated water
molecules stay in the coordination sphere and that the geometry of the complexes
does not change in the LC phase.
These results fully support our previous results obtained from the POM
images and the Ft-IR spectra. It was stated in the previous section that the LC phase is
formed by hydrogen-bonding between the coordinated water molecules and the
ethylene oxide (EO) units of the surfactant molecules. There is no complexation
and/or chemical interaction between the EO and the metal centre of the aqua
complexes. It is also true that the NO3- ions are still in the vicinity of the counter ion
sphere of the M(H2O)62+ complex and are interacting electrostatically with the
complex ion. The mixture forms a net, composed of surfactants organized in a
400 600 800 1000 1200 1400
0.0
0.4
0.8
1.2
1.6
2.0
2.4
2.8
dcba
Abs
orba
nce
λ nm

76
hexagonal structure, the metal aqua complexes in the hydrophilic interface, as in the
free ion and ion-pair form with the counter cation, see Figure 10. However it is hard
to determine, the number of interactions that occur between the metal aqua complexes
and the surfactant molecules, and the types of the ion-pairs. It is well know in many
polymer electrolyte mixtures that the cations and anions form different types of
species in the polymer electrolyte systems [72]. These systems attract much attention
from groups working on fast ion conductors. It is very important to determine
behaviour of the ions in these systems. For example, LiCF3SO3 is one of the major
salts used by groups working on the faster ion conductors, and it has been well
established that the Li+ ions are in many different forms, including free ion (Li+ and
CF3SO3-), ion-pairs (LiCF3SO3, molecular) and aggregates (Li(CF3SO3)x
(x-1)-, or
LixCF3SO3(x-1)+ etc.) [72]. In our system, preliminary results show that the nitrate ions
are not coordinated, but form ion-pairs, aggregates with the metal aqua complex
counter ions, and free ions in the LC phase. However, we have also demonstrated that
samples prepared in the presence of free water, samples prepared from the mixture of
water/surfactant (%50 wt/wt) and the metal nitrates, have only free ions, (see Figure
27).

77
CHAPTER 2
3.2.1.Synthesis of Mesoporous Metal Sulfides
The synthesis of II-VI semiconductor nanoparticles and films has been studied
for some time due to its technological and scientific importance. In the literature,
there are many methods, which have been applied to generate small particles
(nanoparticles) of these semiconductor materials [9,15,17,19,21-22,26,74-77,83]. In
the majority of these works, a capping agent was used to prevent the aggregation of
small particles [9,11-12,14-15,17-22]. However, the surfactant based templating
mechanism, which has mostly been applied to metal oxides, has also been used to
make metal sulfides [74-77,83]. In these metal sulphide (MS) works, capping agents
were not used. The LC phase templating approach has also been applied to make
mesoporous Pt mesh, CdS, ZnS nanowires and ZnS nanoparticles [74-77,83,86-88].
In all of these studies, the LC phase was formed using water as a second component
of the lyotropic LC phase and then the metal salt was added to the mixture as a third
component, (ternary system). In such case, there is always one problem, at high salt
concentrations, the LC phase is not stable and it may even collapse into a disordered
non-structured phase. Therefore, these studies were carried with the samples, which
contain very low metal ion concentrations (such as 0.1 M solutions). In the previous
works, the main objective was to use the structure present in the organic mesophase to
directly template the growth of an inorganic phase. However our objective here is to
form an organic mesophase directly with inorganic, which forms an organic-inorganic
hybrid mesophase. Here, we state that the organic-inorganic hybrid mesophase can be

78
used to obtain mesoporous CdS and ZnS. Upon exposing the samples to H2S gas, the
Cd(H2O)42+ and Zn(H2O)6
2+ ions immediately react with H2S gas to produce
mesoporous metal sulfides.
[M(H2O)n](NO3)2 + H2S MS + 2 HNO3 + nH2O (M: Zn and Cd)
These acid byproducts and the free water produced after the reaction may
destroy the liquid crystalline phase. Each of these species affects the liquid crystal
(LC) phase templating mechanism. FT-IR, UV-Vis spectroscopies, PXRD, SEM and
TEM techniques were used for the characterization of the samples.
3.2.2. FT-IR Spectral Analysis
In this part of the study, FT-IR spectroscopy is used in order to determine the
structural changes in the LC phase and, after H2S gas exposure, and also to see
whether the reaction by-products and unreacted species are properly discarded after
washing. The vibrational spectra of CdS samples are given in Figure 42. These
spectra were recorded before and after the H2S exposure and once more after washing,
which has been carried to obtain surfactant free mesoprous CdS or ZnS. The effect of
the formation of CdS on the LC phase is shown in Figure 42 A. The splitted NO3-
signals at around 1300-1460 cm-1 loses its intensity. This indicates that while the Cd
(II) salt reacts with H2S, NO3- counter ion becomes free and solvated due to the free
water produced. Also the other NO3- signals around 810 cm-1 lose their intensity,
which shows that the NO3- loses the ion pair interaction with the metal complex and
becomes a free ion. Note also that the C-O stretching mode peaking at around 1100

79
cm-1 shifts back to the higher frequency after the reaction with H2S gas. In the
previous chapter it was shown that due to strong hydrogen bonding between the metal
aqua complex and EO units, this band shifts to a lower wave number. After the
reaction of these samples with H2S, the peak originates from the CO bond shifts back
to the higher wave number. This means that hydrogen bonding between the EO units
and the metal complex disappears after the CdS formation. This also shows an
important feature of the templating mechanism. While the reaction is proceeding or
after the reaction is complete, the LC phase is mostly destroyed. In addition, a
peaking at around 270 cm-1 gains intensity, which is due to the CdS modes [125].
Figure 42. A; IR spectrum of Cd(NO3)2.4H2O/No (a) After H2S exposure, (b) beforeH2S exposure. B; after washing.
The IR spectrum of the washed CdS sample is also given in part B of Figure
42. It is interesting to note that there are two peaks observed around 614 cm-1 and
1114 cm-1. These are characteristic signals of SO4-2 ion [123]. The Cd (II) complex is
very reactive with H2S so that the temperature of the reaction medium during the H2S
exposure increases. Therefore, the free NO3- ion can easily be reduced to NO2
- and S2-
is oxidized to the SO4-2 ion. This indicated that the reaction temperature should be
kept at lower temperatures. Note also that the bands around 1300-1400 cm-1 indicate
200 400 600 800 1000 1200 1400 1600 1800 2000
270
A
b
a
Rela
tive I
nten
sity
Wavenumber (cm-1)
600 800 1000 1200 1400 1600
0,0
0,2
1385
1114
614
B
Abso
rban
ce
Wavenumber (cm-1)

80
the presence of by products (NO2–) in the samples where we could not get rid off by
washing. After washing, the IR spectra were recorded as a KBr pallet, which cuts
around 300 cm-1, so the Cd-S vibrational region can not be observed, (seen in part B
of Figure 42).
Figure 43. A; IR spectrum of Zn(NO3)2.6H2O/No (a) After H2S exposure, (b) beforeH2S exposure. B; after washing.
The IR spectra of ZnS samples are given in Figure 43. The mesoporous ZnS
also shows similar changes. The IR spectrum of the washed ZnS sample displays
peaks at around 2700-3000 cm-1 region corresponding to the CH2 stretching modes of
the surfactant molecules (Figure 43 A), which means there are still some surfactant
molecules that are not washable. The Zn-S vibrational mode has observed at around
314 cm-1. The peaks at 614 and 1106 cm-1 are originating from the SO4 2- ion (Figure
43 B).
3.2.3. X-Ray Analysis
The PXRD technique was very useful for the determination of the
mesostructures formed in this section. The small angle diffraction lines at in the 1-5
400 600 800 1000 1200 1400 1600 1800
314
A
b
a
Relat
ive I
nten
sity
Wavenumber (cm-1)
300 600 900 1200 1500 3000 3500 4000
0,00
0,05
0,10
1106
614B
Abso
rban
ce
Wavenumber (cm-1)

81
2Θ region show, whether the material has a mesostructure, and the wide angle
diffraction lines (5-60 2Θ) show the crystallinity of the materials. Note also that the
wide angle diffraction lines are very sensitive to the particle size. If the particle size
decreases, the diffraction lines loose their intensity and becomes broader. The PXRD
patterns of the Cd and Zn samples were recorded three times: before H2S gas
exposure (unreacted), after H2S gas exposure (CdS and ZnS in the organic matrix) and
after washing the samples to remove the surfactants (pure ZnS and CdS).
Figure 44. X-ray diffractograms of (a) before H2S gas exposure, (b) after washing(pure CdS), (c) after H2S gas exposure (CdS in organic matrix).Cd(NO3)2.4H2O/surfactant mole ratio is 6.5.
All three diffraction patterns, obtained from unreacted, washed and unwashed
Cd samples, are shown in Figure 44. The first diffraction line is well resolved in the
unreacted sample. However, after the reaction with the H2S gas, the followings are
observed: the line intensity decreases and the first diffraction line shifts to the higher
two theta value.
2 4 6 8 100
1000
2000
3000
4000
5000
6000
cba
*5
Inte
nsity
2Θ

82
These observations can be explained as the loose of the orientational order
upon fast reaction with the H2S gas and the polymerisation and the growth of the MS
walls, respectively. The presence of the diffraction line at around 1.85 two-theta
(corresponds to 44 Å d-spacing) is an indicator for the existence of the mesoporous
structure. However upon washing, the diffraction line shifts to lower angles and
becomes very broad. The diffraction line observed from the washed samples begins at
around 2.0 2θ (4.4 nm) and extends until 1.0 2θ (8.8 nm). Note also that this peak is
not completely detectable due to instrumental limitations (one can run the diffraction
pattern starting from 1.0 up 2 θ). This broad signal is an indication of the existence of
a broad pore size distribution.
Figure 45. X-ray diffraction patterns of (a) before H2S gas exposure, (b) after H2S gasexposure (ZnS in organic matrix), (c) after washing (pure ZnS),Zn(NO3)2.6H2O/surfactantmole ratio is 4.
Figure 45 shows all three samples of Zn(NO3)2.6H2O/Surfactant, unreacted,
unwashed and washed. After H2S exposure and washing the ZnS samples show the
same changes as observed in the cadmium samples. The wide angle patterns give
2 4 6 8 100
1000
2000
3000
4000
5000
6000
7000
8000
cba
Inte
nsity
2Θ

83
information about the crystallinity of the MS (CdS and ZnS in this work) walls, the
crystal structure and the size of the crystals. As shown in Figure 46 after washing, the
samples display three very broad signals at the wide angle region, corresponding to
the metal sulfides. The three broad lines, which have been assigned [126-128] to the
cubic structure (sphalerite or zinc-blend) are observed from the CdS and ZnS samples.
These lines, corresponds to the (111), (220) and, (311) planes of the cubic crystal
structure of bulk CdS and ZnS. These signals clearly show that the mesoporous walls
made up of MS (CdS and ZnS in this work) are nanocrystalline.
Figure 46. Wide angle diffractogram of CdS after washing. Synthesised fromCd(NO3)2.4H2O/surfactant mole ratio is 1.5. The sharp diffractions observed in thesesamples, (see Figure 42 and 43) are due to unreacted Cd(NO3)2.4H2O crystals and byproducts.
The overall picture obtained from the X-ray measurements is: 1) the metal
aqua complexes used in this work, such as Cd(NO3)2.4H2O and Zn(NO3)2.6H2O form
a mesostructure, which templates the formation of mesoporous CdS and ZnS,
respectively. 2) the mesoporous materials obtained in this method are not stable for
1 0 2 0 3 0 4 0 5 0 6 0 7 00
2 0 0
4 0 0
6 0 0
8 0 0
1 0 0 0
1 2 0 0
3 1 12 2 0
1 1 1
Inte
nsir
y
2Θ
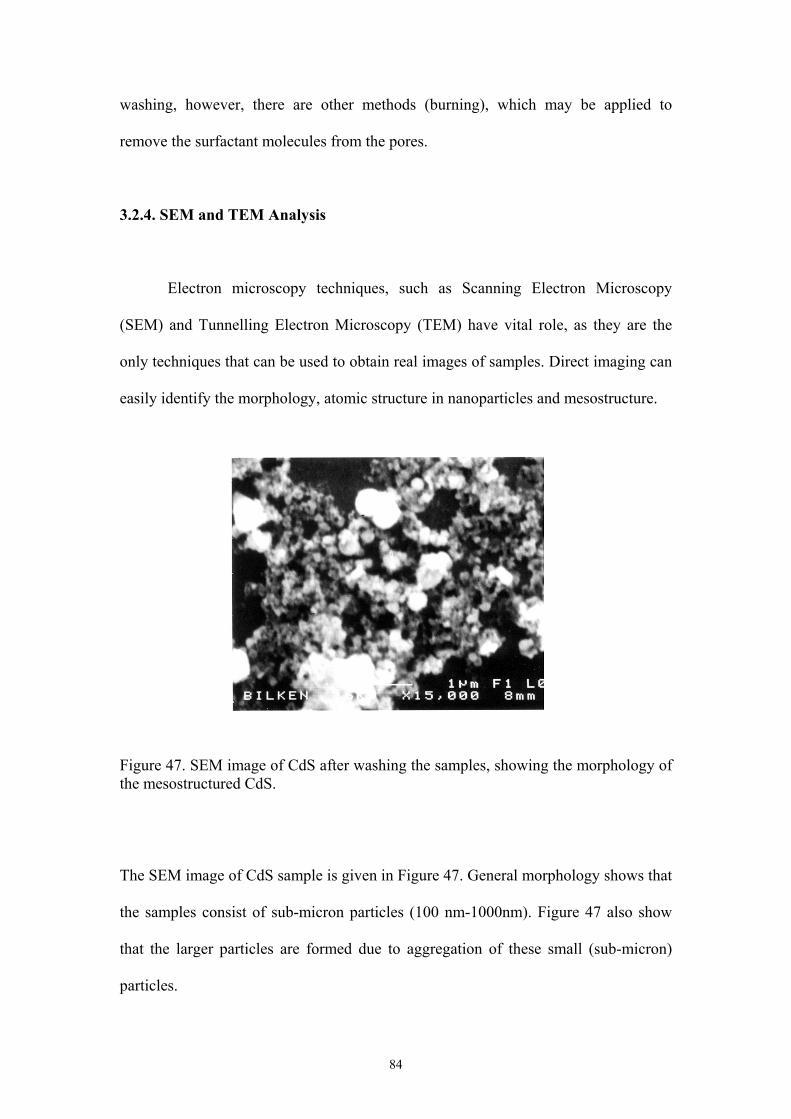
84
washing, however, there are other methods (burning), which may be applied to
remove the surfactant molecules from the pores.
3.2.4. SEM and TEM Analysis
Electron microscopy techniques, such as Scanning Electron Microscopy
(SEM) and Tunnelling Electron Microscopy (TEM) have vital role, as they are the
only techniques that can be used to obtain real images of samples. Direct imaging can
easily identify the morphology, atomic structure in nanoparticles and mesostructure.
Figure 47. SEM image of CdS after washing the samples, showing the morphology ofthe mesostructured CdS.
The SEM image of CdS sample is given in Figure 47. General morphology shows that
the samples consist of sub-micron particles (100 nm-1000nm). Figure 47 also show
that the larger particles are formed due to aggregation of these small (sub-micron)
particles.

85
Figure 48. TEM image of washed CdS sample, showing the mesoporosity in thesample (scale bar is 20 nm).
Figure 48 shows a TEM image of one of the sub-micron particle. The porous
structures are visible in this image. However, the samples are not stable under high-
energy electron beam. It is observed that the samples usually burn during the
measurement of the SEM and TEM images when the machines are focused to a
specific region. The image, shown in Figure 48, was recorded while the sample was
burning therefore the pores have started to open, as shown in region A of the image.
However, region B is almost intact and we can consider this region is a real
representation of the mesostructured CdS. The pore dimension obtained from TEM
images, region B, is around 8-10 nm, which is consistent with the PXRD results of the
washed samples. It has been pointed out, in the previous sections that the reaction
A
B

86
conditions may (high temperature, by products, acidity) affect the templating
mechanism. Therefore it is not surprising to observe poorly organized mesostructure
in these samples. While the porous structure of metal sulfide is forming, the LLC
phase is collapsing. To understand further and elucidate the correct questions related
to the reaction conditions, more detailed study is required. However, our preliminary
results show that the LLC phase obtained using metal aqua complexes template the
formation of mesoporous metal sulphides.
3.2.5.UV-Vis Spectral Analysis
The UV-Vis absorption spectroscopy is also one of the most sensitive
technique to determine changes in the size of the semiconductor and metal
nanoparticles. Here the electron in the conduction band and the hole in the valance
band are confined spatially by potential barrier, the surface of porous material. The
lowest energy optical transition from the valance to conduction band increases due to
confinement effects. Within a simple effective-mass approximation [129], the
confined gap is given as:
Where mc* and mv
* are the conduction and valance-band effective masses,
respectively, and ωx, ωy, and ωz are the dimensions of confined region assumed to be
+
+++=
∗∗vczyx
gapbulkgapconfined mmEE 11111
2 222
22
ωωωπη

87
a box. As the particle size decreases, the band gap of the crystal increases therefore a
blue shift is expected in the absorption spectra. This is due to the confinement of holes
and electrons [130-131] in the valance and conduction bands, respectively. Figure 49
and Figure 50 show the absorption spectra of CdS and ZnS, respectively. Both bulk
CdS and ZnS crystals have direct band gaps in which the valance band maximum and
conduction band minimum have the same momentum, ∆k = 0.0. Therefore the
absorption band edges were fit to the expression for a direct allowed (da) interband
electronic transition, [7,79]
αda = Cda(hv-Eg)1/2
where αda is the absorption coefficient (in this study, the absorbance value is used as
αda), Cda is coefficient with little energy dependence, hν is photon energy, and Eg is
optical band gap [79]. The optical band gap was determined by plotting αda2 as a
function of energy, hν, and then measuring the intersection of a line passing through
the absorption edge (linear fit). The intersection with the energy axis gives the optical
band gap, Eg [79].

88
Figure 49. Absorption spectrum of CdS. Synthesised from Cd(NO3)2.4H2O/surfactantmole ratio is 1.8.
Figure 50. Absorption spectrum of ZnS. Synthesised from Zn(NO3)2.6H2O/surfactantmole ratio is 2.4.
3.2 3.4 3.6 3.8 4.0 4.2 4.4 4.6 4.80.0
0.2
0.4
0.6
0.8
1.0
Bulk ZnS
3.89
(αda
) 2
Energy hν (eV)
2.2 2.4 2.6 2.8 3.0 3.20.0
0.2
0.4 Bulk CdS
2.60
( αda
)2
Energy hν (eV)

89
There is a clear blue shift observed from both samples compared to the bulk
Eg values, see Figure 49 and 50. The increase in the band gap indicates that the
structure is made up of small particles. The bulk CdS and ZnS has band gap energy
around 2.42 and 3.60 eV at 300K, respectively [7]. There is a 0.3 and 0.2 eV increase
in band gap energy for the mesoporous ZnS and CdS, respectively. This shift may be
due to the confinement of electrons and holes in pore walls.
The mesoporous CdS and ZnS samples were also prepared by using different
MX2/No mole ratios. The optical band gaps and the chemical composition of the
samples are given in Table 8.
Table 8. Optical band gaps of mesoporous CdS and ZnS synthesized with differentMX2/No mole ratios and the bulk values.
Cd(NO3)2/Surfactantmole ratio
Optical BandGap(eV)
Zn(NO3)2/Surfactantmole ratio
Optical BandGap(eV)
Bulk CdS 2.42 Bulk ZnS 3.601.4 2.52 1.4 3.811.8 2.60 1.6 3.882.2 2.58 2.0 3.892.6 2.47 2.4 3.893.0 2.48 2.8 3.873.6 2.45
The absorption spectra of various mesoporous CdS and ZnS samples are
shown in Figure 51. The change in the absorption band edge provides information
about the templating mechanism. As shown in Figure 51 and Table 8, the absorption
edge of the sample prepared from the low MX2/No mole ratio is red-shifted, closer to
the bulk samples. The liquid crystalline phase of this composition is not as stable as
the other compositions. Note also that the samples prepared with a 1.4 mole ratio and

90
a 1.6 mole ratio have lower melting point or an IT at around 35 to 45oC. Therefore,
the LC phase can be destroyed easily during the reaction between the LC phase
samples and the gas phase H2S. Note also that the temperature increases during the
MS formation reactions. Therefore both samples, mesoporous CdS and ZnS, prepared
using low MX2/No mole ratios, are not well templated. The solvated crystals coagulate
during the reaction and large particles are produced compared to the higher molar
ratios.
Figure 51. Absorption spectrum of CdS (A) and ZnS (B) synthesized from differentMX2/No mole ratios.
3.2 3.4 3.6 3.8 4.0 4.2 4.4 4.6
e
dc
ba
e ZnS 1.4d ZnS 1.6c ZnS 2.0b ZnS 2.4a ZnS 2.8
Rela
tive
Inte
nsity
Energy hν (eV)
2.2 2.4 2.6 2.8 3.0
de c
ba
e CdS 1.4d CdS 1.8c CdS 2.2b CdS 2.6a CdS 3.0
Rel
ativ
e In
tens
ity
Energy hν (eV)
A
B
91
However, as shown in Figure 51 and Table 8, at higher mole ratios of MX2/No
the absorption band edge red shifts with increasing the mole ratio. The LC phase
becomes very thick and dense at higher MX2/No mole ratios. Therefore, this time
there is a diffusion problem for the H2S gas to react with the metal ion [77]. The low
diffusion rate limits the reaction that occurs only on the surface. Stupp and co-workers
also stated that the low H2S diffusion rate causes coagulation of the CdS and ZnS
crystals [75-77]. However, the mesoporous ZnS is better templated than the
mesoporous CdS, because the LC phase of zinc nitrates are softer and thinner. This
also proves that there is a diffusion problem in the case of the cadmium samples.
The templating step is very important in order to obtain well ordered CdS and
ZnS samples. Temperature, concentration and even type of metal complex change the
quality and the order the LC phase. This part of the work is not yet complete to
determine the exact templating mechanism, more experiments must be done. It has
been shown for the first time in this thesis work that the organic-inorganic hybrid
mesophase can be used to synthesize the mesoporous metal sulfides.

92
4.CONCLUSION
The self-assembling liquid crystalline templating (SLCT) approach enables
material scientists to synthesize mesostructured materials. The mesoporous and
nanostructured materials are technologically and scientifically important due to their
unique size and/or shape dependent properties. Much works have been devoted to the
design of materials, having different properties. Controlling the organisation and
orientation of the molecular precursors, is the key step for designing materials with
desired properties. Supramolecular self-assembly templating has opened new
dimensions in porous and mesoporous materials of different length scales. However
new methods must be developed in order to make the synthesis of other mesoporous
inorganic materials possible.
Here, for the first time, we have investigated the lyotropic liquid crystalline
(LLC) behaviour of oligo(ethylene oxides) non-ionic surfactants (No) with transition
metal aqua complexes (MX2). This binary system has many advantages over the
ternary system in which the LC phase is constructed using surfactant, water and metal
salts, where metal salt is added as the third component. The MX2/No mixtures, which
show LC behaviour in a broad temperature range, were prepared using various metal
aqua complexes and mole ratios (M= Ni(H2O)6 2+, Zn(H2O)6 2+, Co(H2O)6 2+, and
Cd(H2O)4 2+, X= NO3–). The Cl- and SO4
2- salts of these metal aqua complexes do not
have an LC behaviour. However, CoCl2.6H2O is an exception.
The thermal properties of the MX2/No mixtures indicate that the new phase is
even more stable than the one prepared in the ternary system (surfactant, free water
and metal salt). It was discovered that the metal aqua complexes interact more

93
strongly through hydrogen bonding, using their coordinated water molecules with the
surfactant molecules (compared to the same interaction of the free water). The PXRD
and POM techniques have proven that the MX2/No mixtures, with different mole
ratios form different types of mesophases. At high mole ratios, the CdX2/No and
ZnX2/No mesophases show a phase transition from an isotropic cubic phase to an
anisotropic hexagonal phase. However, the higher concentrations of Ni and Co salts in
non-ionic surfactant yield crystallization of these salts. Another important observation
throughout this work is regarding the ITs, which increase with increasing salt
concentration up to a saturation point at around 80-100oC. This new binary phase
enabled an increase in the metal ion concentration in the LC phase. For instance, in
the Cd(NO3)2.6H2O/No mixtures, the complex to surfactant mole ratio has been
increased to up to 6.5, keeping the meso phase. This increase can be an advantage in
the sol-gel synthesis of various inorganic materials.
The IR and Vis-Near-IR results show that the coordinated water molecules
can mediate the LC phase formation. The LC phase is a result of complex-induced
aggregation or self-assembly of the surfactant molecules. The interaction between the
aqua complexes and surfactant molecules is of hydrogen-bonding type. There is no
covalent interaction between the metal complex ions and the surfactant molecules.
In the second part of this thesis we have demonstrated that the binary LC
phase can be used effectively, to synthesize mesoporous metal sulfides. By employing
the PXRD and electron microscopy techniques we have proven this. However the
second part of the thesis is continuing and not yet completed. A wide range of
MX2/No mole ratio should be tested in order to observe concentration based changes
in the final product. Intensive work is required on the reaction conditions in order to

94
understand the templating mechanism which is affected by reaction by-products,
temperature and the acidity of the reaction media. Understanding reaction conditions
may lead to better and more stable structures. However, our preliminary results show
that the new LC binary system, discovered in this work, template the MS formation
and yield new mesoporous materials.

95
5.REFERENCES
[1] A.P. Alivisatos,, p.f. Barbara, A.W. Castleman, J. Chang,, D.A. Dixon,M.LL. Klein, G.L.McLendon, J..S. Miller, M.A. Ratner, P.J. Rossky, S.II.Stupp, and M.E. Thompson, “From Molecules to Materials: CurrentTrends and Future Directions,” Advanced Materials, vol. 10, No.16, pp.1297-1336, 1998.
[2] A. Henglein, “Small-Particle Research: Physicochemical Properties ofExtremeely Small Colloidal Metal and Semiconductor Particles,”Chem.Rev., vol. 89, pp. 1861-1873, 1989.
[3] Y. Wang, N. Neron, “Nanometer-Sized Semiconductor Clusters: MaterialsSynthesis, Quantum Size Effects, and Photophysical Properties,” J. Phys.Chem., vol. 95, pp. 525-532, 1991.
[4] L.N. Levis, “Chemical Catalysis by Colloids and Clusters,” Chem.Rev.,vol. 93, pp. 2693-2730, 1993.
[5] D.L. Leslie-Pelecky, “Magnetic Properties of Nanostructured Materials,”Chem.Mater., vol. 8, pp. 1770-1783, 1996.
[6] Y. Yu, S. Chang, C. Lee, and C.R.C. Wang, “Gold Nanorods:Electrochemical Synthesis and Optical Properties,” J.Phys.Chem., vol.101, No. 34, pp. 6661-6664, 1997.
[7] Charles Kittel, Introduction to Solid State Physics, John Wiley & Sons:New York, 1996.
[8] D.H. Everett, Basic Principles of Colloid Science, Royal Society ofChemistry Paperbacks: London, 1988.
[9] G.M. Whitesides, J..P. Mathias, C.T. Seto, “Molecular Self-Assembly andNanochemistry: A Chemical Strategy for the Synthesis ofNanostructures,” Science, vol. 254, pp. 1312-1318, 1991.
[10] M. Brust, M. Walker, D. Bethell, D.J. Schiffrin and R. Whyman,“Synthesis of Thiol-derivatised Gold Nanoparticles in a Two-phaseLiquid-Liquid System,” J.Chem.Soc., Chem.Commun., pp. 801-802,1994.
[11] D. Bethell, MM. Brust, D.J. Schiffrin, C. Kiely, “From Monolayers toNanostructured Materials: an Organic Chemist’s View of Self-Assembly,”J. Electroanalytical Chemistry, vol. 409, pp. 137-143, 1996.

96
[12] R.P. Andres, J.D. Bbielefeld, J.I. Henderson, D.B. Janes, V.R. Kolagunta,C.P. Kubiak, W.J. Mahoney, R.G. Osifchin, “Self-Assembly of a Two-Dimensional Superlattice of Molecularly Linked Metal Clusters,”Science, vol. 273, pp. 1690-1693, 1996.
[13] J.H. Fendler, “Self-Assembled Nanostructured Materials,” Chem.Mater.,vol. 8, pp. 1616-1624, 1996.
[14] V. Marciano, A. Minore, V.T. Liveri, “A Simple Method to Prepare SolidNanoparticles of Water-Soluble Salts Using water-in-oilMicroemulsions,” Colloid Polym.Sci., vol. 278, pp. 250-252, 2000.
[15] M.L. Curri, A.Agostiano, L. Manna, M.D. Monica, M. Catalano, L.Chiavarone, V. Spagnolo, M. Lugara, “Synthesis and Characterization ofCdS Nanoclusters in a quaternary Microemulsion: the Role of theCosurfactant,” J.Phys.Chem.B, vol. 104, pp. 8391-8397, 2000.
[16] H. Weller, “Self-Organized Superlattices of Nanoparticles,”Angew.Chem.Int.Ed.Engl, vol. 35, No. 10, pp. 1079-1081, 1996.
[17] D. Wang, Y. Cao, X. Zhang, Z. Liu, X. Qian, X. Ai, F. Liu, D. Wang,, Y.Bai, T. Li, X. Tang, “Size Control of CdS Nanocrystals in BlockCopolymer Micelle,” Chem.Mater., vol. 11, pp. 392-398, 1999.
[18] G.D. Stucky, J.E.M. Dougall, “Quantum Confinement and Host/GuestChemistry: Probing a New Dimension,” Science, vol. 247, pp. 669-680,1990.
[19] T.M. Hayes, L.B. Lurio, J. Pant, P.D. Persans, “Order in CdS Nanoparticlesin Glass,” Solid State Communications, vol. 117, pp. 627-630, 2001.
[20] J.A. Stroscio, D.M. Eigler, “Atomic and Molecular Manipulation with theScanning Tunnelling Microscope,” Science, vol. 254, pp. 1319-1326,1991.
[21] X. Peng, M.C. Schlamp, A.V. Kadavanich, A..P. Alivisatos, “EpitaxialGrowth of Highly Luminescent CdSe/CdS Core/Shell Nanocrystals withPhotostability and Electronic Accessibility,” J.Am.Chem.Soc., vol. 119,pp. 7019-7029, 1997.
[22] C.B. Murray, D.J. Norris, M.G. Bawendi, “Synthesis and Characterizationof Nearly Monodisperse CdE ( E= S, Se, Te) SemiconductorNanocrystallites,” J.Am.Chem.Soc., vol. 115, pp. 8706-8715, 1993

97
[23] C.B. Murray, C.R. Kagan, M.G. Bawendi, “Self-Organization of CdSeNanocrystallites into Three-Dimensional Quantum Dot Superlattices,”Science, vol. 270, pp. 1335-1338, 1995.
[24] T.S. Ahmadi, Z.L. Wang, A. Henglein, M.A.El-Sayed, “ “Cubic” ColloidalPlatinum Nanoparticles,” Chem.Mater., vol. 8, No. 6, pp. 1160-1163,1996.
[25] S.A. Harfenist, Z.L. Wang, M.M. Alvarez, I. Vezmar, R.L.. Whetten,“Highly Oriented Molecular Ag Nanocrystal Arrays,” J.Phys.Chem., vol.100, pp. 13904-13910, 1996.
[26] N. Pinna, K. Weiss, J. Urban, M. Pileni, “Triangular CdS Nanocrystals:Structural and Optical Studies” Advanced Materials, vol. 13, No. 14, pp.261-264, 2001.
[27] S. Empedocles, M. Bawendi, “Spectroscopy of Single CdSeNanocrystallites,” Acc.Chem.Res., vol. 32, pp. 389-396, 1999.
[28] M. Nirmal, L. Brus, “Luminescence Photophysics in Semiconductor Nano-crystals,” Acc.Chem.Res., vol. 32, pp. 407-414, 1999.
[29] E. Porta, L. Prati, M. Rossi, S. Coluccia, G. Martra, “Metal Sols as aUseful Tool for Heterogeneous Gold Catalyst Preparation: Reinvestigationof a Liquid Phase Oxidation,” Catalysis Today, vol. 61, pp. 165-172,2000.
[30] Y. Takasu, T. Akimaru, K. Kasahara, Y. Matsuda, “Effect of Particle Sizeon the Activity of Supported Palladium Catalysts,” J.Am.Chem.Soc., vol.104, pp. 5249-5250, 1982.
[31] B.A. Korgel, H.G. Monbouquette, “Quantum Confinement Effects EnablePhotocatalayzed Nitrate Reduction at Neutral pH Using CdSNanocrystals,” J.Phys.Chem.B, vol. 101, pp. 5010-5017, 1997.
[32] J. Osuna, D. Caro, C. Amiens, B. Chaudret, E. Snoeck, M. Respaud, J.Broto, A. Fert, “Synnthesis, Characterization, and Magnetic Properties ofCobalt Nanoparticles from an Organometallic Precursor,” J.Phys.Chem.,vol. 100, No. 35, pp. 14571-14574, 1996.
[33] M.P. Morales, M.Andres-Verges, S. Veintemillas-Verdaguer, M.I.Montero, C.J. Serna, “Structural Effects on the Magnetic Properties of γ-Fe2O3 Nanoparticles,” Journal of Magnetism and Magnetic Materials, vol.203, pp. 146-148, 1999.

98
[34] J. Legrand, C. Petit, D. Bazin, M.P. Pileni, “Collective Effect on MagneticProperties of Superlattices of Nanosized Cobalt Particles,” AppliedSurface Science, vol. 164, pp. 186-192, 2000.
[35] J. Collings, Liquid Crystals, Princeton University Press, 1990.
[36] P. J. Collings, M. Hired, Introduction to Liquid Crystals, Taylor&Francis,1997.
[37] D. Fennell Evans, Håkan Wennerström, The Colloidal Domain: WherePhysics, Chemistry, and Biology Meet, Willey-VCH, 1999.
[38] D. Myers, Surfaces, Interfaces, and Colloids: Principles and Applications,VCH, 1991.
[39] Kaoru Tsujii, Surface Activity. Principles, Phenomena, and Applications,Academic Press, 1998.
[40] N.K. Raman, M.T. Anderson, “Template-Based Approaches to thePreparation of Amorphous, Nanoporous Silicas”, Chem.Mater., vol. 8,pp. 1682-1701, 1996.
[41] J.Y. Ying, C.P. Mehnet, M.S.Wong, “Synthesis and Applications ofSupramolecular-Templated Mesoporous Materials”,Angw.Chem.Int.Ed.Engl., vol. 38, pp. 56-77, 1999.
[42] Y. Izumi, K. Urabe, M. Onaka Zeolite, Clay, and Heteropoly Acid inOrganic Reactions, Kodansha, 1992.
[43] Mark T. Weller, Inorganic Materials Chemistry, Oxford Press, 1994.
[44] T. Bein, “Synthesis and Applications of Molecular Sieve Layers andMembranes”, Chem.Mater., vol. 8, pp. 1636-1653, 1996.
[45] P. Behrens, G. Stucky, “Ordered Molecular Arrays as Templates; A NewApproach to the Synthesis of Mesoporous Materials”,Angew.Chem.Int.Ed.Engl., Vol. 32, pp. 696-699, 1993.
[46] M. Estermannn, L.B. McCusker, C. Baerlocher, A. Merrouche, H. Kessler,“A Synthetic Gallophosphate Molecular Sieve with a 20-Tetrahedral-Atom Pore Opening”, Nature, vol. 352, pp. 320-323, 1991.
[47] S.I. Zones, M..M. Olmstead, D.S. Santilli, “Guest/Host Rilationships in theSynthesis of Large Pore Zeolite SSZ-26 from a Propellane Quaternary

99
Ammonium Compound”, J.Am.Chem.Soc., vol. 114, pp. 4195-4201,1992.
[48] P. Behrens, “Mesoporous Inorganic Solids”. Advanced Materials, vol. 5,pp. 127-132, 1993.
[49] C.T. Kresge, M.E. Leonowicz, W.J. Roth, J.C. Vartulli, J.S.Beck, “OrderedMesoporous Molecular Sieves Synthesized by a Liquid-Crystal TemplateMechanism”, Nature, vol. 359, pp. 710-712, 1992.
[50] J.S.Beck, J.C. Vartulli, W.J. Roth, M.E. Leonowicz, C.T. Kresge,K.D.Schmitt, D.H. Olson, F.W.Sheppard, S.B. McCullen, J.B. Higgins,J.L.Schlenker, “A New Family of Mesoporous Molecular Sieves Preparedwith Liquid Crystal Templates”, J.Am.Chem.Soc., vol. 114, pp. 10834-10843, 1992.
[51] A. Monnier, F. Schuth, Q. Huo, D. Kumar, D. Margolese, R.S. Maxwell,G.D. Stucky, M. Krishnamurty, P. Petroff, A. Firrouzi, M. Janicke, B.F.Chmelka, “Cooperative Formation of Inorganic-Organic Interfaces in theSynthesis of Silicate Mesostructures”, Science, vol. 261, pp. 1299-1303,1993.
[52] Q. Huo, D. Margolese, U. Siesla, P. Feng, T.E. Gler, P. Sieger, R. Leon, P.Petroff, F. Schuth, G. Stucky, “Generalized Synthesis of PeriodicSurfactant/Inorganic Composite Materials”, Nature, vol. 368, pp. 317-321,1994.
[53] Q. Huo, R. Leon, P. Petroff, G. Stucky, “Mesostructure Design with GeminiSurfactants: Supercage Formation in a Three-Dimensional HexagonalArray”, Science, vol. 268, pp. 1324-1327, 1995.
[54] P.T. Tanev, T.J. Pinnavaia, “A Neutral Templating Route to MesoporousMolecular Sieves”. Science, vol. 267, pp. 865-867, 1995.
[55] S.A. Bagshaw, E. Prouzet, T.J. Pinnavaia, “Templating of MesoporousMolecular Sieves by Nonionic Polyethylene Oxide Surfactants”, Science,vol. 269, pp. 1242-1244, 1995.
[56] G.S. Attard, J.C. Glude, C.G. Goltner, “Liquid-Crystalline Phases asTemplates for the Synthesis of Mesoporous Silica”, Nature, vol. 378, pp.366-368, 1995.
[57] D. Zhao, P. Yang, N. Melosh, J. Feng, B.F. Chmelka, G.D. Stucky,“Continuous Mesoporous Silica Films with Highly Ordered Large PoreStructures”, Advanced Materials, vol. 10, pp. 1380-1384, 1998.

100
[58] D. Zhao, P. Yang, B.F. Chmelka, G.D. Stucky, “Triblock-CopolymerDirected Synthesis of Large-Pore Mesoporous Silica Fibers”,Chem.Mater, vol. 10, pp. 2033-2036, 1998.
[59] D. Zhao, J. Feng, Q. Huo, N. Melosh, , B.F. Chmelka, G.D. Stucky,“Triblock Copolymer Synthesis of Mesoporous Silica with Periodic 50 to300 Angstrom Pores”. Science, vol. 279, pp. 548-552, 1998.
[60] D. Zhao, J. Feng, Q. Huo, B.F. Chmelka, G.D. Stucky, “Nonionic Triblockand Star Diblock Copolymer and Olygomeric Surfactant Synthesis ofHighly Ordered Hydrothermally Stable, Mesoporous Silica Structures”,J.Am.Chem.Soc., vol. 120, pp. 6024-6036, 1998.
[61] P. Yang, D. Zhao, B.F. Chmelka, G.D. Stucky, “Generalized Synthesis ofLarge Pore Mesoporous Metal Oxides with Semicrystalline Frameworks”,Nature, vol. 396, pp. 152-155, 1998.
[62] D. Khushalani, G.A. Ozin, A. Kuperman, “Glycometallate Surfactants Part2: Non-Aqueous Synthesis of Mesoporous Titanium, Zirconium andNiobium Oxides”, J.Materials Chemistry, vol. 9, pp. 1491-1500, 1999.
[63] T.J. Barton, L.M. Bull, W.G. Klemperer, D.A. Loy, M. Misono, P.A.Monson, G. Pez, G.V. Cherer, J.C. Vartuli, O.M. Yaghi, ”Tailored PorousMaterials”, Chem.Mater., vol. 11, pp. 2633-3656, 1999.
[64] J. Wen, G.L. Wilkes, “Organic/Inorganic Hybride Network Materials bythe Sol-Gel Approach“, Chem.Mater., vol. 8, pp. 1667-1681, 1996.
[65] S. Inagaki, S. Guan, Y. Fukushima, T. Ohsuna, O. Terasaki “NovelMesoporous Materials with a Uniform Distribution of Organic Groups andInorganic Oxide in Their Frameworks”, J.Am.Chem.Soc. vol. 121, pp.9611-9614, 1999.
[66] T. Asefa, N. Coombs, G.A. Ozin, “Periodic Mesoporous Organicas withOrganic Groups Inside the Channel Walls”, Nature, vol. 402, pp. 867-871,1999.
[67] G.A. Ozin, E. Comski, D Khushalarni, M.J. MacLachlan, “Mesochemistry”,Current Opinion in colloid & Interface Science, vol. 3, pp. 181-193, 1998.
[68] S. Dai, Y. Shin. Y. Ju, M.C. Burleigh, J.S. Lin, C.E. Barnes, Z. Xue, “ANew Methodology to Functionalize Surfaces of Ordered MesoporousMaterials Based on Ion Exchange Reactions”, Advanced Materials, vol.11, pp. 1226-1230, 1999.

101
[69] Dag, Ö., Ozin G. A., Yang, H., Reber, C., Guillaume, B.,“Photoluminescent Silicon Clusters in Oriented Hexagonal MesoporousSilica Film”, Advanced Materials, vol: 11, pp. 474-480, 1999
[70] H. Parala, H. Winkler, M. Kolbe, A. Wohlfart, R.A. Fischer, R. Schmechel,H. Seqqren, “Confinement of CdSe Nanoparticles Inside MCM-41”,Advanced Materials, vol. 12, pp. 1050-1055, 2000.
[71] H. Winkler, A. Birkner, V. Hagen, I. Wolf, R. Schmechel, H. Seqqren,R.A. Fischer, “Quantum-Confined Gallium Nitride in MCM-41”,Advanced Materials, vol. 11, pp. 1444-1448, 1999.
[72] Ö. Dag, A. Verma, G.A. Ozin, C.T. Kresge, “Salted Mesostructures: Salt-Liquid Crystal Templating of Lithium Triflate-Oligo(ethyleneoxide)surfactant-Mesoporous Silica Nanocomposite Films andMonolithS”, J.Materials Chemistry, vol. 9, pp. 1475-1482, 1999.
[73] W. Cai, L. Zhang, “Synthesis and Structural and Optical Properties ofMesoporous Silica Containing Silver Nanoparticles”,J.Phys.Condens.Matter., vol. 9, pp. 7257-7267, 1997.
[74] P.V.Braun, P.Osenar, S.I.Stupp, “Semiconducting Superlattices Templatedby Molecular Assemblies”, Nature, vol. 380, pp. 325-328, 1996.
[75] S. Eftekharzadeh, S.I. Stupp, “Textured Materials Templated from Self-Assembling Media”, Chem.Mater. vol. 9, pp. 2059-2065, 1997.
[76] V. Tohver, P.V. Braun, M.U. Pralle, S.I.Stupp, “Counterion Effects inLiquid Crystal Templating of Nanostructured CdS”, Chem.Mater. vol. 7,pp. 1495-1498, 1997.
[77] P.V. Braun, P. Osenar, V. Tohver, S.B. Kennedy, S.I. Stupp,“Nanostructure Templatinig in Inorganic Solids with Organic LyotropicLiquid Crystals”, J.Am.Chem.Soc., vol. 121, pp. 7302-7309, 1999.
[78] M.J. MacLachian, S. Petrov, R.L. Bedart, I. Manners, G.A. Ozin,“Synthesis and Crystal Structure of GeS2, the First Germanium Sulfidewith an Expanded Framework Structure”, Angew.Chem.Int.Ed., vol. 37,pp. 2075-2079, 1998.
[79] H. Ahari, Ö. Dag, S. Petrov, G.A. Ozin,”Chalcogenide Distribution inMicroporous Layered Tin(IV) Thioselenide, TMA2Sn3SxSe7-X,Materials”,J.Phys.Chem.B, vol. 102, pp. 2356-2366, 1998.

102
[80] M. Pileni, B.W. Ninham, J. Tanori, I. Lisievcki, A. Filankembo, “DirectRelationship Between Shape and Size of Template and Synthesis ofCopper Metal Particles”, Advanced Materials, vol. 11, pp. 1358-1362,1999.
[81] S.I. Stupp, P.V. Braun, “Molecular Manipulation of Microstructures:Biomaterials, Ceramics, and Semiconductors”, Science, vol. 277, pp.1242-1248, 1997.
[82] B.A. Korgel, H.G. Monbouquette, “Synthesis of Size-Monodisperse CdSNanocrystals Using Phosfatidylcholine Vesicles as True ReactionCompartments”, J.Phys.Chem., vol. 100, pp. 346-351, 1996.
[83] H. Yang, R. Guo, H. Wang, “Lubrication of the Mixed System of TritonX-100/n-C10H21OH/H2O lamellar liquid Crystal and ZnS Nanoparticles”,Colloids and Surfaces A, vol. 180,pp. 243-251, 2001.
[84] G.A. Ozin, S.M. Yang, “The Race for the Photonic Chip: Colloidal CrystalAssembly in Silicon Wafers”, Adv.Func.Mater., vol. 11, pp. 95-104,2001.
[85] P.T. Tanev, T.J. Pinnavaia, “Mesoporous Silica Sieves Prepared by Ionicand Neutral Surfactant Templating: A Comparison of Physical Properties”,Chem.Mater., vol. 8, pp. 2068-2079, 1996.
[86] X. Jiang, “Simultaneous In Situ Formation of ZnS Nanowires in a Liquid Crystal Template by γ-Irradiation,” Chem.Mater., vol. 13, pp. 1213-1218, 2001.
[87] G.S. Attard, C.G. Goltner, J.M. Corker, S. Henke, R.H. Templer, “ Liquid- Crystal Templates for Nanostructured Metals,” Angew.Chem.Int.Ed.Engl.,
vol. 36, pp. 1315-1317, 1997.
[88] G.S. Attard, S.A.A. Leclerc, S. Maniguet, A.E. Russell, I. Nandhakumar, P.N. Bartlett, “Mesoporous Pt/Ru Alloy from the Hexagonal Lyotropic Liquid Crystalline Phase of a Nonionic Surfactant,” Chem.Mater., vol. 13,
pp. 1444-1446, 2001.
[89] W. Zhang, B. Glomski, T.R. Pauly, T.J. Pinnavaia, “A New NonionicSurfactant Pathway to Mesoporous Molecular Sieve Silicas with LongRange Framework Order,” Chem.Comm., pp. 1803-1804, 1999.
[90] G.S. Attard, S. Fuller, G.J.T. Tiddy, “Influence of Added Electrolytes on

103
the Lyotropic Phase Behaviour ofTriethylammoniodecyloxycyanobiphenyl Bromide( OCB-C10NEt3Br),”J.Phys.Chem.B, vol. 104, pp. 10426-10436, 2000.
[91] H. Schott, “Effect of Inorganic Additives on Solutions of Nonionic Surfactants.XIV.Effect of Chaotropic Anions on the Cloud Point of Octoxynol 9 (Triton x-100),” J.Coll.Interf.Sci., vol. 189, pp. 117-122,
1997.
[92] L. Zhang, P. Somasundaran, C. Maltesh, “Electrolyte Effects on the Surface Tension and Micellization of n-Dodecyl β-D-Maltoside Solutions,” Langmuir, vol. 12, pp. 2371-2373, 1996.
[93] L.D. Charlton, A.P. Doherty, “Electrolyte-Induced Structural Evolution of Triton X-100 Micelles,” J.Phys.Chem.B, vol. 104, pp. 8327-8332, 2000.
[94] C. Washington, “Effect of Electrolytes and Temperatureon the Structures of a Poly(ethylene oxide)-Poly(propylene oxide)-Poly(ethylene oxide) Block Copolymer Adsorbed to a Perfluorocarbon Emulsion,” Langmuir,
vol. 13, pp. 4545-4550, 1997.
[95] G. Mao, S. Sukumaran, G. Beaucage, M.L. Saboungi, P.Thiyagarajan, “PEO-PPO-PEO Block Copolymer Micelles in Aqueous Electrolyte Solutions: Effect of Carbonate Anions and Temperature on the Micellar Structure and Interaction,” Macromolecules, vol. 34, pp. 552-558, 2001.
[96] O. Samarskaya, M.Sc. Thesis, Bilkent University, September 2000.
[97] O. Samarskaya, Ö. Dag, “Silver Nitrate/Oligo(Ethylene Oxide)Surfactant/Mesoporous Silica Nanocomposite Films and Monoliths”,J.Coll.Interf.Sci., vol. 238, pp. 203-207,2001.
[98] G.S. Attard, P.N. Bartlett, N.R.B. Colemann, J.M. Elliott,J.R. Owen, “Lyotropic Liquid Crystalline Properties of Nonionic
Surfactant/H2O/Hexachloroplatinic Acid Ternary Mixtures Used for the Production of Nanostructured Platinum,” Langmuir, vol. 14, pp. 7340-
7342, 1998.
[99] M. Kahlweit, E. Lessner, R. Strey, “Phase Behaviour of QuaternarySystems of the Type H2O-Oil-Nonionic Surfactant-Inorganic Electrolyte.2,” J.Phys.Chem., vol. 88, pp. 1937-1944, 1984.
[100] M. Kahlweit, R. Strey, D. Haase, “Phase Behaviour of MulticomponentSystems Water-Oil-Amphiphile-Electrolyte. 3,” J.Phys.Chem., vol. 89, pp.163-171, 1985.
104
[101] Reference 6, in reference [99].
[102] C. Rodriguez, H. Kunieda, “Effect of Electrolytes on Discontinuos Cubic Phases,” Langmuir, vol. 16, pp. 8263-8269, 2000.
[103] T. Iwanaga, M. Suzuki, H. Kunieda, “Effect of Added Salts or Polyols onthe Liquid Crystalline Structures of Polyoxyethylene-Type NonionicSurfactants,” Langmuir, vol. 14, pp. 5775-5781, 1998.
[104] H.J. Schneider, A.K. Yatsimirsky, Principles and Methods inSupramolecular Chemistry, John Wiley & Sons: Chichester, 2000.
[105] J.W. Steed, J.L. Atwood, Supramolecular Chemistry, John Wiley & Sons: Chichester, 2000.
[106] H. Schott, “Effect of Inorganic Additives on Solutions of NonionicSurfactants.XV. Effect of Transition Metal Salts on the Cloud Point ofOctoxynol 9( Triton X-100),” J.Coll.Interf.Sci., vol. 192, pp.458-462,1997.
[107] F.A. Cotton, G. Wilkinson, Advanced Inorganic Chemistry, John Wiley &Sons: Canada, 1988.
[108] Q. Huo, D.I. Margolese, G.D. Stucky, “Surfactant Control of Phases in theSynthesis of Mesoporous Silica-Based Materials”, Chem.Mater., vol. 8,pp. 1147-1160, 1996.
[109] (a) M.A. Reppy, D.H. Gray, B.A. Pindzola, J.L. Simithers, D.L. Gin, “ANew Family of Polymerizable Lyotropic Crystals: Control of Feature Sizein Cross-Linked Inverted Hexagonal Assemblies via Monomer Structure”,J.Am.Chem.Soc., vol. 123, pp. 363-371, 2001. (b) M.F.C. Ladd, R.A.Palmer, Structure Determination by X-Ray Crystallography, PlenumPress, New York, 1985.
[110] H. Yang, N. Coombs, I. Sokolov, G.A. Ozin, “Registered Growth ofMesoporous Silica Films on Graphite”, J.Mater. Chem., vol. 7, pp. 1285-1290, 1997.
[111] H. Miyata, K. Kuroda, “Alignment of Mesoporous Silica on a GlassSubstrate by a Rubbing Method”, Chem.Mater., vol. 11, pp. 1609-1614,1999.

105
[112] H. Miyata, K. Kuroda, “Formation of a Continuous Mesoporous SilicaFilm with Fully Aligned Mseochannels on a Glass Substrate”,Chem.Mater., vol. 12, pp. 49-54, 2000.
[113] V.D. Nito, D. Longo, V. Münchow, “Ion-Oligomer Interactions inPoly(ethylene glycol)400/(LiCl)x Electrolyte Complexes”, J.Phys.chem. B,vol. 103, pp. 2636-2646, 1999.
[114] H. Matsuura, K. Fukuhara, “Vibrational Spectroscopic Studies ofConformation of Poly(oxyethylene). II. Conformation-SpectrumCorrelatios”, J.Polymer Scie.: Part B: Polymer Physics, vol. 24, pp. 1383-1400, 1986.
[115] H. Matsuura, K. Fukuhara, K. Takashima, M. Sakakibara, “ConformationalState of Nonionic Surfactants. A Raman Spectroscopic Study of α-[4(1,1,3,3,-Tetramethylbutyl)phenyl]-ω- hydroxyoligo (oxyethylenes)s”,J.Phys.Chem., vol. 95, pp. 10800-10810, 1991.
[116] N. Kimura, J. Umemura, S. Hayashi, “Polarized FT-IR Spectra of Water inthe Middle Phase of Triton X100-Water System”, J.Coll.Interf.Scie., vol.182, pp. 356-364, 1996.
[117] B. Mädler, H. Binder, G. Klose, “Compound Complex Formation inPhospholipid Induced by a Nonionic Surfactant of the Oligo(ethyleneoxide)-Alkyl Ether Type: A Comparative DSC and FTIR Study”, Journalof Colloid and Interface Science, vol. 202, pp.124-138, 1998.
[118] J. Laane, J.R. Ohlsen, “Characterization of Nitrogen Oxides by VibrationalSpectroscopy”, Prog.Inorg.Chem., vol. 28, pp. 465-513, 1986.
[119] K. Hadjivanov, V. Bushev, M. Kantcheva, D. Klissurski, “InfraredSpectroscopy Study of the Species Arising during NO2 Adsorption onTiO2 (Anatase)”, Langmuir, vol. 10, pp. 464-471, 1994.
[120] M.A. Murcko, R.A. DiPaola, “Ab Inotio Molecular Orbital ConformationalAnalysis of Prototypical Organic Systems. 1. Ethylene Glycol and 1,2-Dimethoxyethane”, J.Am.Chem.soc., vol. 114, pp. 10010-10018, 1992.
[121] R. Frech, W. Huang, “Conformational Changes in Diethylene GlycolDimethyl Ether and Poly(ethylene oxide) Induced by Lithium IonComplexation”, Macromolecules, vol. 28, pp. 1246-1251, 1995.
[122] C.P. Rhodes, R.Frech, “Vibrational Study of the Polymer ElectrolytePoly(ethylene oxide)6:LiAsF6”, Macromolecules, vol. 34, pp. 1365-1368,2001.

106
[123] K. Nakamoto, “Infrared and Raman Spectra of Inorganic and CoordinationCompounds”, John Wiley & Sons, Inc., New York, 1997.
[124] A.B.P. Lever, Inorganic Electronic Spectroscopy, Elsevier SciencePublishers, Amsterdam, 1984.
[125] T. Løver, G.A. Bowmaker, J.M. Seakins, R.P. Cooney, “VibrationalSpectroscopic Study of Thiophenolate-Capped Nanoclusters of CdS and ofCadmium Thiophenolate Complexes”, Chem.Mater., vol. 9, pp. 967-975,1997.
[126] T. Vossmeyer, L. Katsikas, M. Giersig, L.G. Popovic, K. Diesner, A.Chemseddine, A. Eychmüller, H. Weller, “CdS Nanoclusters: Synthesis,Characterization, Size Dependent Oscillator Strength, Temperature Shiftof the Excitonic Transition Energy, and Reversible Absorbance Shift,”J.Phys.Chem., vol. 98, pp. 7665-7673, 1994.
[127] J.C. Sánchez-López, A. Justo, A. Fernández, “Tailored Preparation ofQuantum-Sized ZnS Nanoparticles by the Gas-Phase CondensationMethod”, Langmuir, vol. 15, pp. 7822-7828, 1999.
[128] G.Q. Xu, B. Liu, S.J. Xu, C.H. Chew, S.J. Chua, L.M. Gana, “Luminescence Studies of CdS Spherical Particles via HydrothermalSynthesis”, J.Physics and Chemistry of Solids, vol. 61, pp. 829-836, 2000.
[129] R.T. Collins, P.M. Fauchet, M.A. Tischler, “Porous Silicon: FromLuminescence to LEDs”, Physics Today, vol. 50, pp. 24-31, 1997.
[130] L. Brus, “Electronic Wave Functions in Semiconductor Clusters:Experiment and Theory”, J.Phys.Chem., vol. 90, pp. 2555-2560, 1986.
[131] J.M. Nedeljković, R.C. Patel, P. Kaufman, C. Joyce-Pruden, N. O’Leary,“Synthesis and Optical Properties of Quantum-Size Metal Sulfide Particlesin Aqueous Solution”, J.Chem.Education, vol. 70, pp. 342-345, 1993.