a new international database on the distribution of...
TRANSCRIPT

2012/ED/EFA/MRT/PI/10
Background paper prepared for the Education for All Global Monitoring Report 2012
Youth and skills: Putting education to work
A New International Database on the Distribution of Student Achievement
Nadir Altinok
2012
This paper was commissioned by the Education for All Global Monitoring Report as background information to assist in drafting the 2012 report. It has not been edited by the team. The views and opinions expressed in this paper are those of the author(s) and should not be attributed to the EFA Global Monitoring Report or to UNESCO. The papers can be cited with the following reference: “Paper commissioned for the EFA Global Monitoring Report 2012, Youth and skills: Putting education to work” For further information, please contact [email protected]

1
A New International Database on the Distribution of Student Achievement1
Nadir Altinok2
2University of Lorraine (France) BETA (Bureau d’Economie Théorique et Appliquée)
IREDU (Institute for Research in Education, University of Bourgogne)
Final Draft of the Background Paper to the Education for All Global Monitoring Report 2012
8 November 2011
Abstract. The aim of our study is to analyze conjointly two factors: quality of education and completion of primary education. For doing this, we propose to use international and regional achievement tests in order to obtain comparable benchmarks of pupils’ performance in mathematics, science and reading. By comparing these benchmarks with traditional measures of primary completion rates, we are able to present a global picture of overall performance in primary schools around the world and hence to better evaluate the global trend toward the Education for All Initiative. We obtain comparable data for approximately 70 countries in mathematics and reading, including more than 50 developing countries, and most sub-Saharan African countries. This new methodology permits us to draw a new picture of marginalized population regarding to the quality of education, based on proportions from the international lowest quartile in each subject. Finally, we also propose comparable data for male and female, and for rural and urban locations.
Key words: achievement tests, PASEC, SACMEQ, TIMSS, PIRLS, LLECE, inequality, data.
1 The authors is very greatful to Manos Antoninis (Unesco), Patrick Montjourides (Unesco), the PASEC team and especially Antoine Marivin. This paper represents the views of the author and does not necessarily reflect the opinion of any institution with which the author is affiliated. 2E-mail address: [email protected].

2
1. Introduction
Since the Dakar declaration in 2000, the main focus of Sub-Saharan African countries and
donors has been focused on ensuring that all children complete primary education. Most funds
have been allocated in order to increase the number of teachers, classrooms. In the meantime, it
was decided to diminish or delete the school fees in primary education. As a result, primary
school enrollment increased in most countries. Several benefits are attributed to education from
better access to basic education, including higher personal lifetime earnings, smaller and
healthier families, reduced incidence of HIV/AIDS, and higher economic growth (Van Den
Gaag, Adams, 2010).
However, two key problems remain important. Firstly, all children have not yet completed
primary education around the world. The survival rates to the last grade of primary education
are far from 100% in several countries. For instance, less than half of pupils who enter Grade 1
from Madagascar have an access to Grade 6 of primary education in 2009. The main factors of
this low survival are due to several factors as demand-side reasons, cost of schooling.
Another important problem is related to the low quality of education provided to pupils (Wolff
& Nomura, 2011). Learning outcomes data from several countries show children in school are
failing to acquire the most basic of skills. For instance, 9 of out 10 grade 2 students in Mali
studying in French could not read a single word of connected text. In two regions in Uganda, 70
percent of grade 2 students could not read a single word in English and over 80 percent could
not read in Lango (Gove & Cvelich, 2010). Human capital quality is an important determinant
of economic development (Hanushek & Kimko, 2000 ; Hanushek & Woessmann, 2007).
Moreover, knowledge and skills are the keys to reducing poverty and building wealth (OECD,
2010). Most countries now recognize the importance of increasing learning outcomes.
Moreover, an increasing number of countries take part at several international and regional
student achievement tests.
Data on human capital quality is mainly evaluated by international and regional tests on
mathematics, reading and science subjects. Assessing the secondary education is not relevant for
the EFA initiative. For instance, assessing student learning at age 15 leaves little time to alter the
trajectory of a student’s learning outcomes, as it is done in the Programme on International
Student Assessment (PISA). Besides the participation on international tests, some countries
decided to evaluate specifically students from a region of the world. The only international
achievement test (ISAT) in primary education is organized by the IEA. Its components are the
TIMSS (Third International Mathematics and Science Study)achievement tests in mathematics

3
and sciences, and the PIRLS (Progress in International Reading Literacy Study) in reading
skills. Three main regional achievement tests (RSATs) are currently available: the Southern and
Eastern African Consortium for Measuring Educational Quality (SACMEQ) for Anglophone
sub-Saharan countries, the Programme on the Analysis of Education Systems (PASEC) for
francophone sub-Saharan countries and the Latin American Laboratory for Assessment of the
Quality of Education (LLECE).
The aim of our study is to analyze conjointly these two factors: quality of education and
completion of primary education. For doing this, we propose to use international and regional
achievement tests in order to obtain comparable benchmarks of pupils’ performance in
mathematics, science and reading. By comparing these benchmarks with traditional measures of
primary completion, we are able to present a global picture of overall performance in primary
schools around the world and hence to better evaluate the global trend toward the Education for
All Initiative.
We obtain comparable data for approximately 70 countries in mathematics, science and reading,
including more than 50 developing countries, and most sub-Saharan African countries. By
adjusting each assessment, our paper greatly improve the global picture concerning the quality
of education around the world.For most assessments, our analysis focused directly on micro data
instead of using results from reports. This new methodology permits us to draw a new picture of
quality of education, based on proportions from the international lowest quartile in each subject.
Finally, we also propose comparable data for male and female, and for rural and urban locations.
2. Data
Our study is based on all international and regional achievement tests which evaluate primary
schools. After the presentation of main standard measures relative to the universal primary
education, we detail each assessment which is used in our paper. Unfortunately, we were not
able to access to the micro data of the SACMEQ III study.
2.1. Measures Evaluating The Progress Toward Universal Primary Education
As it is highlighted in the 2011 Education for All Global Monitoring Report, several measures
exist in order to evaluate the progress toward universal primary education. The most common
measure is the primary education adjusted net enrolment ratio. Although this indicator does not
4
give a full picture of the UPE, its availability for most countries and since more than forty years
permits to make analyzes of the progress toward UPE.
Other indicators give a better measure to follow the UPE process. For instance, the expected
cohort intake rate is the proportion of children of school starting age who are expected to start
primary school, regardless of the age at which they start. The main issue with this indicator is
the lack of data for most countries. Another common measure is the survival rate to a specific
grade aims at measuring the retention capacity and internal efficiency of an education system. It
illustrates the situation regarding retention of pupils from grade to grade in schools, and
conversely the magnitude of dropout by grade. In general, the survival to the last grade is used
in analyzes, but intermediate levels of primary education can be used in order to track possible
break out inside the primary level. Another indicator is the expected cohort completion rate
which is the proportion of children of school starting age who are expected to complete primary
school, including those who start late and repeat primary school grades (UIS website; Unesco,
2011). Unfortunately, data for this indicator is available for a very low number of countries.
Lewin (2011) shows that these indicators used for access to education have serious problems.
For instance, Gross and Net Enrolment Rates (GERs and NERs) are widely used to access levels
of enrolment. But their changing values can provide misleading conclusions to policy makers.
Completion and survival rates for schooling provide a good alternative but are silent on issues of
quality and achievement.
Moreover, none of the large multilateral organizations or bilateral donors that have mandates to
work on education programs with developing countries has a consistent approach to support
learning and assessments at the country-level.
The United Nations Educational, Scientific and Cultural Organization (UNESCO) has several
initiatives that attempt to collect learning outcomes data. The UNESCO Institute for Statistics’
(UIS) unique direct measure of learning outcomes is the level of youth (ages 15-24) literacy.
Other proxies are also used – such as grade repetition, school cycle completion, trained teachers
and pupil-teacher ratio – to estimate the quality of education at the national level. The EFA
Development Index (EFA EDI) reported within the Global Monitoring Reports (GMR) relies on
proxies for learning to measure the overall progress toward universaleducation. The EFA EDI
included four EFA Goals: universal primary education, youth and adult literacy, gender parity
and equity, and quality of education which is measured by the survival rate to end of primary.

5
Since comparable data on learning outcomes is not yet available for most countries, UNESCO
determined that survival rate to the end of primary school was the best available proxy of
education quality. UIS is currently designing a new Assessment of Learning Outcomes
Clearinghouse (ALO-c) project. The aim of ALO-c is to collect data on children’s learning
levels by assessing what countries are doing to monitor student achievement and what they are
doing with the results.
World Bank plays a major role in shaping education policy. About half of the education projects
that the World Bank has implemented over the past decade had a learning assessment
component. A recent project named the Alliance for Learning and Education Results (ALERT),
which was developed to support countries in their efforts to measure learning outcomes, was
launched in 2010. However, this project does not really seem active since there is no specific
publication on this project. In partnership with the Russian government, the World Bank
launched in 2008 the Russia Education Aid for Development (READ) trust fund that aims to
help low-income countries improve learning outcomes.
The Education Fast Track Initiative was launched in 2002 as a global partnership to boost
progress toward the universal primary education. While the major aim was improving access to
primary schooling in developing countries around the world, in the last couple of years, the FTI
Secretariat has strived to emphasize the importance of learning. In 2011, FTI partner countries
were encouraged to generate baseline data on learning outcomes that they will be asked to report
against regularly.
The U.S. Agency for International Development (USAID) is the principal federal agency for
providing assistance to countries that are recovering from disaster, combating poverty, and
engaging in democratic reforms. In 2007, a Government Accountability Office report
documented the absence of measuring learning and recommended that USAID develop a plan to
better assess the results of basic education programs. More deeply, USAID has supported the
Early Grade Reading Assessment (EGRA) in at least 19 countries. However, results from
EGRA were not yet used as performance indicators by USAID.
2.2. International and Regional Student Achievement Tests
As there is no clear consensus on the measure of education quality, it is possible to use
separately international and regional student achievement tests (respectively ISATs and RSATs)

6
in order to evaluate the level of schooling quality. Below, we present each assessment used in
the study.
2.2.1. TIMSS
The International Association for the Evaluation of Educational Achievement (IEA) was
the first body to measure individual learning achievement for international comparative
purposes in the early 1960s. The IEA carried out several multi-annual surveys with highly
variable emphases on skills such as mathematics, science and reading, but also pre-primary
education (14 countries, 1988-1995) or computer science in schools (20 countries, 1988-1992).
To begin with surveys designed to assess achievement in mathematics and science, the
first mathematics assessment, known as “The First International Mathematics Study” (FIMS),
took place between 1963 and 1967 and covered 11 developed countries. The second survey of
achievement in mathematics (“The Second International Mathematics Study”) took place
between 1977 and 1981 and assessed pupils aged 13 and those in the final year of secondary
education. However, it was the survey series known as Trends in International Mathematics and
Science Study (TIMSS) which was to prove the most promising for evaluating achievement in
mathematics and science. Four TIMSS surveys have been held to date: the first, in 1994-1995,
covered 45 education systems and three groups of learners3 (in grades 3 and 4, 7 and 8, and the
final year of secondary education respectively); the second survey covered 38 education systems
in 1999, examining grade 8 only; lastly, the third covered 50 education systems, focusing on
grades 4 and 8. The 2007 TIMSS survey has be completed in mid-2009. It covers grades 4 and 8
and more than 66 education systems4. In our study, we will focus on TIMSS 2007 Grade 4
achievement test. 38 countries or areas took part to this test. Among these countries, 12 are
developing countries (Algeria, Armenia, Colombia, El Salvador, Georgia, Iran, Kazakhstan,
Mongolia, Morocco, Russian Federation, Tunisia and Yemen).
2.2.2. PIRLS
3 Some Canadian provinces or states in the United States of America have occasionally taken part in the IEA surveys. For the sake of simplicity, these regions are not included in the number of countries participating in the surveys. 4 Our study does not include results from provinces of Canada, Spain and United States which took part to the TIMSS 2007 test.

7
IEA surveys of achievement in reading were first conducted between 1968 and 1972 when
The Study of Reading Comprehension survey covered 15 education systems, including those in
three developing countries (Chile, India and Islamic Republic of Iran). However, it was the
Progress in International Reading Literacy Study (PIRLS) above all that was to constitute the
main survey series for the assessment of reading in primary education. PIRLS assesses pupils’
achievement in written comprehension. Based on the Reading Literacy Study (RLS) for which
data were collected in 1990-1991, PIRLS has to date been conducted twice (2001 and 2006).
Only grade 4 learners, aged 9 on average, have been assessed. Among the 47 participating
countries or areas, 11 are developing countries (Bulgaria, Georgia, Indonesia, Iran, Macedonia,
Moldova, Morocco, Romania, Russian Federation, South Africa and Trinidad and Tobago).
2.2.3. SACMEQ
The Southern and Eastern Africa Consortium for Monitoring Educational Quality
(SACMEQ) grew out of a very extensive national investigation into the quality of primary
education in Zimbabwe in 1991, supported by the UNESCO International Institute for
Educational Planning (IIEP) (Ross and Postlethwaite, 1991). Keen to follow up this successful
initiative, several education ministers in southern and eastern African countries expressed an
interest in the study and wished to take part in such an assessment. Planners from seven
countries therefore met in Paris in July 2004 and established SACMEQ as a special group. The
15 SACMEQ-member education ministries are those of Botswana, Kenya, Lesotho, Malawi,
Mauritius, Mozambique, Namibia, Seychelles, South Africa, Swaziland, United Republic of
Tanzania, United Republic of Tanzania (Zanzibar), Uganda, Zambia and Zimbabwe.
The first SACMEQ round took place between 1995 and 1999. SACMEQ I thus covered
seven different countries and assessed performance in reading at grade 6. The participating
countries were Kenya, Malawi, Mauritius, Namibia, United Republic of Tanzania (Zanzibar),
Zambia and Zimbabwe. The studies, albeit mainly national in scope, had an international
dimension and shared many common features (research issues, instruments, target populations,
sampling and analytical procedures). A separate report was prepared for each country. In the
second round, which was held between 2000 and 2002 and covered 14 countries and one
territory (Zanzibar), performance in mathematics and reading was assessed. The target cohort
consisted of grade 6 pupils, as under SACMEQ I. The participating countries were Botswana,
Kenya, Lesotho, Malawi, Mauritius, Mozambique, Namibia, Seychelles, South Africa,
8
Swaziland, United Republic of Tanzania, United Republic of Tanzania (Zanzibar), Uganda and
Zambia.
Several SACMEQ II items were replicated from the TIMSS survey to secure comparable
results. The questionnaires were used to collect information on educational inputs, the
educational environment and issues relating to the fair allocation of human and material
resources. Information about the socio-economic context was gleaned from the pupils’
questionnaires. More generally, SACMEQ II included items selected from four previous
surveys, namely the Indicators of the Quality of Education (Zimbabwe) study, SACMEQ I,
TIMSS and the 1985-94 IEA Reading Literacy Study.
The third SACMEQ round (SACMEQ III) is covering the same countries as in 2002 (plus
Zimbabwe) and focuses on achievements levels of grade 6 pupils. Unfortunately, the micro
database for SACMEQ III has not yet been released by the SACMEQ consortium. We will use
the macro results of SACMEQ III in our study, besides the micro data from SACMEQ II.
2.2.4. LLECE
The network of national education systems in Latin American and Caribbean countries,
known as the Latin American Laboratory for Assessment of the Quality of Education (LLECE),
was formed in 1994 and is coordinated by the UNESCO Regional Bureau for Education in Latin
America and the Caribbean.
The main aim of this survey is to garner information on pupil performance and
performance-related factors likely to guide politicians in the making of educational policy. For
this purpose, the LLECE seeks to answer the following questions: What do pupils learn? At
what level is learning achieved? What are the skills developed? When does learning occur?
Under what circumstances does it occur? (Casassus et al., 1998).
Assessments conducted by the LLECE thus focused on learning achievement in reading
and mathematics in grades 3 and 4 in 13 countries of the subcontinent (Casassus et al., 1998,
2002), namely Argentina, Bolivia, Brazil, Chile, Columbia, Costa Rica, Cuba, Dominican
Republic, Honduras, Mexico, Paraguay, Peru and the Bolivarian Republic of Venezuela. Data
for 11 countries were collated in the official report (Casassus et al., 1998). In each country,
samples of about 4,000 pupils in grade 3 (ages 8 and 9) and grade 4 (ages 9 and 10) were
assembled. These surveys covered over 50,000 children, amounting to at least 100 classes per
country.

9
In 2006, the second part of the LLECE survey was initiated in the same countries as
LLECE I. However, it differs from the latter in that it includes science in addition to
mathematics and reading. Moreover, grades tested partly changed compared to the first study:
pupils from grade 3 and grade 6 took part to the SERCE study.Our analysis will focus on
SERCE results, since there are the latest one and the grade tested in the last grade in all
countries5.
2.2.5. PASEC
Surveys under the “Programme d’Analyse des Systèmes Éducatifs” (PASEC, or
“Programme of Analysis of Education Systems”) of the Conference of Ministers of Education of
French-Speaking Countries (CONFEMEN) have been conducted in the French-speaking
countries of sub-Saharan Africa. In 1990, at the 42nd CONFEMEN conference in Bamako,
French-speaking Africa resolutely took up the challenge of education for all announced in
Jomtien that same year. The ministers thus decided to undertake a joint evaluation programme
to promote reflection and action, and PASEC was adopted at the 43rd CONFEMEN conference
in Djibouti in 1991.
This database contains findings for primary school performance in mathematics and in French.
In both CP2 (the second grade in primary school) and CM1 (the fifth), between 2,000 and 2,500
young learners in about 100 schools, along with their teachers and school heads, have been
surveyed in each of the evaluated countries. Some countries have taken part in the PASEC
survey on several occasions. The following is a list of participating countries in chronological
order: Djibouti (1994), Congo (1994), Mali (1995), Central African Republic (1995), Senegal
(1996), Burkina Faso (1996), Cameroon (1996), Côte d’Ivoire (1996), Madagascar (1997),
Guinea (2000), Togo (2001), Mali (2001), Niger (2001), Chad (2004), Mauritania (2004),
Guinea (2004), Benin (2005), Cameroon (2005), Madagascar (2006), Mauritius (2006), Congo
(2007), Senegal (2007), Burkina Faso (2007), Burundi (2009) and Comoros (2010). It should be
noted that the findings of the first four assessments are not available because the surveys were not
conducted under acceptable circumstances.
In order to simplify the analysis, we will consider two different rounds of PASEC: the first round
includes assessments occurred between 1996 and 2003, whereas the PASEC II takes into account 5 Although results for grade 3 are not presented in the paper, they can be obtained from the author by request.

10
evaluations which have been done between 2004 and 2010. The next round of PASEC, namely the
PASEC III study, is currently in preparation by the CONFEMEN. Moreover, as scores are not
directly and fully comparable between each assessment, an anchoring of major items has been
made in order to permit this international comparability6. Our paper will focus on PASEC II
database.
3. Analysis inside each assessment
Unfortunately, given the diversity of existing achievements tests, there is no a single measure of
the minimum skills level over all tests. On the contrary, ISATs and RSATs differ greatly in the
definition of what should know a pupil in the respective skill tested. Therefore, in this section
we propose to present the minimum levels defined in each assessment, while in the next section
an anchoring of all assessment would permit to compare countries between assessments.
3.1. IEA Assessments
TIMSS and PIRLS have a common process of evaluating pupils. Therefore, the definition of
benchmarks is quite similar for these two tests. IEA defines 5 different levels of pupils in order
to know what the scores on the TIMSS mathematics and science achievement scales mean.
TIMSS and PIRLS used scale anchoring to summarize and describe student achievement at four
points on the mathematics, science and reading scales - Advanced International Benchmark
(625), High International Benchmark (550), Intermediate International Benchmark (475), and
Low International Benchmark (400) (Olson, J.F., Martin, M.O., Mullis, I.V.S., 2007). These
benchmarks represent the range of performance shown by students internationally. For instance,
at the fourth grade, students at the Advanced International Benchmark applied mathematical
understanding and knowledge in a variety of relatively complex problem situations and were
able to explain their reasoning whereas those at the Low International Benchmark demonstrated
some basic mathematical knowledge and were able to compute with whole numbers, recognize
some geometric shapes, and read simple graphs and tables (Mullis, I.V.S., Martin, M.O., Foy,
P., 2008, page 66). In PIRLS 2006, a pupil who reaches the Low International Benchmark can
6We are very grateful to the PASEC team, and especially to Jean-Marc Bernard, Antoine Marivin and Vanessa Sy for their help in the providing of the data.

11
recognize an explicitly stated detail and locate a specified part of the story and make an
inference clearly suggested by the text, when texts are based on reading literacy. When they face
to reading information texts, student are able to locate and reproduce explicitly stated
information that is readily accessible and they can begin to provide a straightforward inference
clearly suggested by the text (Mullis, I.V.S., Martin, M.O., Kennedy, A.M., Foy, P., 2007, p.80).
In our study, we will consider that the minimum level of performance of a pupil is to perform at
least 400 points, which is the threshold of the Low international Benchmark. Moreover, the
desired level will be defined as the Intermediate International Benchmark (475), which is
slightly lower than the international mean in these studies (i.e. 500 points).
In Figures 1 and 2, detailed results for developing countries are provided for TIMSS in
mathematics (Figure 1) and PIRLS in reading (Figure 2).We present three types of indicators.
The first represents the main indicator of school efficiency which is appropriate to the grade
tests in the achievement test. In both figures, we include the survival rate to grade 4, since pupils
from this grade are tested in TIMSS 2007 and PIRLS 2006. Moreover, at the second position,
our analysis includes the proportion of pupils reaching the minimum level defined above. Here,
it represents the proportion of pupils who obtained at least the score of 400 in each skill. Lastly,
we combine both indicators in order to obtain the proportion of pupils who survive to grade 4
and who reach the minimum level defined for each test. Figure 1 shows how using this new
indicator would impact on our understanding of education quality. Nevertheless, this indicator
would not account for dropouts who are literate or become literate trough alternative
programmes (Wolff & Nomura, 2011). These results modify our view of how countries are
doing in terms of reaching the goals of quality education for all. For instance, Kuwait has a very
good record in providing schooling to its children, with most of children reaching grade 4.
However, it appears to be doing poorly in terms of learning achievement, since less than 20% of
its 4th graders are able to use mathematics skills at the minimum level. This means that only
19% of its children reach grade 4 and are to use mathematics at the minimum level. Similar
findings can be observed in Colombia, Qatar, Morocco or Tunisia. On the contrary, in countries
as Kazakhstan or Russian Federation, most pupils reach the grade 4 and can use mathematics
skills at the minimum level. Similar results can be obtained for science in TIMSS 2007
(presented in annex). When we turn into PIRLS 2006 results in reading, it appears that Central
and Eastern European countries tend to perform better than other developing countries. Example
of Morocco shows that while this country tend to obtain a good performance on pupils
enrolment in grade 4, the proportion of pupils on this grade reaching the minimum level in

12
reading is quite low (approximately 22%). In final, only 1 out of 5 pupils reach the grade 4 and
obtain the minimum level in reading skill. Similar inefficiency can be observed in Arab States
(Kuwait, Qatar) and South Africa.
Figure 1: Estimated percentage of students who survive to grade 4 and who are able to reach the minimum level in TIMSS 2007 (Mathematics)
Figure 2: Estimated percentage of students who survive to grade 4 and who are able to reach the minimum level in PIRLS 2006 (Reading)
0
10
20
30
40
50
60
70
80
90
100
Algeria Armenia Colombia El Salvador Georgia Iran Kazakhstan Kuwait Lithuania Mongolia Morocco Qatar RussianFed.
Slovakia Tunisia Ukraine Yemen
Survival Rate to Grade 4 Minimum Level Survival and Minimal Level
0
10
20
30
40
50
60
70
80
90
100
Bulgaria Georgia Indonesia IranIslamic
Republic of
Kuwait Lithuania MacedoniaF.Y.R.
MoldovaRepublic of
Morocco Qatar Romania RussianFederation
Slovakia SouthAfrica
Trinidadand
Tobago
Survival Rate to Grade 4 Minimum Level Survival and Minimal Level

13
3.2. SACMEQ Assessment in Anglophone sub-Saharan Countries
In SACMEQ, the reading test items and the mathematics tests items were first arranged in order
of difficulty, and then examined item-by-item in order to describe the specific skills required to
provide correct responses. The skills evaluation for the reading and mathematics tests resulted in
the identification of eight levels of competence for each test. A specific name was attributed to
each level. The first three competency levels in reading and mathematics employed the same
prefixes ("Pre", "Emergent", and "Basic") in order to reflect the mechanical nature of the most
elementary competencies (SACMEQ, 2010). For the fourth level upwards the prefixes of the
summary names were different and were designed to reflect deeper levels of understanding of
subject specific competencies. For instance, a pupil who reaches the level 3 of reading can
interpret meaning (by matching words and phrases, completing a sentence, or matching adjacent
words) in a short and simple text by reading on or reading back. The Basic Numeracy level
reflects the ability of the pupils to translate "verbal information presented in a sentence, simple
graph or table using one arithmetic operation in several repeated steps" and other related skills
(SACMEQ, 2010, page 8).
In our study, we will consider that pupils who reach the level 3 can be considered as having
accessed to the minimum level of competency in each skill. A specific benchmark for the
minimum level of competency in reading is available in SACMEQ. It should be noted that
reading at the "basic" level is not the expected level of achievement at Grade 6 according to
country curriculum guides and standards. Benchmarks of the minimum and desirable levels of
mastery are set by each country in order to group children by different levels of literacy.
Therefore these benchmarks are not similar to each country and can vary deeply inside the
SACMEQ countries. Unfortunately, there is no similar benchmark for mathematics.In our study,
the desired level for each skill will be based on level 4 which is very similar to the desired level
defined in SACMEQ.
Results are presented for SACMEQ II in reading in Figure 3. As most SACMEQparticipating
countries have a length of 6 years for primary education, it is appropriate to use the survival rate
to last grade of primary education as indicator of internal efficiency. Although 14
countries/areas took part to SACMEQ II study, we only report results for 13 countries. Indeed,
there is no data concerning internal efficiency for Zanzibar. Moreover, no specific data is
available in 2000 or nearest years for Kenya too. In countries as Mozambique, Swaziland and
Tanzania, it appears that although few pupils tend to reach the last grade of primary education,

14
most of pupils who are enrolled in this grade tend to obtain at least the minimum level defined
above. For instance, while about 60% of pupils in Swaziland reach the last grade of primary
education,more than 80% of pupils who are already enrolled have a score higher than the
minimum level. Indeed, in these countries, the main issue for reaching the education for all in
primary schools is more quantitative than qualitative. In Namibia, on the contrary, while the
record of providing schooling to its children is quite important (higher than 80%), it appears to
be doing badly in terms of learning achievement, since only 30% of its 6th graders are able to
reach the minimum level in read. On this basis, only one fourth of Namibia's children both
reach grade 6 and are able to read.
Results from SACMEQ III are presented in Figure 4. While Mozambique took part to this test,
there is no available data on survival rate to the last grade in this country. If we compare the
results from SACMEQ II to SACMEQ III, significant changes can be observed. For instance,
while the survival rate to the last grade in Namibia remained approximately unchanged between
2000 and 2007, the proportion of pupils reaching the minimum level doubled. More than 60% of
pupils were able to read in 2007, while it was the case of only 30% in 2000. Hence, in 2007, half
of its children reach Grade 6 and are able to read. In contrast, it was the case of only one third of
children in 2000. In Lesotho, while the survival rate to grade 6 decreased from 54% to 46%, the
proportion of children who are able to read increase from 36% to about 47%. This would mean
that access to the last grade has been made more difficult for pupils but that the learning
achievement level increased for pupils who were enrolled.

15
Figure 3: Estimated percentage of students who survive to last grade and who are able to reach the minimum level in SACMEQ II (Reading)
Figure 4: Estimated percentage of students who survive to last grade and who are able to reach the minimum level in SACMEQ III (Reading)
0
10
20
30
40
50
60
70
80
90
100
Survival Rate to last grade Minimum Level Survival and Minimal Level
0
10
20
30
40
50
60
70
80
90
100
Botswana Kenya Lesotho Malawi Mauritius Mozambique Namibia Seychelles South Africa Swaziland Tanzania Uganda Zambia Zimbabwe
Survival Rate to last grade Minimum Level Survival and Minimal Level

16
3.3. SERCE Assessment in Latin American Countries
The second regional achievementtest in Latin American countries (SERCE) provides a detailed
overview of the different level of performance for each child in grades 3 and 6. Four different
performance levels were defined in grade 6 pupils, and for each skill (mathematics, science and
reading). For instance, pupils reaching the level Iare able of four different skills (UNESCO-
LLECE, 2008, p.33):
• Students arrange natural number (up du 5 digits) and decimals (up du thousands) in
sequence.
• Students recognise common geometrical shapes and the unit consistent with the attribute
being measured.
• Students interpret information presented in graphic images in order to compare it and
change it to a different form of representation.
• Students solve problems involving a single addition using natural numbers.
Unfortunately, there is no specific desired or minimum level in the SERCE study.We
considered that pupils who did not reached the level I performed less than the minimum level. It
consists that pupils who have a performance level lower than 413.58 points in mathematics are
considered as having a level below the minimum level. Our desired threshold is based on the
level II in each skill (514.41 points in mathematics, 513.66 points in reading, and 590.29 points
in science). Figure 5 presents results for the SERCE study in reading and grade 6. Apart the
proportion of pupil reaching the minimum level, there is no recent data for Dominican Republic.
We included data from 2000.
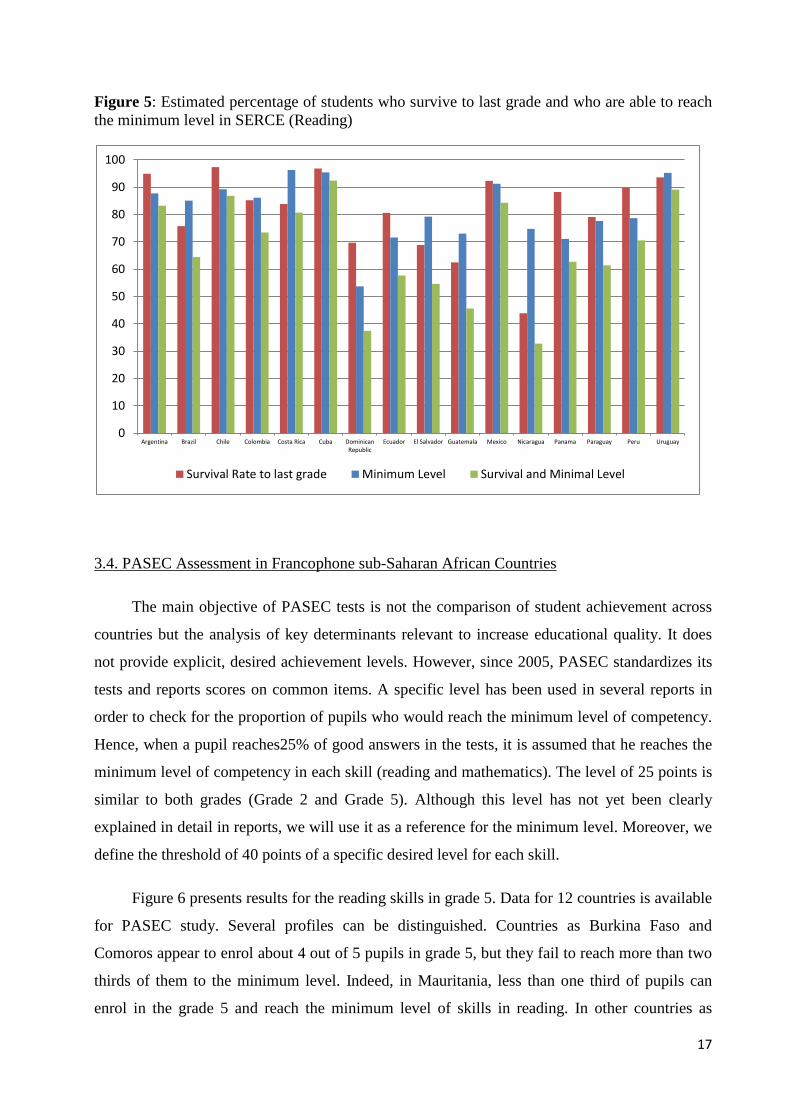
In general, some countries as Argentina, Chile, Cuba, Mexico and Uruguay tend to
perform well in both measures of efficiency. Their survival rate to last grade is higher than 90%
and more than 80% of pupils from these countries reach the minimum level. In Nicaragua
however, although less than half of children reach the last grade, more than 70% of enrolled
pupils reach the minimum level. In this country, there is more an issue of access to the last grade
than an issue of quality of achievement.
17
Figure 5: Estimated percentage of students who survive to last grade and who are able to reach the minimum level in SERCE (Reading)
3.4. PASEC Assessment in Francophone sub-Saharan African Countries
The main objective of PASEC tests is not the comparison of student achievement across
countries but the analysis of key determinants relevant to increase educational quality. It does
not provide explicit, desired achievement levels. However, since 2005, PASEC standardizes its
tests and reports scores on common items. A specific level has been used in several reports in
order to check for the proportion of pupils who would reach the minimum level of competency.
Hence, when a pupil reaches25% of good answers in the tests, it is assumed that he reaches the
minimum level of competency in each skill (reading and mathematics). The level of 25 points is
similar to both grades (Grade 2 and Grade 5). Although this level has not yet been clearly
explained in detail in reports, we will use it as a reference for the minimum level. Moreover, we
define the threshold of 40 points of a specific desired level for each skill.
Figure 6 presents results for the reading skills in grade 5. Data for 12 countries is available
for PASEC study. Several profiles can be distinguished. Countries as Burkina Faso and
Comoros appear to enrol about 4 out of 5 pupils in grade 5, but they fail to reach more than two
thirds of them to the minimum level. Indeed, in Mauritania, less than one third of pupils can
enrol in the grade 5 and reach the minimum level of skills in reading. In other countries as
0
10
20
30
40
50
60
70
80
90
100
Argentina Brazil Chile Colombia Costa Rica Cuba DominicanRepublic
Ecuador El Salvador Guatemala Mexico Nicaragua Panama Paraguay Peru Uruguay
Survival Rate to last grade Minimum Level Survival and Minimal Level

18
Mauritius, most pupils reach both the grade 5 and the minimum level. Some mixing results can
be found in Burundi, where less than 60% of pupils reach both the grade 5 and the minimum
level.
Figure 6: Estimated percentage of students who survive to grade 5 and who are able to reach the minimum level in PASEC II (Reading)
4. Anchoring of assessments tests
4.1. Literature
The main issue of analyzing student assessments separately is the lack of comparability between
tests. It is impossible to this stage to compare the proportion of pupils who reach the minimum
level in one test with results from another test. Many reasons explain this difficulty. Firstly,
achievement tests are not anchored in the same way in order to provide a direct comparability of
performance levels. For instance, in PASEC, scores are based on a level between 0 and 100,
whereas in other tests, the global mean is standardized in order to obtain 500. Another issue can
be related to the difference of definition on the minimum level thresholds. As these thresholds
are not equal in each test, comparing them would bias interpretations. In this section, we
propose to obtain an adjusted database which would anchor achievement tests. This would
0
10
20
30
40
50
60
70
80
90
100
Benin Burkina Faso Burundi Cameroun Chad Comoros Congo Côte d'Ivoire Gabon Madagascar Mauritania Mauritius Senegal
Survival Rate to Grade 5 Minimum Level Survival and Minimal Level

19
permit to obtain comparable scores between countries. Moreover, we propose to define a new
minimum level which would be based on several hypotheses. Hence, this is the first database for
approximately 70 countries which makes available quality adjusted measures of internal
efficiency in primary schools.
Our methodology aims at improving initial work done by Lee and Barro (2001) and
updates a previous version (Altinok and Murseli, 2007). In these two pioneering papers, the
authors used direct results from International Student Achievement Tests, without any specific
methodology for adjusting potential differences between all series. They used instead a
regression technique – i.e. the seemingly unrelated regressiontechnique – which allows them to
obtain different constants between each test, and hence to allow for potential differences
between tests over years and over skills. We begin our analysis by using these studies. Another
method of anchoring has been made by Hanushek and Kimko (2000). These authors adjusted
ISATs between 1964 and 1995 by using results from NAEP (National Assessment of
Educational Progress). However, their methodology is only based on US scores, and data take
into account the restrictive period 1964-1995. A recent paper by Hanushek and Woessmann
(2007) aimedat correcting for some of these imperfections by using an approach that assumes
stability over time of the variance of quality of student achievement in a restricted number of
OECD countries. Authors suggest two criteria for a group of countries to serve as a
standardization benchmark for performance variation over time. Firstly, the countries have to be
member states of the relatively homogenous and economically advanced group of OECD
countries in the whole period of ISATs observations. Second, the countries should have had a
substantial enrollment in secondary education already in 1964. Then, authors suggest 13
countries that meet both of these measures of stability which are named “OECD Standardization
Group” (OSG) of countries7. Hanushek and Woessmann assume that the cross-country variation
among the OSG countries do not vary substantially since 1964. With this assumption, they use
the OSG countries to develop a comparable scale for the variation on the different ISATs. By
using this assumption, they build new indicators of student achievements and educational
quality. Their main measure of cognitive skills is a simple average of all standardized math and
science test scores of the ISATs in which a country participated. Their database includes
combined measure for the 77 countries that have ever participated in any of the math and
science tests.
7 The OSG countries are: Austria, Belgium, Canada, Denmark, France, Germany, Iceland, Japan, Norway, Sweden, Switzerland, the United Kingdom, and the United States.

20
A major issue with this methodology concerns countries that are far from the measured OECD
performance. In particular, countries far off the scale of the original test scores may not be well
represented because the tests may be too hard and thus not very informative for them. This bias
may be more important when analyses are focused on developing countries.
Moreover, the methodology used – i.e. the “OSG of countries” – does not take into account
several improvements made by ISATs since 1995. The IEA and OECD teams prepared recent
ISATs in order to permit over time comparisons. By using another methodology, Hanushek and
Woessmann (2007) chose a specific approach and neglected the recent improvements made by
psychometricians (as the Item Response Theory). Moreover, they do not clearly show to what
extent their main assumption – i.e. the variation between the OSG of countries is stable – is
corroborate by results from modern ISATs, as these ones permit to compare countries’
performance over time.
Another limit deals with the absence of Regional Student Assessments (RSATs) in their
database. The authors only focused in ISATs since the methodology used is based on developed
economies. In our paper, we provide an alternative methodology which enables the possibility to
include main regional assessments. As these ones are focused on developing countries, our
study permits to analyze more deeply the question of universal primary education.
Compared to previous research, our approach innovates in several ways. First, we use regional
surveys, such as LLECE, SACMEQ or PASEC8, which were never used in previous papers.
This enables us to obtain original data on the quality of student achievements for a larger
number of developing countries, and especially for African and Latin American countries. Our
methodology consists of anchoring ISATs with the results of United States in the US NAEP
(National Assessment of Educational Progress) for only the very first ISATs. In parallel to this
anchoring, for recent achievement tests (for instance, TIMSS) will allow us to make
intertemporal comparisons of country performance. Last but not least, adjusting regional student
achievement tests (RSAT) needs a new methodology which uses countries participating at least
to one ISAT and a RSAT. By using these countries performance in both tests, we make an
anchoring of RSATs with ISATs. We therefore combine these new series – i.e. the Regional
Student Achievement Tests – by using scores for countries which took part in at least one ISAT
for the same period. The main advantage of this specific methodology is both to adjust old
8 Respectively the Latin American Laboratory for Assessment of the Quality of Education (LLECE), the Southern and Eastern Africa Consortium for Monitoring Educational Quality (SACMEQ) or the Program on the Analysis of Education Systems8 (PASEC)
21
achievement tests and to permit to take into account future achievement tests. Hence, our
database will be updated when new international and regional achievement tests will be
available in the future.
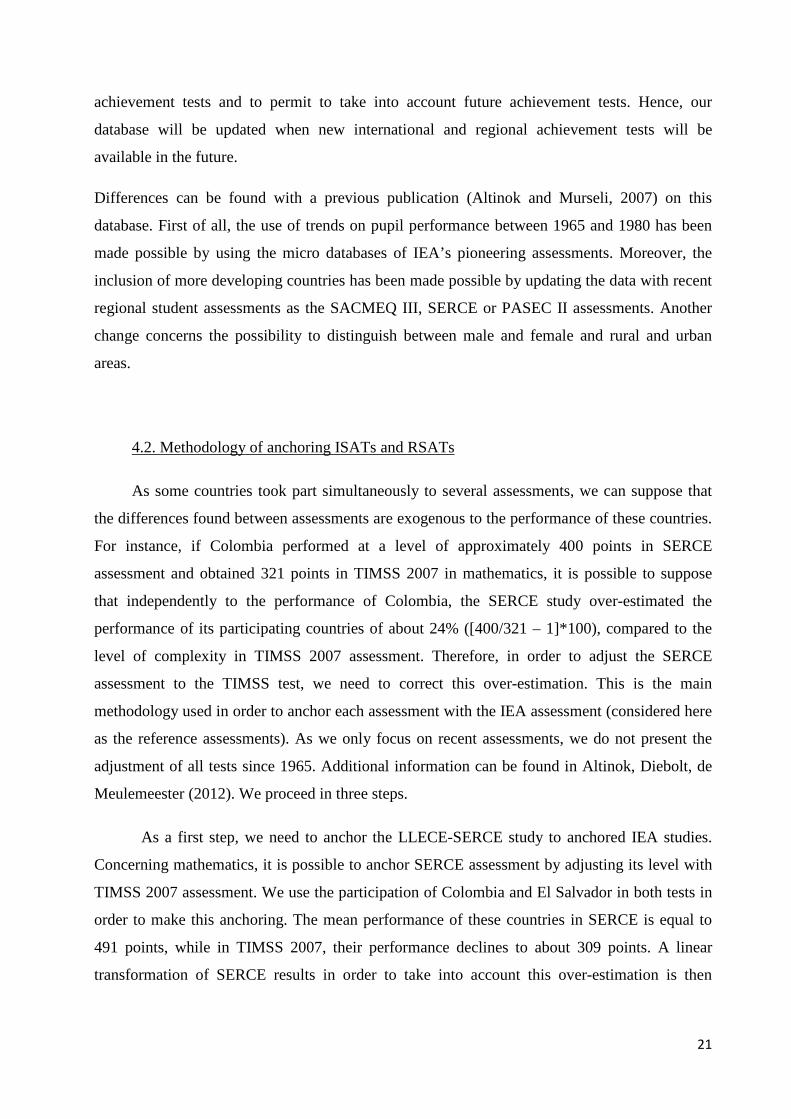
Differences can be found with a previous publication (Altinok and Murseli, 2007) on this
database. First of all, the use of trends on pupil performance between 1965 and 1980 has been
made possible by using the micro databases of IEA’s pioneering assessments. Moreover, the
inclusion of more developing countries has been made possible by updating the data with recent
regional student assessments as the SACMEQ III, SERCE or PASEC II assessments. Another
change concerns the possibility to distinguish between male and female and rural and urban
areas.
4.2. Methodology of anchoring ISATs and RSATs
As some countries took part simultaneously to several assessments, we can suppose that
the differences found between assessments are exogenous to the performance of these countries.
For instance, if Colombia performed at a level of approximately 400 points in SERCE
assessment and obtained 321 points in TIMSS 2007 in mathematics, it is possible to suppose
that independently to the performance of Colombia, the SERCE study over-estimated the
performance of its participating countries of about 24% ([400/321 – 1]*100), compared to the
level of complexity in TIMSS 2007 assessment. Therefore, in order to adjust the SERCE
assessment to the TIMSS test, we need to correct this over-estimation. This is the main
methodology used in order to anchor each assessment with the IEA assessment (considered here
as the reference assessments). As we only focus on recent assessments, we do not present the
adjustment of all tests since 1965. Additional information can be found in Altinok, Diebolt, de
Meulemeester (2012). We proceed in three steps.
As a first step, we need to anchor the LLECE-SERCE study to anchored IEA studies.
Concerning mathematics, it is possible to anchor SERCE assessment by adjusting its level with
TIMSS 2007 assessment. We use the participation of Colombia and El Salvador in both tests in
order to make this anchoring. The mean performance of these countries in SERCE is equal to
491 points, while in TIMSS 2007, their performance declines to about 309 points. A linear
transformation of SERCE results in order to take into account this over-estimation is then
22
made9. The anchoring process for reading is based on PIRLS 2001 study. As Argentina and
Colombia took part to both SERCE and PIRLS 2001 study, the same methodology is used to
anchor the SERCE assessment in reading10. Concerning this anchoring, we use both grade 3 and
grade 6 data in order to test of a specific “grade-effect”. As tested grades differ between PIRLS
and SERCE, we try to adjust independently both grades. We do not find a strong modification in
countries performance between grade 3 and grade 6. Indeed, there is no strong bias relating to
differences in grade level tested between assessments.
The next step consists of anchoring SACMEQ results with IEA assessments. For the
anchoring process in reading, we use results from South Africa in both SACMEQ III and PIRLS
2006 database, as this country took part to both assessments. By computing the anchoring
coefficient between SACMEQ III and PIRLS 2006, and having in mind that the SACMEQ
scores are comparable over time, it becomes possible to anchor all SACMEQ rounds with
PIRLS database. In mathematics, it is possible to indirectly adjust SACMEQ scores with
countries which took part to the TIMSS 2007 assessment. In SACMEQ database, already
adjusted data with TIMSS is available. However, using directly these scores may over-estimate
the overall performance of SACMEQ countries, due to the difference of grades tested between
SACMEQ and TIMSS (grade 6 for SACMEQ and grade 4 for TIMSS). Hence, we also used as
anchor country the participation of Botswana in both TIMSS 2003 and SACMEQ II assessments
as adjustment of the differences between grades11. As Botswana took part to both TIMSS 2003
and SACMEQ II study, we adjust the difference of the two scores in order to rescale the
SACMEQ database. After having taken into account the anchoring in first step, the performance
of Botswana declines from 512 points to 298 points (which represents a decline of about 40% of
original SACMEQ performance level)12. The anchoring process with other SACMEQ
assessments is not needed since the SACMEQ study provides comparable data between each
round. The anchoring is based on results of South Africa in both assessments. It appears that
SACMEQ II original results are over-estimated compared to PIRLS 2006 results. 9 SERCE scores are multiplied by 309/491 points. This represented a decrease of about 37% of SERCE performance. 10 As PIRLS 2001 and PIRLS 2006 assessments have been already adjusted in the first step, it is not needed to make another specific anchoring. This would have been better to anchor on PIRLS 2006 data, since the SERCE study have been conducted in 2006. However, there is no Latin American country in PIRLS 2006 test. 11 This adjustment was made with a prediction of grade 4 pupils’ results from grade 8 pupils’ results for developing countries only, based on TIMSS results. 12 It should be noted that the score of 298 points is the adjusted scores of Botswana in TIMSS 2003 assessment, and not its direct score. As we corrected all IEA studies with National Assessment of Educational Progress (NAEP) anchoring, this mean performance has to be corrected too. It changes from 366 to 298 points in the case of Botswana. Therefore, this performance level becomes comparable with countries’ performance in TIMSS 2007 study and all other TIMSS datasets.

23
The last step concerns the anchoring of PASEC data. We base our methodology by anchoring
the PASEC test with the adjusted SACMEQ test by comparing results of Mauritius. As this
country took part to both assessments (in 2006 for PASEC and 2007 for SACMEQ), we anchor
PASEC assessment by adjusting the scores of countries which took part in PASEC with the
difference of performance of Mauritius between PASEC and SACMEQ. As PASEC scores are
based on a scale between 0 and 100, the transformation of these scores in order to adjust them
on the SACMEQ scale is equal to 6.67 in reading and 8.81 in mathematics13. This anchoring
gives the same performance level for Mauritius in both PASEC and SACMEQ tests.As PASEC
is an assessment for francophone countries, while SACMEQ focuses on Anglophone countries,
the anchoring process may lead to biases in adjusted reading scores. However, Mauritius has
been tested in both languages in PASEC (English and French). By using both scores for
Mauritius in PASEC, it gives us the adjusted coefficient of anchoring between PASEC and
SACMEQ in reading.
4.3. Limits to the use of student achievement tests and the methodology
4.3.1. Difficulties inherent in student achievement tests
Above all, it should be borne in mind that in spite of the increase in the number of
countries that take part in international surveys, the skills tested are often the same. Standardized
surveys only measure a fraction of what is actually learnt at school. In general, surveys measure
achievement in mathematics, science and reading only and exclude all other areas. While other
subjects may sometimes be assessed, they often tend to reflect national characteristics and can
hardly be standardized for all countries (as in the case of philosophy, history or geography).
Furthermore, academic or non-academic knowledge relating to morality, civic or even artistic
values may be used to measure the quality of learning achievement. The definition of
“standardized” and “objective” quality may thus be called into question (Unesco, 2004).
Measuring the quality of learning achievement by means of international surveys may therefore
be of limited value, since it amounts to assessing performance in two or three skills only.
13 It would have been possible to begin by standardizing the PASEC database as other assessments, which would give another adjustment coefficient. However, we preferred to keep it intact before adjustment. As we use a linear translation, both methods would give the same results.

24
Furthermore, an assessment procedure that measures skills in a standardized way in tens
of countries at a time are, at the very least, very hard to implement. Even though generic
elements in the curriculum are fairly similar in all countries worldwide, it is clear that marked
differences may persist. Such differences may relate to curricular content but also to the method
of teaching. For example, Howie and Hugues (2000) have studied the extent to which TIMSS
survey items are covered by the national education system in South Africa. They noted that only
17% of TIMSS survey items in science featured in the national curriculum for grade 7, while
50% were in the curriculum for grade 8. The extent to which a survey is standardized thus
depends on the degree to which its constituent elements match the national curriculum: the
greater the difference between standardized items in an international survey and the national
curriculum, the greater the likelihood that the assessment of an education system will be poor.
This difficulty lends weight to the idea that international comparisons of learning achievement
should be treated with caution. As Greeney and Kellaghan (2008) point out, it is less
straightforward to identify a common core of skills and knowledge in mathematics and science
than in reading. The difficulty is compounded in science because the teaching of this subject
varies considerably from one country to the other. Whereas all science subjects are taught as an
integrated whole in some countries (for example, the United States of America and Egypt), in
others, the field is broken down into discrete subjects such as physics, chemistry, life or earth
sciences (as in nearly all Eastern European countries and Indonesia).
4.3.2.Difficulties inherent in the methodology
Other limitations are methodological in nature. Although the methodology used was
designed to measure level of equivalence between the different surveys, it has its own limits.
Three such limits are discussed below, although there may be others.
Firstly, the nature of the skills assessed may differ from survey to survey, in which case
the surveys may not be readily comparable. While some assessments (such as the IEA surveys)
tend to measure learning achievement in terms of knowledge, others (such as the OECD
surveys) focus more on the level of pupils’ skills. In this particular case, any equivalence
established may be distorted, as the “products” of education measured in this way are not clearly
equivalent. As in our study, we only focus on assessments based on the knowledge dimension,
this bias is altered.

25
Moreover, the content of the tests is not strictly equivalent, which may bias cross-country
comparisons when assessments are anchored. For example, IEA’s TIMSS test in Mathematics
included the same domains tested in SACMEQ. The domain are however different compared to
PASEC tests and LLECE-SERCE tests. Therefore, the anchoring supposes that a pupil who
performs well in one assessment will probably perform in the same way in another assessment,
regardless to the exact content of tested skills. Despite this difference in the kind of
“acquisition” measured, the surveys provide a sound assessment of pupils’ attainment in
mathematics, science and reading.
Another limit concerns the difference concerning the target population. As shown in
section 2, the grade tested differs between anchored assessments. Despite the fact that tests are
adapted for each evaluated grade, comparing assessments in different grades may distort the
cross-country comparisons (Saito, van Capelle, 2009). For instance, PASEC tests evaluate grade
5 pupils whereas PIRLS focuses on Grade 4 pupils. On the contrary SACMEQ and LLECE-
SERCE assess Grade 6 pupils. Since, each test prepared adapted items for each grade, cross-
country comparisons within each assessment are possible. As the reference grade is Grade 4, all
regional assessments are made in another grade (Grade 5 or Grade 6). Our paper supposes that
the performance in one grade for a country (i.e. Grade 5 or Grade 6) would give the same level
in the reference grade (here Grade 4). Unfortunately, there is no specific research in this area
which compares regional student assessments and international student assessments. However,
some recent research comparing results from TIMSS and PISA showed that ranking of countries
are quite similar, despite the difference of the target population (Brown et al., 2005; Wu, 2010).
4.4. Results for the main international database
As we adjusted all assessments to the IEA assessment level, it would be logical to define
the minimum level as the one proposed by IEA. Hence, the threshold of the minimum level
would be fixed at 400 points. The main issue with this definition is that most developing
countries perform lower than this threshold with the adjusted database. Therefore, it appears to
be more appropriate to choose another threshold, more adapted to the developing economies.
Hence, we propose to use the SACMEQ minimum level used in section 3 as a standard
minimum level. The SACMEQ minimum level is fixed as the competency level 3 in each skill.
Hence, a pupil who reaches the standardized minimum level (SML) would reach at least the

26
level 3 of the SACMEQ competency scales. As a result, it remains possible to include results
from SACMEQ III, despite the lack of microdatabase (since there is no need to make specific
adjustment for SACMEQ results). The SML is fixed to 221 points in reading and 309
achievement points in mathematics. As there is no assessment in science in SACMEQ, the level
of 300 points has been chosen as the minimum level. Moreover, the level of 400 points is then
considered as the “desired level”14. Additionally, the measure of quantitative efficiency relates
to the survival rate to the last grade of primary schools, which seems to be the most appropriate
grade to permit an evaluation of progress toward UPE.
Results for the minimum level are presented in Figure 7 for 54 countries15.The minimum level is
attained by less than 10% of pupils in Malawi and Tanzania if we focus on mathematics. In
other Anglophone countries as Lesotho or Namibia, the proportion is very low too:
approximately 20% of pupils reach the minimum level. On the contrary, countries like
Kazakhstan or Russian Federation do not seem to have specific issues with pupils not reaching
the minimum level, since most pupils have a score equal or higher than the threshold of the
minimum level. The combination with the survival rate can be interesting, since it permits to
predict which proportion of pupils would both enter into the last grade of primary education and
reach the minimum level in mathematics. For instance, approximately one third of pupils from
Morocco reach both the minimum level and the last grade of primary education, while half of
them reach the minimum level. This can explain that the low access to the end of primary
education can over-estimate results of this country in international tests.
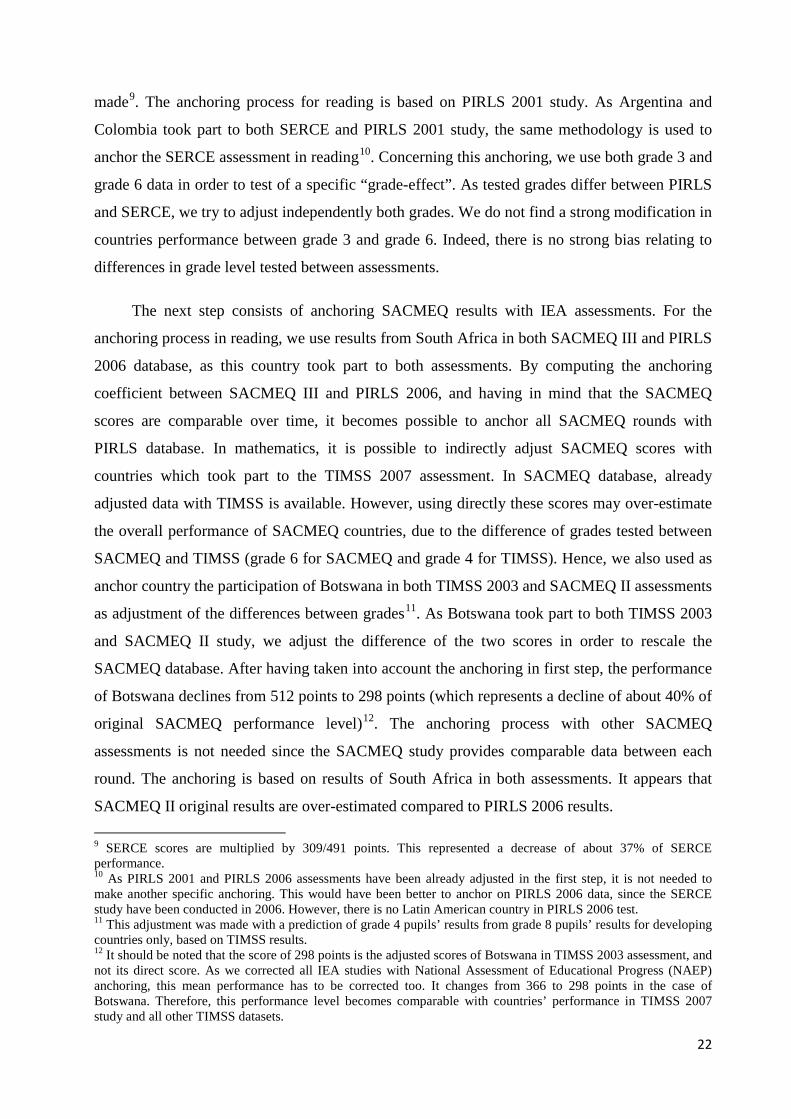
In Figure 8, we provide the same analysis with the reading subject. It should be noted that
the sample of countries is not exactly the same between mathematics and reading. Hence, any
analysis based on ranking of countries should take into account this difference. We tend to
prefer analyze relative distances between countries instead of simply comparing ranks since this
may lead to misinterpretations. Indeed, the very low performance highlighted for Yemen in
reading cannot be found in mathematics, since this country did not take part to the TIMSS study.
Confirming previous results, East European and Central Asia countries seem to permit to
most of their pupils to reach the minimum level (Russian Federation, Bulgaria, Moldova and
Georgia). In Nicaragua however, results are mixed. In one hand, most pupils reach the minimum
14 Due to the lack of the micro data of SACMEQ III, our paper only presents results for SACMEQ II concerning the desired level. 15As for previous figures, we did not included developed countries in figures. Data for all countries, including developed economies are presented in Tables A.2, A.3. and A.4.

27
level in reading, but due to the low access to the last grade of primary schools, the proportion of
pupils who reach both measures drops to half of the population. This relation can also be found
in other Latin American countries as Guatemala. The first sub-Saharan country where there is
the highest proportion of pupils reaching the minimum level is Zimbabwe, followed by
Swaziland and Kenya. In these countries, more than 80% of pupils reach the minimum level. On
the other side, African countries as Mauritania, Benin or Comoros appear to have a high
proportion of pupils below the minimum level, since less than 25% of pupils in these countries
reach the minimum level16.
16 However, results from Mauritania appear to be very low, mainly due to the fact that this country undertook several reforms in the language of instruction in primary education. A next round of PASEC in this country will permit to confirm this hypothesis.

28
Figure 7: Estimated percentage of students who survive to last grade of primary education and who are able to reach the minimum level in mathematics, International database
Note: “Minimum level” = Proportion of pupils reaching the minimum level; “Survival and Minimal level” = Proportion of pupils who survive to the last grade and reach the minimum level.
0 10 20 30 40 50 60 70 80 90 100
KazakhstanRussia
ArmeniaGeorgia
MongoliaCuba
UruguayCosta Rica
MadagascarIran
MauritiusMexico
ChileAlgeria
ArgentinaKenya
SeychellesCamerounSwazilandZimbabwe
BrazilBurundi
GabonColombia
PeruSenegal
MoroccoTunisia
BotswanaParaguay
El SalvadorBurkina Faso
KuwaitEcuador
NicaraguaGuatemala
PanamaCongo
ComorosSouth Africa
ChadQatar
ZambiaBenin
MozambiqueUgandaLesothoNamibia
Dom. RepublicMauritania
Côte d'IvoireYemenMalawi
Tanzania
Minimum Level Survival and Minimal Level
29
Figure 8: Estimated percentage of students who survive to last grade of primary education and who are able to reach the minimum level in reading, International database
Note: “Minimum level” = Proportion of pupils reaching the minimum level; “Survival and Minimal level” = Proportion of pupils who survive to the last grade and reach the minimum level.
0 10 20 30 40 50 60 70 80 90 100
Moldova
Russia
Bulgaria
Georgia
Costa Rica
Chile
Cuba
Colombia
Mexico
Uruguay
Brazil
Romania
El Salvador
Nicaragua
Argentina
Indonesia
Macedonia
Panama
Peru
Iran
Trinidad & Tob.
Zimbabwe
Guatemala
Paraguay
Ecuador
Swaziland
Dom. Republic
Kenya
Gabon
Mauritius
Zambia
Seychelles
Qatar
Botswana
Kuwait
Cameroun
Morocco
Namibia
Mozambique
Uganda
South Africa
Lesotho
Burundi
Senegal
Burkina Faso
Côte d'Ivoire
Congo
Madagascar
Tanzania
Malawi
Chad
Comoros
Benin
Mauritania
Minimum Level Survival and Minimal Level

30
4.4. Results based on the lowest quartile
Another approach of analyzing low performers among countries is be the possibility of merging
all comparable data for each skill and to look of proportion of pupils inside the lowest quartile
(bottom 25%). However, this methodology has the main drawback that it cannot include pupil
weights from each dataset. Indeed, these weights are designed inside each assessment and each
country. By using weights for the lowest quartile may bias results by under- or over-estimating
the ‘real’ proportion of pupils inside each country. We therefore do not include weights at the
pupil level. Another issue in this methodology is the possible difference of number of pupils
assessed for each country. If in one country, fewer pupils are assessed, the proportion of pupils
from this country would be under-estimated, in comparison of another country which included
more pupils. In order to avoid this structural bias, we propose to create a new weight variable
which gives to each country the same weight (equal to 500). By using this weight, each pupil
has the same probability to be included in the lowest quartile, regardless to the number of pupils
assessedwithin each country.
Results can be found in Figures 9 and 10 for mathematics and reading respectively17. Countries
are ordered by the proportion of pupils present in the lowest quartile of the adjusted
international database. The ten countries where the proportion of pupils is the most marginalized
are African countries. The sum of the proportionof these countries represents approximately
36% of the whole sample. Therefore, more than one third of pupils who can be considered as
“internationally marginalized” come from 10 African countries (Malawi, Yemen, Zambia, Côte
d’Ivoire, Namibia, Lesotho, Mauritania, Benin, South Africa and Chad). On the opposite side,
Latin American countries are clearly less present in the lowest quartile. For instance, pupils
from Cuba represent only 0.5% of pupils in this sample, where this is the case of more than 2%
of pupils from Burkina Faso. It should be highlighted however, that there is no country for
which this proportion exceeds 4% of the sample. This would imply that the international
distribution in the lowest quartile is not concentrated in one single country. In developed
countries, there is no pupil or a very low number inside this quartile. Among African countries,
Kenya and Madagascar are the countries where there is the lowest proportion of internationally
marginalized pupils.
17Results for science are presented in Table A.3.

31
Results for reading show quite similar findings. However, as the number of countries differs
comparing to the mathematics skills, some differences appear in the bottom of the lowest
quartile. For example, two Arab states (Qatar and Kuwait) have more than 2% of their pupils
inside this quartile. On the contrary, Latin American countries as Costa Rica or Cuba show a
very low proportion of pupils (less than 0.3%). This would imply that marginalized populations
are mostly in sub-Saharan Africa and in Arab States. This would have been very useful to obtain
data for countries as Bangladesh, India, China or Nigeria, but due to their non participation in
International and Regional student achievement tests, we cannot know which proportion of their
pupils are included in the lowest quartile of the adjusted international database.

32
Figure 9: Distribution among countries of the lowest achievers in the adjusted international database in mathematics, International database (Bottom Quartile)
0 0.5 1 1.5 2 2.5 3 3.5 4 4.5
Hong-KongNetherlands
AustriaJapanLatvia
LithuaniaRussian Federation
SingaporeSweden
USADenmarkGermany
KazakhstanSloveniaEngland
ItalyCzech Republic
AustraliaArmeniaScotlandSlovakiaHungary
New ZealandNorwayUkraineGeorgia
MongoliaCuba
Costa RicaUruguay
KenyaIran Islamic Republic of
MadagascarMexico
MozambiqueArgentina
ChileSeychellesSwaziland
AlgeriaBrazil
ColombiaTanzania United Republic
CamerounGabon
MauritiusPeru
BurundiBotswana
El SalvadorSenegal
ParaguayUganda
Burkina FasoGuatemala
TunisiaNicaraguaMoroccoPanamaEcuador
KuwaitCongo
South AfricaChad
ComorosQatarBenin
Dominican RepublicLesothoZambia
NamibiaCôte d'Ivoire
MalawiMauritania
Yemen
% in Bottom 25% performers

33
Figure 10: Distribution among countries of the lowest achievers in the adjusted international database in reading, International database (Bottom Quartile)
0 0.5 1 1.5 2 2.5 3 3.5 4
Hong Kong, ChinaLuxembourgNetherlands
Russian FederationAustria
ItalyLatvia
SwedenFrance
GermanyHungary
DenmarkUSA
BulgariaIcelandPoland
SingaporeSlovenia
SpainMoldova Republic of
SlovakiaNorway
New ZealandGeorgia
Costa RicaRomania
CubaIsraelChile
MexicoUruguay
ColombiaBrazil
Trinidad and TobagoArgentina
Iran Islamic Republic ofMacedonia F.Y.R.
El SalvadorIndonesiaNicaragua
PeruPanama
GuatemalaParaguay
GabonEcuador
MauritiusSeychelles
QatarDominican Republic
CamerounKuwait
MoroccoKenya
Tanzania United RepublicSenegal
BostwanaBurkina Faso
BurundiCongo
South AfricaSwaziland
Côte d'IvoireUganda
MadagascarChad
ComorosMozambique
BeninNamibiaZambia
MauritaniaLesothoMalawi
% in Bottom 25% performers
34
5. Conclusion
The aim of our study is to analyze conjointly two factors: quality of education and completion of
primary education. For doing this, we propose to use international and regional achievement
tests (ISATs and RSATs) in order to obtain comparable benchmarks of pupils’ performance in
mathematics, science and reading. By comparing these benchmarks with traditional measures of
primary completion rates, we are able to present a global picture of overall performance in
primary schools around the world and hence to better evaluate the global trend toward the
Education for All Initiative.
Our study is based on all international and regional achievement tests which evaluate primary
schools (TIMSS, PIRLS, SACMEQ, PASEC and SERCE). Unfortunately, given the diversity of
existing achievements tests, there is no a single measure of the minimum skills level over all
tests. On the contrary, ISATs and RSATs differ greatly in the definition of what should know a
pupil in the respective skill tested. Therefore, in this section we propose to present the minimum
levels defined in each assessment.
We present three types of indicators. The first represents the main indicator of school efficiency
which is appropriate to the grade tests in the achievement test. For instance, we include the
survival rate to grade 4 in TIMSS 2007, since pupils from this grade are tested in IEA
assessments. Moreover, at the second position, our analysis includes the proportion of pupils
reaching the minimum level defined above. In the case of TIMSS 2007, it represents the
proportion of pupils who obtained at least the score of 400 in each skill. Lastly, we combine
both indicators in order to obtain the proportion of pupils who survive to grade 4 and who reach
the minimum level defined for each test. These results modify our view of how countries are
doing in terms of reaching the goals of quality education for all. For instance, we show that
Kuwait has a very good record in providing schooling to its children, with most of children
reaching grade 4. However, it appears to be doing poorly in terms of learning achievement,
since less than 20% of its 4th graders are able to use mathematics skills at the minimum level.
This means that only 19% of its children reach grade 4 and are to use mathematics at the
minimum level.
The main issue of analyzing student assessments separately is the lack of comparability between
tests.In this section, we propose to obtain an adjusted database which would anchor achievement
tests. This would permit to obtain comparable scores between countries. Moreover, we propose
to define a new minimum level which would be based on several hypotheses. Hence, this is the
first database for approximately 70 countries which makes available quality adjusted measures

35
of internal efficiency in primary schools. Hence, we propose to use the SACMEQ minimum
level used in section 3 as a standard minimum level. The SACMEQ minimum level is fixed as
the competency level 3 in each skill. Hence, a pupil who reaches the standardized minimum
level (SML) would reach at least the level 3 of the SACMEQ competency scales. Moreover, the
level of 400 points is then considered as the “desired level”. Additionally, the measure of
quantitative efficiency relates to the survival rate to the last grade of primary schools, which
seems to be the most appropriate grade to permit an evaluation of progress toward UPE. For
example, we show that the minimum level is attained by less than 10% of pupils in Malawi and
Tanzania if we focus on mathematics.
Another approach of analyzing low performers among countries is be the possibility of merging
all comparable data for each skill and to look of proportion of pupils inside the lowest quartile
(bottom 25%). We find that the ten countries where the proportion of pupils is the most
marginalized are African countries. The sum of the proportion of these countries represents
approximately 36% of the whole sample. Therefore, more than one third of pupils who can be
considered as “internationally marginalized” come from 10 African countries (Malawi, Yemen,
Zambia, Côte d’Ivoire, Namibia, Lesotho, Mauritania, Benin, South Africa and Chad).
References
Altinok, N., Diebolt, C., de Meulemeester, J.-L. (forthcoming). “An International Database on Education Quality (1965-2010)”, AFC-Working Paper, French Association of Cliometrics.
Altinok, N., Murseli, H. (2007). “International database on Human Capital Quality”.Economics Letters, 96(2), pp. 237-244.
Brown, G., Micklewright, J., Schnepf, S.V., Waldmann, R. (2005). “Cross-National Surveys of Learning Achievement: How Robust are the Findings?”. Southampton Statistical Sciences Research Institute, Applications & Policy Working paper, A05/05.
Casassus, J., Froemel, J.E., Palafox, J.C., Cusato, S. (1998). First International Comparative Study of Language, Mathematics, and Associated Factors in Third and Fourth Grades. First Report. Santiago, Chile: Latin American Laboratory for Evaluation of the Quality of Education.
Casassus, J., Froemel, J.E., Palafox, J.C., Cusato, S. (2002). First International Comparative Study of Language, Mathematics, and Associated Factors in Third and Fourth Grades. Second Report. Santiago, Chile: Latin American Laboratory for Evaluation of the Quality of Education.
Gove, A., Cvelich, P. (2010). Early Reading: Igniting Education for All. A Report by the Early Grade Learning Community of Practice.Research Triangle Park, NC: Research Triangle Institute.
Greeney,V., Kellaghan, T. (2008). Assessing national achievement levels in education. World Bank.

36
Hanushek,E.A., Kimko, D.D. (2000), "Schooling, Labor-Force Quality, and the Growth of Nations", American Economic Review, 90(5), 1184-1208.
Hanushek, E.A., Woessmann, L. (2007), "The Role of Education Quality in Economic Growth", World Bank Policy Research Working Paper, 4122, Washington, D.C.
Howie, S., Hughes, C. (2000). “South Africa”, in Robitaille, D., Beaton, A., Plomb, T. (eds.). The Impact of TIMSS on the Teaching and Learning of Mathematics and Science, pp. 139-145. Vancouver, BC: Pacific Educational Press.
Hungi, N., Makuwa, D., Ross, K., Saito, M., Dolata, S., van Cappelle, F., Paviot, L., Veillien, J. (2010). “SACMEQ III Project Results: Pupil achievement levels in reading and mathematics”, Working Document, Number 1, SACMEQ.
Lee, J.W., Barro, R.J (2001) "Schooling Quality in a Cross Section of Countries", Economica, 38(272), pp. 465-88.
Lewin, K.M. (2011), “Taking Targets to Task Revisited: How Indicators of Progress on Access to Education can Mislead”, Create Pathways to Access, Research Monograph, No. 54, January.
Mullis, I.V.S., Martin, M.O., Kennedy, A.M., Foy, P. (2007), PIRLS 2006 International Report, Boston : Boston College Press.
Mullis, I.V.S., Martin, M.O., Foy, P. (2008), TIMSS 2007 International Report, Boston : Boston College Press.
OECD (2010), The High Cost of Low Educational Performance: The Long-Run Economic Impact of Improving PISA Outcomes. Paris: OECD.
Olson, J.F., Martin, M.O., Mullis, I.V.S. (2007). TIMSS 2007 Technical Report, TIMSS&PIRLS International Study Center, Lynch School of Education, Boston College.
Ross, K.N., Postlethwaite, T.N. (1991). Indicators of the Quality of Education: A Study of Zimbabwean Primary Schools. Harare: Ministry of Education and Culture; Paris: International Institute for Educational Planning.
SACMEQ (2010), “SACMEQ III Project Results: Pupil Achievement levels in reading and mathematics”, Working Document Number 1, SACMEQ.
Saito, M., van Capelle, F. (2009). “Approaches to Monitoring the Quality of Education in Developing Countries – Searching for Better Research-Policy Linkages”, Paper based on the presentation during The International Symposium on Quality Education for All – Approaches to Monitoring and Improving the Quality of Education, Berlin, 11-12 May 2009.
UNESCO (2004).EFA Global Monitoring Report 2005: The Quality Imperative. Paris: UNESCO.
UNESCO (2011).EFA Global Monitoring Report 2011. The hidden crisis: Armed conflict and education. Paris: UNESCO.
UNESCO-LLECE (2008).Student Achievement in Latin America and the Caribbean. Results of the Second Regional Comparative and Explanatory Study, UNESCO, Regional Bureau of Education in Latin America and the Caribbean, Santiago.
Van Der Gaag, J., Adams, A. (2010). “Where is the Learning? Measuring Schooling Efforts in Developing Countries”, Policy Brief 2010-04, Global Economy and Development, The Brooking Institution, Washington.

37
Wolff, L., Nomura, S. (2011), “Financing the Quality of Education”, in UNESCO-UIS (eds). Financing Education in Sub-Saharan Africa.Meeting the Challenges of Expansion, Equity and Quality.UNESCO-UIS, Montreal, Quebec, pp.75-88.
World Bank Independent Evaluation Group (2006). From Schooling Access to Learning Outcomes: An Unfinished Agenda. Washington, DC: World Bank.
Wu, M. (2010), “Comparing the Similarities and Differences of PISA 2003 and TIMSS”, OECD Education Working Papers, No. 32, OECD Publishing.
Table A.1. Definition of Minimum and Desired levels in Student Achievement Tests.
Minimum level Desired level TIMSS Low International Benchmark
(400 points) in each skill Intermediate International Benchmark (475 points) in each skill
PIRLS Low International Benchmark (400 points) in each skill
Intermediate International Benchmark (475 points) in each skill
SACMEQ Level 3 "Basic Numeracy" in mathematics and Level 3 "Basic Reading" in reading
Level 4 "Competent numeracy" in mathematics and Level 4 "Interpretive reading" in reading.
PASEC 25% of correct answers in each skill tests
40% of correct answers in each skill tests
LLECE Level I (413.58 points in mathematics, 424.54 points in reading)
Level II (514.41 points in mathematics, 513.66 points in reading)
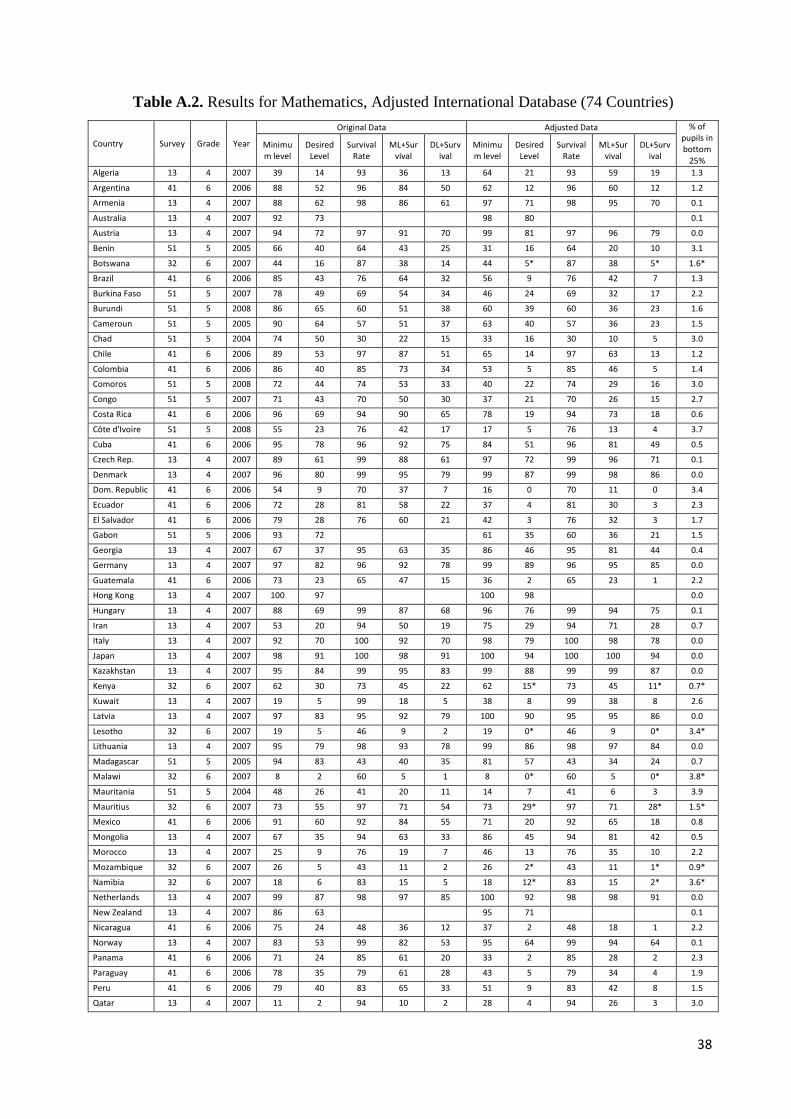
38
Table A.2. Results for Mathematics, Adjusted International Database (74 Countries)
Country Survey Grade Year
Original Data Adjusted Data % of pupils in bottom
25%
Minimum level
DesiredLevel
Survival Rate
ML+Survival
DL+Survival
Minimum level
DesiredLevel
Survival Rate
ML+Survival
DL+Survival
Algeria 13 4 2007 39 14 93 36 13 64 21 93 59 19 1.3
Argentina 41 6 2006 88 52 96 84 50 62 12 96 60 12 1.2
Armenia 13 4 2007 88 62 98 86 61 97 71 98 95 70 0.1
Australia 13 4 2007 92 73
98 80
0.1
Austria 13 4 2007 94 72 97 91 70 99 81 97 96 79 0.0
Benin 51 5 2005 66 40 64 43 25 31 16 64 20 10 3.1
Botswana 32 6 2007 44 16 87 38 14 44 5* 87 38 5* 1.6*
Brazil 41 6 2006 85 43 76 64 32 56 9 76 42 7 1.3
Burkina Faso 51 5 2007 78 49 69 54 34 46 24 69 32 17 2.2
Burundi 51 5 2008 86 65 60 51 38 60 39 60 36 23 1.6
Cameroun 51 5 2005 90 64 57 51 37 63 40 57 36 23 1.5
Chad 51 5 2004 74 50 30 22 15 33 16 30 10 5 3.0
Chile 41 6 2006 89 53 97 87 51 65 14 97 63 13 1.2
Colombia 41 6 2006 86 40 85 73 34 53 5 85 46 5 1.4
Comoros 51 5 2008 72 44 74 53 33 40 22 74 29 16 3.0
Congo 51 5 2007 71 43 70 50 30 37 21 70 26 15 2.7
Costa Rica 41 6 2006 96 69 94 90 65 78 19 94 73 18 0.6
Côte d'Ivoire 51 5 2008 55 23 76 42 17 17 5 76 13 4 3.7
Cuba 41 6 2006 95 78 96 92 75 84 51 96 81 49 0.5
Czech Rep. 13 4 2007 89 61 99 88 61 97 72 99 96 71 0.1
Denmark 13 4 2007 96 80 99 95 79 99 87 99 98 86 0.0
Dom. Republic 41 6 2006 54 9 70 37 7 16 0 70 11 0 3.4
Ecuador 41 6 2006 72 28 81 58 22 37 4 81 30 3 2.3
El Salvador 41 6 2006 79 28 76 60 21 42 3 76 32 3 1.7
Gabon 51 5 2006 93 72
61 35 60 36 21 1.5
Georgia 13 4 2007 67 37 95 63 35 86 46 95 81 44 0.4
Germany 13 4 2007 97 82 96 92 78 99 89 96 95 85 0.0
Guatemala 41 6 2006 73 23 65 47 15 36 2 65 23 1 2.2
Hong Kong 13 4 2007 100 97
100 98
0.0
Hungary 13 4 2007 88 69 99 87 68 96 76 99 94 75 0.1
Iran 13 4 2007 53 20 94 50 19 75 29 94 71 28 0.7
Italy 13 4 2007 92 70 100 92 70 98 79 100 98 78 0.0
Japan 13 4 2007 98 91 100 98 91 100 94 100 100 94 0.0
Kazakhstan 13 4 2007 95 84 99 95 83 99 88 99 99 87 0.0
Kenya 32 6 2007 62 30 73 45 22 62 15* 73 45 11* 0.7*
Kuwait 13 4 2007 19 5 99 18 5 38 8 99 38 8 2.6
Latvia 13 4 2007 97 83 95 92 79 100 90 95 95 86 0.0
Lesotho 32 6 2007 19 5 46 9 2 19 0* 46 9 0* 3.4*
Lithuania 13 4 2007 95 79 98 93 78 99 86 98 97 84 0.0
Madagascar 51 5 2005 94 83 43 40 35 81 57 43 34 24 0.7
Malawi 32 6 2007 8 2 60 5 1 8 0* 60 5 0* 3.8*
Mauritania 51 5 2004 48 26 41 20 11 14 7 41 6 3 3.9
Mauritius 32 6 2007 73 55 97 71 54 73 29* 97 71 28* 1.5*
Mexico 41 6 2006 91 60 92 84 55 71 20 92 65 18 0.8
Mongolia 13 4 2007 67 35 94 63 33 86 45 94 81 42 0.5
Morocco 13 4 2007 25 9 76 19 7 46 13 76 35 10 2.2
Mozambique 32 6 2007 26 5 43 11 2 26 2* 43 11 1* 0.9*
Namibia 32 6 2007 18 6 83 15 5 18 12* 83 15 2* 3.6*
Netherlands 13 4 2007 99 87 98 97 85 100 92 98 98 91 0.0
New Zealand 13 4 2007 86 63
95 71
0.1
Nicaragua 41 6 2006 75 24 48 36 12 37 2 48 18 1 2.2
Norway 13 4 2007 83 53 99 82 53 95 64 99 94 64 0.1
Panama 41 6 2006 71 24 85 61 20 33 2 85 28 2 2.3
Paraguay 41 6 2006 78 35 79 61 28 43 5 79 34 4 1.9
Peru 41 6 2006 79 40 83 65 33 51 9 83 42 8 1.5
Qatar 13 4 2007 11 2 94 10 2 28 4 94 26 3 3.0

39
Russia 13 4 2007 96 82 95 91 79 99 88 95 94 84 0.0
Senegal 51 5 2007 83 60 58 49 35 54 33 58 32 19 1.9
Seychelles 32 6 2007 58 31 85 49 27 58 20* 85 49 17* 1.2*
Singapore 13 4 2007 98 93 99 97 92 100 95 99 99 94 0.0
Slovakia 13 4 2007 89 66 97 86 64 96 74 97 93 73 0.1
Slovenia 13 4 2007 92 70 100 92 70 98 79 100 98 79 0.0
South Africa 32 6 2007 31 15 77 24 12 31 9* 77 24 7* 2.8*
Swaziland 32 6 2007 57 31 72 41 23 57 3* 72 41 2* 1.2*
Sweden 13 4 2007 94 70 100 93 70 99 80 100 99 80 0.0
Tanzania 32 6 2007 8 2 82 7 1 8 8* 82 7 7* 1.5*
Tunisia 13 4 2007 27 9 94 25 9 44 13 94 42 13 2.2
Uganda 32 6 2007 25 7 32 8 2 25 11* 32 8 4* 2.2*
Ukraine 13 4 2007 80 52 97 78 51 93 63 97 90 61 0.2
Uruguay 41 6 2006 95 74 94 90 69 82 32 94 78 31 0.6
USA 13 4 2007 96 79 91 87 72 99 86 91 90 78 0.0
Yemen 13 4 2007 5 1 59 3 1 12 2 59 7 1 4.1
Zambia 32 6 2007 27 6 78 21 5 27 1* 78 21 0* 3.6*
Zimbabwe 32 6 2007 56 19
56
Note: “Minimum Level” = proportion of pupils who reach the minimum level ; “Desired Level” = proportion of pupils who reach the desired level ; “Survival Rate” = survival rate to the last grade of primary education in 2007 ; “ML+Survival” = proportion of pupils who reach the last grade of primary education and the minimum level in 2007 ; “DL + Survival” = proportion of pupils who reach the last grade of primary education and the desired level in 2007 Codification of surveys : 13 = TIMSS 2007, 31 = SACMEQ II, 41 = SERCE, 51 = PASEC II. Countries which were used as benchmarks for anchoring in each assessment: PASEC with SACMEQ: Mauritius; LLECE with TIMSS: Colombia and El Salvador. * Data extracted from SACMEQ II assessment.

40
Table A.3. Results for Reading, Adjusted International Database (76 Countries)
Country Survey Grade Year
Original Data Adjusted Data % of pupils in bottom
25%
Minimum level
Desired Level
Survival Rate
ML+Survival
DL+Survival
Minimum level
Desired Level
Survival Rate
ML+Survival
DL+Survival
Argentina 41 6 2006 88 52 96 84 50 96 15 96 92 15 0.8
Austria 21 4 2006 98 86 97 95 84 100 73 97 97 71 0.0
Benin 51 5 2005 61 35 64 39 23 21 2 64 14 2 3.4
Botswana 32 6 2007 76 57 87 66 49 76 0* 87 66 0* 2.9*
Brazil 41 6 2006 85 43 76 64 32 98 17 76 74 13 0.6
Bulgaria 21 4 2006 95 84 94 89 79 100 73 94 94 69 0.0
Burkina Faso 51 5 2007 71 42 69 49 29 34 3 69 23 2 3.0
Burundi 51 5 2008 85 58 60 51 35 45 1 60 27 0 3.0
Cameroun 51 5 2005 91 72 57 52 41 66 11 57 37 6 2.2
Chad 51 5 2004 66 44 30 20 13 22 2 30 7 0 3.3
Chile 41 6 2006 89 53 97 87 51 99 23 97 97 22 0.4
Colombia 41 6 2006 86 40 85 73 34 99 13 85 84 11 0.6
Comoros 51 5 2008 65 31 74 48 23 22 2 74 16 1 3.3
Congo 51 5 2007 66 43 70 46 30 33 5 70 23 3 3.0
Costa Rica 41 6 2006 96 69 94 90 65 99 28 94 93 26 0.2
Côte d'Ivoire 51 5 2008 69 42 76 52 32 33 2 76 25 2 3.1
Cuba 41 6 2006 95 78 96 92 75 99 44 96 95 42 0.3
Denmark 21 4 2006 97 87 99 96 86 100 76 99 99 75 0.0
Dom.
41 6 2006 54 9 70 37 7 89 1 70 62 1 2.0
Ecuador 41 6 2006 72 28 81 58 22 91 4 81 73 3 1.6
El Salvador 41 6 2006 79 28 76 60 21 97 7 76 74 5 0.8
France 21 4 2006 96 79 98 95 78 100 62 98 98 61 0.0
Gabon 51 5 2006 96 88
80 16 60 48 9 1.5
Georgia 21 4 2006 82 52 95 77 49 100 34 95 94 32 0.2
Germany 21 4 2006 97 89 96 93 85 100 77 96 96 74 0.0
Guatemala 41 6 2006 73 23 65 47 15 93 3 65 60 2 1.4
Hong Kong 21 4 2006 99 94
100 86
0.0
Hungary 21 4 2006 98 88 99 96 87 100 77 99 99 76 0.0
Iceland 21 4 2006 94 75 99 93 74 100 58 99 99 57 0.0
Indonesia 21 4 2006 53 19 80 43 15 96 9 80 76 7 1.0
Iran 21 4 2006 60 32 94 56 30 94 19 94 89 18 0.8
Israel 21 4 2006 85 71 99 84 70 99 60 99 98 60 0.3
Italy 21 4 2006 99 89 100 98 89 100 77 100 100 77 0.0
Kenya 32 6 2007 80 61 73 58 44 80 0* 73 58 0* 2.5*
Kuwait 21 4 2006 26 10 99 26 10 66 5 99 65 5 2.2
Latvia 21 4 2006 99 88 95 94 84 100 75 95 95 71 0.0
Lesotho 32 6 2007 48 22 46 22 10 48 0* 46 22 0* 3.6*
Lithuania 21 4 2006 99 89 98 97 87 100 74 98 98 73 0.0
Luxembourg 21 4 2006 99 91
100 80
0.0
Macedonia 21 4 2006 65 42 97 64 41 95 29 97 93 28 0.8
Madagascar 51 5 2005 79 43 43 34 18 28 0 43 12 0 3.3
Malawi 32 6 2007 27 7 60 16 4 27 0* 60 16 0* 3.7*
Mauritania 51 5 2004 44 26 41 18 11 10 0 41 4 0 3.6
Mauritius 32 6 2007 79 67 97 77 65 79 1* 97 77 1* 1.7*
Mexico 41 6 2006 91 60 92 84 55 99 19 92 90 17 0.5
Moldova 21 4 2006 92 70 96 88 67 100 51 96 96 48 0.1
Morocco 21 4 2006 24 9 76 18 7 63 4 76 48 3 2.3
Mozambique 32 6 2007 57 32 43 24 14 57 0* 43 24 0* 3.3*
Namibia 32 6 2007 61 36 83 51 30 61 0* 83 51 0* 3.4*
Netherlands 21 4 2006 100 93 98 98 92 100 81 98 98 79 0.0
New Zealand 21 4 2006 92 78
100 66
0.2
Nicaragua 41 6 2006 75 24 48 36 12 97 3 48 47 2 1.0
Norway 21 4 2006 93 70 99 92 69 100 49 99 99 49 0.1
Panama 41 6 2006 71 24 85 61 20 95 7 85 81 6 1.0
Paraguay 41 6 2006 78 35 79 61 28 92 5 79 73 4 1.4
Peru 41 6 2006 79 40 83 65 33 95 7 83 79 6 1.0
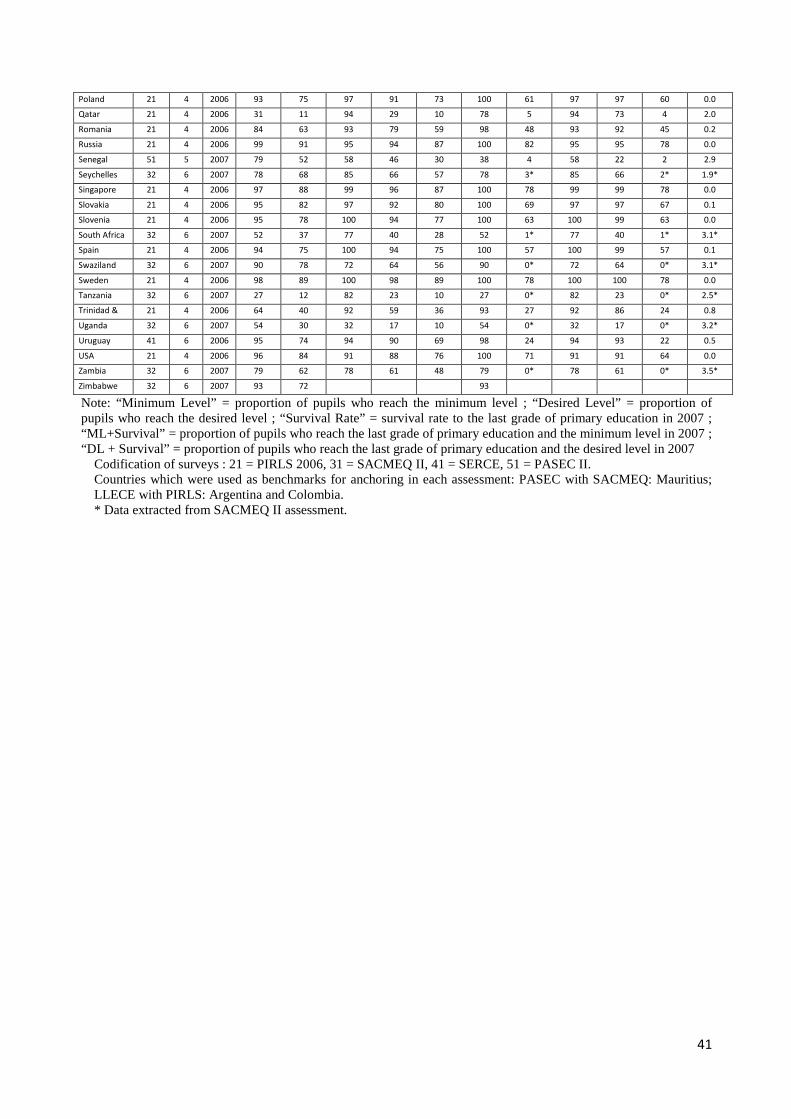
41
Poland 21 4 2006 93 75 97 91 73 100 61 97 97 60 0.0
Qatar 21 4 2006 31 11 94 29 10 78 5 94 73 4 2.0
Romania 21 4 2006 84 63 93 79 59 98 48 93 92 45 0.2
Russia 21 4 2006 99 91 95 94 87 100 82 95 95 78 0.0
Senegal 51 5 2007 79 52 58 46 30 38 4 58 22 2 2.9
Seychelles 32 6 2007 78 68 85 66 57 78 3* 85 66 2* 1.9*
Singapore 21 4 2006 97 88 99 96 87 100 78 99 99 78 0.0
Slovakia 21 4 2006 95 82 97 92 80 100 69 97 97 67 0.1
Slovenia 21 4 2006 95 78 100 94 77 100 63 100 99 63 0.0
South Africa 32 6 2007 52 37 77 40 28 52 1* 77 40 1* 3.1*
Spain 21 4 2006 94 75 100 94 75 100 57 100 99 57 0.1
Swaziland 32 6 2007 90 78 72 64 56 90 0* 72 64 0* 3.1*
Sweden 21 4 2006 98 89 100 98 89 100 78 100 100 78 0.0
Tanzania 32 6 2007 27 12 82 23 10 27 0* 82 23 0* 2.5*
Trinidad &
21 4 2006 64 40 92 59 36 93 27 92 86 24 0.8
Uganda 32 6 2007 54 30 32 17 10 54 0* 32 17 0* 3.2*
Uruguay 41 6 2006 95 74 94 90 69 98 24 94 93 22 0.5
USA 21 4 2006 96 84 91 88 76 100 71 91 91 64 0.0
Zambia 32 6 2007 79 62 78 61 48 79 0* 78 61 0* 3.5*
Zimbabwe 32 6 2007 93 72
93
Note: “Minimum Level” = proportion of pupils who reach the minimum level ; “Desired Level” = proportion of pupils who reach the desired level ; “Survival Rate” = survival rate to the last grade of primary education in 2007 ; “ML+Survival” = proportion of pupils who reach the last grade of primary education and the minimum level in 2007 ; “DL + Survival” = proportion of pupils who reach the last grade of primary education and the desired level in 2007
Codification of surveys : 21 = PIRLS 2006, 31 = SACMEQ II, 41 = SERCE, 51 = PASEC II. Countries which were used as benchmarks for anchoring in each assessment: PASEC with SACMEQ: Mauritius; LLECE with PIRLS: Argentina and Colombia. * Data extracted from SACMEQ II assessment.

42
Table A.4. Results for Science, Adjusted International Database (41 Countries)
Country
Survey
Grade
Year
Original Data Adjusted Data % of pupils in bottom
25%
Minimum level
Desired Level
Survival Rate
ML+Survival
DL+Survival
Minimum level
Desired Level
Survival Rate
ML+Survival
DL+Survival
Algeria 13 4 2007 31 11 93 29 10 65 23 93 60 22 6.1
Argentina 41 6 2006 88 52 96 84 50 87 34 96 83 33 4.1
Armenia 13 4 2007 76 54 98 75 52 94 70 98 92 69 2.0
Australia 13 4 2007 94 79 99 91 0.5
Austria 13 4 2007 95 79 97 92 77 100 91 97 97 89 0.4
Colombia 41 6 2006 86 40 85 73 34 92 40 85 79 34 3.5
Cuba 41 6 2006 95 78 96 92 75 98 81 96 95 78 0.9
CzechRep. 13 4 2007 94 75 99 93 74 99 90 99 98 89 0.4
Denmark 13 4 2007 94 75 99 93 75 99 90 99 98 89 0.5
Dom. Rep. 41 6 2006 54 9 70 37 7 72 9 70 50 6 7.2
El Salvador 41 6 2006 79 28 76 60 21 88 26 76 67 20 4.4
Georgia 13 4 2007 59 26 95 56 25 89 48 95 84 45 3.2
Germany 13 4 2007 95 79 96 91 76 99 92 96 95 88 0.3
Hong Kong 13 4 2007 98 91 100 97 0.1
Hungary 13 4 2007 94 81 99 93 79 99 91 99 98 90 0.4
Iran 13 4 2007 66 38 94 62 35 88 57 94 83 54 2.3
Italy 13 4 2007 96 81 100 95 80 100 92 100 99 92 0.3
Japan 13 4 2007 98 89 100 98 89 100 96 100 100 96 0.1
Kazakhstan 13 4 2007 96 81 99 96 81 100 93 99 99 92 0.3
Kuwait 13 4 2007 36 16 99 35 15 60 29 99 59 28 5.9
Latvia 13 4 2007 98 87 95 93 83 100 97 95 95 92 0.1
Lithuania 13 4 2007 96 77 98 94 76 100 92 98 98 90 0.2
Mongolia 13 4 2007 63 29 94 59 27 89 53 94 84 50 3.2
Morocco 13 4 2007 20 8 76 15 6 41 15 76 31 11 7.7
Netherlands 13 4 2007 98 83 98 97 82 100 96 98 98 95 0.1
New Zealand 13 4 2007 87 67 98 83 0.9
Norway 13 4 2007 85 56 99 84 56 98 77 99 97 76 1.1
Panama 41 6 2006 71 24 85 61 20 84 26 85 72 22 4.8
Paraguay 41 6 2006 78 35 79 61 28 83 25 79 66 19 5.0
Peru 41 6 2006 79 40 83 65 33 82 23 83 68 19 5.1
Qatar 13 4 2007 21 8 94 20 7 42 17 94 39 16 7.2
Russia 13 4 2007 96 85 95 92 81 100 94 95 95 89 0.2
Singapore 13 4 2007 97 90 99 96 89 100 95 99 99 94 0.3
Slovakia 13 4 2007 93 78 97 90 76 98 90 97 96 88 0.4
Slovenia 13 4 2007 94 77 100 93 76 99 90 100 99 89 0.4
Sweden 13 4 2007 95 79 100 95 78 100 91 100 99 91 0.3
Tunisia 13 4 2007 31 14 94 29 13 53 25 94 49 24 6.0
Ukraine 13 4 2007 83 55 97 80 53 97 75 97 94 73 1.1
Uruguay 41 6 2006 95 74 94 90 69 94 54 94 89 51 2.9
USA 13 4 2007 95 81 91 86 74 99 92 91 90 84 0.4
Yemen 13 4 2007 7 2 59 4 1 16 5 59 10 3 8.8
Note: “Minimum Level” = proportion of pupils who reach the minimum level ; “Desired Level” = proportion of pupils who reach the desired level ; “Survival Rate” = survival rate to the last grade of primary education in 2007 ; “ML+Survival” = proportion of pupils who reach the last grade of primary education and the minimum level in 2007 ; “DL + Survival” = proportion of pupils who reach the last grade of primary education and the desired level in 2007
Codification of surveys : 13 = TIMSS 2007, 31 = SACMEQ II, 41 = SERCE, 51 = PASEC II. Countries which were used as benchmarks for anchoring in each assessment: LLECE with TIMSS: Colombia and El Salvador.