a neural network measurement of relative military security the case of greece and cyprus
TRANSCRIPT

MPRAMunich Personal RePEc Archive
A Neural Network Measurement ofRelative Military Security: The Case ofGreece and Cyprus
Andreas S. Andreou and George A. Zombanakis
University of Cyprus, Bank of Greece
2001
Online at http://mpra.ub.uni-muenchen.de/14539/MPRA Paper No. 14539, posted 9. April 2009 06:44 UTC

A Neural Network Measurement of Relative Military Security
The Case of Greece and Cyprus
Andreou A. S.1 and Zombanakis G. A.2, *
1 University of Cyprus, Dept. of Computer Science, 75 Kallipoleos str.,
P.O.Box 20537, CY1678 Nicosia, Cyprus, tel.: +357 2 892230,
fax: +357 2 339062, e-mail: [email protected]
2 Bank of Greece, Research Dept., 21 Panepistimiou str., Athens 10250, Greece,
tel.:+01 3235809, fax: +01 3233025, e-mail: [email protected]
* Corresponding author. We are indebted to Professor Keith Hartley for his valuable assistance and to an anonymous referee for helpful comments. The views presented in this paper are strictly personal.
1

Abstract
This paper aims at introducing a relative security measure, applicable to evaluating the
impact of arms races on the military security of allies. This measure is based on
demographic criteria, which play a dominant role in a number of arms races involving
military alliances. The case of Greece and Cyprus, on one hand, and Turkey on the other,
is the one to which our relative security measure is applied and tested. Artificial neural
networks were trained to forecast the future behaviour of relative security. The high
forecasting performance permitted the application of alternative scenarios for predicting
the impact of the Greek - Turkish arms race on the relative security of the Greek - Cypriot
alliance.
JEL codes: C45, H56
Keywords: Arms Race, Neural Networks, Relative Military Security
2

1. INTRODUCTION
The Greek - Cypriot Integrated Defence Space Doctrine has been regarded by the
two parties involved as a strategy aiming at facing potential offensive action by Turkey
against either of the two allies, with particular emphasis on the protection of their national
interests in the Aegean Sea theatre. This paper does not aspire to criticise the effectiveness
or otherwise of such a doctrine, since an attempt of this kind would touch upon sensitive
issues requiring the use of classified information over and above the needs of scientific
research. What one can certainly do, however, is attract the reader’s attention to certain
related issues, which may contribute to drawing a number of conclusions regarding the
usefulness or otherwise of similar strategies, in view of the latest developments
concerning the relations of the three countries involved.
These conclusions refer to the extent to which the security of the two allies in the
area is promoted given the arms race which has long been going on between Greece and
Turkey (Kollias and Makrydakis 1997). Whereas the impact of an arms race on the
economy of the countries involved in it has been extensively dealt within the literature
(Balfoussias and Stavrinos 1996; Ozmucur 1996; Kollias 1997), research referring to the
consequences of arms races upon the security of the sides involved leaves a great deal to
contribute on the issue. To forecast the impact of this arms race on the security of Greece
and Cyprus we resort to using artificial neural networks, with all advantages a data driven
approach may entail, given the complexity of the models employed by the theory of
alliances and the contradictory empirical results (Hartley and Sandler 1995), as well as the
limited theoretical background covering the concept of relative security in similar cases.
3

The technical support concerning the structure and training of the networks used is
given in section 3, after the theoretical background, along with a description of the input
variables and a brief review of the relevant literature have been presented in section 2. The
forecasting results of the relative security factor, as well as a presentation and analysis of
various alternative scenarios concerning arms race tactics between the countries involved
are reported in section 4. Finally, section 5 sums up and concludes the findings of this
paper.
2. LITERATURE OVERVIEW AND THEORETICAL BACKGROUND
The topic of arms races in its general context has been a rather popular issue,
which was thoroughly investigated in the literature (e.g. Richardson 1960; Intriligator
1982; Isard and Anderton 1985 and 1988). Concerning the specific arms - race case
between Greece and Turkey, earlier research has concluded that the pressure on the Greek
economy resulting from this arms race is determined chiefly by demographic factors
strongly favouring the Turkish side, while the estimation of input significance has
indicated that the leading determinants of such a race describe the Turkish rather than the
Greek economic and demographic environment (Andreou and Zombanakis 2000). Having
established the above framework for the arms race between Greece and Turkey, we now
proceed to investigate the extent to which its impact on the sides involved may be
described by introducing a more specific and accurate measure compared to the
hypothetical figures of a payoff matrix in the context of a game theory exercise (e.g.
Wagner 1983). Such a measure requires defining a Relative Security (RS) coefficient,
4

tailored to fit the environment of such a conflict involving Greece and Cyprus on one hand
and Turkey on another. Ayanian (1994) has already employed such a security coefficient
aiming at explaining exchange-rate fluctuations better than conventional macroeconomic
variables. Combining Ayanian's reasoning on the subject together with our earlier
conclusions regarding the leading role of population developments in the Greek - Turkish
arms race, we have proceeded to determining an RS coefficient. This coefficient is
suitable to use when measuring the impact of the Greek - Turkish arms race on the
security of the two allies, namely Greece and Cyprus.
Following Ayanian (1994), we define the security of Greece and that of Cyprus in
the context of an Integrated Defence Space Doctrine scenario as follows:
SG = (1/ k) * [(FG + FC) / FTG] (1)
and
SC = (1/ k) * [(FG + FC) / FTC] (2)
where SG is the military security of Greece
SC is the military security of Cyprus
FG is total Greek defence forces
FC is total Cypriot defence forces
FTG is Turkish forces potentially directed against Greece
FTC is Turkish forces potentially directed against Cyprus
k is the probability of a conflict between the sides involved
5

The measure of the relative security of Cyprus with reference to Greece RSCG,
which is the quintessence of the Integrated Defence Space Doctrine between Greece and
Cyprus, is defined as the ratio of (2) over (1):
RSCG = [FTG / FTC] (3)
Turkish forces potentially directed against Greece and Cyprus can be considered as an
increasing function of the relative population growth rates between Turkey on one hand
and each of the two allies on the other. This specification is based on the conclusion drawn
in the literature, as mentioned earlier on in this section, referring to the dominance of
human resources over financial resources in determining the defence burden on the Greek
economy as a result of the ongoing arms race with Turkey1. Thus, the corresponding
relationships for the two allies, Greece and Cyprus, may be stated as follows:
( )[ ]TGTTG p/pexpFF &&= (4)
and
( )[ ]TCTTC p/pexpFF &&= (5)
where FT stands for the total of Turkish armed forces and , , denote the
respective population growth rates for Greece, Cyprus and Turkey. The interpretation of
(4) and (5) requires special attention due to the asymmetric effect of the variables
involved: Thus, in a purely hypothetical case which would involve a faster growth of the
Gp& Cp& Tp&
1Indeed, any variable which represents or includes developments in human resources in the countries involved may be suitable. Since, however, population developments are decisive in affecting most of the human resource variables, we feel that their role must be acknowledged as leading. The use of population growth rates rather than the corresponding levels aims at stressing the dynamic character of the relative security measure proposed.
6

Greek or Cypriot population compared to that of Turkey, one may argue that this
difference in the population rates involved may be considered as representing a potential
threat to Turkey, which would, therefore, be compelled to channel more forces to face
those of the two allies2. However, where the Turkish population exhibits a faster rate of
growth compared to that of Greece or Cyprus, which has always been the case, this will
allow Turkey to increase FT, which is the total Turkish forces, and provide for an increase
of the forces facing Greece and Cyprus, thus offsetting the effect caused due to the
reduction of the exponent.
Substituting the equivalent of FTG and FTC from (4) and (5) in (3) we come up with the
following Relative Security (RS) measure between Greece and Cyprus:
RSCG = exp[x] (6)
where ( ) TCG p/p-px &&&= (7)
Equation (6) interpreted together with (7) show how the population rates of growth of the
three countries involved are expected to affect the relative security of Cyprus with
reference to Greece, as this is measured by RSCG. More specifically, for an increase of this
index as given by (6), x at time t2 must be higher than x at an earlier period t1 (t1 and t2
represent years in our case). In terms of (7), therefore, x1 < x2 , or:
< ( ) )1(p/)1(p-(1)p TCG &&& ( ) )2(p/)2(p-(2)p TCG &&& (7a)
2 Such extreme scenarios aim at just facilitating the interpretation of this relative security measure and must not be considered as reflecting reality by any means.
7

Bearing in mind that RSCG as it is expressed by (6) and (7) measures the relative security
of Cyprus, it is evident that (7a) holds true in the following three cases:
a. If , holding and constant, as shown by)2(p)1(p TT && > Gp& Cp& equations (6) and (7).
b. If , holding and constant, since F)2(p)1(p CC && > Gp& Tp& TC in equation (5) will fall.
c. If , holding and constant, since F)2(p)1(p GG && < Cp& Tp& TG in equation (4) will rise,
meaning that Turkish forces are expected to move towards Greece and away from
Cyprus. This case underlines the importance of the Greek support in the Greek –
Cypriot alliance, in the context of which, all population growth rates not included in
one of the above cases entail a decline of the RSCG, indicating a reduction of the
relative security of Cyprus3.
d. If all rates fluctuate, the direction of change of the RS will depend on the outcome of
equation (7a), that is, RS will rise if the second term of (7a) is greater than the first.
It is now evident that this relative security measure can be used to provide for a much
more precise strategy payoff measure compared to the hypothetical payoffs used in the
literature, as we indicated earlier in this section. Indeed, if the percentage changes
included in the exponent of (6) are instead denoted as logarithmic first differences, then
the exponent x of the relative security measure RSCG in (7) may be expressed as follows:
x = [ ln ( PG / PG(-1) ) - ln ( PC / PC(-1) ) ] / [ ln ( PT / PT(-1) ) ] (8)
where PG, PC and PT stand for the populations of Greece, Cyprus and Turkey respectively.
3 We are thankful to an anonymous referee and to professor A. Bountis of the University of Patras, Greece, for their contribution to our analysis on this issue.
8

Denoting by g, c, and t the corresponding Greek, Cypriot and Turkish population
increases, as given in (8) above, i.e:
g = ln ( PG / PG(-1) ) (9)
c = ln ( PC / PC(-1) ) (10)
t = ln ( PT / PT(-1) ) (11)
then, following Chiang (1984), x represents the algebraic solution of the following
equation:
c * tx - g = 0 (12)
It is evident, therefore, that (12) provides the necessary theoretical framework within
which a relative security coefficient may be developed and used to quantify the impact of
the various strategies selected by the sides involved in an arms race.
The benefits of introducing such a measure and applying it using neural networks
are clear:
a. It provides for a means to measure the impact of an arms race on the security of
the allies involved in a much more specific way compared to the arbitrary payoffs found in
the literature so far. Using, therefore, the relative security coefficient described in this
paper, one may proceed to cardinal measurement comparisons among various arms race
scenarios, thus drawing useful conclusions on the impact of such a race on the member
states of an alliance.
b. This Relative Security coefficient, by emphasising the role of demographic
variables, is tailored to fit the case of specific categories of arms races, in which human
resources play a dominant role, such as the one between Greece and Turkey.
9

It is important to remember, however, that the application of this relative security
coefficient is not necessarily confined to cases of two - member alliances. In fact, the
number of the member countries in an alliance does not impose any constraint, as long as
one focuses on the relative security involving pairs of member countries each time, facing
a common threat.
The relative security coefficient for the Greek - Cypriot alliance thus established
represents the output of our network algorithm, using as input some of the leading
determinants of the Greek - Turkish arms race (Stavrinos and Zombanakis 1998; Andreou
and Zombanakis 2000), as well as the top performing variables during preliminary input
significance exercises (Table 1). The input variables thus selected are the GDP as well as
its share representing defence expenditure of the three countries involved. In addition, the
GDP share of the non - defence spending in Greece and Cyprus have been employed in
order to introduce the opportunity cost of defence and thus the dimension of the peace
dividend in the analysis.
3. TECHNICAL BACKGROUND
This section is devoted to present briefly the methodology of artificial neural
networks. By using this data driven approach in forecasting the impact of the arms race on
the security of the allies, one may avoid the complications arising due to the use of
intricate models involving non-linearities, where, for example, the empirical results are
occasionally contradictory. This approach is based on developing a “machine” composed
of a number of basic computational elements called neurons, connected to each other
10

forming layers. A network is trained through general-purpose algorithms based on
available data. The problem is reduced to the computation of weight neuron connections
in a feed-forward network to accomplish a desired input-output mapping. The learning
phase can be viewed as a high dimensional, non-linear, system identification problem. In a
feed-forward Multi-Layer Perceptron (MLP) links from each neuron in the kth layer are
being directed to each neuron in the (k+1)th layer. Inputs from the environment enter the
first layer and outputs from the network are manifested at the last layer (Azoff 1994;
Andreou and Zombanakis 2000).
The core architecture of our networks is the feed-forward MLP described above.
Variations of this scheme were employed, such as the m-d-1 and m-d1-d2-1 topologies (m
input nodes, one and two hidden layers respectively and one output) and a Multiply
Activated (MA) one. The latter uses one hidden layer partitioned into three parallel sub-
layers activated by a different function (Figure 1). All networks developed have one
output neuron, which yields the next sample (predicted value) in the time sequence. The
training algorithm used is the well-known Error Back Propagation with a momentum term
(e.g. Rumelhart and McLelland 1986; Azoff 1994). The networks are trained to learn and
then predict the behaviour of the time-series presented in specific patterns of data.
Detailed information regarding architectural and learning parameters can be found in the
Appendix (A.1).
The networks used in the present paper were divided into three categories: The
first one employs MLPs with a single hidden layer (category A), the second one includes
MLPs with two successive hidden layers (category B) and the last one involves the
11
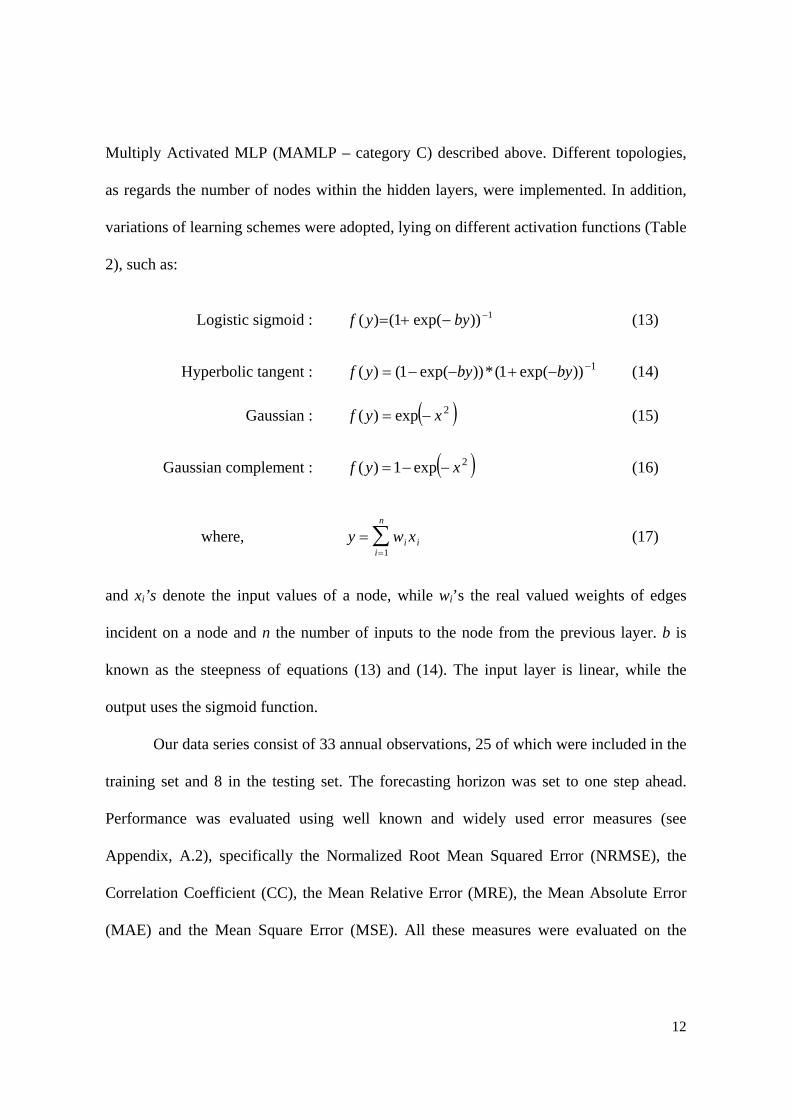
Multiply Activated MLP (MAMLP – category C) described above. Different topologies,
as regards the number of nodes within the hidden layers, were implemented. In addition,
variations of learning schemes were adopted, lying on different activation functions (Table
2), such as:
Logistic sigmoid : (13) f y by( ) ( exp( ))= + − −1 1
Hyperbolic tangent : (14) 1))exp(1(*))exp(1()( −−+−−= bybyyf
Gaussian : ( )2exp)( xyf −= (15)
Gaussian complement : ( )2exp1)( xyf −−= (16)
where, (17) y wi ii
n
==∑
1x
and xi’s denote the input values of a node, while wi’s the real valued weights of edges
incident on a node and n the number of inputs to the node from the previous layer. b is
known as the steepness of equations (13) and (14). The input layer is linear, while the
output uses the sigmoid function.
Our data series consist of 33 annual observations, 25 of which were included in the
training set and 8 in the testing set. The forecasting horizon was set to one step ahead.
Performance was evaluated using well known and widely used error measures (see
Appendix, A.2), specifically the Normalized Root Mean Squared Error (NRMSE), the
Correlation Coefficient (CC), the Mean Relative Error (MRE), the Mean Absolute Error
(MAE) and the Mean Square Error (MSE). All these measures were evaluated on the
12

testing set of data, that is, a set of pattern values that did not participate during the course
of learning.
An important aspect examined in the present analysis is the determination of the
significance ordering of the variables involved, that is, the selection of the variables that
contribute more to the forecasting process. This task can be performed using the notions of
input sensitivity analysis, described extensively in Refenes et. al. (1995) and Azoff (1994),
based on which one can sum up the absolute values of the weights fanning from each input
variable into all nodes in the successive hidden layer, thus estimating the overall
connection strength of this variable. The input variables that have the highest connection
strength can then be considered as most significant, in the sense of affecting the course of
forecasting in a more pronounced way compared to others. Presenting the analytical
technical background behind these notions is beyond the scope of this work, since the
reader may refer to the sources stated above for further information.
4. POLICY SIMULATIONS
The RS coefficient seems to be quite successful in predicting the impact on the
relative security of Cyprus with reference to Greece, in the context of an arms race
between the two allies on one hand and Turkey on the other, using the input variables
described earlier. As indicated in Table 3, the error figures during the training phase reveal
a very satisfactory performance. In general, performance after training was very successful
as indicated by the Correlation Coefficient (CC), while the Normalised Root Mean
Squared Error (NRMSE) indicates that predictions were by far better than the simple mean
13

forecaster (NRMSE equal to 1). The deviation between actual and predicted samples, as
indicated on the basis of the Mean Relative Error (MRE), the Mean Absolute Error (MAE)
and the Mean Square Error (MSE) is negligible. As a result, the ability of the networks to
generalise the knowledge embodied through the learning process during the testing phase
is considerably high, as assessed on the basis of the corresponding errors for the out-of-
sample data.
More specifically, the forecasting performance during the testing phase is quite successful
in CC terms, which in certain networks, like C(2), C(3) and C(4) reached an approximate
84-89% follow up of the original series. Regarding prediction accuracy, the MSE, MRE
and MAE error indicators exhibit low values in all networks, while the NRMSE figures
indicate a slightly inferior behaviour compared to a simple mean predictor in most of the
cases, with the exception of A(2) and all networks constituting the C category. The
network that yields the most accurate predictions regarding all error measures used is C(2)
(Figure 2), while the predictions of the rest C-category networks are also quite
satisfactory. Finally, concerning the rest two network categories, only one network,
namely A(2) presented a forecasting performance which can be considered as equally
successful.
Before we move to examining how the relative security of the two allies may be
affected in the context of alternative arms race scenarios, we turn to investigate the leading
determinants of the relative security between Cyprus and Greece, facing the possibility of
a Turkish threat. Input sensitivity analysis was performed for all networks used, following
the learning phase, with the summation of weights corresponding to each input node
14

(variable) presented in Table 4 in descending order. The findings of our experiments seem
to be very much in line with earlier research on this topic (Andreou and Zombanakis
2000). Indeed, all experiments agree that the share of defence in the GDP of Turkey is
clearly the top determinant of the Greek - Cypriot relative security. In most cases the
Greek and Cypriot GDP shares of non - defence expenditure are the next two most
important determinants of the relative security between the two allies. This finding
underlines the importance of the trade - off between defence and non - defence spending
and the extent to which the sacrifice of the peace dividend as a result of this specific arms
race is too important to be overlooked, a conclusion which seems to agree with most of the
literature (e.g. Hartley and Hooper 1990; Gleditsch et al. 1996).
Having identified the leading determinants of the relative security of the two allies
with reference to Turkey, we may now proceed to study the simulation results of the
networks forecasts of our relative security measure in the context of various arms race
scenarios. The forecasting horizon included in the testing phase of the networks reaches
the year 2002 and the results obtained confirm the findings of the literature on arms races
and the various strategy payoffs (e.g. Wolfson 1985). The advantage of our method,
however, lies with the possibility offered to substitute measurable payoffs for
hypothetical, arbitrary values, thus obtaining a more meaningful cardinal measurement of
the results of an arms race in the context of the Integrated Defence Space Doctrine. The
scenarios selected are the usual ones involved in a typical arms race examined via game
theory, or in the context of the “prisoner’s dilemma” (e.g. Majeski 1984). We assign,
therefore, increasing or decreasing future values to the GDP shares of defence expenditure
15
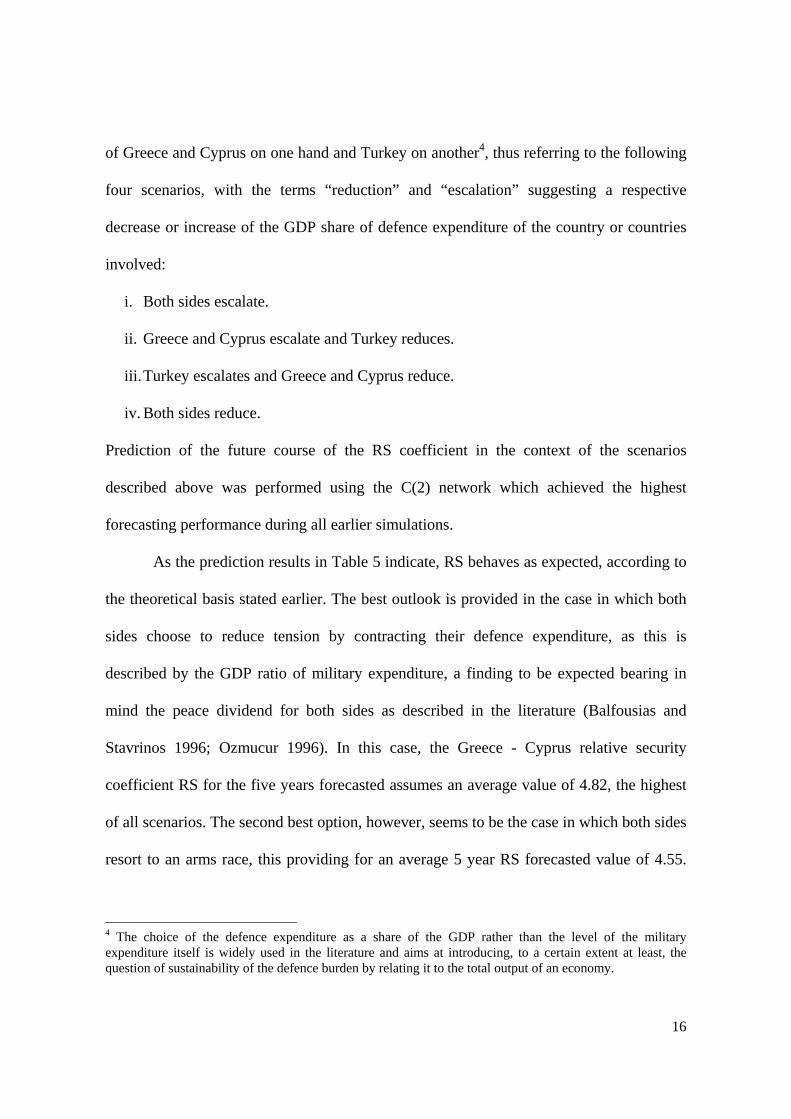
of Greece and Cyprus on one hand and Turkey on another4, thus referring to the following
four scenarios, with the terms “reduction” and “escalation” suggesting a respective
decrease or increase of the GDP share of defence expenditure of the country or countries
involved:
i. Both sides escalate.
ii. Greece and Cyprus escalate and Turkey reduces.
iii. Turkey escalates and Greece and Cyprus reduce.
iv. Both sides reduce.
Prediction of the future course of the RS coefficient in the context of the scenarios
described above was performed using the C(2) network which achieved the highest
forecasting performance during all earlier simulations.
As the prediction results in Table 5 indicate, RS behaves as expected, according to
the theoretical basis stated earlier. The best outlook is provided in the case in which both
sides choose to reduce tension by contracting their defence expenditure, as this is
described by the GDP ratio of military expenditure, a finding to be expected bearing in
mind the peace dividend for both sides as described in the literature (Balfousias and
Stavrinos 1996; Ozmucur 1996). In this case, the Greece - Cyprus relative security
coefficient RS for the five years forecasted assumes an average value of 4.82, the highest
of all scenarios. The second best option, however, seems to be the case in which both sides
resort to an arms race, this providing for an average 5 year RS forecasted value of 4.55.
4 The choice of the defence expenditure as a share of the GDP rather than the level of the military expenditure itself is widely used in the literature and aims at introducing, to a certain extent at least, the question of sustainability of the defence burden by relating it to the total output of an economy.
16

The advocates of the “si vis pacem para bellum”5 doctrine, however, will be delighted to
observe that the year 2002 value of the RS coefficient in this scenario is practically equal
to the corresponding value of the case in which both sides select the reduced defence
spending policy. This finding is very interesting, since it underlines the importance of the
arms race on the security of the alliance members. The cases in which one of the two
parties emphasises military spending, while the other reduces, also appear to be very
interesting. Indeed, the average RS value for the five - year period forecasted is 2.93 in the
case in which Greece and Cyprus increase their GDP share of defence expenditure, while
Turkey reduces it. This conclusion is very much in line with both the established
theoretical framework (e.g. Hartley and Sandler 1995), as well as elementary reasoning,
given that the RS reflects the relative security of the Greek - Cypriot side. It is also
interesting to point out that the RS figures in all scenarios increase together with the time
horizon, with the exception of those derived in the fourth scenario, namely the one in
which Turkey escalates while Greece and Cyprus limit their defence expenditure. In this
case the average of the RS figures, which decline with time up to 2002, does not exceed
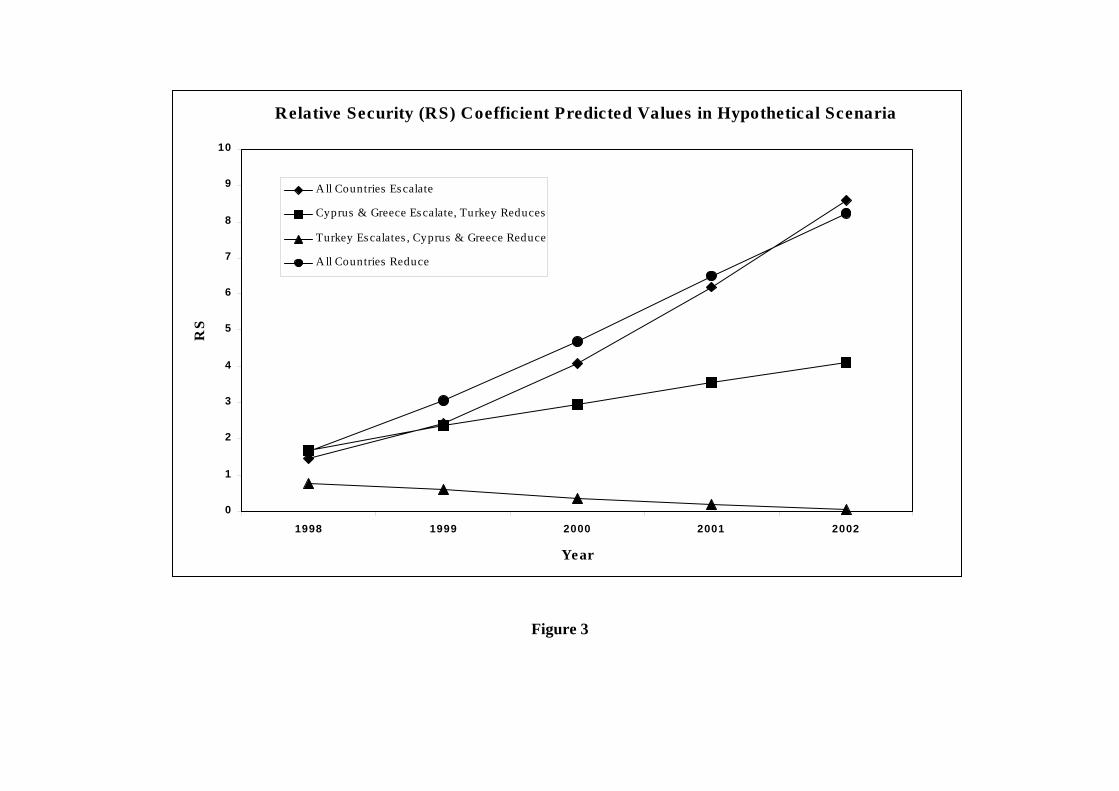
0.4, a very low value for the security of the two allies, as expected. The graphical
description of the results referring to all four scenaria as discussed above is shown in
Figure 3.
5. CONCLUSIONS
The aim of this paper has been to contribute to the cardinal measurement of an arms
race impact upon the security of two allies involved in such a race against a potential
5 The Latin for “if you want peace prepare for war”
17

adversary. The analysis refers to the co-operation between Greece and Cyprus in the area
of national security, something that has already been materialised in the context of the so-
called Integrated Defence Space Doctrine. Our efforts have focused on supplementing the
available literature on arms races by suggesting the introduction of a payoff relative
security coefficient, emphasising the dominant role of human resources in this case and
measuring the impact on the military security of the two allies as a result of an arms race
against a third party, namely Turkey.
The main conclusion drawn after a variety of scenarios have been tried is that the
short and medium term relative security of Cyprus and Greece is maximised when both
sides involved in the arms race reduce their defence expenditures, while the arms race
scenario appears as a second-best choice. When it comes to the long-run, however, it is
interesting to see that the Greece-Cyprus relative security index assumes its maximum
value in the context of an arms race between Greece and Cyprus on one hand and Turkey
on the other. This finding supports the view of those who believe that despite the peace
dividend (Balfousias and Stavrinos 1996), Greece has no choice but to follow up the
ambitious 25-year Turkish armaments programme. Finally, the results of the “Turkey
escalates-Cyprus and Greece reduce” scenario are discouraging due to their lowest relative
security values and, consequently, their poor contribution to peace promotion, something
that must be taken to consideration by the one - sided disarmament policy followers.
18

REFERENCES
Andreou, A.S. and Zombanakis, G.A. (2000) Financial Versus Human Resources in the
Greek-Turkish Arms Race. A Forecasting Investigation Using Artificial Neural
Networks. Defence and Peace Economics, 4, 403-426.
Ayanian R. (1994) The Real Exchange Rate Enigma: A Safe Haven Solution From the
Cold War Era. Defence and Peace Economics 5, 51-65.
Azoff, E.M. (1994) Neural Network Time Series Forecasting of Financial Markets.
John Wiley & Sons, N.Y.
Balfoussias, A. and Stavrinos, V. (1996) The Greek Military Sector and
Macroeconomic Effects of Military Spending in Greece, in N.P. Gleditsch, O.
Bjerkholt, A. Cappelen, R.P.Smith and J.P. Dunne (eds.) The Peace Dividend, North
Holland.
Chiang, A. (1984) Fundamental Methods of Mathematical Economics. Mc Graw-Hill,
Tokyo.
Gleditsch, N.P., Bjerkholt, O., Cappelen, A., Smith, R.P. and Dunne, J.P. (eds.) (1996)
The Peace Dividend. North Holland.
Hartley, K. and Hooper, N. (1990) The Economics of Defense, Disarmament and Peace:
An Annotated Bibliography. Aldershot & Brookfield, VT: Elgar.
Hartley, K. and Sandler, T. (1995) The Economics of Defence. Cambridge University
Press, U.K.
Intriligator, M. (1982) Research on Conflict Theory. Journal of Conflict Resolution 26,
19
307-327.
Isard, W. and Anderton, C.H. (1985) Arms Race Models: A Survey and Synthesis.
Conflict Management and Peace Science 8, 27-98.
Isard, W. and Anderton, C.H. (1988) A Survey of Arms Race Models, in Isard W. (ed.)
Arms Races, Arms Control and Conflict Analysis, Cambridge University Press, N.Y.
Kollias, C. (1997) Defence Spending and Growth in Turkey 1954-1993: A Causal
Analysis. Defence and Peace Economics 8, 189-204.
Kollias, C. and Makrydakis, S. (1997) Is There A Greek-Turkish Arms Race? Evidence
from Cointegration and Causality Tests. Defence and Peace Economics 8, 355-379.
Majeski, S.J. (1984) Arms Races as Iterated Prisoner’s Dilemma Games. Mathematical
Social Sciences 7, 253-266.
Ozmucur, S. (1996) The Peace Dividend in Turkey, in N.P. Gleditsch, O. Bjerkholt, A.
Cappelen, R.P. Smith and J.P. Dunne (eds.) The Peace Dividend. North Holland.
Refenes, A.N., Kollias, C. and Zarpanis, A. (1995) External Security Determinants of
Greek Military Expenditure: An Empirical Investigation Using Neural Networks.
Defence and Peace Economics 6, 27-41.
Richardson, L.F. (1960) Arms and Insecurity: A Mathematical Study of the Causes and
Origins of War. Homewood, Pittsburgh, PA.
Rumelhart, D.E. and McLelland, J. (1986) Parallel Distributed Processing. Cambridge,
MA, MIT Press.
Stavrinos, V.G. and Zombanakis, G.A. (1998) The Vicious Cycle of the Foreign
Military Debt. European Research Studies 1(1), 5-26.
20

Wagner, R.H. (1983) The Theory of Games and the Problem of International
Cooperation. American Political Science Review 77, 330-346.
Wolfson, M. (1985) Notes on Economic Warfare. Conflict Management and Peace
Science 8, 1-20.
21

TABLES
Table 1: Variables, Data and Sources
Code Data Series Source
GGDPCS GDP of Greece, Constant Prices Greek National Accounts
CGDPCS GDP of Cyprus, Constant Prices Cypriot National Accounts
TGDPCS GDP of Turkey, Constant Prices International Financial Statistics, IMF
GDEFCRS Defence Expenditure of Greece (share of GDP)
SIPRI
CDEFCRS Defence Expenditure of Cyprus (share of GDP)
SIPRI
TDEFCRS Defence Expenditure of Turkey (share of GDP)
SIPRI
GNDEFCRS Non-Defence Expenditure of Greece (share of GDP)
Greek National Accounts
CNDEFCRS Non-Defence Expenditure of Cyprus (share of GDP)
Cypriot National Accounts

Table 2: Neural network architectures, activation functions and encoding.
Network
Architecture*
Hidden Layer(s) Activation Function(s)
Code
8-10-1 Logistic sigmoid A(1)
8-10-1 Hyberbolic tangent A(2)
8-14-1 Logistic sigmoid A(3)
8-14-1 Hyberbolic tangent A(4)
8-10-5-1 Logistic sigmoid B(1)
8-10-5-1 Hyberbolic tangent B(2)
8-15-8-1 Logistic sigmoid B(3)
8-15-8-1 Hyberbolic tangent B(4)
8-3-3-3-1 1st slab: Gaussian, 2nd slab: Hyberbolic tangent; 3rd slab: Gaussian complementary
C(1)
8-3-3-3-1 1st slab: Gaussian, 2nd slab: Gaussian complementary; 3rd slab: Hyberbolic tangent
C(2)
8-3-5-8-1 1st slab: Gaussian, 2nd slab: Hyberbolic tangent; 3rd slab: Gaussian complementary
C(3)
8-3-5-8-1 1st slab: Gaussian, 2nd slab: Gaussian complementary; 3rd slab: Hyberbolic tangent
C(4)
* “m-d-n” stands for m input nodes, d nodes in the hidden layer and n output nodes. “m-d-p-n” stands for m input nodes, d nodes in the first hidden layer, p nodes in the
second hidden layer and n output nodes. “m-d-p-k-n” stands for m input nodes, d hidden nodes in the first slab (total hidden
neurons subset) of the hidden layer, p hidden nodes in the second slab, k hidden nodes in the third slab and n output nodes.

Table 3: Forecasting performance and error figures
Network Training Phase Testing Phase
NRMSE MSE CC MRE MAE NRMSE MSE CC MRE MAE
A(1) 0.0613 0.00430 0.9980 0.0642 0.0445 1.0871 0.6909 0.7594 0.4779 0.4453
A(2) 0.0340 0.00130 0.9994 0.0393 0.0258 0.9425 0.5194 0.7526 0.5309 0.4613
A(3) 0.0644 0.00470 0.9978 0.0713 0.0479 1.0683 0.6672 0.7537 0.5006 0.4536
A(4) 0.0354 0.00140 0.9994 0.0372 0.0258 1.0518 0.6467 0.7589 0.4901 0.4523
B(1) 0.0619 0.00430 0.9980 0.0636 0.0426 1.1511 0.7746 0.7604 0.4908 0.4642
B(2) 0.0236 0.00120 0.9994 0.0332 0.0211 1.2462 0.9079 0.7598 0.5322 0.5282
B(3) 0.0738 0.00620 0.9972 0.0800 0.0592 1.1167 0.7290 0.7638 0.4305 0.4115
B(4) 0.0183 0.00030 0.9998 0.0176 0.0124 1.1554 0.7805 0.7588 0.5357 0.5151
C(1) 0.0113 0.00010 0.9999 0.0103 0.0066 0.7650 0.2264 0.8795 0.3689 0.2993
C(2) 0.0070 0.00005 1.0000 0.0057 0.0041 0.6858 0.2183 0.8854 0.3338 0.2217
C(3) 0.0037 0.00001 1.0000 0.0032 0.0025 0.8352 0.3683 0.8486 0.3806 0.4389
C(4) 0.0125 0.00010 0.9999 0.0095 0.0075 0.8511 0.2889 0.8367 0.3785 0.3199

Table 4: Input significance analysis (percentage in parentheses)
Input variables significance ordering (descending) Neural Network 1st 2nd 3rd 4th 5th 6th 7th 8th
TDEFCRS CGDPCS GNDEFCRS GDEFCRS GGDPCS CNDEFCRS TGDPCS CDEFCRSA(1) (24.12) (16.76) (14.08) (11.91) (10.70) (8.76) (7.48) (6.20)
TDEFCRS GNDEFCRS CGDPCS GDEFCRS CDEFCRS CNDEFCRS GGDPCS TGDPCSA(2) (21.65) (17.69) (14.49) (12.56) (11.40) (8.75) (8.33) (5.13)
TDEFCRS GNDEFCRS CGDPCS TGDPCS GDEFCRS CNDEFCRS GGDPCS CDEFCRSA(3) (22.21) (17.49) (15.84) (10.03) (9.33) (8.78) (8.74) (7.58)
TDEFCRS GNDEFCRS TGDPCS CGDPCS GGDPCS GDEFCRS CNDEFCRS CDEFCRSA(4) (23.11) (16.37) (11.52) (11.51) (10.51) (9.99) (8.83) (8.17)
TDEFCRS (CGDPCS GNDEFCRS GGDPCS CNDEFCRS GDEFCRS TGDPCS CDEFCRSB(1) (25.43) (17.56) (13.74) (10.56) (9.65) (9.22) (8.09) (5.75)
TDEFCRS GNDEFCRS CGDPCS GDEFCRS GGDPCS CNDEFCRS CDEFCRS TGDPCSB(2) (22.50) (14.70) (14.26) (12.24) (9.96) (9.25) (8.89) (8.18)
TDEFCRS CGDPCS GNDEFCRS GGDPCS GDEFCRS CNDEFCRS TGDPCS CDEFCRSB(3) (20.51) (19.38) (11.51) (11.35) (10.60) (9.58) (9.37) (7.71)
TDEFCRS GNDEFCRS GDEFCRS CGDPCS GGDPCS CNDEFCRS CDEFCRS TGDPCSB(4) (18.53) (15.19) (13.32) (12.56) (12.50) (11.35) (9.90) (6.66)
TDEFCRS GNDEFCRS GGDPCS GDEFCRS CNDEFCRS CGDPCS CDEFCRS TGDPCSC(1) (25.10) (15.44) (14.11) (13.18) (9.87) (8.98) (7.47) (5.85)
TDEFCRS GNDEFCRS CNDEFCRS CGDPCS GGDPCS GDEFCRS TGDPCS CDEFCRSC(2) (20.67) (19.64) (12.26) (11.26) (10.92) (10.89) (8.20) (6.17)
TDEFCRS GNDEFCRS CNDEFCRS CGDPCS GDEFCRS GGDPCS CDEFCRS TGDPCSC(3) (19.82) (15.41) (12.36) (12.25) (11.71) (10.13) (9.35) (8.97)
TDEFCRS GNDEFCRS CNDEFCRS GDEFCRS CGDPCS GGDPCS TGDPCS CDEFCRSC(4) (19.52) (16.45) (11.99) (11.68) (11.51) (10.35) (10.23) (8.27)

Table 5: Case scenarios predictions on the Relative Security (RS) coefficient
Scenario Year Predicted RS
1998 1.4469
All countries 1999 2.4368
escalate 2000 4.0670
2001 6.1940
2002 8.5902
1998 1.6812
Cyprus and 1999 2.3682
Greece escalate, 2000 2.9593
Turkey reduces 2001 3.5439
2002 4.1159
1998 0.7649
Turkey Escalates, 1999 0.6195
Cyprus and 2000 0.3689
Greece Reduce 2001 0.1808
2002 0.0675
1998 1.6406
All countries 1999 3.0701
reduce 2000 4.6800
2001 6.4924
2002 8.2233

LEGENDS FOR FIGURES
Figure 1: The Multiply Activated Multi-Layer Perceptron (MAMLP) neural network
architecture.
Figure 2: Actual versus predicted values of the Relative Security (RS) coefficient using
an 8-3-3-3-1 MAMLP neural network architecture.
Figure 3: Predicted values of the Relative Security (RS) coefficient for hypothetical
scenaria, using an 8-3-3-3-1 MAMLP neural network architecture.

FIGURES
SLAB 3
Activation 4
SLAB 1
Activation 2
SLAB 2
Activation 3
HIDDEN LAYER
INPUT SLAB
Activation 1
OUTPUT SLAB
Activation 5
Figure 1

Actual vs predicted Relative Security yearly values
0
1
2
3
4
5
6
7
1 6 11 16 21 26 31Sam ple
RS
val
ue
Actual series
Predic ted series
Training period Testing period
Figure 2
Relative Security (RS) Coefficient Predicted Values in Hypothetical Scenaria
0
1
2
3
4
5
6
7
8
9
10
1998 1999 2000 2001 2002
Year
RS
A ll Countries Escalate
Cyprus & Greece Escalate, Turkey Reduces
Turkey Escalates , Cyprus & Greece Reduce
A ll Countries Reduce
Figure 3

APPENDIX
A.1 System design and implementation
The given time series x={x(t): 1 ≤ t≤ N} is divided into two sets: a training set
xtrain={x(t): 1 ≤ t ≤ T}, and a test set xtest={x(t): T < t ≤ N}, where N is the length of the
data series. The training phase presents the xtrain set to the network repeatedly until a
certain level of convergence is achieved based on some error criterion. The learning
algorithm adjusts the weights in each repetition in order to minimize the diversion of the
desired value from the predicted one.
The number of input neurons and the selection of the variables involved have been
based on prior research on the topic, as stated in section 2, which has led to the choice
of the input set which exhibits the highest performance in terms of prediction accuracy.
We used several alternative configuration schemes, as regards the number of hidden
layers and the nodes within each layer, in order, first to achieve best performance and
second, to facilitate comparison between different network architectures (Table 2).
Every input variable is associated with one neuron in the input layer.
Determining the number of hidden layers and neurons in each layer can often be
a very difficult task and possibly one of the major factors influencing the performance
of the network. Too few neurons in a hidden layer may produce bias due to the
constraint of the function space, which results to poor performance as the network
embodies a very small portion of information presented. Too many neurons on the other
hand may cause overfitting of data on one hand and increase considerably the amount of
computational time needed for the network to process data on the other, something that
will not necessarily lead to convergence. We therefore have used a variety of numbers
A1

of neurons within one hidden layer, while in some cases a two-hidden-layer scheme was
also developed in order to investigate whether performance is improved.
The number of iterations (epochs) presenting the whole pattern set during the
learning phase is also very important. We have let this number vary during our
simulations, since different network topologies, initial conditions and input sets, require
different convergence and generalization times. The number of epochs our networks
needed for convergence was 10,000, while the learning and momentum coefficients
(Rumelhart and McLelland 1986; Azoff 1994) were kept constant at the positive values
of 0.3 and 0.1 respectively. One should be very cautious though when using a large
number of epochs, as the network may overfit the data thus failing to generalize. The
problems of bias and data overfitting can be overcome by evaluating the performance of
each network using a testing set of unseen patterns (testing phase). This set does not
participate during the learning process (e.g. Azoff, 1994). If the network has actually
learned the structure of the input series rather than memorizing it then it can perform
well when the testing set is presented. Otherwise, if bias or overfitting is really the case,
performance will be extremely poor on these “new” data values. Architecture selection
is generally based on success during the testing phase, provided that the learning ability
was satisfactory.
A.2 Performance evaluation The CC measures the ability of the predicted samples to follow the upward or
downward jumps of the original series. A CC value near 1 in absolute terms is
interpreted as a perfect follow up of the original series by the forecasted one. A negative
CC sign indicates that the forecasting series follows the same ups or downs of the
A2

original series with a negative mirroring, that is with a 180o rotation about the time-axis.
When the original series moves up, the forecasting moves down at the same time-period
and vice versa.
The NRMSE indicates whether prediction is better than a simple mean forecaster. If
NRMSE=0 then predictions are perfect; NRMSE=1 indicates that prediction is no better
than taking xpred equal to the x-mean.
MRE shows the accuracy of predictions in percentage terms expressing it in a stricter
way, since it focuses on the sample being predicted, not depending on the scale in which
the data values are expressed or on the units of measurement used. Thus, we are able to
estimate prediction error as a fraction of the actual value, this making the MRE the
more objective error measure among the three used.
MSE is reported in order to have the error condition met by the Back Propagation
algorithm, while the MAE shows the divergence between actual and predicted samples
in absolute measures. The above prediction error measures are given by the following
equations:
[ ]NRMSE(n) =
RMSE(n) RMSE(n)
1n
x (i) xact act,ni 1
n 2σ ∆=
−=∑
(18)
where,
[ ]2
1actpred (i)x-(i)x
n1RMSE(n) ∑
=
=n
i (19)
A3

( )( )[ ]( ) ( )
CCx (i) x x (i) x
x (i) x x (i) x
act act,n pred pred,ni 1
n
act act,n2
i 1
n
pred pred,n2
i 1
n=
− −
−⎡
⎣⎢⎢
⎤
⎦⎥⎥
−⎡
⎣⎢⎢
⎤
⎦⎥⎥
=
= =
∑
∑ ∑ (20)
∑=
−n
i 1 act
actpred
(i)x(i)x(i)x
n1=MRE (21)
∑=
−=n
i 1actpred (i)x(i)x
n1MAE (22)
∑=
−=n
i 1
2actpred )(i)x(i)x(
n1MSE (23)
where xact(i) and xpred(i) the actual and predicted value when pattern i is presented,
npred,nact, x,x the mean value of actual and predicted samples of length n
and n is the total number of patterns.
A4