a networked enterprises1.q4cdn.com/535492436/files/doc_downloads/fact_book/textron_fact... ·...
TRANSCRIPT

2001 Fact Book
A Networked Enterprise

Textron is a coordinated network of globally strong businessesand powerful brands in attractive industries. Together, we aretaking strategic steps forward to get closer to our customers,grow our businesses and achieve operational excellence. We leverage the power of our enterprise – 51,000 employeesin 40 countries – to provide our customers with innovativesolutions and services in industries such as aircraft, fasteningsystems, industrial products and components, and finance.
A Networked Enterprise
Finance (page 11)
Industrial Products(pages 8-9)
Industrial Components(page 10)
Financial andCompany Information
(pages 12-17)
Fastening Systems(pages 6-7)
Bell Helicopter(pages 2-3)
Cessna Aircraft(pages 4-5)

Textron Fact Book 1
Fast Facts
Textron’s 2001 Annual Report includes consolidated financial statements that have been prepared in accordance with generally accepted accountingprinciples, with segment information based on the segments that were in place during 2001 (Aircraft, Automotive, Fastening Systems, IndustrialProducts and Finance). In January 2002, Textron reorganized management responsibility for several divisions which were previously reported in theAutomotive and Industrial Products segments into the newly created Industrial Components segment. In addition, management responsibility forLycoming was transferred to the Aircraft segment.
In the Fact Book which follows, in order to provide a comparative basis for future periods, certain historical consolidated financial statementamounts have been adjusted on pages 2-11 and 15 as follows: (a) the segment information has been restated to reflect the January 2002 reorgani-zation; (b) the restated amounts exclude the Automotive Trim business that was sold in 2001; and (c) segment profit has been adjusted to excludecertain costs related to restructuring which are included in segment profit in the consolidated financial statements.
(Dollars in millions except per share data) 2001 2000 Change
Operating Results
Revenues $12,321 $13,090 (6)%International revenues, as a % of total revenues 35% 35% –Segment profit1 $ 828 $ 1,410 (41)%Income from continuing operations $ 166 $ 277 (40)%Total debt – Textron Manufacturing2 $ 1,934 $ 2,084 (7)%Shareholders’ equity $ 3,934 $ 3,994 (2)%
Common Share Data
Diluted earnings per share from continuing operations before special charges 3 $ 2.32 $ 4.65 (50)%
Diluted earnings per share from continuing operations $ 1.16 $ 1.90 (39)%Dividends per share $ 1.30 $ 1.30 –Diluted average common shares outstanding (000’s) 142,937 146,150 (2)%
Key Performance Metrics
Return on invested capital (ROIC)4 9.0% 13.1% –Return on average shareholders’ equity 8.6% 15.6% –Free cash flow5 $ 316) $ 463) (32)%Free cash flow – Textron Manufacturing $ 274 $ 385 (29)%Debt (net of cash) to total capital –
Textron Manufacturing 28% 29% –
Short-Term Senior Commercial
Credit Ratings of Textron Manufacturing Long-Term Paper
S&P A A – 1Moody’s A3 P – 2Fitch A F – 11 2001 excludes special charges of $319 million in goodwill and intangible asset impairment write-downs, $81 million in
restructuring expenses, $28 million in fixed asset impairment write-downs and $9 million in write-downs of e-business investments. 2000 excludes special charges of $349 million in goodwill impairment write-downs, $17 million in restructuring expenses and $117 million in an impairment charge related to e-business investments.
2 Textron Manufacturing includes all entities of Textron other than its finance subsidiary.3 2001 is calculated before cost related to restructuring not included in special charges and the gain on the sale of
Automotive Trim.4 ROIC is calculated before special charges.5 Free cash flow before restructuring was $384 million in 2001 and $464 million in 2000.
www.textron.com
NYSE: TXT
2001 Fortune 500 ranking: 150
Number of employees: 51,000 – 29 percent are outside the U.S.
Number of countries with manufacturing operations: 31
Key Executives
Lewis B. Campbell
Chairman, President and Chief Executive Officer
Lewis B. Campbell was named CEOin July 1998 and appointed chairman in February 1999. Campbell served aspresident and chief operating officerfrom January 1994 to July 1998, andreassumed the position of president in September 2001. Campbell joinedTextron in September 1992 as executivevice president and chief operating officer.He joined Textron after a 24-yearcareer at General Motors.
Ted R. French
Executive Vice President and Chief Financial Officer
Ted R. French joined Textron as executive vice president and chieffinancial officer in December 2000.Prior to joining Textron, French servedas president, financial services, andchief financial officer for CNH GlobalN.V., where he spent 11 years. Earlierhe held a variety of positions during 12 years with Rockwell International.
Aircraft Commercial and military helicopters, tiltrotor aircraft, business jets, single-engine piston aircraft and utility turboprops.
Fastening SystemsSpecialized fastening products and systems for automotive, commercial and industrial markets.
Industrial ProductsGolf, turf-care and specialty products, light construction equipment, electrical and telecommunicationstools and testing technologies, and defense systems.
Industrial ComponentsFluid handling products, power transmission components and plastic fuel systems.
FinanceDiversified commercial financing.
Textron Segments in 2002

2 Textron Fact Book
Strategic Steps Forward
SeatingCapacity
First (Including Useful Cruising MaximumDescription Delivery Pilots) Load (lbs) Speed (kts) Range (nm)
Light
206B-3 Jet Ranger World’s most popular commercial helicopter. 1977 5 1,492 115 374
206L-4 Long Ranger Extended cabin version of Jet Ranger. 1992 7 2,141 112 324
407 Four-bladed, larger version of 206. 1996 7 2,360 133 330
427 A light twin-engine helicopter. 2000 8 2,490 138 390
Intermediate
430 Flagship commercial four-bladed, twin-engine helicopter. 1996 9–10 3,975 139 353
Medium
412 EP Twin-engine with highest dispatch reliability and the lowest hourly cost. 1981 15 5,044 122 356
AB139 Modern new medium twin, being developed in partnership with Agusta. 2002 17 5,511 157 400
Military
UH-1N Huey U.S. Marine and Air Force light utility helicopter. 1971 15 3,532 110 230
OH-58D Kiowa Warrior Armed reconnaissance helicopter for U.S. Army. 1986 2 2,200 114 268
AH-1W Super Cobra U.S. Marine attack helicopter. 1986 2 3,830 150 280
TH-67 Trainer Military training helicopter. 1993 3 1,321 115 374
Huey II Upgrade of U.S. Army and worldwide UH-1H model Huey. 1997 15 5,060 106 216
UH-1Y Comprehensive upgrade of UH-1N U.S. Marine Huey. 2007 12 6,661 150 350
AH-1Z Comprehensive upgrade of AH-1W U.S. Marine Super Cobra. 2007 2 6,200 143 380
Tiltrotor
Bell Boeing V-22 Osprey Military tiltrotor aircraft, being produced in partnership with Boeing. 1999 27 23,860 255 750
BA609 Commercial tiltrotor aircraft, being developed in partnership with Agusta. 2007 11 5,500 275 750
Aircraft – Bell Helicopter
A leading global supplier of vertical takeoff
and landing aircraft for commercial and
military markets, and the pioneer of the
revolutionary tiltrotor aircraft.
15.1% Bell’s share of Textron 2001revenues (indicated by whitedotted line)
44.7% Aircraft’s share of Textron2001 revenues
Excludes the Automotive Trim businesssold in 2001.
Strengthen customer-driven product developmentand product improvement processes.
Complete the redesign and flight test of the V-22 to insure the future production of the aircraft for theMarines, Air Force Special Operations Forces andother Department of Defense and international customers.
Increase helicopter life-cycle revenue through expan-sion of best-in-industry sales, service and after-marketnetworks for both commercial and military markets.
Leverage brand strength and industry-recognizedcustomer commitment to increase market share.
Implement Textron Six Sigma and supply chainimprovements, and leverage the Textron enterpriseto achieve operational improvements.
Refine organizational structure to insure best talent is in place to exceed customer requirements,implement leading technology and focus on businessmanagement.
Major Products

Textron Fact Book 3
(Dollars in millions) 2001 2000 1999 1998 1997
Bell Helicopter:
Revenue $1,621 $1,580 $1,547 $ 1,431 $1,568 Bell Commercial Units Shipped:1
Light 84 108 102 144 186Intermediate/Medium 30 32 48 49 47
Backlog $1,001 $1,516 $1,987 $1,871 $1,909
Total Aircraft:2
Revenue $4,797 $4,537 $4,147 $3,506 $3,325 Segment profit, as adjusted3 $ 337 $ 464 $ 373 $ 347 $ 325 Segment profit margin, as adjusted3 7.0% 10.2% 9.0% 9.9% 9.8%Total assets $2,850 $2,614 $2,401 $2,256 $2,004Capital expenditures $ 175 $ 157 $ 167 $ 144 $ 111Depreciation $ 116 $ 107 $ 98 $ 83 $ 72 Amortization $ 11 $ 10 $ 10 $ 10 $ 10ROIC 12.6% 18.6% 15.3% 15.2% 15.3%
1 Does not include units shipped to foreign governments or units produced under licensing agreements. 2 Includes Bell Helicopter, Cessna Aircraft and Lycoming. 3 2001 excludes $10 million in costs related to restructuring that are included in segment profit in the consolidated financial statements within the 2001 Annual Report.
Key Data, Restated for January 2002 Reorganization
By Product/Service
*Commercial markets include: Civilgovernment 26%, Corporate 39%and Operator 35%.
Light Single Light Twin Medium TwinInter-mediate Twin
By Customer
Bell product lineCompetition
(Dollars in millions)
Aircraft – Bell Helicopter
Sales
AS
350
B-2
$1.
2
Bel
l 206
B $
0.8
MD
500
E $
0.8
EC 1
20B
$0.
9
MD
520
N $
0.9
Bel
l 206
L-4
$1.
2
MD
600
N $
1.3
Bel
l 407
$1.
5
AS
350B
3 $
1.4
A 1
19 $
1.9
AS
355N
$2
.0
Bel
l 427
$2.
6
EC 1
35 $
2.7
MD
902
$3.
2
A 1
09 E
$3.
3
EC 1
17C
$3.
4
Bel
l 430
$4.
0
EC 3
65 $
5.1
Bel
l 412
EP
$5.
4
EC 1
55 $
6.0
S 76
C $
6.5
AB
139
$7.
0
Commercial Product Price Points
15% R&D
34% Spares & Support51% Aircraft
11% Foreign Government
40% Commercial*49% U.S. Government
Non-U.S. revenues account for 32% of Bell’s total revenues.
More than 22,000 Bell aircraft are flying in over 130 countries.Over half the helicopters in the world carry the Bell name.
Service network of more than 170 strategically located customersupport facilities worldwide.
Bell has approximately 8,000 employees, of which 19% are based outside the U.S.
Manufacturing facilities in Ft. Worth and Amarillo, Texas; Bristol,Tennessee; and Mirabel, Canada.
Global Diversification
3%68%
10%
5%
8%1%
2%
Distribution of Sales by Geography
3%
4 Textron Fact Book
By Product/Service
Major Products
By Customer
SeatingCapacity
First (Including Cruising MaximumDescription Delivery Pilots) Speed (kts) Range (nm)
Business Jets
Light
Citation CJ1 Lowest-priced entry-level business jet. 2000 7 381 1,475Citation CJ2 Larger, faster version of CJ1. 2000 8 410 1,738Citation Bravo Best value in a light business jet. 1997 10 402 2,000Citation Encore Upgrade of Cessna’s Ultra, with added flexibility. 2000 10 427 1,970Citation Excel World’s first and only light jet with stand-up cabin. 1998 10 430 2,080
Mid-Size
Citation Sovereign Largest cabin of any traditional mid-size jet and great versatility. 2004 12 444 2,820Citation X World’s fastest business jet. 1996 11 525 3,390Caravan Utility Turboprops
208 & 208B Single-engine turboprop for carrying cargo or passengers. Cargo 1985 to 14 163 –184 855–960
Single-Engine
Skyhawk (172 & 172SP) World’s most popular single engine aircraft, ideal for training. 1997/98 4 122–124 518–580182 Skylane (182 & T182) Acknowledged as the best all-around four-passenger single. 1997 4 144–170 820Stationair (206 & T206) Exceptional cargo carrying or passenger aircraft. 1998 6 142–164 713–730
The world’s largest manufacturer of light and
mid-size business jets, utility turboprops and
single-engine piston aircraft. Also includes:
Lycoming aircraft engines and a joint venture in
CitationShares fractional jet ownership business.
75% Business Jets12% Parts & Service
6% Single Engine4% Caravan
3% Used Aircraft
Total Fractional Ownership Market
Since 1995, the number of aircraft delivered to the fractional
jet ownership market has grown from 30 units in 1995 to
140 units in 2001.
(New turbine aircraft shipments – units)
Sales
29.6% Cessna’s share of Textron2001 revenues (indicated bywhite dotted line)
44.7% Aircraft’s share of Textron2001 revenues
Excludes the Automotive Trim business sold in 2001.
95 96 97 98 00 0199
30
140
Aircraft – Cessna Aircraft
87% Corporate12% Fractional Ownership
1% U.S. Government
Strategic Steps Forward
Continue to strengthen brands and expand leadingmarket positions through close customer relationshipsand new, market-driven products.
Maintain leadership in light and mid-size business jet, utility turboprop, single-engine piston aircraft andpiston aircraft engine markets.
Utilize Textron Six Sigma and other methods to accelerate operational improvements to delight our customers.
Further extend Cessna brand name into high-growthfractional share ownership market through expansionof CitationShares business, sales to other fractionalshare operators, and broadening offering of after- market services.
Provide attractive, market-leading aircraft financingalternatives to customers worldwide.

Textron Fact Book 5
Light Jet Mid-Size Jet
Citation product lineCompetition
(Dollars in millions)
2001 Product Price Points – New Business Jets
Aircraft – Cessna Aircraft
Cessna Citations are operated in more than 75 countries, representing the largest fleet of business jets in the world.
In its 74-year history, Cessna has delivered over 183,000 aircraftincluding 148,600 single-engine airplanes; 1,200 Caravans; 2,000military jets; and over 3,500 Citation business jets. Cessna hasdelivered 23% more business jets than its closest competitor.
Company-owned Citation Service Centers are strategically locatedat nine major airports across the United States and at Le BourgetAirport in Paris, France. Authorized Citation Service Centers arelocated in more than 15 countries.
Cessna has more than 13,000 employees worldwide.
Cessna has manufacturing facilities in Wichita and Independence,Kansas; Dayton, Ohio; and Columbus, Georgia.
Global Diversification
3%
76%
7%
12%
1%1%
Distribution of Sales by Geography
Lycoming is the world leader in the design and manufactureof reciprocating piston aircraft engines for the global generalaviation market. In addition to new engines, the companyrebuilds and overhauls engines which have been in prior service.
Lycoming engines power:
more than 50% of all general aviation piston-powered aircraft 75% of all homebuilt aircraft and85% of all new piston-powered aircraft being built today.Lycoming has delivered over 300,000 opposed reciprocating piston engines.
Lycoming
(Dollars in millions) 2001 2000 1999 1998 1997
Cessna Aircraft:
Revenue1 $3,176 $2,957 $2,600 $ 2,075 $1,757 Cessna Units Shipped:
Business jets 313 254 224 200 180Caravans 75 92 87 102 78Single-Engine 821 912 899 775 360
Backlog1 $5,200 $6,633 $5,452 $ 4,108 $2,906
Total Aircraft 2
Revenue $4,797 $4,537 $4,147 $ 3,506 $3,325 Segment profit, as adjusted3 $ 337 $ 464 $ 373 $ 347 $ 325 Segment profit margin, as adjusted3 7.0% 10.2% 9.0% 9.9% 9.8%Total assets $2,850 $2,614 $2,401 $2,256 $2,004Capital expenditures $ 175 $ 157 $ 167 $ 144 $ 111Depreciation $ 116 $ 107 $ 98 $ 83 $ 72 Amortization $ 11 $ 10 $ 10 $ 10 $ 10ROIC 12.6% 18.6% 15.3% 15.2% 15.3%
1 Includes Lycoming. 2 Includes Bell Helicopter, Cessna Aircraft and Lycoming. 3 2001 excludes $10 million in costs related to restructuring that are included in segment profit in the consolidated financial statements within the 2001 Annual Report.
Key Data, Restated for January 2002 Reorganization

6 Textron Fact Book
Product Lines
The world’s largest manufacturer of innovative fastening
solutions, providing an array of industries with threaded
fasteners, blind fastening systems, engineered
cold formed products, installation tools, automated
assembly systems, Vendor Managed Inventory and
engineering support programs.
Threaded Fasteners
Textron Fastening Systems (TFS) offers the most comprehensive threaded fastener product line available in the industry. The Camcar brand of threaded fasteners is globally recognized in a broad range of markets and includes the TORX PLUSDrive System, Taptite, Plastite, PT and Mag-Form thread-forming fasteners, Drilltite self-drilling fasteners and more. Alsoavailable are bolts, nuts and washers. Includes: Camcar, Elco, Ring Screw, Boesner, BSK, Fabco, Flexalloy and Sükosim.
Engineered Products
To lower assembly costs, manufacturers utilize TFS-engineered products and assemblies, as well as TFS’ extensive capabilities in cold forming, metal stamping, plastic molding, die-casting and modular assemblies. Each TFS-engineeredassembly is designed to meet the specific form, fit and function requirements of the application. Includes: Sükosim, Camcar, Oelschläger and TISA.
Blind Fasteners
The globally recognized Avdel and Cherry brands offer a broad range of installation tools and blind fasteners, includingthreaded inserts and structural, breakstem and speed fasteners. Includes: Avdel and Cherry.
Automation Systems
For full fastener assembly automation, TFS offers a vast array of solutions. TFS automation systems allow customers toautomate their fastener installation processes to lower costs and greatly improve productivity. Includes: Avdel, Cherryand Camcar.
15.6% Share of Textron 2001 revenues
Excludes the Automotive Trimbusiness sold in 2001.
Fastening Systems
Strategic Steps Forward
Realign into a more unified, agile matrix organizationthat drives organic growth globally through fourdedicated product line business groups.
Consolidate operations, creating focused factoriesdedicated to manufacturing-related products, whichapply best practices.
Increase ROIC by focusing on core products and applications, while outsourcing and divesting non-core products and services.
Enhance our advanced engineered solution andlogistics service offerings, while leveraging the equity of our powerful brands to increase marketpenetration.
Leverage entire supply chain, using e-enabled sourcing tools and the purchasing power of enterprise-wide commodity teams. Drive improvement through an intense focus on Textron Six Sigma.
Deliver proprietary products, services and solutions that bring greater value and lower the customer’s total system cost.
Textron Fact Book 7
(Dollars in millions) 2001 2000 1999 1998 1997
Total Fastening Systems: 1
Revenue $1,679 $1,996 $2,059 $1,758 $1,498 Segment profit, as adjusted2 $ 54 $ 175 $ 188 $ 186 $ 167 Segment profit margin, as adjusted2 3.2% 8.8% 9.1% 10.6% 11.1%Total assets $1,537 $1,776 $ 1,970 $1,760 $1,361Capital expenditures $ 61 $ 108 $ 103 $ 113 $ 72Depreciation $ 78 $ 82 $ 80 $ 70 $ 52 Amortization $ 16 $ 18 $ 18 $ 15 $ 13ROIC 2.8% 7.3% 7.3% 9.2% 10.5%
1 In 2001, management responsibility for the Advanced Solutions Group was transferred from the Fastening Systems segment to the Industrial Products segment. Priorperiods have been restated to reflect this change.
2 2001 excludes $8 million in costs related to restructuring that are included in segment profit in the consolidated financial statements within the 2001 Annual Report.
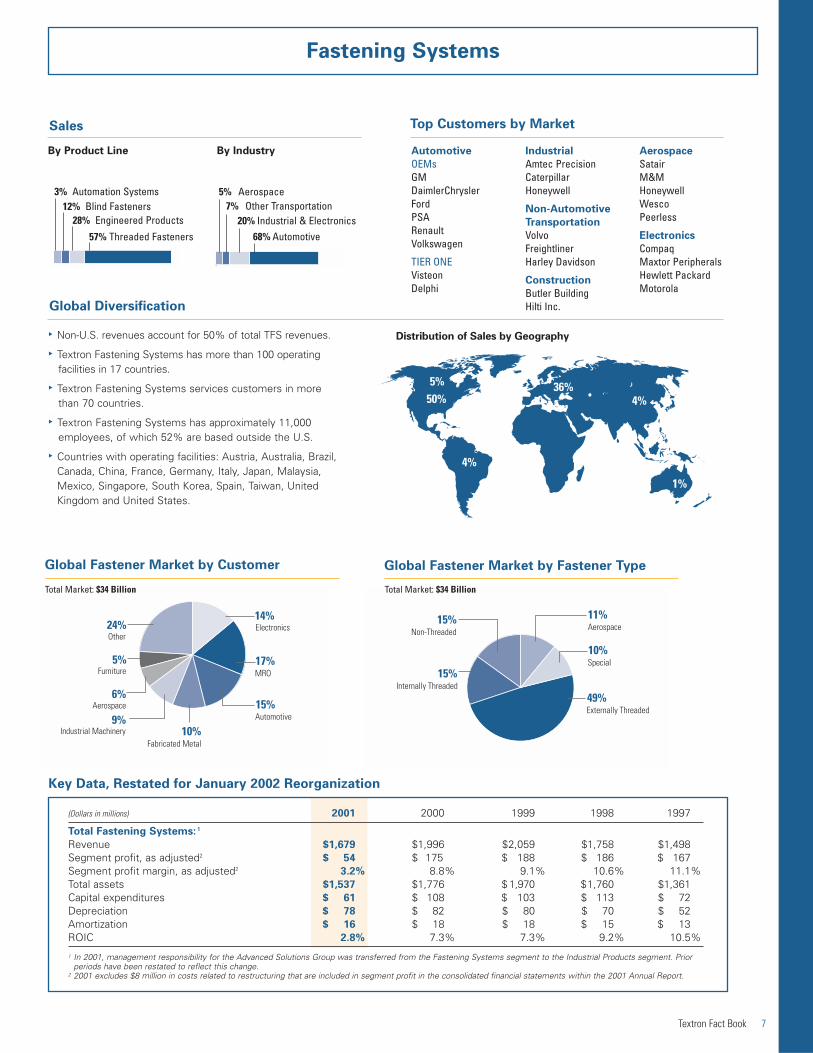
Non-U.S. revenues account for 50% of total TFS revenues.
Textron Fastening Systems has more than 100 operating facilities in 17 countries.
Textron Fastening Systems services customers in more than 70 countries.
Textron Fastening Systems has approximately 11,000 employees, of which 52% are based outside the U.S.
Countries with operating facilities: Austria, Australia, Brazil,Canada, China, France, Germany, Italy, Japan, Malaysia, Mexico, Singapore, South Korea, Spain, Taiwan, United Kingdom and United States.
5%50%
4%
36%4%
1%
Distribution of Sales by Geography
Fastening Systems
By Product Line By Industry
3% Automation Systems12% Blind Fasteners
28% Engineered Products
57% Threaded Fasteners
Automotive
OEMsGMDaimlerChryslerFordPSARenaultVolkswagen
TIER ONEVisteonDelphi
Industrial
Amtec PrecisionCaterpillarHoneywell
Non-Automotive
Transportation
VolvoFreightlinerHarley Davidson
Construction
Butler BuildingHilti Inc.
Aerospace
SatairM&MHoneywellWescoPeerless
Electronics
CompaqMaxtor PeripheralsHewlett PackardMotorola
Sales
Global Fastener Market by Customer Global Fastener Market by Fastener Type
Top Customers by Market
7% Other Transportation20% Industrial & Electronics
68% Automotive
5% Aerospace
Global Diversification
Key Data, Restated for January 2002 Reorganization
Aerospace6%
Industrial Machinery9%
Fabricated Metal10%
Furniture5%
Other24% Electronics
14%
MRO17%
Automotive15% Externally Threaded
49%
Special10%
Aerospace11%
Non-Threaded15%
Internally Threaded15%
Total Market: $34 Billion Total Market: $34 Billion

8 Textron Fact Book
The Industrial Products segment
comprises five business groups that
manufacture and market well-branded
industrial products worldwide.
Industrial Products
Strategic Steps Forward
Groups
Textron Golf, Turf & Specialty Products – 37% of segment
The Golf, Turf & Specialty Products group offers the world's most comprehensive line of golf and turf-care products andspecialty vehicles for golf courses, resort communities and municipalities, as well as commercial and industrial users, suchas airports, factories and professional lawn-care services. Products include electric-powered and internal combustion-powered golf cars, multi-purpose utility vehicles, including trail utility vehicles, professional turf maintenance equipment,lawn care machinery and specialized industrial vehicles. Includes: E-Z-GO, Jacobsen, Ransomes, Bob-Cat, Brouwer,Bunton, Cushman, Ryan and Steiner.
Textron Systems – 25% of segment
Textron Systems provides innovative, advanced technology solutions to meet the needs of the global aerospace anddefense industries. Within these industries, the Textron name is well known for its precision strike weapons, mobility andsurveillance systems including aircraft control components, specialty marine craft and Cadillac Gage armored vehicles.Includes: HR Textron and Marine & Land Systems.
OmniQuip – 16% of segment
Recognized industry-wide as the market leader in telescopic material handlers, OmniQuip produces light constructionequipment for the agricultural, construction, industrial, maintenance, military and utility markets. OmniQuip also manufactures aerial work platforms. Includes: LULL, SKY TRAK and SNORKEL.
Greenlee –11% of segment
Recognized worldwide for providing solutions that increase productivity and reduce cost, Greenlee manufactures productsfor wire and cable installation and maintenance. Greenlee serves the commercial, industrial and residential markets. For140 years, professional users have looked to Greenlee for quality, innovative products. Includes: Greenlee, Fairmontand Klauke.
Tempo – 11% of segment
Tempo manufactures test and measurement certification and verification products for public and private networks, as well as advanced components and assemblies for the telecommunications, computer, automotive and medical industries.Tempo is a market leader in the supply of tones and probes. Includes: RIFOCS, Progressive Electronics, Tempo, Chesilvale,IMAP, InteSys, Opto-Electronics and Industrial Technology.
Drive organic growth by leveraging brand excellence and customer focus.
Pursue value-added acquisitions that build on strengths of branded products.
Strengthen core golf and turf business, while exploring adjacent growth opportunities.
Leverage the Greenlee brand through enhancedservice and product innovation, while expanding into adjacent markets.
Strengthen the Tempo brand through new productinnovation and enhanced customer service and support, while focusing on global growth.
Expand Textron Systems’ innovative technologysolutions, further enabling combat and homelandsecurity missions.
Further improve enterprise excellence through diligent implementation of Textron Six Sigma applications, effective supply chain managementand consolidation of IT infrastructure.
18.4% Share of Textron 2001 revenues
Excludes the Automotive Trim business sold in 2001.

Total Available Market: $18 BillionTotal Available Market: $3 BillionTotal Available Market: $3 Billion
Total Available Market: $7.3 BillionTotal Available Market: $3.7 Billion
8% Test Instruments26% Cable Installation Tools
and Equipment61% Electrical Installation
Hand Tools
18% Other Turf Equipment27% Golf Turf Equipment
38% Golf Vehicles
17% Non-Golf Vehicles
Sales By Product Line
Greenlee Golf, Turf &Specialty Products
Textron Systems
TempoOmniQuip
5% Electrical Utility Tools
22% Aircraft Control Products30% Marine and Land Vehicles
38% Weapons
10% Surveillance and Sensors
14% Fiber40% Wireless
46% Copper/Coax75% Telescopic Material Handlers25% Aerial Work Platforms
Textron Fact Book 9
Industrial Products
(Dollars in millions) 2001 2000 1999 1998 1997
Industrial Products: 1
Revenue $1,974 $2,248 $1,629 $1,412 $1,204 Segment profit, as adjusted2
$ 76 $ 268 $ 217 $ 148 $ 112Segment profit margin, as adjusted2
3.9% 11.9% 13.3% 10.5% 9.3%Total assets $1,846 $1,943 $1,929 $1,073 $ 747Capital expenditures $ 93 $ 97 $ 84 $ 69 $ 60Depreciation $ 59 $ 53 $ 42 $ 36 $ 37Amortization $ 48 $ 30 $ 15 $ 11 $ 7ROIC 4.8% 10.7% 14.5% 12.5% 12.8%
1 In 2001, management responsibility for the Advanced Solutions Group was transferred from the Fastening Systems segment to the Industrial Products segment. Prior periods have been restated to reflect this change.
2 2001 excludes $9 million in costs related to restructuring that are included in segment profit in the consolidated financial statements within the 2001 Annual Report.
Non-U.S. revenues account for 22% of total segment revenues.Within each business group, non-U.S. revenues account for the following: Golf, Turf & Specialty Products (27%); OmniQuip (11%);Textron Systems (22%); Greenlee (29%); and Tempo (17%).
Textron’s Industrial Products segment has 75 sales and manufacturing facilities in 12 countries.
Over half the world’s golf cars bear the E-Z-GO name.
Jacobsen equipment can be found on virtually all golf coursesworldwide and Ransomes is the recognized leader in Europeanmunicipal turf equipment.
Over half of the world’s telecommunication engineers use a Tempo-designed product.
Global Diversification
3%78%
1%
10%7%
1%
Textron’s Industrial Products segment has approximately 8,000employees, of which 14% are based outside the U.S.
Countries with operating facilities: Australia, Brazil, Canada, France,Germany, Ireland, Italy, Mexico, New Zealand, United Kingdom and United States.
Distribution of Sales by Geography
Key Data, Restated for January 2002 Reorganization

10 Textron Fact Book
The Industrial Components segment
comprises three business groups that
manufacture and market engineered
products and automotive components
worldwide.
Industrial Components
Groups
Kautex – 75% of segment1
Kautex is a leading global supplier of plastic fuel systems, including plasticand metal fuel filler assemblies. Kautex also supplies automotive clearvision systems (windshield and headlamp cleaning), blow-molded ductingand fluid reservoirs, as well as other components, such as cooling pipes,acoustic components and spare wheel lids. The group also includes CWC,which manufactures automotive engine camshafts; and Micromatic, whichmanufactures automatic assembly machines, perishable tools and abrasives,and hydraulic rotary actuators for automotive and industrial applications.
Textron Power Transmission – 13% of segment1
Power Transmission produces gears and gearboxes for global power transmission markets in industrial, mining, mobile equipment, off-roadvehicle and defense applications. Includes: AB Benzlers, Cone Drive and David Brown.
Textron Fluid Handling Products – 12% of segment1
Fluid Handling manufactures industrial pumps for hydrocarbon processing,polymer processing and other applications for use in the plastics, chemical,refining, oil and gas, power generation and pharmaceutical industries.Includes: David Brown Guinard Pumps, David Brown Union Pumps andMaag Pump Systems.
1Excludes revenues of Automotive Trim and Turbine Engine Components Textron, both sold in 2001.
Asia
97 01 05e
5%
EuropeThe Americasand Canada
97 01 05e 01 05e
20%
36%
35%
60%
78% 82
%
9770
%
85%
Market Penetration of Plastic Fuel Systems
(Dollars in millions) 2001 2000 1999 1998 1997
Industrial Components: 1
Revenue $1,583 $1,776 $1,759 $1,349 $1,125 Segment profit, as adjusted2
$ 128 $ 156 $ 152 $ 132 $ 112Segment profit margin, as adjusted2
8.1% 8.8% 8.6% 9.8% 10.0%Total assets $1,417 $1,612 $1,920 $1,747 $1,073Capital expenditures $ 79 $ 61 $ 81 $ 81 $ 77Depreciation $ 60 $ 65 $ 68 $ 52 $ 43Amortization $ 11 $ 18 $ 22 $ 14 $ 13ROIC 7.9% 8.5% 7.5% 8.4% 7.8%
1 Excludes the Automotive Trim business which was sold in 2001.2 2001 excludes $5 million in costs related to restructuring that are included in segment profit in the consolidated financial statements within the 2001 Annual Report.
Strategic Steps Forward
Differentiate product offerings to gain market share and increase brand recognition.
Expand Fluid Handling’s after-market presence, whileimproving product offerings for existing and adjacent OEM markets.
Deliver cost-competitive products for the power transmissionmarket while becoming a full-service provider of customer-tailored engineered products.
Capture stronger sales in growing plastic fuel systems market as a full-service provider while improving fuel system performance and emissions reduction.
Further improve enterprise excellence through diligentimplementation of Textron Six Sigma applications, effective supply chain management and consolidation of IT infrastructure.
14.7% Share of Textron 2001 revenues
Excludes the Automotive Trim business sold in 2001.
Key Data, Restated for January 2002 Reorganization

Maintain diversification and strong credit quality in portfolio.
Maintain focus in industries where superior product and market knowledge sustain competitive advantage.
Continue successful cross-selling program, which resulted in significant volume increase over previous year.
Accelerate deployment of information technology solutionsto improve customer-facing processes and operating efficiencies.
Work closely with other Textron businesses to offer a complete, fully integrated package to their customers.
Instill Textron Six Sigma disciplines to ensure value to customers with fast, accurate customer service.
Textron Fact Book 11
(Dollars in millions) 2001 2000 1999 1998 1997
Finance: 1
Receivables $5,636 $ 5,589 $5,578 $3,612 $3,069Managed receivables2 $9,349 $7,965 $6,802 $4,509 $3,829Return on equity 12.7% 13.1% 14.1% 16.2% 16.8%Net interest margin 7.65% 6.28% 6.27% 6.88% 6.51%Operating efficiency 35.6% 34.1% 35.4% 33.8% 29.3%Allowance for losses, % of receivables 2.55% 2.07% 2.02% 2.32% 2.52%Delinquencies3 2.24% 1.16% 0.96% 0.87% 0.86%Charge-offs, % of average finance receivables 1.27% 0.65% 0.54% 0.45% 0.64%Debt to equity 4.65x 5.13x 5.24x 5.99x 5.83xTextron-related receivables,
% of total managed receivables 22.1% 22.5% 21.4% 26.7% 27.2%
Revenue $ 709 $ 691 $ 463 $ 367 $ 350Segment profit $ 193 $ 190 $ 128 $ 113 $ 108Segment profit margin 27.2% 27.5% 27.6% 30.8% 30.9%Total assets $6,464 $ 6,131 $5,989 $3,785 $3,178Capital expenditures $ 18 $ 14 $ 11 $ 13 $ 8Depreciation and amortization $ 41 $ 32 $ 19 $ 13 $ 11ROIC 12.4% 13.0% 13.0% 14.8% 15.6%1 Refer to Textron Financial’s Annual Report and 10-K for complete financial information. 2 Managed receivables are owned receivables plus receivables serviced under securitizations, participations and third-party portfolio servicing agreements. 3 Percent of total independent and captive non-recourse receivables.
Textron Financial is a diversified commercial finance
company with core operations in four segments:
aircraft finance, revolving credit, specialty finance,
and structured capital. Textron Financial’s other
services and products include transaction syndica-
tions, equipment appraisal and disposition, portfolio
servicing and insurance brokerage.
6.6% Share of Textron2001 revenues
Excludes the Automotive Trim business sold in 2001.
23 Consecutive Years of Net Income Growth(Dollars in millions)
Finance
Strategic Steps Forward Managed Finance Receivables
Franchise Finance 6%
Golf Finance 15%
Structured Finance 8%
Other 8%
Inactive 3%
22% ReceivablesFinance
21% AircraftFinance
12% Floorplan Finance
5% Asset-Based Lending and FactoringTotal Managed Receivables: $9.3 Billion
88% U.S.; 12% International
Key Data, Restated for January 2002 Reorganization
Short-Term Senior Commercial
Credit Ratings Long-Term Paper
S&P A A – 2Moody’s A3 P – 2Fitch A F – 1
Net Income
12 Textron Fact Book
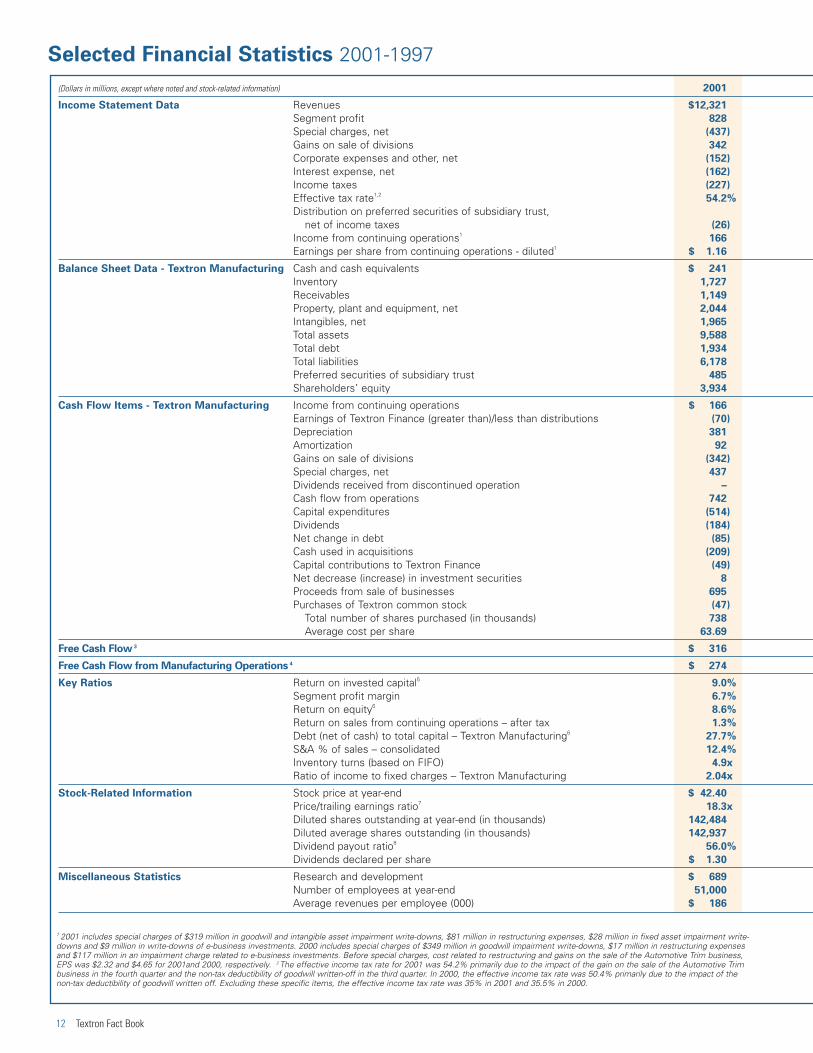
Selected Financial Statistics 2001-1997
1 2001 includes special charges of $319 million in goodwill and intangible asset impairment write-downs, $81 million in restructuring expenses, $28 million in fixed asset impairment write-downs and $9 million in write-downs of e-business investments. 2000 includes special charges of $349 million in goodwill impairment write-downs, $17 million in restructuring expensesand $117 million in an impairment charge related to e-business investments. Before special charges, cost related to restructuring and gains on the sale of the Automotive Trim business,EPS was $2.32 and $4.65 for 2001and 2000, respectively. 2 The effective income tax rate for 2001 was 54.2% primarily due to the impact of the gain on the sale of the Automotive Trimbusiness in the fourth quarter and the non-tax deductibility of goodwill written-off in the third quarter. In 2000, the effective income tax rate was 50.4% primarily due to the impact of the non-tax deductibility of goodwill written off. Excluding these specific items, the effective income tax rate was 35% in 2001 and 35.5% in 2000.
(Dollars in millions, except where noted and stock-related information) 2001
Income Statement Data Revenues $12,321
Segment profit 828
Special charges, net (437)
Gains on sale of divisions 342
Corporate expenses and other, net (152)
Interest expense, net (162)
Income taxes (227)
Effective tax rate1,254.2%
Distribution on preferred securities of subsidiary trust, net of income taxes (26)
Income from continuing operations1166
Earnings per share from continuing operations - diluted1$ 1.16
Balance Sheet Data - Textron Manufacturing Cash and cash equivalents $ 241
Inventory 1,727
Receivables 1,149
Property, plant and equipment, net 2,044
Intangibles, net 1,965
Total assets 9,588
Total debt 1,934
Total liabilities 6,178
Preferred securities of subsidiary trust 485
Shareholders’ equity 3,934
Cash Flow Items - Textron Manufacturing Income from continuing operations $ 166
Earnings of Textron Finance (greater than)/less than distributions (70)
Depreciation 381
Amortization 92
Gains on sale of divisions (342)
Special charges, net 437
Dividends received from discontinued operation –
Cash flow from operations 742
Capital expenditures (514)
Dividends (184)
Net change in debt (85)
Cash used in acquisitions (209)
Capital contributions to Textron Finance (49)
Net decrease (increase) in investment securities 8
Proceeds from sale of businesses 695
Purchases of Textron common stock (47)
Total number of shares purchased (in thousands) 738
Average cost per share 63.69
Free Cash Flow 3 $ 316
Free Cash Flow from Manufacturing Operations 4 $ 274
Key Ratios Return on invested capital5 9.0%
Segment profit margin 6.7%
Return on equity68.6%
Return on sales from continuing operations – after tax 1.3%
Debt (net of cash) to total capital – Textron Manufacturing627.7%
S&A % of sales – consolidated 12.4%
Inventory turns (based on FIFO) 4.9x
Ratio of income to fixed charges – Textron Manufacturing 2.04x
Stock-Related Information Stock price at year-end $ 42.40
Price/trailing earnings ratio718.3x
Diluted shares outstanding at year-end (in thousands) 142,484
Diluted average shares outstanding (in thousands) 142,937
Dividend payout ratio856.0%
Dividends declared per share $ 1.30
Miscellaneous Statistics Research and development $ 689
Number of employees at year-end 51,000
Average revenues per employee (000) $ 186

Textron Fact Book 13
3 Free cash flow before restructuring was $384 million in 2001 and $464 million in 2000. 4 Free cash flow from manufacturing operations is defined as cash provided by TextronManufacturing less manufacturing capital expenditures, corporate expenses, interest expense and income taxes. 5 ROIC is calculated before special charges; 1999 ROIC reflects the redeployment of $2.9 billion in capital from the divestiture of AFS; 1998 ROIC is calculated based on an investment in Avco Financial Services (AFS) at historical costs. 6 1999 ROE anddebt-to-capital ratio reflect increased equity and reduced leverage from the gain on the sale of AFS. 1998 ROE and debt-to-capital ratio were temporarily inflated by the repurchase of stockprior to the January 1999 closing of the sale of AFS. 7 Calculated ratio for 1998 through 1997 includes AFS, which was reclassified as a discontinued operation in 1998. 8 Dividend payoutratio: Dividends declared/trailing reported EPS (before special charges).
2000 1999 1998 1997
$13,090 $11,854 $9,874 $8,8751,410 1,201 1,040 917(483) 1 (87) –
– – 97 –(164) (143) (141) (152)(152) (29) (146) (117)(308) (381) (294) (250)50.4% 37.0% 38.5% 38.6%
(26) (26) (26) (26)277 623 443 3721.90 4.05 2.68 2.19
$ 282 $ 192 $ 31 $ 301,871 1,859 1,640 1,3491,318 1,363 1,160 9202,568 2,484 2,185 1,7612,340 2,807 2,119 1,567
10,239 10,404 9,936 8,1522,084 1,767 2,615 1,2216,671 6,412 6,928 4,847
484 483 483 4833,994 4,377 2,997 3,228
$ 277 $ 623 $ 443 $ 372(36) (43) (8) 6
365 337 282 24397 84 66 56
– – (54) –483 (1) 87 –
– – 187 108942 1,007 867 728(513) (521) (462) (366)(189) (192) (143) (202)342 (1,220) 1,038 (335)(85) (859) (753) (364)(5) (353) (59) –
(134) – – 251(9) 2,945 117 549
(353) (751) (712) (299)6,627 9,779 10,158 5,14053.27 76.80 70.09 58.17
$ 463 $ 499 $ 491 $ 436
$ 385 $ 479 $ 232 $ 215
13.1% 12.6% 13.7% 13.4%10.8% 10.1% 10.5% 10.3%15.6% 13.9% 19.6% 17.5%2.1% 5.3% 4.5% 4.2%
28.6% 24.5% 42.6% 24.3%11.0% 11.1% 11.2% 10.1%4.9x 4.8x 4.6x 4.9x
3.21x 9.44x 4.59x 4.73x
$ 46.50 $ 76.69 $75.94 $ 62.6310.0x 18.9x 20.6x 19.0x
142,889 149,852 158,549 167,315146,150 153,754 165,374 169,503
28.0% 32.0% 35.0% 36.0%$ 1.30 $ 1.30 $ 1.14 $ 1.00
$ 721 $ 670 $ 613 $ 60271,000 68,000 64,000 56,000
$ 187 $ 178 $ 164 $ 164

14 Textron Fact Book
(Dollars in millions, except Common Stock information) 2001 2000 1999 1998 1997
Q1 Q2 Q3 Q4 Year Q1 Q2 Q3 Q4 Year
Revenue
Aircraft $ 986 $ 1,223 $1,064 $1,391 $ 4,664 $ 959 $ 1,013 $1,171 $1,251 $ 4,394 $ 4,019 $3,380 $3,217
Automotive 677 716 579 629 2,601 838 761 654 671 2,924 2,868 2,356 2,072
Fastening Systems 1 466 451 389 373 1,679 548 529 469 450 1,996 2,059 1,758 1,498
Industrial Products 1 740 734 600 594 2,668 796 804 730 755 3,085 2,445 2,013 1,738
Finance 171 164 178 196 709 152 170 184 185 691 463 367 350
Total Revenues $3,040 $3,288 $2,810 $3,183 $12,321 $3,293 $ 3,277 $3,208 $3,312 $13,090 $11,854 $9,874 $8,875
Segment Profit (Loss)
Aircraft $ 98 $ 112 $ (31) $ 132 $ 311 $ 78 $ 107 $ 127 $ 139 $ 451 $ 362 $ 338 313
Automotive 60 61 14 23 158 81 69 40 54 244 220 171 141
Fastening Systems1 38 30 1 (23) 46 43 49 46 37 175 188 186 167
Industrial Products1 71 76 (16) (11) 120 93 103 71 83 350 303 232 188
Finance 46 40 48 59 193 41 44 49 56 190 128 113 108
Total Segment Profit $ 313 $ 319 $ 16 $ 180 $ 828 $ 336 $ 372 $ 333 $ 369 $ 1,410 $ 1,201 $1,040 $ 917
Special charges, net (42) (35) (338) (22) (437) – – – (483) (483) 1 (87) –
Segment Operating
Income (Loss) $ 271 $ 284 $ (322) $ 158 $ 391 $ 336 $ 372 $ 333 $ (114) $ 927 $ 1,202 $953 $ 917
Segment Profit Margins
Aircraft 9.9% 9.2% (2.9)% 9.5)% 6.7% 8.1% 10.6% 10.8% 11.1% 10.3% 9.0% 10.0% 9.7%
Automotive 8.9% 8.5% 2.4)% 3.7)% 6.1% 9.7% 9.1% 6.1% 8.0% 8.3% 7.7% 7.3% 6.8%
Fastening Systems1 8.2% 6.7% 0.3)% (6.2)% 2.7% 7.8% 9.3% 9.8% 8.2% 8.8% 9.1% 10.6% 11.1%
Industrial Products1 9.6% 10.4% (2.7)% (1.9)% 4.5% 11.7% 12.8% 9.7% 11.0% 11.3% 12.4% 11.5% 10.8%
Finance 26.9% 24.4% 27.0)% 30.1)% 27.2% 27.0% 25.9% 26.6% 30.3% 27.5% 27.6% 30.8% 30.9%
Segment Profit Margin 10.3% 9.7% 0.6)% 5.7)% 6.7% 10.2% 11.4% 10.4% 11.1% 10.8% 10.1% 10.5% 10.3%
Gains on sale of divisions – – 3 339 342 – – – – – – 97 –
Corporate expenses and other, net (42) (39) (33) (38) (152) (46) (41) (34) (43) (164) (143) (141) (152)
Interest expense, net (44) (40) (41) (37) (162) (33) (41) (42) (36) (152) (29) (146) (117)
Income taxes (66) (72) 69 (158) (227) (93) (104) (93) (18) (308) (381) (294) (250)
Distribution on preferred securities of mfg. subsidiarytrust, net of income taxes (6) (7) (6) (7) (26) (6) (7) (6) (7) (26) (26) (26) (26)
Income (Loss) From
Continuing Operations $ 113 $ 126 $ (330) $ 257 $ 166 $ 158 $ 179 $ 158 $ (218) $ 277 $ 623 $ 443 $ 372
EPS From Continuing
Operations – Diluted2,3 $ 0.79 $ 0.88 $(2.34) $ 1.81 $ 1.16 $ 1.06 $ 1.23 $ 1.08 $ (1.53) $ 1.90 $ 4.05 $ 2.68 $ 2.19
Effective Income Tax Rate3,4 35.7% 35.1% 17.6% 37.4% 54.2% 36.2% 35.9% 36.2% (9.3)% 50.4% 37.0% 38.5% 38.6%
Common Stock Information
Price range: High $59.26 $59.89 $56.90 $42.40 $59.89 $ 74.94 $65.56 $60.38 $55.38 $74.94 $97.00 $80.31 $70.75
Low $45.94 $52.95 $32.80 $31.65 $31.65 $ 51.50 $53.94 $44.88 $ 41.44 $41.44 $68.44 $52.06 $45.00
Dividends declared per share $0.325 $0.325 $0.325 $0.325 $ 1.30 $ 0.325 $0.325 $0.325 $0.325 $ 1.30 $ 1.30 $ 1.14 $ 1.00
Average shares outstanding (in thousands) – diluted 142,752 143,411 141,1965 142,460 142,937 148,818 146,304 145,325 141,9695
146,150 153,754 165,374 169,503
Financial Data 2001-1997(As Reported)
1 Through 2001, Textron’s reportable segments include Aircraft, Automotive, Fastening Systems, Industrial Products and Finance. During 2001, Textron reorganized management responsibility for one divisionpreviously reported in Fastening Systems to Industrial Products. All prior period data has been appropriately reclassified. 2 The average share base for the third quarter 2001 and the fourth quarter 2000excludes potentially dilutive common shares (convertible preferred stock and stock options). These shares are excluded due to their antidilutive effect resulting from each respective quarters loss from continuing operations. 3 2001 includes special charges of $319 million in goodwill and intangible asset impairment write-downs, $81 million in restructuring expenses, $28 million in fixed asset impairmentwrite-downs and $9 million in write-downs of e-business investments. 2000 includes special charges of $349 million in goodwill impairment write-downs, $17 million in restructuring expenses and $117 million in an impairment charge related to e-business investments. Before special charges, cost related to restructuring and the gain on the sale of Automotive Trim business, EPS was $2.32 and $4.65 for2001 and 2000, respectively. 4 The effective income tax rate for 2001 was 54.2% primarily due to the impact of the gain on the sale of the Automotive Trim business in the fourth quarter and the non-taxdeductibility of goodwill written-off in the third quarter. In 2000, the effective income tax rate was 50.4% primarily due to the impact of the non-tax deductibility of goodwill written off. Excluding these specific items, the effective income tax rate was 35% in 2001 and 35.5% in 2000. 5 Assumes full conversion of outstanding preferred stock and exercise of options. See footnote 2.
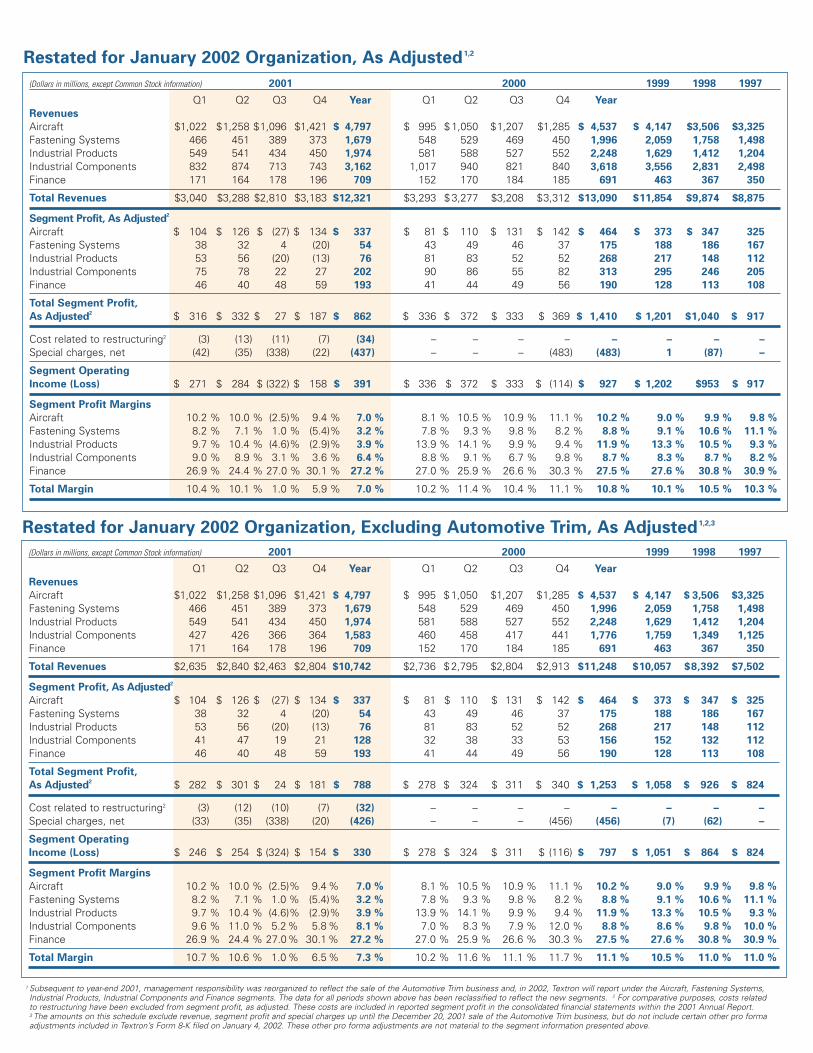
Restated for January 2002 Organization, Excluding Automotive Trim, As Adjusted1,2,3
(Dollars in millions, except Common Stock information) 2001 2000 1999 1998 1997
Q1 Q2 Q3 Q4 Year Q1 Q2 Q3 Q4 Year
Revenues
Aircraft $1,022 $1,258 $1,096 $1,421 $ 4,797 $ 995 $ 1,050 $1,207 $1,285 $ 4,537 $ 4,147 $3,506 $3,325
Fastening Systems 466 451 389 373 1,679 548 529 469 450 1,996 2,059 1,758 1,498
Industrial Products 549 541 434 450 1,974 581 588 527 552 2,248 1,629 1,412 1,204
Industrial Components 832 874 713 743 3,162 1,017 940 821 840 3,618 3,556 2,831 2,498
Finance 171 164 178 196 709 152 170 184 185 691 463 367 350
Total Revenues $3,040 $3,288 $2,810 $3,183 $12,321 $3,293 $ 3,277 $3,208 $3,312 $13,090 $11,854 $9,874 $8,875
Segment Profit, As Adjusted2
Aircraft $ 104 $ 126 $ (27) $ 134 $ 337 $ 81 $ 110 $ 131 $ 142 $ 464 $ 373 $ 347 325
Fastening Systems 38 32 4 (20) 54 43 49 46 37 175 188 186 167
Industrial Products 53 56 (20) (13) 76 81 83 52 52 268 217 148 112
Industrial Components 75 78 22 27 202 90 86 55 82 313 295 246 205
Finance 46 40 48 59 193 41 44 49 56 190 128 113 108
Total Segment Profit,
As Adjusted2 $ 316 $ 332 $ 27 $ 187 $ 862 $ 336 $ 372 $ 333 $ 369 $ 1,410 $ 1,201 $1,040 $ 917
Cost related to restructuring2 (3) (13) (11) (7) (34) – – – – – – – –
Special charges, net (42) (35) (338) (22) (437) – – – (483) (483) 1 (87) –
Segment Operating
Income (Loss) $ 271 $ 284 $ (322) $ 158 $ 391 $ 336 $ 372 $ 333 $ (114) $ 927 $ 1,202 $953 $ 917
Segment Profit Margins
Aircraft 10.2)% 10.0)% (2.5)% 9.4)% 7.0)% 8.1)% 10.5)% 10.9)% 11.1)% 10.2)% 9.0)% 9.9)% 9.8)%Fastening Systems 8.2)% 7.1)% 1.0)% (5.4)% 3.2)% 7.8)% 9.3)% 9.8)% 8.2)% 8.8)% 9.1)% 10.6)% 11.1)%Industrial Products 9.7)% 10.4)% (4.6)% (2.9)% 3.9)% 13.9)% 14.1)% 9.9)% 9.4)% 11.9)% 13.3)% 10.5)% 9.3)%Industrial Components 9.0)% 8.9)% 3.1)% 3.6)% 6.4)% 8.8)% 9.1)% 6.7)% 9.8)% 8.7)% 8.3)% 8.7)% 8.2)%Finance 26.9)% 24.4)% 27.0)% 30.1)% 27.2)% 27.0)% 25.9)% 26.6)% 30.3)% 27.5)% 27.6)% 30.8)% 30.9)%
Total Margin 10.4)% 10.1)% 1.0)% 5.9)% 7.0)% 10.2)% 11.4)% 10.4)% 11.1)% 10.8)% 10.1)% 10.5)% 10.3)%
Restated for January 2002 Organization, As Adjusted1,2
(Dollars in millions, except Common Stock information) 2001 2000 1999 1998 1997
Q1 Q2 Q3 Q4 Year Q1 Q2 Q3 Q4 Year
Revenues
Aircraft $1,022 $1,258 $1,096 $1,421 $ 4,797 $ 995 $ 1,050 $1,207 $1,285 $ 4,537 $ 4,147 $ 3,506 $3,325
Fastening Systems 466 451 389 373 1,679 548 529 469 450 1,996 2,059 1,758 1,498
Industrial Products 549 541 434 450 1,974 581 588 527 552 2,248 1,629 1,412 1,204
Industrial Components 427 426 366 364 1,583 460 458 417 441 1,776 1,759 1,349 1,125
Finance 171 164 178 196 709 152 170 184 185 691 463 367 350
Total Revenues $2,635 $2,840 $2,463 $2,804 $10,742 $2,736 $ 2,795 $2,804 $2,913 $11,248 $10,057 $8,392 $7,502
Segment Profit, As Adjusted2
Aircraft $ 104 $ 126 $ (27) $ 134 $ 337 $ 81 $ 110 $ 131 $ 142 $ 464 $ 373 $ 347 $ 325
Fastening Systems 38 32 4 (20) 54 43 49 46 37 175 188 186 167
Industrial Products 53 56 (20) (13) 76 81 83 52 52 268 217 148 112
Industrial Components 41 47 19 21 128 32 38 33 53 156 152 132 112
Finance 46 40 48 59 193 41 44 49 56 190 128 113 108
Total Segment Profit,
As Adjusted2 $ 282 $ 301 $ 24 $ 181 $ 788 $ 278 $ 324 $ 311 $ 340 $ 1,253 $ 1,058 $ 926 $ 824
Cost related to restructuring2 (3) (12) (10) (7) (32) – – – – – – – –
Special charges, net (33) (35) (338) (20) (426) – – – (456) (456) (7) (62) –
Segment Operating
Income (Loss) $ 246 $ 254 $ (324) $ 154 $ 330 $ 278 $ 324 $ 311 $ (116) $ 797 $ 1,051 $ 864 $ 824
Segment Profit Margins
Aircraft 10.2)% 10.0)% (2.5)% 9.4)% 7.0)% 8.1)% 10.5)% 10.9)% 11.1)% 10.2)% 9.0)% 9.9)% 9.8)%Fastening Systems 8.2)% 7.1)% 1.0)% (5.4)% 3.2)% 7.8)% 9.3)% 9.8)% 8.2)% 8.8)% 9.1)% 10.6)% 11.1)%Industrial Products 9.7)% 10.4)% (4.6)% (2.9)% 3.9)% 13.9)% 14.1)% 9.9)% 9.4)% 11.9)% 13.3)% 10.5)% 9.3)%Industrial Components 9.6)% 11.0)% 5.2)% 5.8)% 8.1)% 7.0)% 8.3)% 7.9)% 12.0)% 8.8)% 8.6)% 9.8)% 10.0)%Finance 26.9)% 24.4)% 27.0)% 30.1)% 27.2)% 27.0)% 25.9)% 26.6)% 30.3)% 27.5)% 27.6)% 30.8)% 30.9)%
Total Margin 10.7)% 10.6)% 1.0)% 6.5)% 7.3)% 10.2)% 11.6)% 11.1)% 11.7)% 11.1)% 10.5)% 11.0)% 11.0)%
1 Subsequent to year-end 2001, management responsibility was reorganized to reflect the sale of the Automotive Trim business and, in 2002, Textron will report under the Aircraft, Fastening Systems,Industrial Products, Industrial Components and Finance segments. The data for all periods shown above has been reclassified to reflect the new segments. 2 For comparative purposes, costs related to restructuring have been excluded from segment profit, as adjusted. These costs are included in reported segment profit in the consolidated financial statements within the 2001 Annual Report. 3 The amounts on this schedule exclude revenue, segment profit and special charges up until the December 20, 2001 sale of the Automotive Trim business, but do not include certain other pro formaadjustments included in Textron’s Form 8-K filed on January 4, 2002. These other pro forma adjustments are not material to the segment information presented above.

16 Textron Fact Book
Stock Exchange Listings
(Ticker Symbol – TXT)
Common Stock
New York, Chicago and Pacific Stock Exchanges
Preferred Stock ($2.08 and $1.40)
New York Stock Exchange
Mandatorily Redeemable Preferred Securities
of Subsidiary Trust (7.92%)
New York Stock Exchange
Capital Stock
(as of December 29, 2001)
Common stock: par value $0.125; 500,000,000 shares authorized; 141,250,537 shares outstanding.
$2.08 Cumulative Convertible Preferred stock, Series A:
133,601 shares outstanding.
$1.40 Convertible Preferred Dividend stock, Series B:
62,366 shares outstanding.
Transfer Agent and Registrar
First Union National BankShareholder Services Group - NC11531525 West W.T. Harris Blvd., 3C3Charlotte, NC 28288-1153(800) 829-8432www.firstunion.com/shareholderservices
Dividends
Common and Preferred Stock
Record dates: March 9, June 15, September 14 andDecember 14, 2001. Payable dates: April 1, July 1, October 1, 2001 and January 1, 2002.
Mandatorily Redeemable Preferred Securities of
Subsidiary Trust (7.92%)
Record dates: March 30, June 29, September 28 and December 28, 2001. Payable dates: April 2, July 2, October 1 and December 31, 2001.
Stock Splits
Record dates: December 17, 1965; August 11, 1967; May 11, 1987 and May 9, 1997.Distribution dates: January 1, 1966; September 1, 1967;June 1, 1987 and May 30, 1997.
General Information
This Fact Book is one of several sources of information available to Textron Inc. shareholders and the investment community. To receive Annual Reports, 10-K, 10-Q reports and/or press releases, please call (888) TXT-LINE or visit our web site atwww.textron.com
Contacts
Investors
Douglas R. WilburneVice President Communications & Investor Relations [email protected](401) 457-2288(401) 457-3598 (fax)
Banks and Rating Agencies
Mary F. LovejoyVice President and [email protected](401) 457-6009(401) 457-3533 (fax)
Media
Susan M. TardanicoDirector Corporate [email protected](401) 457-2394(401) 457-3598 (fax)
Susan B. BishopManager Media [email protected](401) 457-2362(401) 457-3598 (fax)
Share Ownership
Textron is an Equal Opportunity Employer.
Stock and Contact Information
57% U.S. Institutions
23% Individuals & Other
15% Employees/Directors/Officers
5% Foreign Institutions
5%
23% 57%
15%

Business Directory
World Headquarters
Aircraft
Fastening Systems
Finance
Industrial Products
Textron Inc.
40 Westminster StreetProvidence, RI 02903-2596(401) 421-2800www.textron.com
Bell Helicopter
P.O. Box 482Ft. Worth, TX 76101-0482(817) 280-2011www.bellhelicopter.textron.com
Cessna Aircraft Company
Includes:Lycoming
P.O. Box 7706Wichita, KS 67277-7706(316) 517-6000www.cessna.textron.com
Textron Fastening Systems
840 West Long Lake Road Suite 450Troy, MI 48098(248) 879-8660www.textronfasteningsystems.com
Industrial Components
Kautex
Includes:Kautex, CWC and Micromatic
Kautexstrasse 5253229 BonnGermany011-49-228-4880www.kautex-textron.com
Textron Fluid Handling Products
Includes: David Brown GuinardPumps, David Brown UnionPumps, David Brown Hydraulicsand Maag Pump Systems
4600 West Dickman RoadBattle Creek, MI 49015-1098(616) 966-4600www.maag.com orwww.fhp.textron.com
Textron Power Transmission
Includes:AB Benzlers, ConeDrive, David Brown and TextronIndustrial S.p.A.
Park RoadLockwoodHuddersfield, HD4 5DDEngland011-44-1-484-465500www.textronpt.com
Greenlee
Includes:Greenlee, Fairmont and Klauke
4455 Boeing DriveRockford, IL 61109(815) 397-7070www.greenlee.textron.com
OmniQuip
Includes: LULL, SKY TRAK and SNORKEL
222 East Main StreetPort Washington, WI 53074(262) 268-3111www.omniquip.com
Tempo
Includes:RIFOCS, ProgressiveElectronics, Tempo, Chesilvale,IMAP, InteSys, Opto-Electronicsand Industrial Technology
4015 Executive Park DriveSuite 400Cincinnati, OH 45241(513) 554-1811www.tempo.com
Textron Golf, Turf &
Specialty Products
Includes: E-Z-GO, Jacobsen,Ransomes, Bob-Cat, Brouwer,Bunton, Cushman, Ryan andSteiner
3800 Arco Corporation DriveSuite 310Charlotte, NC 28273(704) 504-6600www.ttcsp.com
Textron Systems
Includes:Textron Systems, HR Textron and Textron Marine& Land Systems
201 Lowell StreetWilmington, MA 01887(978) 657-5111www.systems.textron.com
Textron Financial
40 Westminster StreetProvidence, RI 02903(401) 621-4200www.tfc.textron.com
Textron Fact Book 17

Textron Inc.
40 Westminster Street
Providence, RI 02903
(401) 421-2800
www.textron.com
AB Benzlers, Avdel, BA 609, Bell, Bell Helicopter, Bell 206B, Bell 206B-3 Jet Ranger, Bell 206L, Bell 206L-4 Long Ranger, Bell 407, Bell 427,Bell 430, Bell 412 EP, Bell AB139, Bell Huey II, Bell OH-58D Kiowa Warrior, Bell AH-1W Super Cobra, Bell TH-67 Trainer, Bell UH-1Y, UH-1Y,Bell AH-1Z, AH-1Z, Bell Boeing V-22 Tiltrotor, Bell Augusta 609 Tiltrotor, BSK, Bob-Cat, Boesner, Brouwer, Bunton, Cadillac Gage, Camcar,Cessna, Cessna Aircraft, Cessna Citation, Cessna Citation CJ1, Cessna Citation CJ2, Cessna Citation Bravo, Cessna Citation Encore, CessnaCitation Excel, Cessna Citation Sovereign, Cessna Citation X, Cessna Caravan, Cessna Caravan 208, Cessna Caravan 208B, Cessna Skyhawk172, Cessna Skyhawk 172SP, Cessna 182 Skylane, Cessna T182 Skylane, Cessna Stationair 206, Cessna Stationair T206, CitationShares,Cherry, Chesilvale, Cone Drive, Cushman, CWC, David Brown, David Brown Guinard Pumps, David Brown Hydraulics, David Brown UnionPumps, Drill-tite, Elco, Energy Manufacturing, E-Z-GO, Fabco, Fairmont, Flexalloy, Greenlee, HR Textron, IMAP, Industrial Technology, InteSys,Jacobsen, Kautex, Klauke, LULL, Lycoming, Maag Pump Systems, Mag-Form, Mapri, Micromatic, Oelschläger, OmniQuip, Opto-Electronics,Plastite, Progressive Electronics, PT, Ransomes, Rego Mold & Tool, RIFOCS, Ring Screw, Ryan, SKY TRAK, SNORKEL, Steiner, Sükosim,Taptite, Tempo, Textron, Textron Inc., Textron Aerospace Fasteners, Textron Fastening Systems, Textron Financial, Textron FinancialCorporation, Textron Fluid Handling Products, Textron Golf, Turf & Specialty Products, Textron Industrial Components, Textron IndustrialProducts, Textron Industrial S.p.A., Textron Industries S.A., Textron Marine & Land Systems, Textron Power Transmission, Textron Systems,TISA, TORX PLUS Drive System, TORX PLUS, Tri-Star, Williams Machine and Tool, and their related trademark designs and logotypes (andvariations of the foregoing) are service/trademarks or trade names of Textron Inc., its subsidiaries, or joint ventures.
Forward-looking Information: Certain statements in this release and other oral and written statements made by Textron from time to time, are for-ward-looking statements, including those that discuss strategies, goals, outlook or other non-historical matters; or project revenues, income,returns or other financial measures. These forward-looking statements are subject to risks and uncertainties that may cause actual results todiffer materially from those contained in the statements, including the following: (a) the extent to which Textron is able to achieve savings fromits restructuring plans (b) changes in worldwide economic and political conditions that impact interest and foreign exchange rates, (c) the occur-rence of work stoppages and strikes at key facilities of Textron or Textron’s customers or suppliers, (d) government funding and program approvalsaffecting products being developed or sold under government programs, (e) cost and delivery performance under various program and develop-ment contracts, (f) successful implementation of supply chain and other cost-reduction programs, (g) the timing of certifications of new aircraftproducts, (h) the occurrence of further downturns in customer markets to which Textron products are sold or supplied, (i) Textron’s ability to off-set, through cost reductions, raw material price increases and pricing pressure brought by original equipment manufacturer customers and (j) TextronFinancial’s ability to maintain credit quality and control costs.