a nested unsupervised approach to identifying novel molecular subtypes elizabeth garrett-mayer...
TRANSCRIPT
A NESTED UNSUPERVISED APPROACH TO
IDENTIFYING NOVEL MOLECULARSUBTYPES
ELIZABETH GARRETT-MAYERONCOLOGY BIOSTATISTICS
JOHNS HOPKINS UNIVERSITY
"MCMSki": The Past, Present, and Future of Gibbs Sampling
Bormio, ItalyJanuary 12-14, 2005
INTRODUCTION: MOLECULAR SUBTYPING IN LUNG CANCER
• Lung cancer remains the leading cause of cancer deaths for men and women
• Lung cancer diagnosis includes evaluation of – type of cancer (e.g. non-small cell, adenocarcinoma)– location and size– lymph node involvement– evidence of metastases outside the lungs.
• But, tumors with identical diagnosis often– progress differently, – respond to therapy differently– result in different long-term outcomes.
MOLECULAR SUBTYPING IN LUNG CANCER
• Genome-wide analyses of gene expression profiles show promise: different subclasses of tumors correspond to distinct gene expression patterns
• Multiple studies in lung cancer have found gene expression profiles for lung cancer subtypes.– Bhattacharjee et al. (PNAS 2001)– Beer et al. (Nature Medicine 2002)– Garber et al. (PNAS 2001)– and more…..
• Some overlap and some disagreement between profiles.– Different technologies used (e.g. Affymetrix versus cDNA chips)– Different genes on the arrays.– Different statistical methods for developing profiles
• Validation: Some are, but most are not validated.
MOLECULAR CLASSIFICATION
• Goal: To use expression data to identify or hypothesize subtypes of cancer that are as yet undefined.
• Eventually, we’d like to be able to have individualized prognoses and therapy based on molecular profiles
• Success story: Gefitinib (Iressa)– Non-small cell lung cancers– Those with EGFR protein mutation have high probability of
response– Clinical test developed for screening lung cancer patients
• We need additional new classes that are– Interpretable (biologically)– Amenable to further analyses– Translatable into “clinical tools”
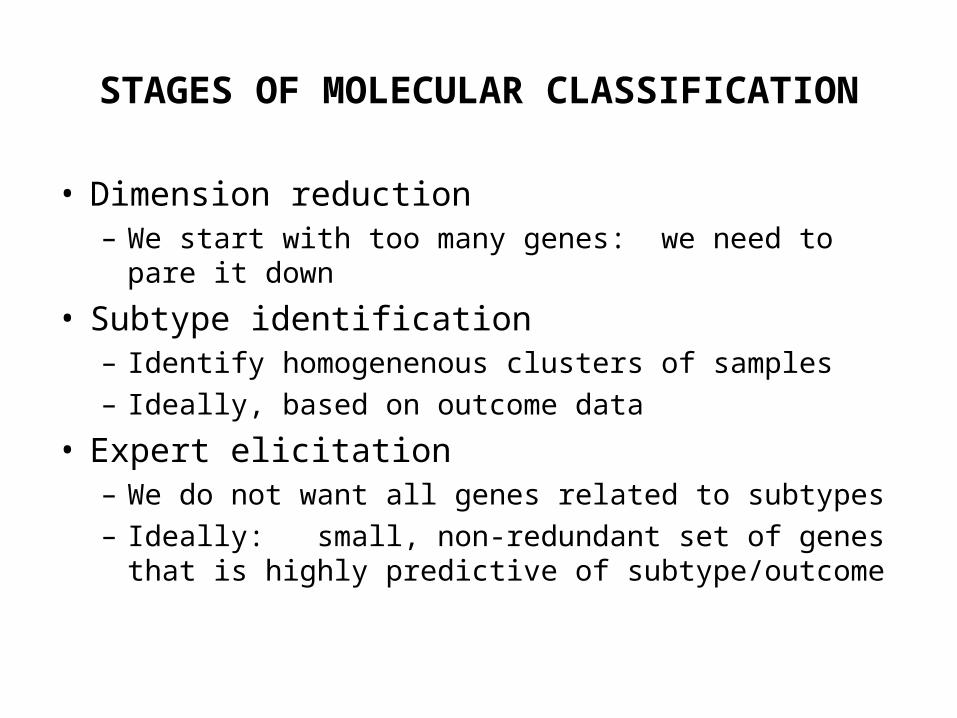
STAGES OF MOLECULAR CLASSIFICATION
• Dimension reduction– We start with too many genes: we need to pare it
down
• Subtype identification– Identify homogenenous clusters of samples– Ideally, based on outcome data
• Expert elicitation– We do not want all genes related to subtypes– Ideally: small, non-redundant set of genes that is
highly predictive of subtype/outcome
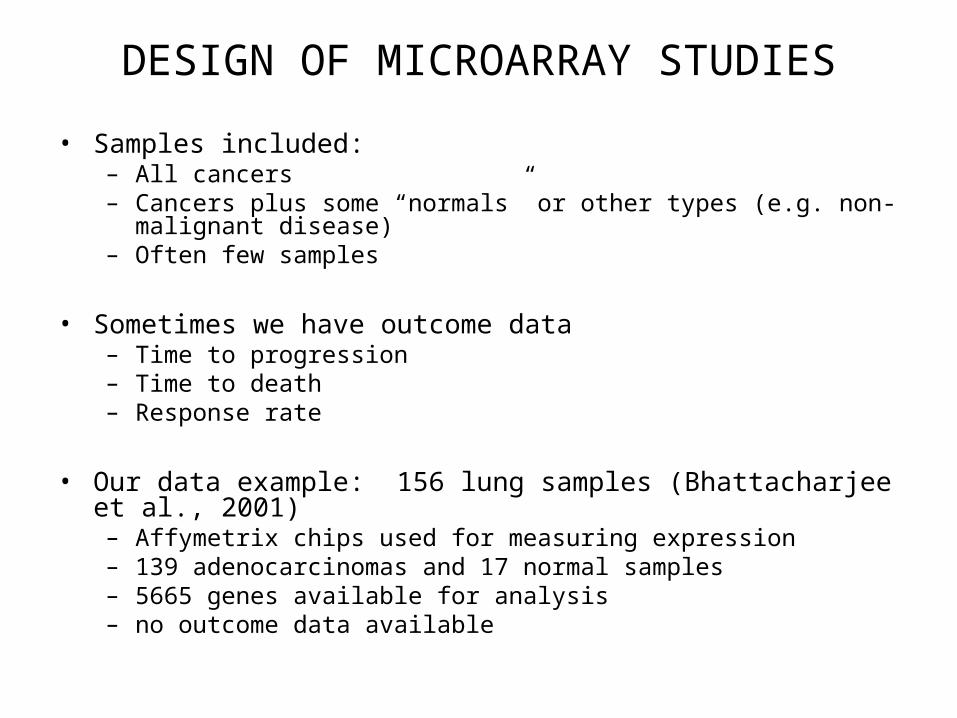
DESIGN OF MICROARRAY STUDIES
• Samples included:– All cancers– Cancers plus some “normals” or other types (e.g. non-malignant
disease)– Often few samples
• Sometimes we have outcome data– Time to progression– Time to death– Response rate
• Our data example: 156 lung samples (Bhattacharjee et al., 2001) – Affymetrix chips used for measuring expression– 139 adenocarcinomas and 17 normal samples– 5665 genes available for analysis– no outcome data available
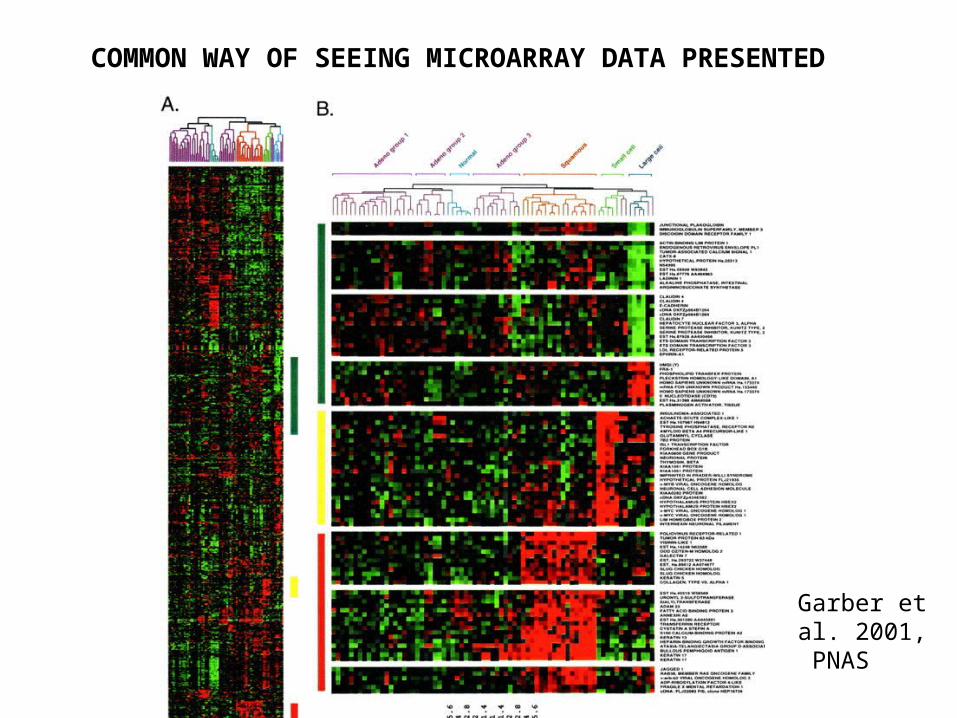
COMMON WAY OF SEEING MICROARRAY DATA PRESENTED
Garber et al. 2001, PNAS
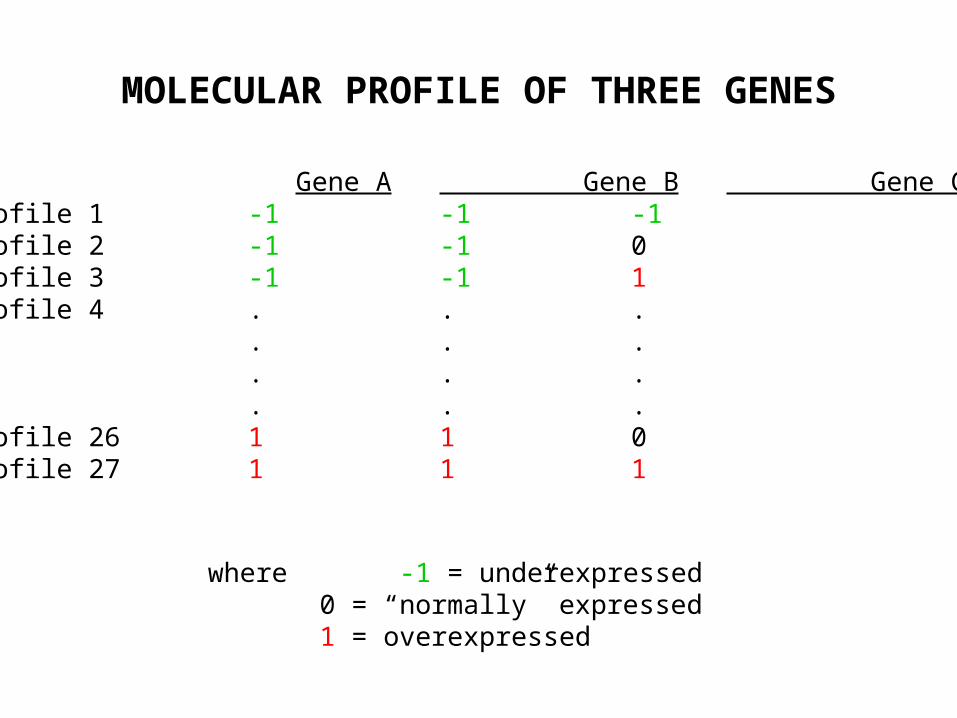
MOLECULAR PROFILE OF THREE GENES
Gene A Gene B Gene CProfile 1 -1 -1 -1Profile 2 -1 -1 0Profile 3 -1 -1 1Profile 4 . . .. . . .. . . .. . . .Profile 26 1 1 0Profile 27 1 1 1
where -1 = underexpressed 0 = “normally” expressed 1 = overexpressed

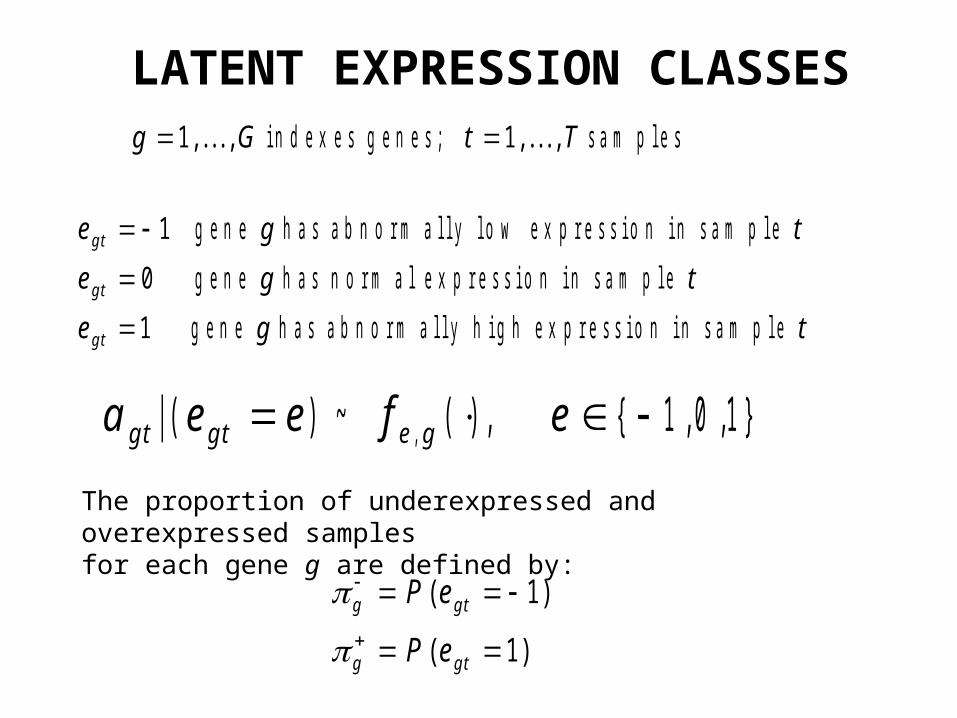
LATENT EXPRESSION CLASSES in d ex es g en es; sam p les
g en e h as ab n o rm ally lo w ex p ressio n in sam p le
g en e h as n o rm a l ex p ressio n in sam p le
g en e h as ab n o rm ally h ig h ex p ressio n in sam p le
g G t T
e g t
e g t
e g t
g t
g t
g t
1 1
1
0
1
, . . . , , . . . ,
a e e f eg t g t e g| ( ) ~ ( ), { , , }, 1 0 1
The proportion of underexpressed and overexpressed samples for each gene g are defined by:
g g t
g g t
P e
P e
( )
( )
1
1
f U
f N
f U
g g t g t g
g t g g
g t g t g g
1
0
1
,
,
,
( ) ( , )
( ) ( , )
( ) ( , )
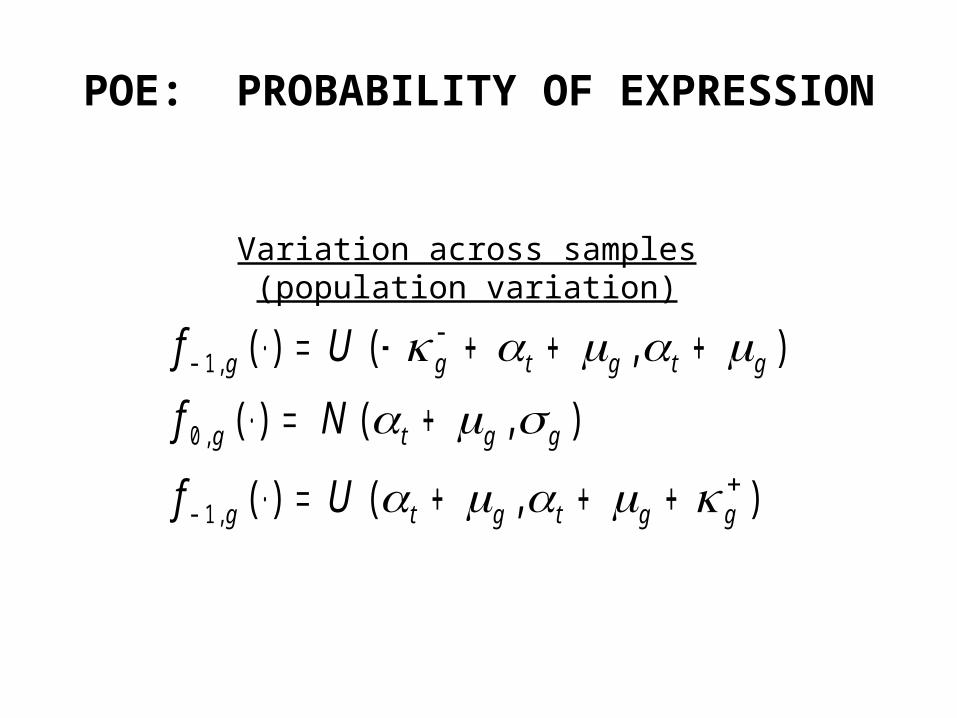
Variation across samples (population variation)
POE: PROBABILITY OF EXPRESSION
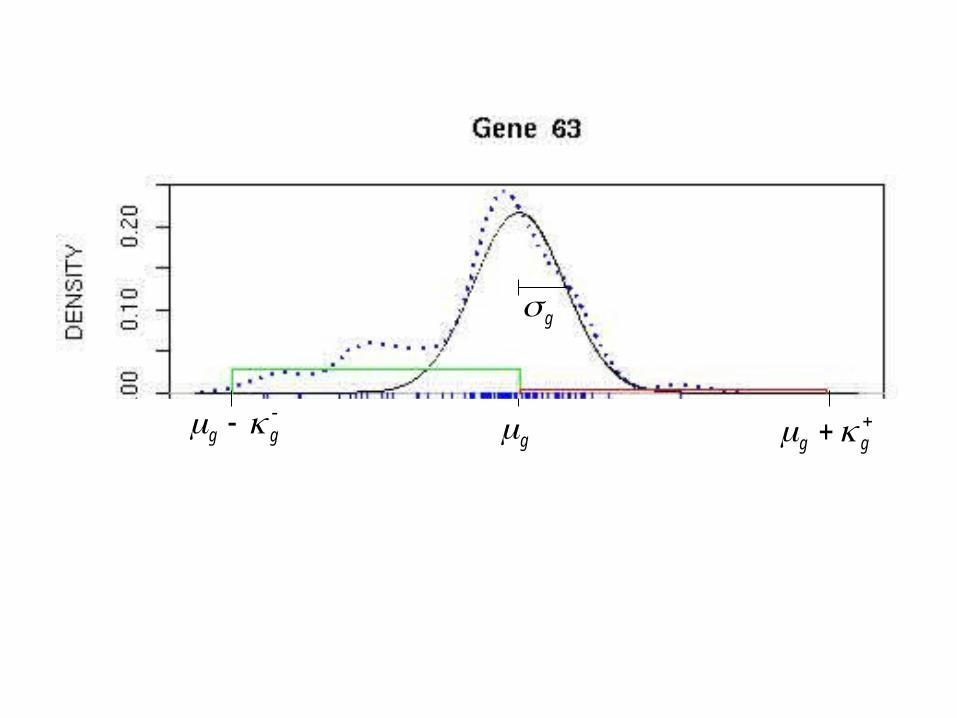
g g g g g
g
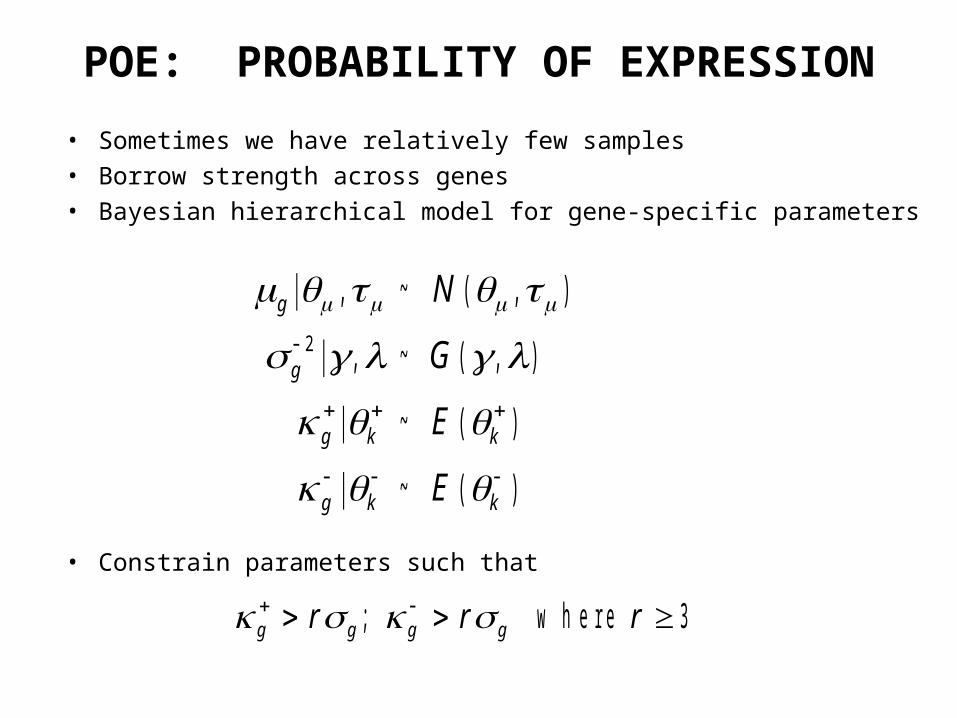
POE: PROBABILITY OF EXPRESSION
• Sometimes we have relatively few samples• Borrow strength across genes• Bayesian hierarchical model for gene-specific parameters
• Constrain parameters such that
g
g
g k k
g k k
N
G
E
E
| , ~ ( , )
| , ~ ( , )
| ~ ( )
| ~ ( )
2
g g g gr r r ; w h ere 3
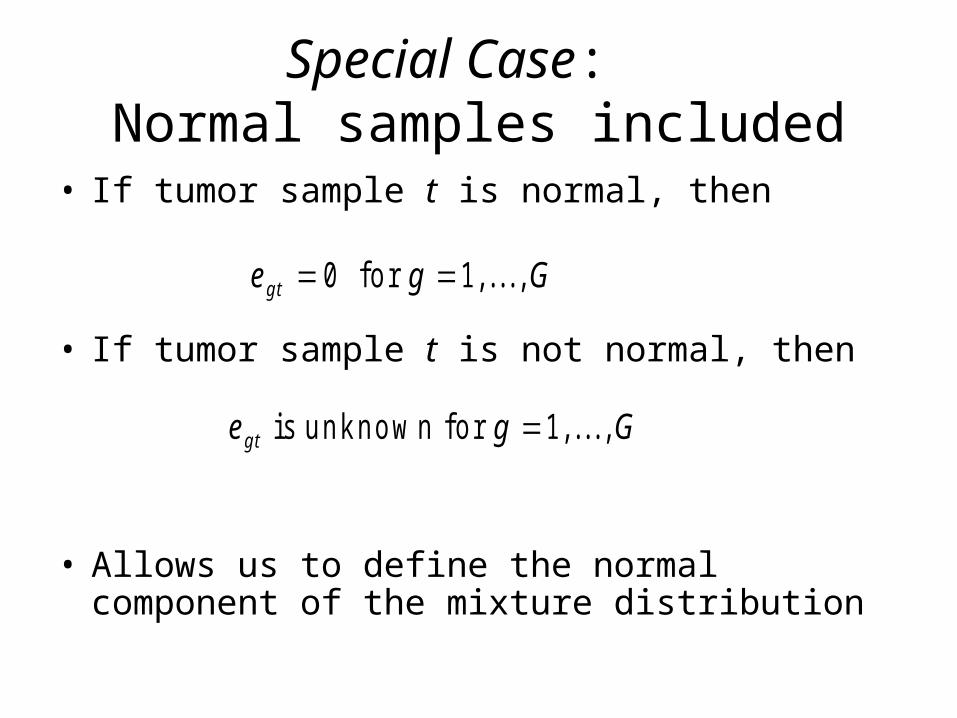
Special Case: Normal samples included
• If tumor sample t is normal, then
• If tumor sample t is not normal, then
• Allows us to define the normal component of the mixture distribution
e g Gg t 0 1 fo r , . . . ,
e g Gg t is u n k n o w n fo r 1, . . . ,
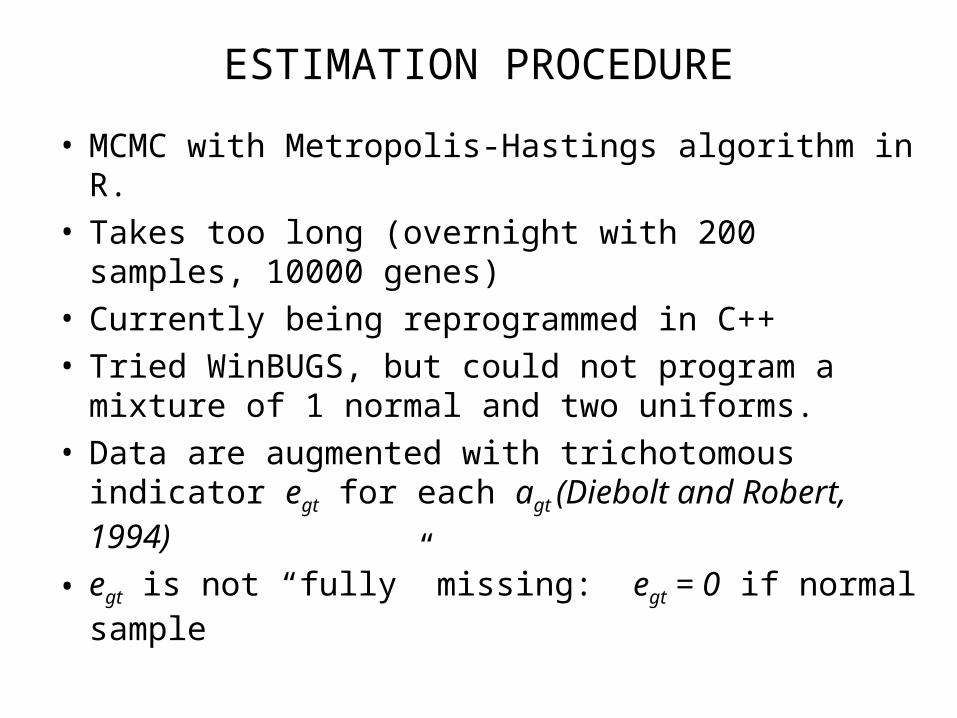
• MCMC with Metropolis-Hastings algorithm in R.• Takes too long (overnight with 200 samples,
10000 genes)• Currently being reprogrammed in C++• Tried WinBUGS, but could not program a mixture
of 1 normal and two uniforms.• Data are augmented with trichotomous indicator
egt for each agt (Diebolt and Robert, 1994)
• egt is not “fully” missing: egt = 0 if normal sample
ESTIMATION PROCEDURE
ESTIMATION PROCEDURE
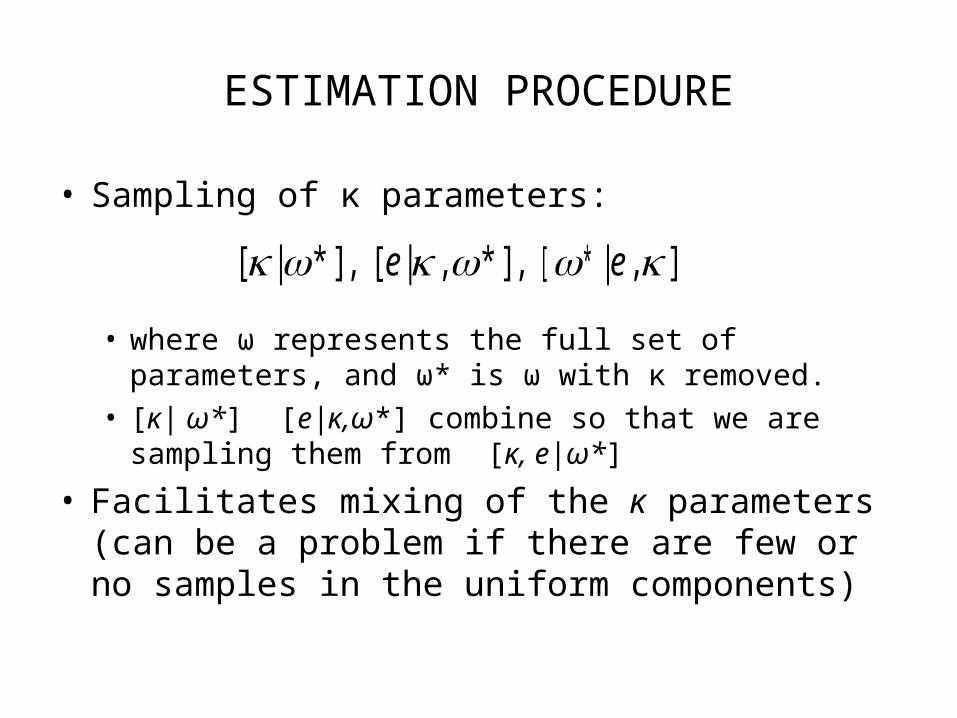
• Sampling of κ parameters:
• where ω represents the full set of parameters, and ω* is ω with κ removed.
• [κ| ω*] [e|κ,ω*] combine so that we are sampling them from [κ, e|ω*]
• Facilitates mixing of the κ parameters (can be a problem if there are few or no samples in the uniform components)
[ | * ], [ | , * ], | , ] [ *e e
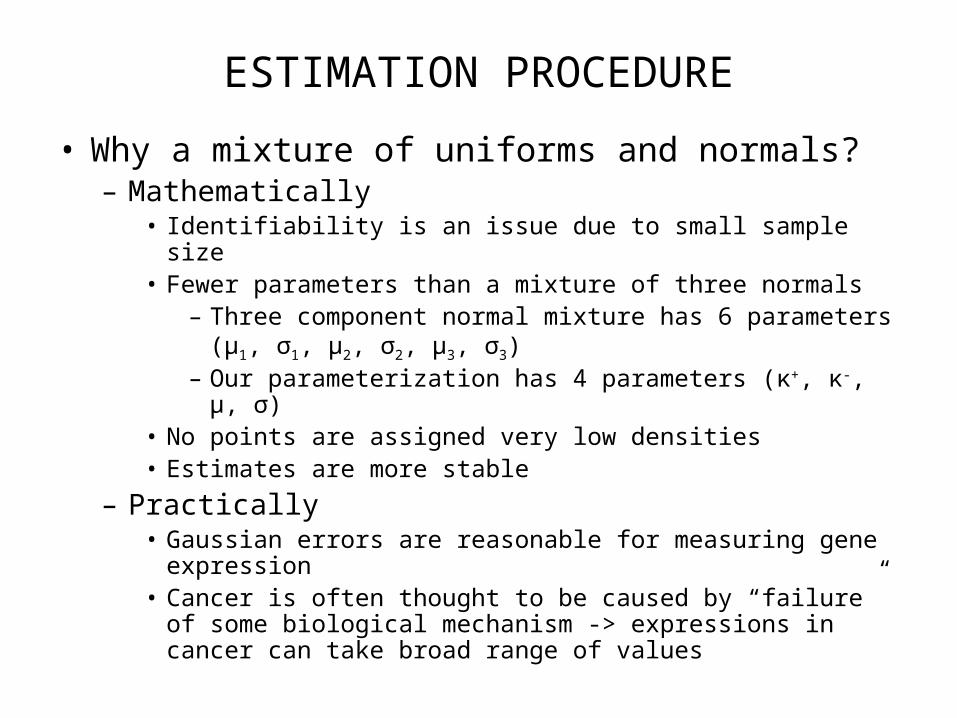
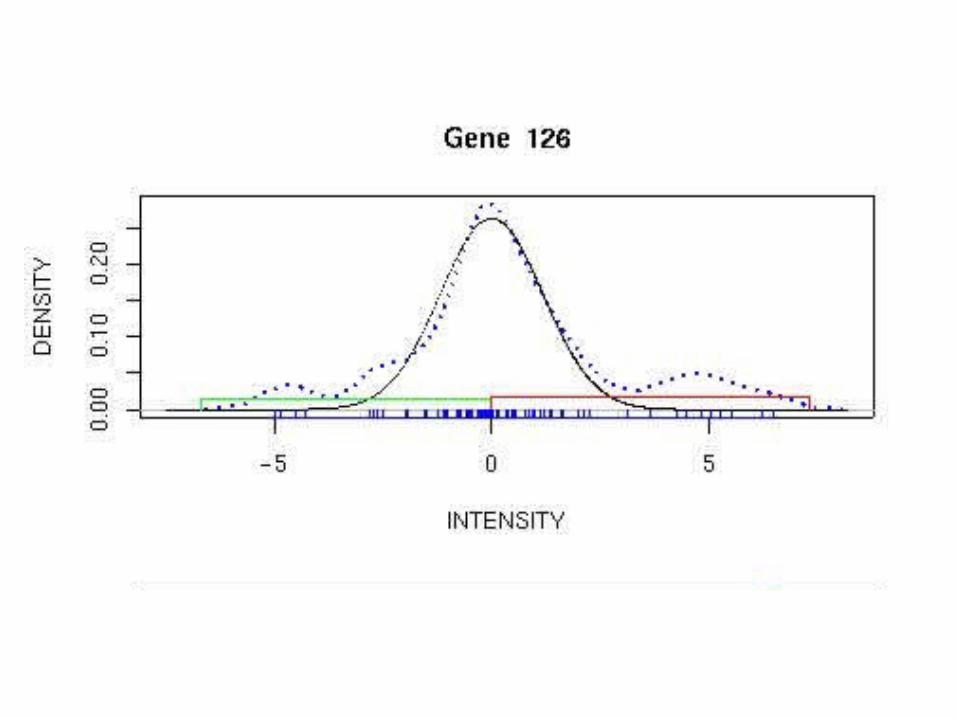
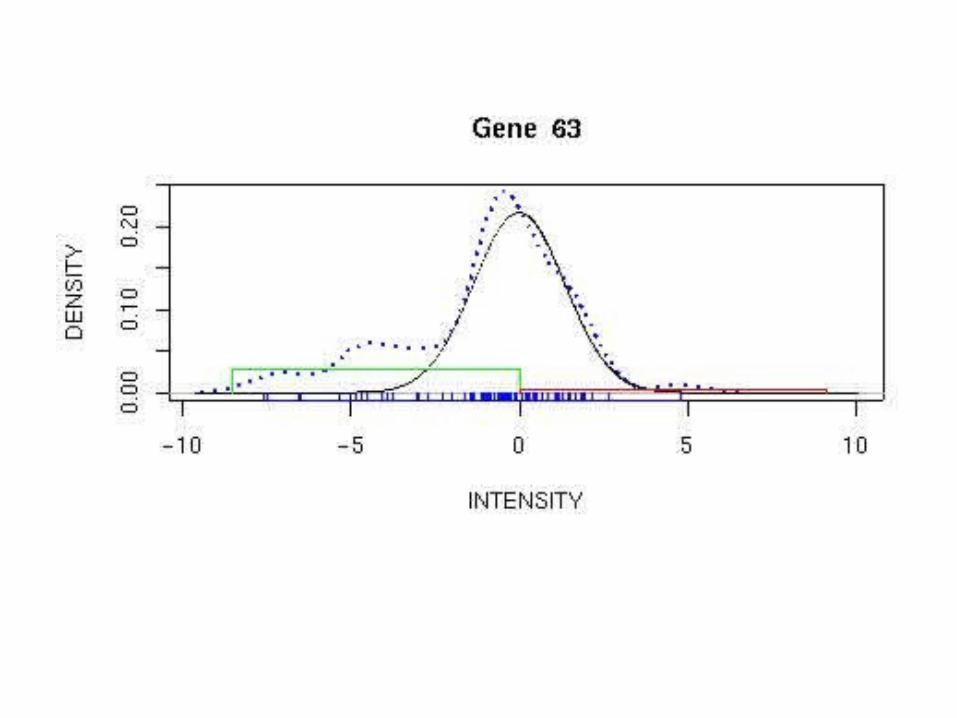
• Why a mixture of uniforms and normals?– Mathematically
• Identifiability is an issue due to small sample size• Fewer parameters than a mixture of three normals
– Three component normal mixture has 6 parameters (μ1, σ1, μ2, σ2, μ3, σ3)
– Our parameterization has 4 parameters (κ+, κ-, μ, σ)• No points are assigned very low densities• Estimates are more stable
– Practically• Gaussian errors are reasonable for measuring gene
expression• Cancer is often thought to be caused by “failure” of some
biological mechanism -> expressions in cancer can take broad range of values
ESTIMATION PROCEDURE
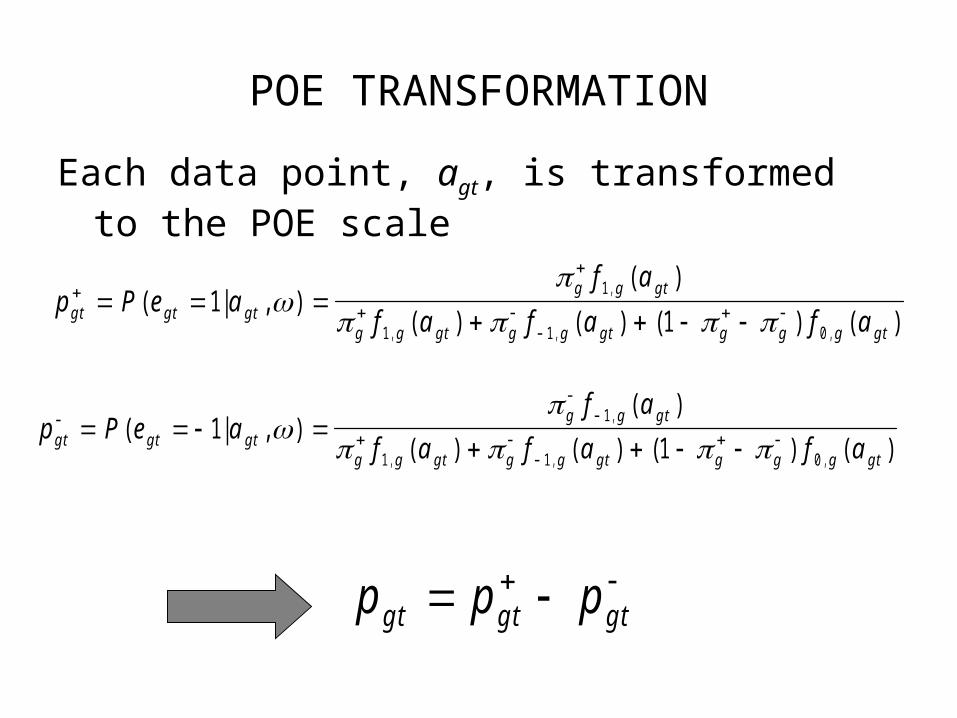
POE TRANSFORMATION
Each data point, agt, is transformed to the POE scale
p P e af a
f a f a f ag t g t g t
g g g t
g g g t g g g t g g g g t
( | , )( )
( ) ( ) ( ) ( ),
, , ,
11
1
1 1 0
p P e af a
f a f a f ag t g t g t
g g g t
g g g t g g g t g g g g t
( | , )
( )
( ) ( ) ( ) ( ),
, , ,
11
1
1 1 0
p p pg t g t g t
POE TRANSFORMATION
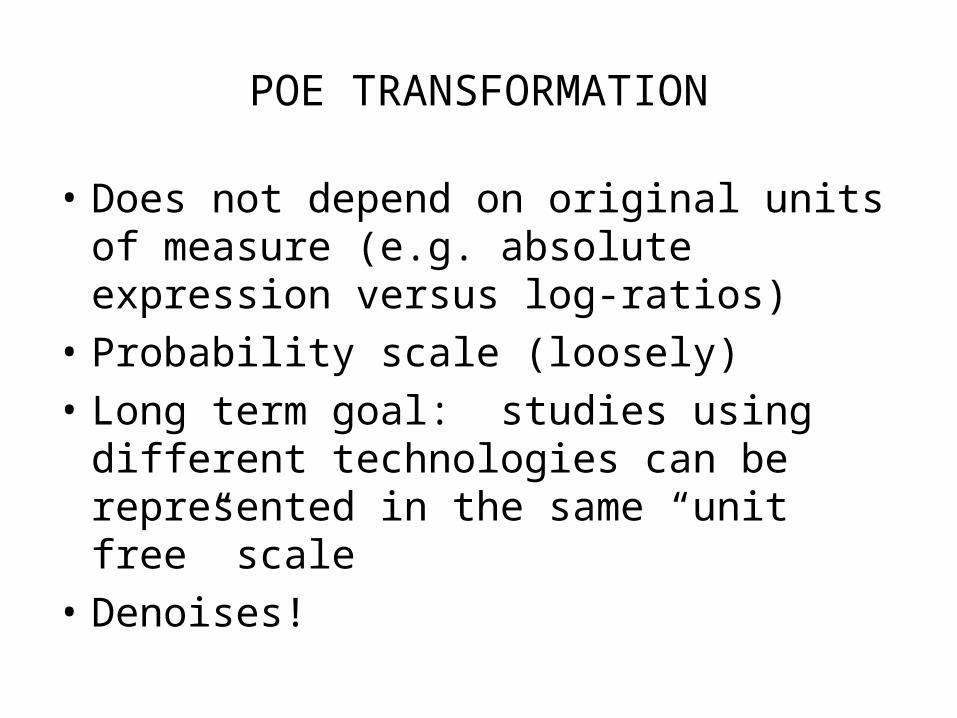
• Does not depend on original units of measure (e.g. absolute expression versus log-ratios)
• Probability scale (loosely)
• Long term goal: studies using different technologies can be represented in the same “unit free” scale
• Denoises!
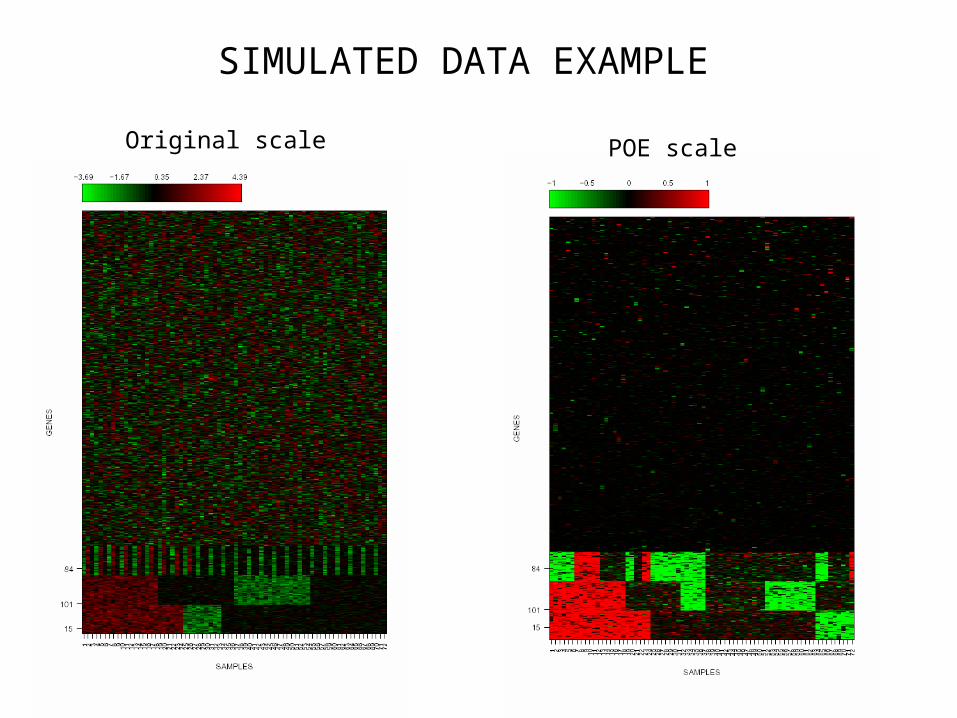
SIMULATED DATA EXAMPLE
Original scale POE scale
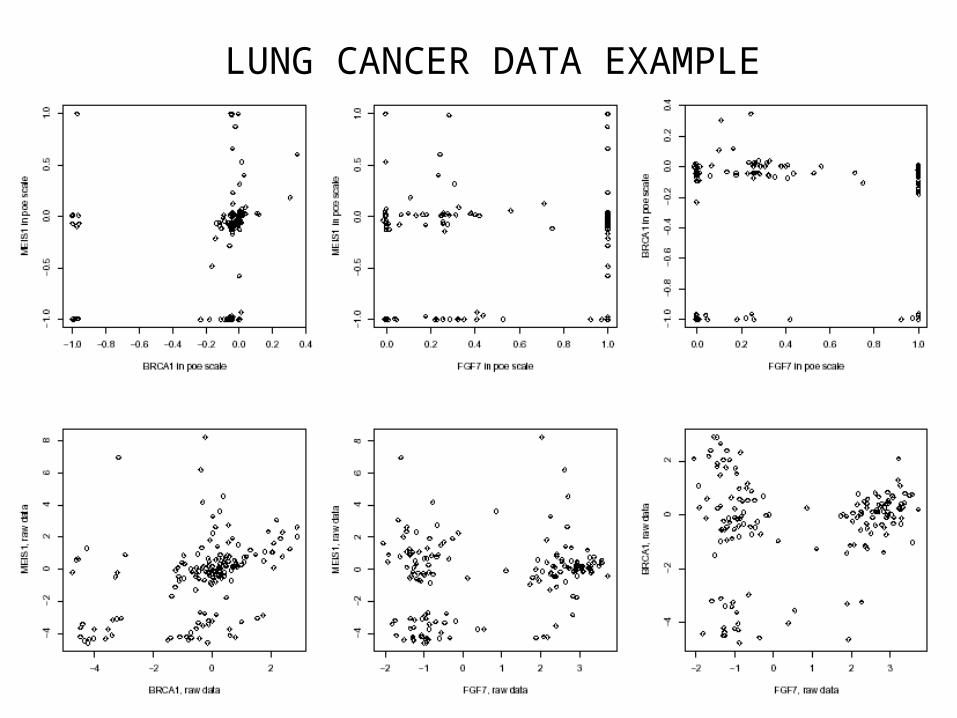
LUNG CANCER DATA EXAMPLE
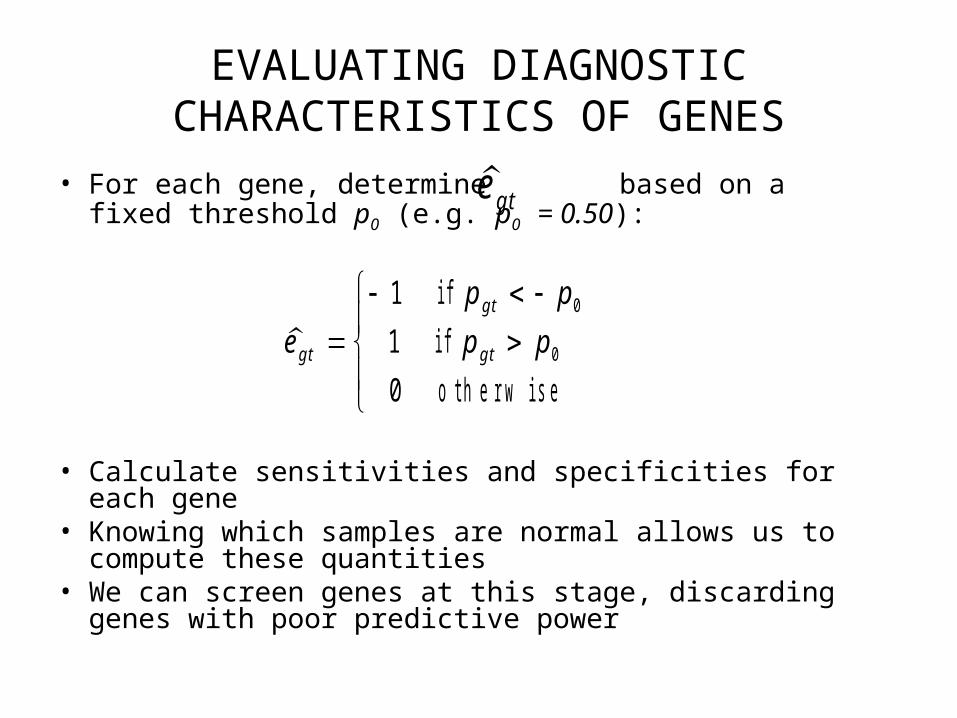
EVALUATING DIAGNOSTIC CHARACTERISTICS OF GENES
• For each gene, determine based on a fixed threshold p0 (e.g. p0 = 0.50):
• Calculate sensitivities and specificities for each gene• Knowing which samples are normal allows us to
compute these quantities• We can screen genes at this stage, discarding genes
with poor predictive power
e g t
ep p
p pg t
g t
g t
1
1
0
0
0
if
if
o th erw ise

EVALUATING DIAGNOSTIC CHARACTERISTICS OF GENES
ct
tt
1
0
sam p le is can cer
sam p le is n o rm al
sp P t g t
P e c
se P t g t
P e c
se P t g t
P e c
se P t g t
P e c
g
g t t
g
g t t
g
g t t
g
g t t
(
( | )
(
( | )
(
( | )
(
( | )
sam p le is c lassified as n o rm al b y g en e | sam p le is n o rm al)
sam p le is c lassified as d iffe ren tia l b y g en e | sam p le is can cer)
sam p le is c lassified as o v e rex p ressed b y g en e | sam p le is can cer)
sam p le is c lassified as u n d erex p ressed b y g en e | sam p le is can cer)
0 0
0 1
1 1
1 1
Assume
EVALUATING DIAGNOSTIC CHARACTERISTICS OF GENES
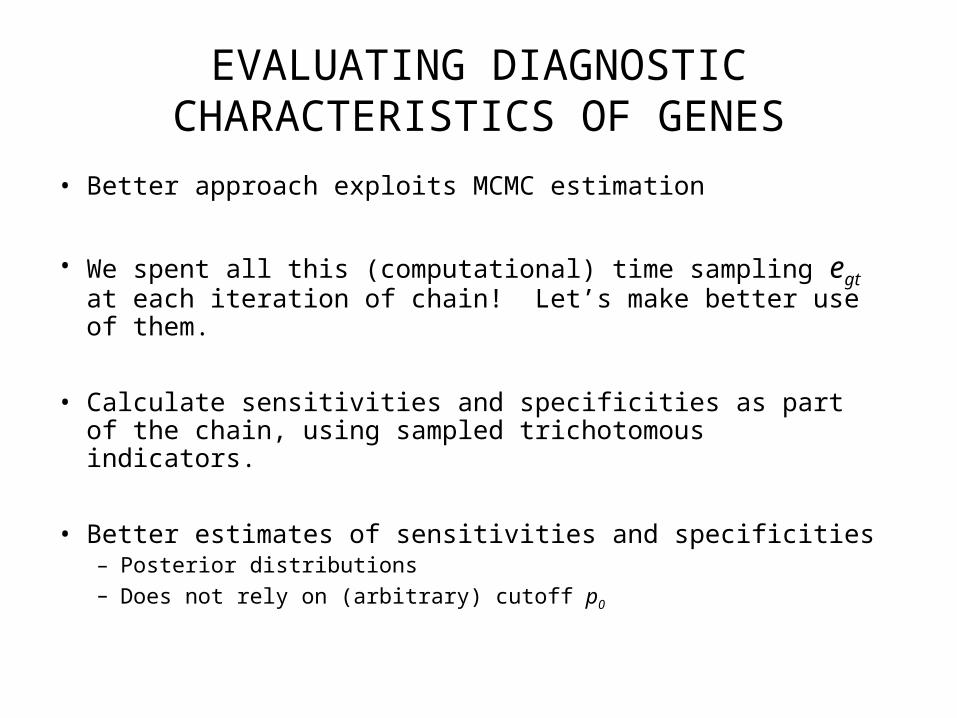
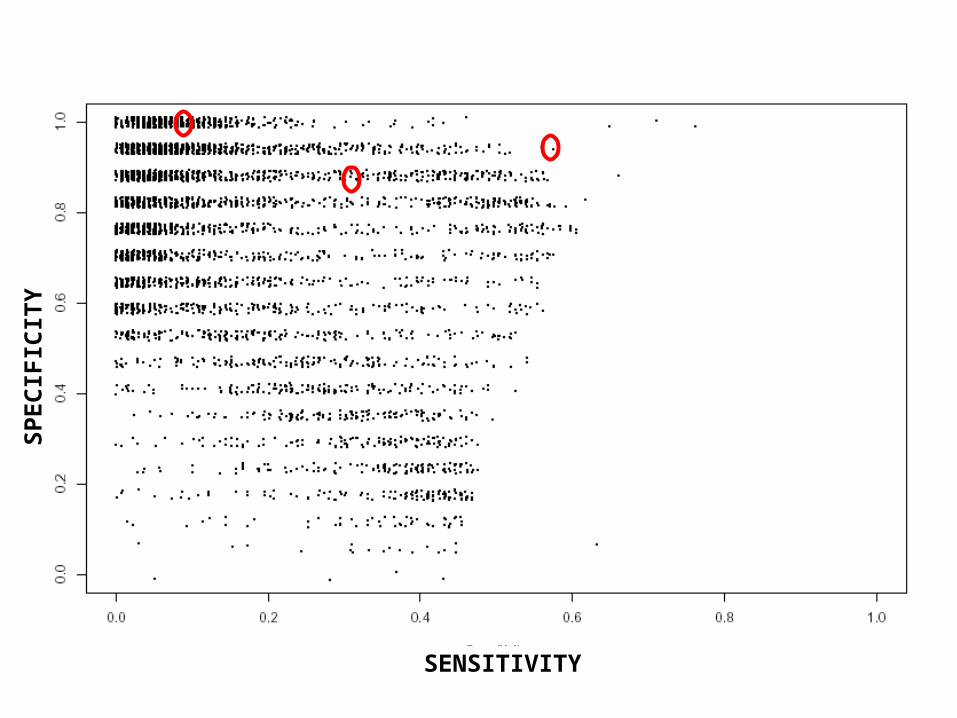
• Better approach exploits MCMC estimation
• We spent all this (computational) time sampling egt at each iteration of chain! Let’s make better use of them.
• Calculate sensitivities and specificities as part of the chain, using sampled trichotomous indicators.
• Better estimates of sensitivities and specificities – Posterior distributions– Does not rely on (arbitrary) cutoff p0
SENSITIVITY
SP
EC
IFIC
ITY
CLASSIFICATION: GENE MINING
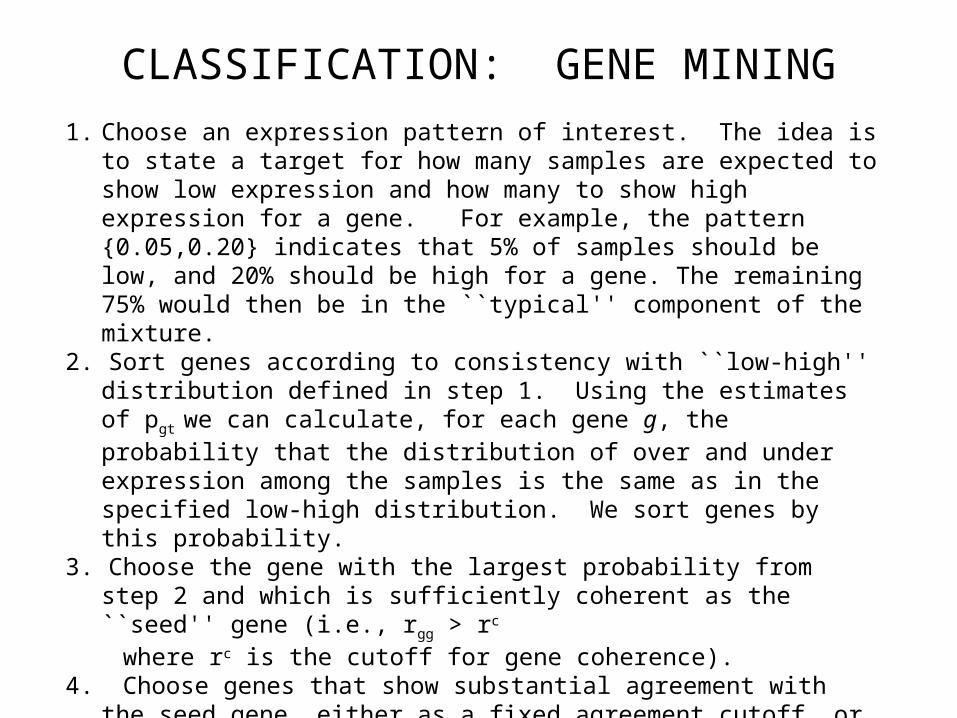
1. Choose an expression pattern of interest. The idea is to state a target for how many samples are expected to show low expression and how many to show high expression for a gene. For example, the pattern {0.05,0.20} indicates that 5% of samples should be low, and 20% should be high for a gene. The remaining 75% would then be in the ``typical'' component of the mixture.
2. Sort genes according to consistency with ``low-high'' distribution defined in step 1. Using the estimates of pgt we can calculate, for each gene g, the probability that the distribution of over and under expression among the samples is the same as in the specified low-high distribution. We sort genes by this probability.
3. Choose the gene with the largest probability from step 2 and which is sufficiently coherent as the ``seed'' gene (i.e., rgg > rc
where rc is the cutoff for gene coherence).4. Choose genes that show substantial agreement with the seed gene,
either as a fixed agreement cutoff, or as a proportion of coherence of the seed variable. Add these genes to the ``group'' which is seeded by gene chosen in step 3.
5. Remove the genes in the group defined in step 4 from further consideration. Repeat steps 3 and 4 to identify remaining groups.
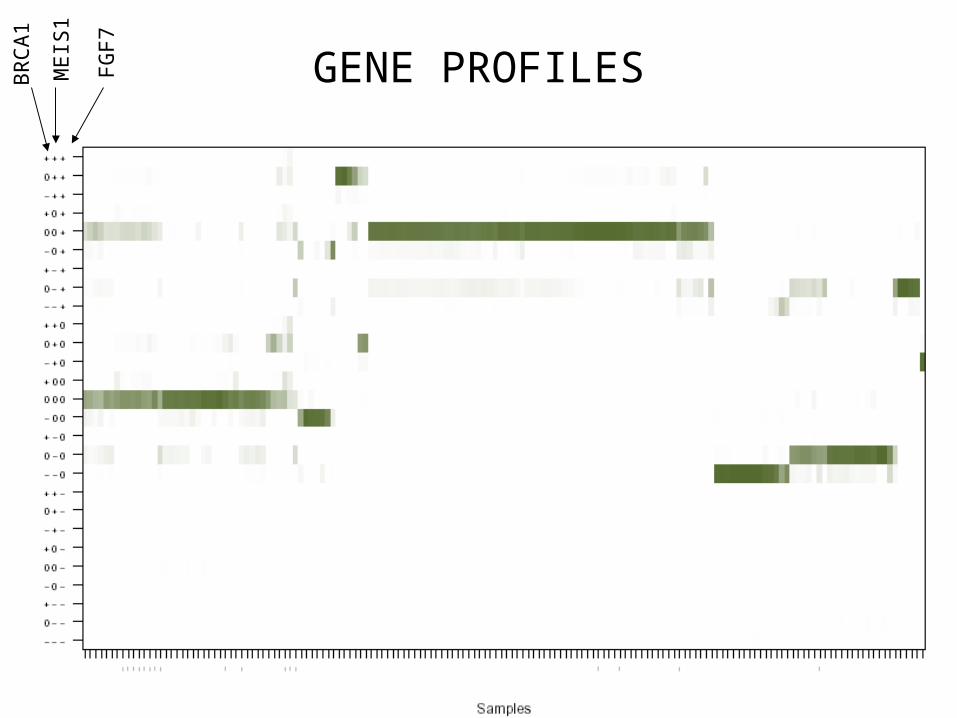
GENE PROFILES
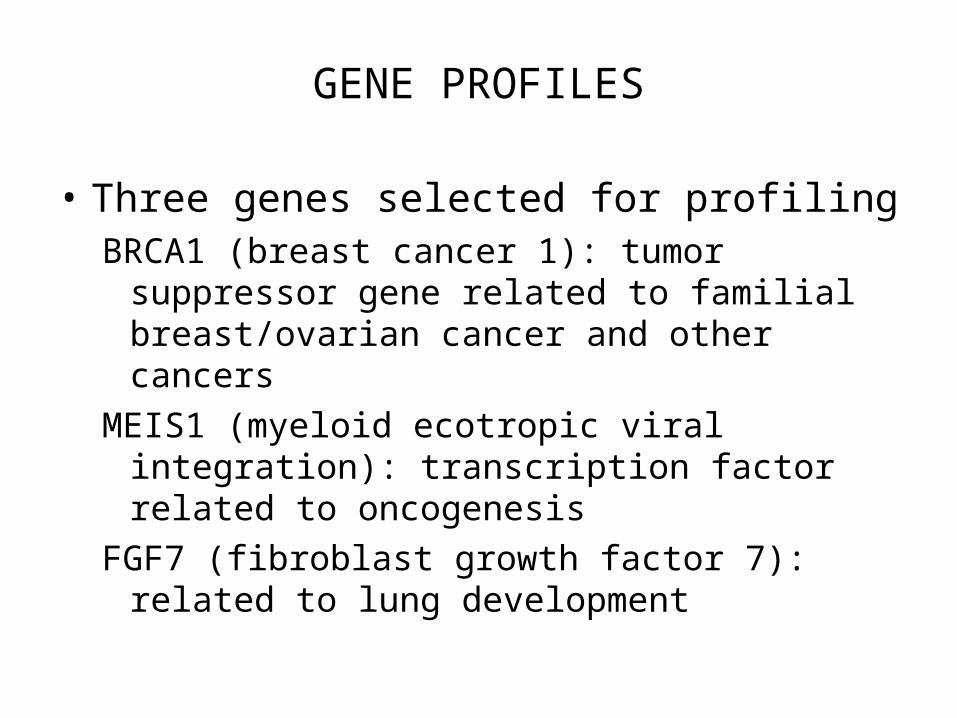
• Three genes selected for profilingBRCA1 (breast cancer 1): tumor suppressor
gene related to familial breast/ovarian cancer and other cancers
MEIS1 (myeloid ecotropic viral integration): transcription factor related to oncogenesis
FGF7 (fibroblast growth factor 7): related to lung development
GENE PROFILESBR
CA
1
ME
IS1
FG
F7
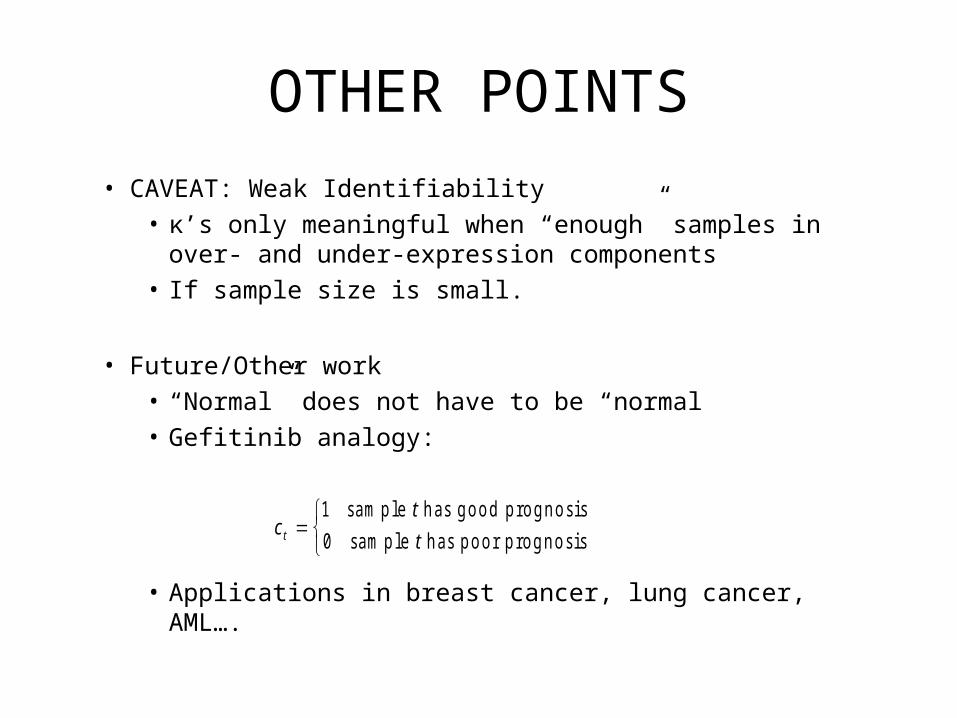
OTHER POINTS
• CAVEAT: Weak Identifiability• κ’s only meaningful when “enough” samples in over- and
under-expression components• If sample size is small.
• Future/Other work• “Normal” does not have to be “normal• Gefitinib analogy:
• Applications in breast cancer, lung cancer, AML….
ct
tt
1
0
sam p le h as g o o d p ro g n o sis
sam p le h as p o o r p ro g n o sis

ACKNOWLEDGEMENTS AND REFERENCES
Giovanni ParmigianiEd GabrielsonJiang Huang
Xiaogang Zhong
Garrett, E.S., Parmigiani, G. A nested unsupervised approach to identifying novel molecular subtypes. Bernoulli, 10(6), 2004.
Garrett, E.S., Parmigiani, G. POE: Statistical Methods for Qualitative Analysis of Gene Expression. In The Analysis of Gene Expression Data: Methods and Software (eds. G. Parmigiani, E.S. Garrett, R.A. Irizarry, S.L. Zeger) Chapter 16, Springer: New York, 2003.
Parmigiani, G., Garrett, E., Anbazhagan, R., Gabrielson, E. A Statistical Framework forExpression-Based Molecular Classification in Cancer. Journal of Royal Statistical Society, Series B, with discussion, 64: 717-736, 2002.
Scharpf, R., Garrett, E.S., Hu, J., Parmigiani, G. Statistical Modeling and Visualization of Molecular Profiles in Cancer. Biotechniques, 34: S22-S29, 2003.