a nationwide census on wifi security threats: prevalence
TRANSCRIPT

A Nationwide Census on WiFi Security Threats:Prevalence, Riskiness, and the Economics
Di Gao1∗, Hao Lin1∗, Zhenhua Li1, Feng Qian2, Qi Alfred Chen3
Zhiyun Qian4, Wei Liu1, Liangyi Gong1, Yunhao Liu11Tsinghua University, China 2University of Minnesota, Twin Cities, USA
3University of California, Irvine, USA 4University of California, Riverside, USA
ABSTRACT
Carrying over 75% of the last-mile mobile Internet traffic, WiFi
has inevitably become an enticing target for various security threats.
In this work, we characterize a wide variety of real-world WiFi
threats at an unprecedented scale, involving 19 million WiFi access
points (APs) mostly located in China, by deploying a crowdsourced
security checking system on 14 million mobile devices in the wild.
Leveraging the collected data, we reveal the landscape of nationwide
WiFi threats for the first time. We find that the prevalence, riskiness,
and breakdown of WiFi threats deviate significantly from common
understandings and prior studies. In particular, we detect attacks
at around 4% of all WiFi APs, uncover that most WiFi attacks are
driven by an underground economy, and provide strong evidence
of web analytics platforms being the bottleneck of its monetization
chain. Further, we provide insightful guidance for defending against
WiFi attacks at scale, and some of our efforts have already yielded
real-world impact—effectively disrupted the WiFi attack ecosystem.
CCS CONCEPTS
• Security and privacy → Mobile and wireless security; Econom-
ics of security and privacy.
KEYWORDS
WiFi & Mobile Security; Threat Ecosystem; Countermeasures.
ACM Reference Format:
Di Gao, Hao Lin, Zhenhua Li, Feng Qian, Qi Alfred Chen, Zhiyun Qian,
Wei Liu, Liangyi Gong, Yunhao Liu. 2021. A Nationwide Census on WiFi
Security Threats: Prevalence, Riskiness, and the Economics. In The 27th
Annual International Conference on Mobile Computing and Networking
(ACM MobiCom ’21), October 25–29, 2021, New Orleans, LA, USA. ACM,
New York, NY, USA, 14 pages. https://doi.org/10.1145/3447993.3448620
1 INTRODUCTION
More than 75% of the last-mile Internet traffic of today’s mobile sys-
tems is delivered via WiFi [29], which thereby has also become an
∗Co-primary authors. Zhenhua Li is the corresponding author.
Permission to make digital or hard copies of all or part of this work for personal orclassroom use is granted without fee provided that copies are not made or distributedfor profit or commercial advantage and that copies bear this notice and the full citationon the first page. Copyrights for components of this work owned by others than ACMmust be honored. Abstracting with credit is permitted. To copy otherwise, or republish,to post on servers or to redistribute to lists, requires prior specific permission and/or afee. Request permissions from [email protected].
ACM MobiCom ’21, October 25–29, 2021, New Orleans, LA, USA
© 2021 Association for Computing Machinery.ACM ISBN 978-1-4503-8342-4/21/10. . . $15.00https://doi.org/10.1145/3447993.3448620
enticing target for various security threats [15, 45, 88]. Criminals ex-
ploit security vulnerabilities of WiFi access points (APs) [4, 55, 88]
to eavesdrop on wireless traffic [27], to launch phishing attacks
through DNS hijacking [15], and to directly generate profits through
cryptojacking [45]. Furthermore, adversaries not only compromise
existing WiFi APs, but also deploy malicious WiFi-based edge de-
vices [40, 51]. Currently, WiFi-based attacks have become nation-
wide security threats, affecting hundreds of millions of end users.
Census Methodology. To comprehensively understand nationwide
WiFi threats, we take a unique opportunity to collaborate with WiFi-
Manager (actual name anonymized), a crowdsourcing-based WiFi
discovery and management service used by 800+ million (M) An-
droid devices across 200+ countries/regions. It helps Android sys-
tems automatically discover accessible WiFi APs with Internet con-
nectivity, by crowdsourcing the connectivity information and sta-
tistics contributed by the numerous live devices—each user device
serves as a tester for a given WiFi AP. Leveraging this massive-scale
crowdsourcing platform, we build a WiFi security checking system,
which we call WiSC (WiFi Security Checker), integrated in WiFi-
Manager as an optional function. WiSC enables us to measure a
wide variety of real-world WiFi threats at an unprecedented scale.
Running on a massive number of heterogeneous mobile devices
requires WiSC to address three challenges: 1) no root privilege ac-
cess, as WiFiManager needs to be a pure user-space app to register
wide deployment; 2) achieving a good detection coverage while
maintaining high precision, both being crucial to a comprehensive
and in-depth understanding of the WiFi threat ecosystem; and 3) no
long-term traffic monitoring to avoid excessive resource consump-
tion on mobile devices and to minimize users’ privacy concerns.
To tackle these issues, we judiciously engineer our attack detec-
tion framework. Deployed atop a regular Android app, WiSC utilizes
generic system APIs with limited system privileges to detect attacks
on both LAN and WAN. As a result, our threat model targets attacks
mainly occurring at upper layers, including ARP/DHCP spoofing
in LAN and TCP/DNS hijacking in WAN; for other attacks oper-
ating at the MAC/PHY layer, we cannot detect them since WiSC
has no privileged access to WiFi modem and other hardware com-
ponents. To balance the detection accuracy and resource overhead,
WiSC conducts the detection through a novel two-stage pipeline,
by first capturing suspicious attacks in a fast and resource-efficient
manner, followed by a more detailed scrutiny to rule out possible
false positives. Specifically, for LAN-side attacks, WiSC performs
cross-connection gateway-consistency detection (§2.2) by leverag-
ing a common usage scenario where user devices are repeatedly
connected to the same AP; it overcomes limitations in traditional
detection schemes [26, 58]. For WAN-side attacks, we develop a

cross-layer decoy-based detection scheme (§2.3), where we instru-
ment carefully-crafted decoy packets to extensively trigger primary
WAN attacks and analyze the attack risks by synthesizing cross-layer
information. Combining the above efforts, WiSC manages to realize
accurate attack detection on commodity Android devices within 5
seconds, incurring less than 10 KB of network traffic.
Under user consent and a well-established IRB, WiSC collected
measurement data from 14M user devices upon 19M WiFi APs,
over a period of six months (10/2018 – 04/2019). The data analysis
enabled us to develop a holistic understanding of WiFi threats, with
a number of novel insights.
Prevalence and Riskiness. We detect attacks at 3.92% of the ex-
amined WiFi APs. The percentage is significantly higher than those
(0.21%–1.5%) reported by small-scale studies [67, 69]. A key reason
is that prior studies omit attacks that are considered difficult to launch
given today’s seemingly strengthened mobile OS and network proto-
cols. In particular, common sense suggests that given the increasing
adoption of HTTPS, web content manipulation such as advertise-
ment (ad) injection is unlikely to occur. Nevertheless, our findings
indicate that the majority (55%) of our detected attacks remain ad
injections. We attribute this to the prevalent misconfigurations of
HTTPS in the real world. We find (and confirm through controlled
experiments) that ad injections can be successfully launched to-
wards popular HTTPS-equipped content providers (e.g., TMall [83],
BBC [11], and Shopify [71]) due to improper HTTPS configura-
tions. For example, a lack of HTTP Strict Transport Security (HSTS)
allows an HTTPS session to fall back to HTTP, making SSL/TLS
stripping attack and henceforth ad injection feasible. Worse still,
even among equipped with HSTS, most do not properly configure
the HSTS parameters (e.g., timeout threshold and preload list).
Counter-intuitively, we notice that ad injections are more likely to
occur on better protected APs: 2.3% of the APs using strong encryp-
tion (WPA/WPA2) vs. 1% of the APs with no or weak encryption
(WEP). We attribute this to the statistically better Internet connec-
tivity of the APs with stronger encryption. The results indicate that
common practices for enhancing WiFi security are not that effective
when confronting today’s sophisticated, mature cybercrime market.
Within the LAN, we identify both ARP and DHCP spoofings.
While ARP spoofing has been reported before [24, 84], DHCP spoof-
ing was mostly deemed as a hypothetical form of attack under WiFi
environments due to the high cost of launching it [56, 87]. Nonethe-
less, our observation refutes this by revealing that DHCP spoofing
is as feasible as other popular attacks in practice. We observe a
considerable fraction (25%) of APs are subject to poor network
connectivity with user devices, and such poor network conditions
substantially increase the success rate of DHCP spoofing.
Economics Behind. Next, we go beyond basic characterizations
by revealing the economics behind WiFi threats: what are attackers’
key decisions for maximizing their profits? A major finding is that
APs under LAN attacks (ARP/DHCP spoofing) exhibit significant
physical movements (median of 724 m) during our measurement;
in comparison, APs under WAN attacks and benign APs are quite
stationary (median of 31 m and 21 m respectively). This can be
explained by our observation that LAN attacks are more likely to
succeed under poor LAN environments, which in turn can easily
arouse network administrators’ vigilance and defensive measures.
Web Server
Web Page
Malicious WiFi AP Client
Adversary /
Ad-serving Platform
Web Analytics
PlatformAdvertiser
Signed
Analytics
Ad Statistics
Advertisement
Ad Injection
Web Page with Ad
Signed
Analytics
Analytics Request
Money
①
②
③
④
⑤
⑥
⑦⑧
⑨
(HTTP or HTTPS) (HTTP or HTTPS)
Figure 1: The underground ecosystem of WiFi attacks uncov-
ered by our census. Advertisers pay the adversaries typically
based on the ad-effect reports generated and signed by third-
party, legitimate web analytics platforms.
Thus, adversaries need to strategically relocate to increase the suc-
cess rate and evade detection. Notably, 10% of the APs under LAN
attacks even manifest a clear pattern of shifting among several loca-
tions, forming one or multiple loops.
Perhaps more surprisingly, we notice that most adversaries do not
inject ads to every web page visited by a victim user. Instead, they
opportunistically perform ad injections at a low probability of ∼17%.
The rationale for such “low-rate” attacks is that high-frequency ad in-
jections are more likely to incur users’ complaints and henceforth AP
reset, AP firmware upgrade, or even AP disconnection, causing the
attacker to lose the compromised AP. The attacker therefore needs to
tune the injection frequency to maximize the profit. We mathemati-
cally model the attacker’s revenue, and find that the modeling results
well support our hypothesis—the maximum profit appears at an ad
injection probability of 15%, close to the measurement observation
(17% on average).
Further, our end-to-end analysis on ad-injection attack unravels
its underground ecosystem centered around the monetization chain.
As depicted in Figure 1, adversaries first collect ad requirements
from advertisers ( 1○), and then distribute visible ads to victim users
via compromised or maliciously deployed APs ( 2○ 3○ 4○); after that,
according to the ad-effect reports generated and signed by web ana-
lytics platforms ( 5○ 6○ 7○ 8○), adversaries get paid by the advertisers
( 9○). Our key insight is that the legitimate web analytics platforms
are abused by the attackers; however, they are also the bottlenecks
(i.e., “cut points”) in the monetization chain—almost all of the in-
jected ads are monetized using only four web analytics platforms.
We have reported our findings to the four platforms, leading to defen-
sive intervention that effectively disrupted the WiFi attack ecosystem.
For example, Baidu Analytics have responded to us and stopped
serving 67% of the reported ad links, leading to 49.8% of decrease
of ad injections as of August 2020.
Broader Impact. We acknowledge that most of the WiFi APs in
our study are located in China. It is worth mentioning that we also
detect extensive WiFi attacks in many other countries where WiFi-
Manager is widely used. In some countries (e.g., Burma and Russia),
the fraction of malicious APs is even larger than 4%, as shown in
Table 2. Hence, we feel that our study also provides valuable in-
sights for combating WiFi security threats outside China. Owing to

its prominent impact in understanding and mitigating WiFi threats
in the wild, WiSC is now an official component of the production
WiFiManager system.
2 STUDY METHODOLOGY
We first outline how the WiSC system works (§2.1). We then explain
in detail our detection schemes for LAN (§2.2) and WAN (§2.3)
attacks. Finally, we describe our large-scale deployment (§2.5).
2.1 WiSC System Overview
To address the three design challenges mentioned in §1, we develop
a novel two-stage pipeline to detect the abovementioned LAN and
WAN attacks. It first efficiently captures suspicious events, and then
scrutinizes them to remove false positives, thus ensuring a high de-
tection accuracy and low resource footprint. WiSC’s architecture is
illustrated in Figure 2. On the UI (user interface) of WiFiManager
there is a “Security Checking” button 1; once clicked, WiSC starts
the LAN attack detection (§2.2) by first retrieving (Step 1○) and
then examining (Step 2○) related LAN information. To detect WAN
attacks (§2.3), WiSC first performs a transport-layer detection (Step
3○) by sending decoy IP packets to the connected AP to determine
whether it is suspicious. For a suspicious AP, WiSC further launches
the application-layer detection (Step 4○) to rule out possible false
positives, by checking DNS responses and modifications to an in-
strumented decoy web page from our own server. The detection
results, along with the LAN information, received responses of sent
decoys, and the device’s location data collected via GPS or cellular
base-station localization, are then encrypted and uploaded via the
connected AP to our log server (Step 5○ 6○).
Ethical Consideration. All analysis tasks in this study comply with
the agreement established between WiFiManager and its users. The
users who participated in the study opted-in as volunteers with in-
formed consent; the analysis was conducted under a well-established
IRB, and no personally identifiable information such as phone num-
ber was collected. We never (and have no way to) link collected data
such as BSSID and device location to users’ true identities.
2.2 LAN Attack Detection
To detect LAN-side attacks, we develop a novel method called cross-
connection gateway-consistency detection. Our scheme first broad-
casts ARP Request messages to all the hosts within a subnet to
retrieve the LAN information and configurations of the examined
AP, and then runs consistency checking with cross-connection and
historic data to accurately detect the attacks. As to be detailed shortly,
in real-world operational scenarios, such additional data help to rule
out various false positives that traditional detection methods (e.g.,
ARP cache consistency checking [26]) may fall into.
ARP Spoofing Detection. A user device leverages ARP to map
the IP address of another device in the LAN to its corresponding
MAC address. In ARP spoofing, a local network attacker broadcasts
1We cannot directly initiate security checking since this action violates the user agree-ment established between WiFiManager and its users. However, we note that this designmay introduce certain bias into our dataset since users (probably professional ones) mayhave already noticed abnormality before they intentionally launch security checks.
Upload
Broadcast to
Retrieve LAN Info
ServerLog Server
WAN Attack DetectionLAN Attack Detection
Client
Cloud
WiFiManager
Log & Encrypt
Detection Result
Upload
①
⑥
Detection Result
Transport-layer
Detection
Application-layer
Detection
Application-layer
Detection
Consistency
Checking② ③
④
④
⑤⑤
⑥
Figure 2: Workflow of WiSC, which crowdsourced data from
WiFiManager users for WiFi security checking.
ConnectionEstablishment
Record (IP0, MAC0)
User Clicks “SecurityChecking” Button
Record(IP1, MAC1)
ARP Spoofing
MAC0 ≠ MAC1
IP0 = IP1
Benign
No
Yes
One MAC →
Two IPs?
Compare (IP0, MAC0) with
(IP1, MAC1)
Else
Update ARP Cache Table
Figure 3: Workflow of our ARP spoofing detection.
spoofed ARP Response messages that associate her own MAC ad-
dress with the gateway’s IP address [58]. If the user device accepts
such messages, its future local network traffic will be directed to the
attacker instead of the actual gateway.
Our detection is performed by examining changes in the gateway’s
(IP, MAC) address pair, a classic method for detecting ARP spoofing.
As depicted in Figure 3, when a user device initially connects to
an AP, the client of WiSC records the gateway’s (IP, MAC) address
pair by scanning the user device’s ARP cache table, denoted as (IP0,
MAC0). Then when performing security checking, we compare the
current gateway’s (IP, MAC) address pair, denoted as (IP1, MAC1),
with the recorded one. However, this consistency checking [26] is
prone to false positives stemming from ARP cache eviction [54].
Thus, before security checking, we update the user device’s ARP
cache table by querying for the corresponding MAC addresses of
all the possible IP addresses in the subnet, and then record each (IP,
MAC) address pair when it is updated, so as to prevent ARP cache
eviction from affecting our results. If the gateway’s MAC address
changes but the associated IP address remains (MAC0 ≠ MAC1 and
IP0 = IP1), we determine that the AP is under ARP spoofing.
It is worth noting that when the criterion above does not hold, it
is still possible that the AP is under ARP spoofing—the AP may
have already been compromised at the connection establishment (AP
association) time (i.e., MAC0 is already the attacker’s MAC address
and thus equals to MAC1). In this case, the gateway’s IP address and
the attacker’s own IP address should have been both mapped to the
attacker’s MAC address. Thus, if we find that there exists a MAC
address mapped to two different IP addresses in the ARP cache table,
we also conclude that the AP is under ARP spoofing.

ConnectionEstablishment
Benign
Else
DHCP Spoofing
MAC0 ≠ MAC1
IP0 ≠ IP1
Yes
No
No
User Clicks “SecurityChecking” Button
Record(IP1, MAC1)
(IP0, MAC0) from the Last-time
Secure Connection
Compare (IP0, MAC0) with
(IP1, MAC1)
Yes
BSSID = MAC0?BSSID = MAC0?
MAC0 in the ARP Cache Table?
MAC0 in the ARP Cache Table?
Update ARP Cache Table
Figure 4: Workflow of our DHCP spoofing detection.
DHCP Spoofing Detection. When a user device connects to an AP,
it first broadcasts DHCP Discovery messages within the LAN to
acquire the gateway’s IP address. In DHCP spoofing, upon receiving
such messages, the attacker sends spoofed DHCP Offer messages
claiming that her own IP address is the gateway’s IP address [77]. If
the spoofed messages reach the user device earlier than the legitimate
ones and are accepted, the attacker can intercept its future traffic.
To detect DHCP spoofing, one direct solution is to examine
changes in the gateway’s IP address recorded by the user device [26].
However, this does not work in practice since in the design of DHCP,
neither does the gateway periodically broadcast its IP address within
the LAN, nor does the user device periodically query to check/update
the gateway’s IP address. Another solution proposed in prior work
is to detect DHCP spoofing by continuously monitoring duplicate
DHCP messages within the LAN [66], but this requires root privi-
leges and incurs enormous overhead on the user device. To the best
of our knowledge, there is no existing method that can detect DHCP
spoofing without root privileges.
To address these, we design a novel cross-connection approach
that compares the current gateway’s address pair (IP1, MAC1) with
the gateway’s address pair (IP0, MAC0) recorded in the last-time
secure connection, as depicted in Figure 4. We define last-time secure
connection as the user device’s latest connection to the examined
AP, i.e., with the same BSSID,2 when the connection is determined
by WiSC as benign; occasionally, if there are no benign connections
recorded for the AP, we simply use the latest connection. Then, if
the gateway’s IP and MAC addresses have both changed (MAC0 ≠
MAC1 and IP0 ≠ IP1), we suspect that the examined AP is under
DHCP spoofing. Note that switching to another WiFi network will
not trigger this suspicious case, as the last-time secure connection
ensures that the user device connects to the same network (i.e., with
the same BSSID).
In the above suspicious case, it is possible that the gateway’s
changes in IP and MAC addresses are benign—such changes might
be legitimately performed by network administrators. To address
this issue, we add additional logic shown in Figure 4. We check
whether the AP was used as the gateway in the last-time secure
connection—this can be identified by checking whether the AP’s
2A BSSID (Basic Service Set Identifier) is derived from the AP’s MAC address, andthey are usually identical except when the AP supports multiple service sets [25]. If theAP supports multiple service sets, the BSSID of one of the service sets will be identicalwith the AP’s MAC address.
BSSID equals the gateway’s MAC address (BSSID = MAC0). If
true, it is certain that the AP’s MAC address is used as its BSSID
(a common practice) and thus the AP’s MAC address is MAC0.
Since MAC0 is the gateway’s MAC address in the last-time secure
connection, we can then confirm that the AP was used as the gateway.
Provided that the AP was used as the gateway according to the
above examination, and the gateway’s changes (in IP and MAC
addresses) are legitimate, the AP’s IP address should stay in the
same subnet with the user device’s IP address. This is because the
802.11 standard declares that only one logical network segment (i.e.,
one IP subnet) can exist under a Basic Service Set (BSS, including
all the devices connected to the AP and the AP itself) [25]. Since
the AP’s IP address and the user device’s IP address are in the same
subnet, and ARP cache table update is performed at the beginning
of our examination, MAC0 should show up in the user device’s ARP
cache table. On the other hand, if the gateway’s changes are caused
by DHCP spoofing, this may not hold because a stealthy attacker
often uses a different subnet for her new gateway (otherwise address
conflict will occur as the attacker does not know which addresses
have been allocated by the real gateway). Thus, if MAC0 is not in
the user device’s ARP cache table, we can rule out the possibility
of legitimate gateway changes, and conclude that the AP is under
DHCP spoofing.
Trade-offs Made in LAN Attack Detection. In our design, we
make several trade-offs to achieve our goal of high precision without
root privileges and long-term passive traffic monitoring. In ARP
spoofing detection, we assume the adversary does not deliberately
hide herself from other devices in the LAN by fabricating their MAC
addresses or concealing their IP addresses, since the only known
effective method to uncover this is continuously and passively moni-
toring all broadcasts within the LAN. In DHCP spoofing detection,
we conservatively determine all APs not being used as gateways
(which account for 12.2% of all APs) as benign to ensure the de-
tection precision. Further, our cross-connection approach does not
need root privileges or long-term passive monitoring, but can only
examine the cases when user devices are repeatedly connected to
the same AP, leading to possible false negatives. Also, since DHCP
spoofing detection relies on the temporal consistency between the
gateway’s IP and MAC address pairs of current connection and the
last-time secure connection, it can leave out some malicious APs
(i.e., introduce false negatives) if they are already compromised upon
the initial connection, in which case there is no available last-time
secure connection. These design choices enable us to more easily
deploy WiSC while achieving low false positive, so as to ensure the
validity of our subsequent WiFi threat analysis.
2.3 WAN Attack Detection
For WAN attacks, we target the man-in-the-middle threat model
where adversaries can easily launch TCP/DNS hijacking attacks and
then redirect or manipulate traffic flows without users’ knowledge.
Under this threat model, even packets with unreachable destination
IP addresses are highly likely to trigger the hijacking behavior since
it is much easier to fabricate spoofed responses than to check the
actual reachability of packets’ destination IP addresses [31, 90].
Thus, we devise cross-layer decoy-based detection which starts
with a transport-layer detection that sends decoy IP packets with

Connection
Establishment
User Clicks “Security
Checking” Button
Send ST TCP Decoys Send SD DNS Decoys
Both Are NoElse
≥RT
Responses?≥RD
Responses?
BenignDNS HijackingTCP Hijacking
Checking Our
Web Page
Checking Our
Web PageChecking DNS
Responses
Checking DNS
Responses
Both Are Benign
Transport-layer
Detection
Application-layer
Detection
Suspicious
Figure 5: Workflow of our WAN attack detection process.
unreachable destination IP addresses, and uses the response rates to
determine the suspicious APs in terms of TCP/DNS hijacking. For
the suspicious APs, we then perform an application-layer detection
to further rule out possible false positives. In this design, transport-
layer detection acts as a quick filtering scheme of benign cases, so
as to reduce the relatively high network overhead for performing
application-layer scrutinizing. The flowchart of the detection process
is shown in Figure 5.
2.3.1 Transport-Layer Attack Detection. In the transport-layer
detection step, we assemble several decoy IP packets with mostly
unreachable destination IP addresses, which are randomly selected
from an IP list that excludes easy-to-recognize IP addresses sum-
marized in previous studies [34]. To make these decoys particularly
attractive to attackers, we mimic web traffic by crafting TCP hand-
shake segments with destination port 80, and DNS queries of domain
names randomly selected from Alexa’s list of popular websites (e.g.,
Baidu.com) [5]. This is because web traffic has been a major target
of WiFi attacks due to its wide usage and richness in privacy data,
making it an excellent “bait”.
We then send out our decoys and monitor their responses in a
5-second time window (5 seconds is a typical user’s tolerance of
waiting according to previous studies [12, 49, 70]). Specifically,
to mimic regular user behaviors, we send 𝑆𝑇 = 8 TCP packets
to the AP, which is the maximum number of parallel connections
supported by common web browsers. Meanwhile, we also emulate
the timeout-retry process of DNS querying by sequentially sending
𝑆𝐷 = 3 DNS packets, with a 2-second inter-packet delay, given the 5-
second detection time window and the 2-second timeout value of the
DNS protocol. We then determine the AP as suspicious for 1) TCP
hijacking if at least 𝑅𝑇 out of the 𝑆𝑇 TCP packets have responses,
and 2) DNS hijacking if at least 𝑅𝐷 out of the 𝑆𝐷 DNS queries have
responses. For these cases, we then apply application-layer detection
to reduce false positives as detailed later in §2.3.3.
The above detection method is generally robust against deliberate
evasion of knowledgeable adversaries for three reasons. First, our
generated decoy packets are basically indistinguishable from normal
ones, thereby preventing adversaries from identifying them with-
out incurring high overheads on their sides. Second, our parameter
Table 1: Notations and their definitions.
Notation Definition
𝑆𝑇 Amount of TCP decoys sent to the AP𝑆𝐷 Amount of DNS decoys sent to the AP𝑅𝑇 Threshold for the amount of TCP decoys’ responses𝑅𝐷 Threshold for the amount of DNS decoys’ responses𝑃𝑚 Probability of receiving responses from a malicious AP𝑃𝑏 Probability of receiving responses from a benign AP𝑅 Amount of received responsesP(𝑅 ≥ 𝑘) Probability of an AP’s requiring app-layer scrutinizingP(𝑅 = 𝑘 | +○) Probability of receiving 𝑘 responses for a malicious APP(𝑅 = 𝑘 | -○) Probability of receiving 𝑘 responses for a benign AP
settings for generating decoy packets are adjustable as the circum-
stances may require; the adjustment strategy is discussed in §2.3.2.
Third, if an adversary alters her attack patterns (e.g., responding
to much fewer packets) to largely evade our detection, her attack
effectiveness and profits will be directly impaired.
2.3.2 Data-driven Parameter Settings. In this section, we take
a data-driven approach to systematically set 𝑅𝑇 and 𝑅𝐷 , the key
parameters in our transport-layer detection. We list the related no-
tations and definitions in Table 1. To determine 𝑅𝑇 , we use two
intuitions: 1) if the AP is malicious, due to random packet loss or
various timeouts, the probability of receiving a response for every
decoy is not 100% (denoted as 𝑃𝑚 < 1), and 2) occasionally receiv-
ing a response for some decoys from a benign AP is still possible
(𝑃𝑏 ≥ 0), when a random destination happens to be reachable. Thus,
lowering 𝑅𝑇 or 𝑅𝑆 may cause false positives (so more cases need
to be scrutinized by the app-layer detection) while increasing them
tends to incur false negatives. We next use real-world data-driven
statistical modeling to balance this critical tradeoff.
First, to understand how different thresholds affect the percentage
of suspicious APs, we conduct an experiment as a beta component
(explicitly marked as “for experimental use only” in the UI) of
WiFiManager for a month in Sept. 2018. For an opt-in user, its
client sends out 𝑆𝑇 decoys for TCP hijacking detection and 𝑆𝐷decoys for DNS hijacking detection, and then records the number of
received responses 𝑅. In total, ∼10,000 APs were tested and ∼20,000
records were collected. Figure 6 shows the percentage of APs that
need scrutinizing (i.e., when the client received at least 𝑅𝑇 = 𝑘
responses) for different 𝑘 values, which we denote as P(𝑅 ≥ 𝑘),
whose conditional probabilities given the AP is malicious ( +○) or
benign ( -○) are modeled by the binomial distribution:{
P(𝑅=𝑘 | +○)=P𝐵 (𝑘 ; 𝑆𝑇 , 𝑃𝑚) =(𝑆𝑇𝑘
)
𝑃𝑘𝑚 (1−𝑃𝑚) (𝑆𝑇−𝑘) ,
P(𝑅=𝑘 | -○)=P𝐵 (𝑘 ; 𝑆𝑇 , 𝑃𝑏 ) =(𝑆𝑇𝑘
)
𝑃𝑘𝑏(1−𝑃𝑏 )
(𝑆𝑇−𝑘) .(1)
Given 𝑅 = 𝑘, the recall equals to the probability of a malicious AP
receiving 𝑅 ≥ 𝑘 responses:
𝑟𝑒𝑐𝑎𝑙𝑙 = P(𝑅 ≥ 𝑘 | +○) =
𝑆𝑇∑
𝑖=𝑘
P(𝑅 = 𝑖 | +○) . (2)
From Eq. (1) and Eq. (2) we know that to calculate the recall, we
need to obtain the unknown 𝑃𝑚 . To this end, according to the Bayes’
theorem, we have:
P(𝑅 = 𝑘) =∑
𝑆 ∈{ -○, +○}
P(𝑅 = 𝑘 | 𝑆)P(𝑆) . (3)

1 2 3 4 5 6 7 8
RT
0%
5%
10%
15%
Perc
enta
ge o
f A
Ps
80%
85%
90%
95%
100%
Estim
ate
d R
eca
ll
% of APs Requiring
App-layer Scrutinizing
Estimated Recall
Figure 6: % of APs that need app-layer
scrutinizing, and estimated recall for
different TCP thresholds.
1 2 3
RD
6%
8%
10%
12%
Pe
rce
nta
ge
of
AP
s
80%
85%
90%
95%
100%
Estim
ate
d R
eca
ll
% of APs Requiring
App-layer Scrutinizing
Estimated Recall
Figure 7: % of APs that need app-layer
scrutinizing, and estimated recall for
different DNS thresholds.
1 2 3 4 5 6 7 8
RT
0%
2%
4%
6%
8%
10%
12%
Fa
lse
Po
sitiv
e
0%
1%
2%
3%
4%
5%
Fa
lse
Ne
ga
tive
False Positive
False Negative
Figure 8: False positive and false nega-
tive rates for different TCP thresholds.
1 2 3
RT
0%
0.5%
1%
1.5%
Fa
lse
Po
sitiv
e
0%
2%
4%
6%
8%
10%
Fa
lse
Ne
ga
tiveFalse Positive
False Negative
Figure 9: False positive and false nega-
tive rates for different DNS thresholds.
0 1 2 3 4 5 6 7
Number of APs 106
Xiaomi
China Mobile
ZTE
Phicomm
Private
HUAWEI
Tenda
FAST
MERCURY
TP-LINK
Figure 10: Top 10 WiFi AP brands or-
dered by the number of examined APs.
0 1 2 3 4
Number of APs 105
Reijie
Fenglian
ZTE
Huawei
Private
FAST
MERCURY
Tenda
TP-LINK
Phicomm
Figure 11: Top 10 AP brands ordered by
the number of malicious APs detected.
With Eq. (1) (3) and the values of P(𝑅 = 𝑘) from our empirical data,
we can solve that 𝑃𝑚 = 98%. This is generally consistent with the
measurement result in prior work [37]. As shown in Figure 6, 𝑅𝑇 = 5
is empirically a “sweet spot” as it efficiently filters out 96.6% APs
while incurring little loss of recall.
For 𝑅𝐷 (the DNS case), we apply the same mechanism and find
𝑃𝑚 = 94.12%. Figure 7 shows the corresponding recall and 𝑅𝐷 = 2
is found to be a proper balance for our tradeoff.
2.3.3 Application-Layer Detection. After the transport-layer de-
tection, the set of suspicious APs for TCP/DNS hijacking behaviors
may have false positives. For example, possible benign intercep-
tions of APs that intercept and respond to users’ packets in a similar
way as that in adversaries’ attacks. Besides, ISPs may implement
DNS interceptions [41] for routing optimizations. To rule out these
possibilities, we further employ two scrutinizing strategies at the
application layer for confirming TCP and DNS hijacking behaviors
respectively. Note that the trade-off here is that we conservatively
determine an AP as benign as long as we do not detect application-
layer attacks, which is thus able to avoid false positives but can
introduce some false negatives.
For DNS hijacking, we examine the received resolution results
of our DNS decoys (if any). Recall that the decoys’ carried domain
names are randomly selected from a list of popular websites. Thus,
for the suspicious APs, we determine them as malicious if the re-
solved IP addresses conform to any of the following 3 criteria: 1)
these IP addresses have been publicly reported as malicious, 2) they
are private IP addresses, and 3) they are identical, all of which should
not be observed in benign DNS interceptions.
For TCP hijacking, we perform the detection at the web page level.
Specifically, we host an instrumented decoy web page on WiSC’s
server, and let the client query for it. To detect attacks, a direct
method is to compare the received web page at the client with the
original one. However, this can have false positives when legitimate
log-in web portal exists. To rule out these cases, we insert 256-bit
random strings into the HTML of our web page as its “fingerprints.”
By checking the fingerprints, we can have high precision in detecting
the attacks that do not completely replace web pages but only modify
them, e.g., inserting new content [60]. In the design of our web page,
we also insert HTTPS links to capture HTTPS-targeted attacks like
SSLStrip [65], which undermines HTTPS by replacing HTTPS links
in web pages with HTTP links.
2.4 Evaluation
Setup. To evaluate WiSC’s performance (in terms of false positive
and false negative rates), we conduct controlled experiments by
respectively replaying the targeted attacks (i.e., ARP/DHCP spoofing
and TCP/DNS hijacking) on 10 APs of different brands (as listed in
Figure 10) and detecting them with WiSC. For environment settings,
we setup our experiments in a campus area where 5 WiFi signals
simultaneously exist (a common scenario in public places according

to WiFiManager’s user data); all the signals lie in different channels
so that they do not pose direct interference to each other.
LAN Attack Detection. In the evaluation of LAN-side attack detec-
tion, we replay ARP and DHCP spoofing attacks without introducing
the trade-off scenarios as discussed in §2.2, in which we would al-
ways conservatively determine the AP as benign in pursuit of an
extremely low false positive rate. As a result, evaluations show that
all the replayed ARP and DHCP spoofing attacks can be correctly
detected by WiSC, mostly attributed to our careful examinations of
cross-connection and historic data.
WAN Attack Detection. For WAN attack detection, we focus on
evaluating the effectiveness of our crucial parameter settings in the
transport-layer detection, as well as the overall performance. In
detail, we first diagnose the APs using solely the transport-layer
detection when the APs are benign and under TCP/DNS hijacking
attacks, respectively. Figure 8 shows the false positive and false
negative rates for different parameter settings (𝑅𝑇 ) in the TCP case.
As shown, our determined threshold 𝑅𝑇 = 5 is still a practical
balance for the tradeoff between false positive and false negative, as it
effectively reduces false positive (thereby requiring less unnecessary
app-layer scrutinizing) to 0.048% while incurring only 0.82% false
negative. For the DNS case, Figure 9 illustrates the corresponding
false positive/false negative for different 𝑅𝐷 values, and 𝑅𝐷 = 2 is
also shown to be the proper choice.
Further, we include the app-layer scrutinizing to evaluate the
overall performance of our WAN attack detection component. The
results show that due to the rigorous rules applied in the app-layer
detection, the identified attacks contain no false positive, while there
is a slight increase of false negative from 0.82% (1.9%) to 1.3%
(2.2%) for the TCP (DNS) case.
2.5 Large-Scale Deployment and Field Survey
We collaborated with WiFiManager and implemented WiSC as an
optional function of WiFiManager for all its users. During the six-
month measurement from 10/22/2018 to 04/03/2019, we recorded
a total of 14M opt-in users and 19M WiFi APs, distributed in 178
countries; the vast majority are located in China where WiFiMan-
ager’s major users come from. To further confirm the validity of our
dataset, with the WiFiManager team we carry out a field survey of
100 randomly selected public APs that are determined to be mali-
cious by WiSC. We choose public APs given that they can be easily
located (using the location data provided by users), accessed and
tested. Also, we ensure that all the concerned attacks are included
in this survey. Field results show that all the sampled APs indeed
manifest malicious behaviors upon close examinations, indicating
that our dataset is able to provide a valid basis for our analyses.
3 MEASUREMENT RESULTS
Among all the 19M APs examined by WiSC, we record 445 AP
brands, 2660 AP models, and ∼750,000 APs bearing WiFi attacks,
corresponding to ∼1,413,000 attack event traces. To our knowledge,
this is so far the largest study regarding WiFi APs and related security
events in the wild. By analyzing this, we have multifold findings on
WiFi threats as follows.
Table 2: Top 15 countries ordered by the number of examined
WiFi APs.
Country # of APs Prevalence Major Attack Technique
China 19,119,764 3.92% TCP hijacking (57.6%)Burma 7148 4.48% TCP hijacking (53.1%)
Vietnam 4288 1.8% DHCP spoofing (40.2%)Russia 3169 8.93% DNS hijacking (43.8%)
South Korea 2701 2.07% ARP spoofing (91.1%)Cambodia 2213 2.17% ARP spoofing (47.9%)
Laos 1530 1.05% DHCP spoofing (43.7%)Thailand 1350 4.15% DNS hijacking (53.5%)Malaysia 1317 2.89% DNS hijacking (44.7%)
Japan 1315 2.59% ARP spoofing (67.6%)Singapore 1133 1.5% ARP spoofing (50%)Philippines 840 2.86% DNS hijacking (45.8%)Indonesia 796 22.36% TCP hijacking (91%)
United States 608 1.01% ARP spoofing (66.6%)Pakistan 523 1.53% ARP Spoofing (62.5%)
3.1 Prevalence of WiFi Attacks
Previous reports with small-scale measurements suggest that WiFi
attacks occur to only 0.21%–1.5% of their examined WiFi APs [67,
69]. Unfortunately, our large-scale, in-the-wild measurement refutes
this, revealing that WiFi attacks have been detected on at least 3.92%
of all the 19M APs. Worse still, as our detection scheme cannot
cover every possible form of attack such as signal monitoring and
deauth [7, 43] occurring at the PHY or MAC layer, the prevalence
(∼4%) in fact only represents a lower bound of the reality, indicating
a pressing demand for the community’s attention today.
In detail, we wonder whether the AP brand impacts the preva-
lence of attacks, since different AP manufacturers may have distinct
security considerations. We plot the top 10 AP brands in Figure 10
and Figure 11 in terms of number of examined and malicious APs,
respectively. We observe that among all the malicious APs, top 10
brands account for 98.48%. Most notably, nearly half (49%) of them
belong to a single brand—Phicomm [53], whose market share is
merely 4.3%. Such a highly skewed distribution can be ascribed to
Phicomm APs’ specific security vulnerabilities, since we notice that
online reports or discussions around Phicomm APs’ vulnerabilities
are much more common than those of others [61, 62]. Although
public vulnerability disclosures can help improve the security of
the products, we have not seen Phicomm act effectively in response.
Thus, before the patches for these public vulnerabilities are devel-
oped and applied, it would be beneficial for the concerned APs to
deploy short-term mitigation strategies such as the novel MAC ad-
dress randomization [6] technique that can help hide vulnerable APs’
device fingerprints.
Moreover, for geographical distribution, we list in Table 2 the top
15 countries with the largest number of examined APs among all
the involved 178 countries. As shown, some countries like Burma,
Russia, and Thailand exhibit even higher prevalence (>4%) of WiFi
attacks than China. We note that our results may not be applicable
to some of the countries due to limited data scale and the lack of
similarity between their manifested behaviors and those of China.
However, for countries exhibiting a similar WiFi threat landscape
as in China (in terms of prevalence, major types of attacks, and
essential behaviors), such as Burma, we propose that our results may
be valuable for them as well. Further, by analyzing the geographical
Poor Average Good Excellent0%
10%
20%
30%
40%
50%
60%
70%
Perc
enta
ge o
f A
Ps
Strong Encryption
Weak/No Encryption
Figure 12: Internet connectivity for APs
with strong and weak/no encryption.
HTTPS HTTPS HSTS Configuration
Support Default to Enable Proper HSTS
0%
10%
20%
30%
40%
50%
60%
70%
80%
90%
100%
Perc
enta
ge
China Top 100
US Top 100
China Top 10,000
US Top 10,000
Figure 13: Status quo of top websites’
HTTPS/HSTS adoption in China and
the US.
50 100 150 200 250 300 350 400
LAN Latency (ms)
0.6
0.65
0.7
0.75
0.8
0.85
0.9
0.95
CD
F
Benign
ARP Spoofing
DHCP Spoofing
Figure 14: Connectivity for benign APs
and APs under spoofing attacks.
50 100 150 200 250 300 350 400
LAN Latency (ms)
0.7
0.75
0.8
0.85
0.9
0.95
CD
F
DNS Hijacking
TCP Hijacking
Benign
Figure 15: Connectivity for benign APs
and APs under hijacking attacks.
0 400 800 1200 1600 2000
Movement (m)
0
0.2
0.4
0.6
0.8
1
CD
F
Benign APsAPs under WAN AttacksAPs under LAN Attacks
Figure 16: Physical movement of benign
APs and malicious APs.
0 0.2 0.4 0.6 0.8 1
Frequency of Injecting Ads
0
0.2
0.4
0.6
0.8
1
CD
F Min = 0.02
Median = 0.11
Mean = 0.17
Max = 1
Figure 17: Frequency of attackers in-
jecting ads to victims’ web pages.
distribution of the detected WiFi attacks in China, we confirm that
WiFi attacks pervasively exist in almost all areas across the country,
without being confined to specific areas or ISPs. Also, the density of
attacks is basically proportional to the population density.
3.2 WiFi-based Attack Techniques
The WiFi-based attack techniques used in the wild are found to be
heterogeneous and somewhat unexpected. The ratios of the four
attack techniques WiSC can detect are: TCP hijacking (57%), DNS
hijacking (17%), ARP spoofing (16%), and DHCP spoofing (12%).
Multiple attack techniques can happen to one AP, so their percent-
ages add up to more than 100%. Although the techniques themselves
have all been studied in prior work [2, 17, 41, 72], we have several
findings that are unknown or significantly different.
First, we observe that TCP hijacking accounts for over a half of
the detected attacks. This can be attributed to TCP’s dominating use
today for Internet applications, and the attackers’ strong capability
in undermining TCP connections or even encryptions. In principle,
the increasingly wide deployment of HTTPS across the globe should
be able to provide protection against TCP hijacking. However, our
results clearly indicate that such attacks are still rampant.
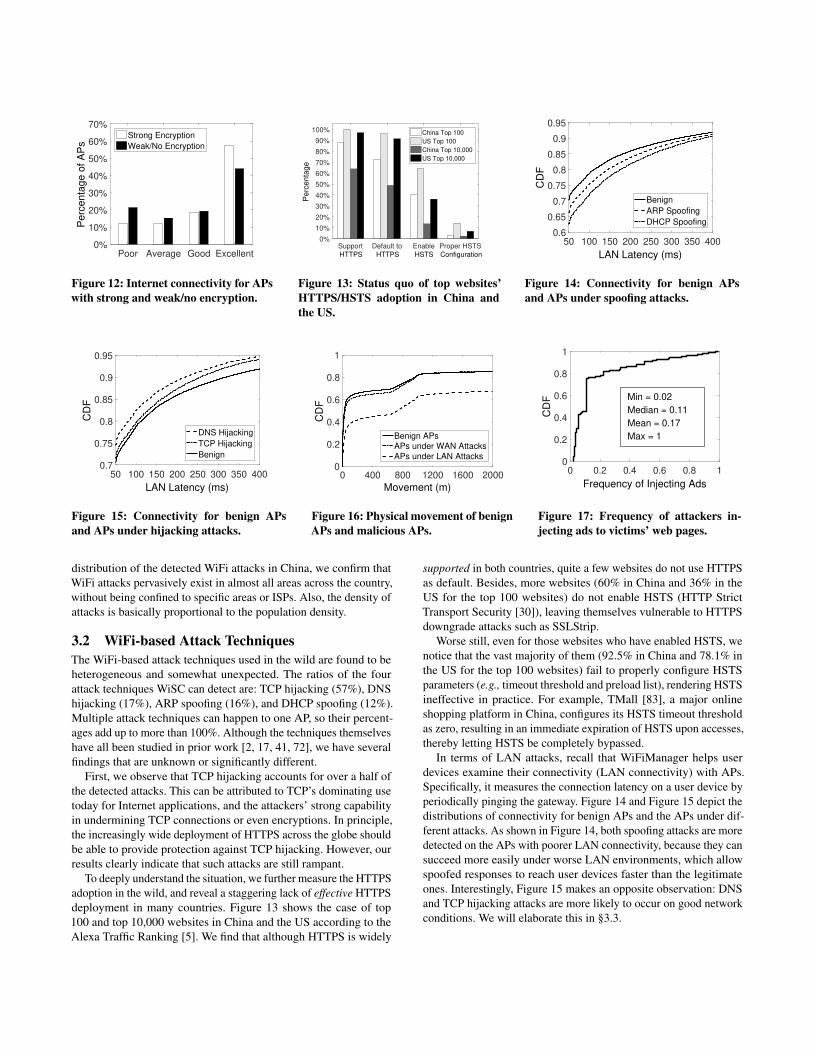
To deeply understand the situation, we further measure the HTTPS
adoption in the wild, and reveal a staggering lack of effective HTTPS
deployment in many countries. Figure 13 shows the case of top
100 and top 10,000 websites in China and the US according to the
Alexa Traffic Ranking [5]. We find that although HTTPS is widely
supported in both countries, quite a few websites do not use HTTPS
as default. Besides, more websites (60% in China and 36% in the
US for the top 100 websites) do not enable HSTS (HTTP Strict
Transport Security [30]), leaving themselves vulnerable to HTTPS
downgrade attacks such as SSLStrip.
Worse still, even for those websites who have enabled HSTS, we
notice that the vast majority of them (92.5% in China and 78.1% in
the US for the top 100 websites) fail to properly configure HSTS
parameters (e.g., timeout threshold and preload list), rendering HSTS
ineffective in practice. For example, TMall [83], a major online
shopping platform in China, configures its HSTS timeout threshold
as zero, resulting in an immediate expiration of HSTS upon accesses,
thereby letting HSTS be completely bypassed.
In terms of LAN attacks, recall that WiFiManager helps user
devices examine their connectivity (LAN connectivity) with APs.
Specifically, it measures the connection latency on a user device by
periodically pinging the gateway. Figure 14 and Figure 15 depict the
distributions of connectivity for benign APs and the APs under dif-
ferent attacks. As shown in Figure 14, both spoofing attacks are more
detected on the APs with poorer LAN connectivity, because they can
succeed more easily under worse LAN environments, which allow
spoofed responses to reach user devices faster than the legitimate
ones. Interestingly, Figure 15 makes an opposite observation: DNS
and TCP hijacking attacks are more likely to occur on good network
conditions. We will elaborate this in §3.3.

In previous studies, DHCP spoofing was mostly a hypothetical
attack under WiFi networks, since all DHCP Discovery messages
must be first sent to and then broadcast by the AP. Thus, the AP
should be able to respond to such messages more quickly than adver-
saries [56, 87], rendering any spoofed DHCP Offer messages invalid.
However, our observation refutes this by revealing that DHCP spoof-
ing is as feasible as other popular techniques in practice. We suspect
that the attackers adopt some extreme strategies, such as flooding
DHCP Offer messages, to practically increase the success rate. Such
strategies can be especially effective when the LAN connectivity is
poor (also suggested by Figure 14).
To sum up, the root cause of ARP/DHCP spoofings lies in the
AP’s unconditionally forwarding all the broadcasts within the LAN,
which conforms to the design of Ethernet for historical reasons, and
can be thoroughly address them by performing packet checking or
encryption at the AP, e.g., through S-ARP [13] and DHCP snoop-
ing [2]. However, they can also incur non-trivial storage/computation
overhead since they rely on recording all DHCP traffic or asymmet-
ric cryptography, which may incur additional attack surfaces and are
impractical for residential APs with low-cost hardware.
An alternative may be MAC-forced forwarding [44] that enables
an AP to recognize ARP/DHCP messages within the LAN, and
selectively forward them instead of simply broadcasting them all. In
fact, this technique has been deployed in some public places (e.g.,
metro stations) to defend against spoofing [89]. In our data, we find
that 3,208 APs are using this technique, and the MAC addresses for
all the connected user devices within the LAN obtained by ARP
requests are exactly the gateway’s MAC address, indicating that
all ARP traffic within the LAN has been explicitly directed to and
managed by the AP (gateway). It is encouraging to see that no
spoofing attack was detected on any of these 3,208 APs.
3.3 Malicious Behaviors and Objectives
Our measurement collects 1.4M attack event traces, including both
transport- and application-layer responses for detailed attack behav-
ior analysis. We make several interesting observations regarding the
“semantics” of such attacks.
• First, we analyze the collected web pages, and notice that 55% of
the attack events involve web pages being injected with advertise-
ments (ad injection) mainly through TCP hijacking.
• Second, 26% are typical DoS and passive traffic monitoring
through ARP/DHCP spoofing, where attackers manage to trick
user devices into recognizing their devices as the network gateway,
thereby dropping packets or peeping at users’ network traces.
• Third, we observe DNS hijacking where users’ DNS queries re-
ceive false resolution results, leading to potential phishing attacks,
i.e., redirection to malicious websites elaborately disguised as the
originally requested ones.
• Fourth, HTTPS-targeted attacks such as SSLStrip are also identi-
fied, where HTTPS links have been surreptitiously replaced with
HTTP links to compromise users’ encryption.
The last two account for <8% of all attacks, which is much smaller
than the percentages reported in prior studies [19, 28].
Delving deep, as shown in Figure 16, we notice that APs under
LAN attacks exhibit much longer physical movements (median
of 724 m, average of 47.3 km) than APs under WAN attacks and
benign APs (median of 31 m and 21 m, average of 20.4 km and
20.5 km, respectively). Here the average is much larger than the
median due to the existence of mobile APs such as smartphone-based
hotspots, and small movements (<50 m) are mostly due to user-side
localization errors. We attribute this phenomenon to our observation
that ARP/DHCP spoofing attacks are more likely to succeed under
poor LAN environments (see Figure 14), which can be more easily
noticed by network administrators and then get fixed, compared
to the finer networks of WAN-based attacks. Thus, attackers need
to strategically relocate (similar events have been noticed in other
attacks [39]) to better success and evade detection. Notably, we find
that 10% of the APs under LAN attacks even manifest a clear pattern
of shifting around several locations, forming one or multiple loops.
Next, we go deeper into the most detected events—ad injections,
and make several intriguing findings. We discover that the injected
ads are not deliberately hidden through techniques like impression
fraud [76], although in this way adversaries can better cover them-
selves up to avoid being directly captured by users. This is probably
because advertisers require ads to be explicitly displayed for achiev-
ing real advertising effect. This suggests that there might exist an
ecosystem behind these widespread AP-based ad injection activities,
thus motivating us to dig deeper in the next section.
More surprisingly, ad injection is detected on 2.33% of the APs
using strong encryption (WPA/WPA2) while on 1% of the APs us-
ing no or weak encryption (WEP). Our investigation sheds light
on this counter-intuitive observation. WiFiManager measures the
Internet connectivity of an AP when checking its LAN connectivity
(§3.2). The result falls into four categories: Excellent, Good, Average,
Poor, representing that in monthly examinations, >90%, 70%∼90%,
50%∼70%, <50% connections can be established, respectively. Fig-
ure 12 shows that better protected APs tend to have better Internet
connectivity, thereby providing a better network environment for per-
forming ad injection. The above results probably indicate that solely
relying on strong link-layer cryptography may be ineffective against
complex real-world threats, whose mitigation requires a cross-layer
approach spanning multiple dimensions including encryption, au-
thentication, protocol verification, human factor, to name a few. For
example, mitigating the ad-injection attack requires the synergy from
secure app-layer protocol (e.g., HTTPS) and robust authentication
(e.g., dynamic authentication offered by 802.1X [16]).
3.4 Fundamental Motives Behind the Attacks
According to our results, ad injection currently accounts for the
largest portion of the detected attacks events and thus has the broad-
est impact on end users. Also, user devices being injected with ads
can fall victim of various kinds of frauds and abuses, leading to
possible severe outcomes. Therefore, in this section, we leverage our
in-situ attack event traces to understand the fundamental motives
behind the AP-based ad injections. By analyzing the injection code,
we first observe that adversaries adopt various techniques to evade
common security checks, such as domain altering that constantly
changes ads’ domains to prevent security or ad-blocking software
from recognizing them, and code obfuscation to hide the attack
logic. Clearly, the attackers are trying hard to conceal their malicious
activities while profiting by (visible) ad impression.

0 2 4 6 8 10 12 14
t (week)
0%
10%
20%
30%
40%
50%
60%
Perc
enta
ge o
f A
Ps % of Recovered APs
Fitting Curve
Figure 18: Percentage of APs that re-
cover through reset/upgrade for each
week and our fitting curve.
0 0.2 0.4 0.6 0.8 1
Probability of Injecting Ads
0%
20%
40%
60%
80%
100%
Perc
enta
ge o
f A
Ps
% of Recovered APs
Fitting Curve
Figure 19: Percentage of recovered APs
influenced by ad injection probabilities
and our fitting curve.
0 0.2 0.4 0.6 0.8 1
Probability of Injecting Ads
0
0.3
0.6
0.9
1.2
1.5
1.8
Rela
tive P
rofit
Ad-injection Probability = 0.15
Relative Profit = 1.63
Figure 20: Our inferred profit model
that shows how the profit varies for dif-
ferent ad injection probabilities.
Meanwhile, we find that a malicious AP only probabilistically
injects ads instead of compromising all intercepted web pages. As
shown in Figure 17, for 77% of the malicious APs, the ad injection
probabilities are below the average, 17%. We believe that qualita-
tively, this is because excessive ad injection can be easily noticed
by users, henceforth incurring AP reset, firmware upgrade, or even
disconnection, causing the attacker to lose the comprised AP. Nev-
ertheless, we are more interested in the quantitative explanation:
how do attackers choose the injection probability (frequency) we
observe? Is it the result of a mature market’s selection or simply
the aggregation of random standalone cases? These are essential to
further decoding the WiFi attack ecosystem (if it exists).
To answer the above questions, we analytically model the econ-
omy behind ad-injection attacks. Instead of assuming a fixed number
of malicious APs, we notice that more realistically, malicious APs
are only under adversaries’ control for a period of time, before they
gradually recover to the benign state—a dynamic process. Intuitively,
malicious APs’ recovery can be attributed to users’ intentional de-
fense actions triggered by relatively high ad injection probabilities.
Moreover, the APs can also recover through users’ unintentional
actions, e.g., AP reset or firmware upgrade. We expect these two
factors to independently influence APs’ recovery.
To obtain the percentage of APs recovered through unintentional
actions (when ad injection probability is low), we choose to inspect
the 35,782 APs that experience the lowest ad injection probability
(0.02) during our measurement to exclude the influence of high-
probability ad injections arousing users’ vigilance. We track their
recovery process for 14 weeks, and plot the percentage of recovered
APs (P𝐹 ) for each week (𝑡) in Figure 18. As an AP’s recovery is an
independent and random event, we fit the measurement data using
Exponential distribution [10]:
P𝐹 (𝑡) = 1 − 𝑒−0.054𝑡 . (4)
We find that the coefficient of determination (𝑅2) [46] is as high as
0.89, suggesting that P𝐹 (𝑡) can well fit our data.
Recall that for all recovered APs, we divide them into two parts:
1) the APs recovered due to intentional defense actions, and 2) the
APs recovered through unintentional actions. Since we know the
number of all recovered APs (Part 1 + Part 2) for each week, we
can estimate the size of Part 1 by first approximating the size of
Part 2 with Eq. (4) and then removing it from the total size. Next,
we calculate the average ad injection probability for each week with
our dataset. Figure 19 then plots the percentage of recovered APs
(P𝐿) due to intentional defense actions for different ad injection
probabilities, which exhibits the curve of an S-function [35]. Among
common S-functions, we find that the Bertalanffy function [86] can
best fit our data with 𝑅2 being 0.99:
P𝐿 (𝑃𝑎𝑑 ) = 0.95 ∗ (1 − 1.99𝑒−10.12𝑃𝑎𝑑−0.67)3, (5)
for an injection probability 𝑃𝑎𝑑 . We therefore have the probability
for an AP’s remaining malicious (P𝑚) at time 𝑡 :
P𝑚 (𝑃𝑎𝑑 , 𝑡) = (1 − P𝐿 (𝑃𝑎𝑑 )) (1 − P𝐹 (𝑡)). (6)
Suppose there are a total number of 𝑀 APs, each AP is in-
jected with an average of 𝑁 ads, and each ad brings a unit profit of
𝑃𝑟𝑜 𝑓 𝑖𝑡𝑢𝑛𝑖𝑡 ; then the adversaries’ profit would be:
𝑃𝑟𝑜 𝑓 𝑖𝑡 (𝑃𝑎𝑑 ) =
∞∑
𝑡=0
𝑀 ∗ 𝑁 ∗ 𝑃𝑟𝑜 𝑓 𝑖𝑡𝑢𝑛𝑖𝑡 ∗ 𝑃𝑎𝑑 ∗ P𝑚 (𝑃𝑎𝑑 , 𝑡) (7)
for injection probability 𝑃𝑎𝑑 . Although the exact values of 𝑀 , 𝑁 ,
and 𝑃𝑟𝑜 𝑓 𝑖𝑡𝑢𝑛𝑖𝑡 are unknown, we can know how 𝑃𝑟𝑜 𝑓 𝑖𝑡 (𝑃𝑎𝑑 ) varies
relative to 𝑃𝑟𝑜 𝑓 𝑖𝑡 (𝑃𝑎𝑑 = 1) for different 𝑃𝑎𝑑 values as:
𝑃𝑟𝑜 𝑓 𝑖𝑡𝑟𝑒𝑙𝑎𝑡𝑖𝑣𝑒 (𝑃𝑎𝑑 ) =𝑃𝑟𝑜 𝑓 𝑖𝑡 (𝑃𝑎𝑑 )
𝑃𝑟𝑜 𝑓 𝑖𝑡 (1)=𝑃𝑎𝑑 (1 − P𝐿 (𝑃𝑎𝑑 ))
1 − P𝐿 (1). (8)
We plot 𝑃𝑟𝑜 𝑓 𝑖𝑡𝑟𝑒𝑙𝑎𝑡𝑖𝑣𝑒 (𝑃𝑎𝑑 ) for different 𝑃𝑎𝑑 values in Figure 20
to showcase how different ad injection probabilities impact adver-
saries’ profit. As shown, the maximum profit appears at 𝑃𝑎𝑑 = 15%,
which matches real-world adversaries’ choices (averaging at 17%).
With this finding, we suspect that most adversaries have carefully
tuned their behaviors to achieve maximum profit in the long run.
In summary, we notice that most adversaries carry out ad-injection
attacks in a rather mature manner through rate throttling, which can
not only prevent users from easily noticing them but also maximize
their profits. The high consistency between our analytical results
and attackers’ real-world practices suggests these attackers are both
judicious and rational, revealing a rather mature ecosystem, which
we discuss next.
4 UNDERMINING ATTACK ECOSYSTEM
In this section, we first describe how we figure out the underground
WiFi attack ecosystem. Then, we present the interplay among the

Web Analytics
Web Page with Ads
Display
Code Files
(Obfuscated)Web Page
Injected with
JavaScript Code
(Two Code Files)
Unknown
Code
Ad-injection Code
hm.baidu.com
Official Documents
Collect
Statistics
Figure 21: Procedure of uncovering web analytics platforms in
the underground ecosystem of WiFi attacks.
various players in the ecosystem. Next, we show how we discover its
Achilles’ heel that enables our subsequent proactive counterstriking.
4.1 Uncovering the Underground Ecosystem
Our analysis in §3.4 implies that an immense, mature ecosystem
probably exists behind WiFi attacks. As shown in Figure 21, to fully
understand it, we closely examine adversaries’ code that is inserted
into the web page as external JavaScript resources. We notice that
in >99% of the recorded ad-injection attacks, the injection code
consists of two separate JavaScript files: one serves to inject ads, and
the other contains code that is inserted through a JavaScript resource
link from legitimate domains, most notably hm.baidu.com. Trac-
ing this lead, we find out that this domain name belongs to a web
analytics platform named Baidu Analytics [9]. By cross-referencing
the code with Baidu Analytics’ official documents, we know that the
code records various statistics of the advertising effect such as the
click-through rate [23] and reports them to the web analytics plat-
form. In total, we discover only four such web analytics platforms:
Baidu Analytics, UMeng [85], OeeBee [47], and 360zlzq [1].
These platforms provide traffic and user behavior analysis for a
registered link/website, so as to help developers better assess the “ef-
fectiveness” of their websites, which in our case is the effectiveness
of the injected advertising pages. The piece of code we discover is
written as the user end of their statistics collection infrastructure,
which monitors and records web traffic on the advertising pages, and
uploads corresponding data to web analytics platforms to generate
an analytical report. This is a most intriguing finding that quickly
leads us to the primary question: why do adversaries require such
services of web analytics if they simply compromise APs and inject
ads for themselves? Considering the function of these web analytics
services, their presence hints that the attackers might be interacting
with another entity of the ecosystem.
Leveraging this finding, we can now infer the panorama of the
WiFi attack ecosystem, where adversaries are not advertisers that
produce and distribute ads for marketing purposes. In fact, they
mainly act as a proxy that is only responsible for delivering ads to
end users for other advertisers. In online advertising, such a role
is termed as the ad-serving platform [22]. This is the reason why
participation of web analytics platforms is required—to provide
independent evaluation for the actual advertising effect of the ad-
serving platforms. We next detail the interplay among advertisers,
Table 3: Attackers that stop serving ads after our action.
Adversary % of All Ads Entity We Report to
t.7gg.cc 35.8% Baidu Analytics5myr.cn 8.9% OeeBeeagtsjb.com 8.7% UMeng/Adblock Plus103.49.209.27 1.2% 360zlzq/Adblock Pluswithad.com 0.4% UMeng/Adblock Pluszfkmw.com 0.3% UMeng/Adblock Plusjs.union-wifi.com 0.06% 360zlzq/Adblock Plus172.81.246.180 0.05% 360zlzq/Adblock Plus
adversaries/ad-serving platforms, and web analytics platforms to
present how the ecosystem operates, as well as a weak link within.
4.2 Interplay and Weakness
Figure 1 (early in §1) depicts the interplay within the WiFi attack
ecosystem. First, advertisers hire ad-serving platforms (adversaries)
to help distribute ads to end users. Then via malicious APs, ads
and statistics collection code are injected into users’ requested web
pages. The ads are later displayed to end users. Meanwhile, the
statistics collection code tracks users’ interactions with injected
ads, and uploads collected statistics to web analytics platforms. At
the monetization stage, adversaries use ad analytics signed by web
analytics platforms as a proof to receive payment from advertisers.
In detail, we extract the resource links of ad-injection code from
the HTML files of logged web pages, and classify them according
to the resource links’ domain names or IP addresses. As a result,
we identify a total number of 25 ad-serving platforms. In addition,
we have observed transnational activities of several adversaries. For
example, 5myr.cn’s activities involve 8 countries, the largest in
our data. Also, a major adversary t.7gg.cc (which accounts for
36% of all ads) has been detected in 6 countries across 3 continents.
Furthermore, we notice that two largest among the four analytics
platforms, Baidu Analytics and UMeng, are third-party authorita-
tive services that take 87% of the market share and participate in
distributing 80.8% of the ads. The massive participation of these
major legitimate services is surprising, though we believe that they
are involved in the ecosystem due to their public credibility. That
is, adversaries might be required by advertisers to provide credi-
ble evidence of their advertising effect to decide the final payment.
This phenomenon, on the other side, reveals the Achilles’ heel of
the attack ecosystem: it heavily relies on legitimate web analytics
platforms for the most essential monetization stage. This provides a
unique opportunity for active defense (detailed next).
4.3 Real-World Active Defense Practices
Given that the ecosystem mainly relies on only four web analytics
platforms, we take an active defense approach by contacting them
and providing our detailed findings regarding their supported adver-
saries (ad-serving platforms) in Aug. 2019. As of August 2020, we
observe that Baidu Analytics stopped serving 67% of the reported
links, resulting in 49.8% decrease of ad injections. For UMeng, we
have managed to establish communications with their teams, who
have promised to take actions towards the reported ad links in the
near future. Shortly after our complaint, OeeBee seems to be shut
down according to its website.

While waiting for responses from 360zlzq, we report our identi-
fied illegal ad campaigns to mainstream ad blockers and observe real-
world effects as well. For example, a major adversary agtsjb.com,
which accounts for 8.7% of all the ads, has been included in the black-
list of Adblock Plus, a popular browser plugin for ad blocking [3].
Later, we find that the related ads have all become inaccessible. Ta-
ble 3 lists major adversaries that have completely stopped serving
their ads (i.e., unable to access them) after our actions.
These efforts mark the first success of active defenses against
WiFi attacks by breaking the critical chain of monetization. We real-
ize though that fully defeating the massive, well-organized ecosys-
tem requires joint efforts from other entities like browsers, ad blocks,
and OSes. We are actively pursuing this research direction.
5 RELATED WORK
WiFi Security Measurement and Analysis. There are only a lim-
ited number of studies on WiFi security, yet all of them perform
measurement or experiments in small-scale environments and/or
concerning specific topics. Hu et al. [32] study the epidemiology of
malware spreading over WiFi by simulating its propagations. Zafft et
al. [93] measure WiFi threats regarding APs’ encryption and black-
listed IP addresses. Fleck et al. [20] investigate ARP poisoning in
WiFi networks. Yin et al. [92] send test packets to uncover malicious
APs that intercept and relay users’ network traffic. Xiong et al. [91]
explore eavesdropping on WiFi signals at the physical layer. In com-
parison, we conduct to date the most large-scale, comprehensive
WiFi security analysis in the wild, and reveal several new findings
such as the prevalent WiFi AP-based ad injection and its ecosystem.
Understanding Attacks from an Ecosystem Perspective. Several
studies strive to understand different cybercriminal activities, such as
account theft [48], malware distribution [14, 81], spam [38, 59, 82],
and underground marketing [74] from an ecosystem and/or economic
perspective. In particular, Thomas et al. [80] present a large-scale
measurement on ad injection attacks in Google by embedding con-
tent modification detectors in several Google sites. Their results
reveal the landscape of the ad ecosystem that primarily consists
of ad-serving platforms, advertisers, compromised sites and vari-
ous attack vectors (e.g., browser extensions, malicious binaries, and
routers). They then approach the problem by requesting develop-
ers of related browser extensions (a major attack vector) to remove
ad injection components from their software. Pearce et al. [52] in-
stead focus on the click fraud within the ad ecosystem and complex
interplays among closely connected ad-serving platforms (which
distribute ads to each other). Different from them, we discover the
wide-spread ad injection problem when dissecting WiFi security
threats in the wild. More importantly, we disclose yet another player
in the ad ecosystem – legitimate web analytics platforms, which we
find to be in fact the bottleneck of the entire revenue chain that can
be leveraged against adversaries.
Network Protocol Security in General. There exist a large body
of researches on upper-layer (L2 to L5) network protocol security.
They use a wide range of techniques such as traffic-based analysis [8,
64, 68], formal verification [33], OS-level protection [18, 21, 75],
software engineering [57, 95], machine learning and statistical analy-
sis [73, 94]. There are also numerous studies (in terms of both attack
and defense) on securing specific protocols such as ARP [13, 42],
DHCP [36], HTTP [63, 78], SSL/TLS [30, 79], and DNS [50, 96].
Many of these techniques have been or can be applied to WiFi envi-
ronments. Our work differs from the above in that instead of focusing
on a single protocol or a standalone attack/defense technique, we
reveal the landscape of WiFi-related network protocol security. Our
measurements provide distinctive key insights for improving WiFi
security in the future.
6 CONCLUSIONS AND LIMITATIONS
In this paper, we carry out a nationwide measurement study of WiFi
security. We develop a lightweight WiFi threat detection system
called WiSC that takes advantage of both active probing and comple-
mentary cross-layer information. We then deploy WiSC in the wild
to examine 19 million WiFi APs connected by 14 million real-world
users. With the crowdsourced data, we perform a comprehensive
analysis on state-of-the-art WiFi attacks in the wild, the adversaries’
profit-driven motives, and the interactions among multiple entities in
the WiFi attack ecosystem. We also discover the critical role played
by major web analytics platforms on monetizing the adversaries,
and leverage it to effectively combat the preponderant ad injection
attacks at the national scale.
Despite the above efforts, our dataset and analysis bear several
limitations due to real-world constraints stemming from the limited
system privileges and resources of WiSC in the large-scale context.
First, in the design of WiSC one of our critical considerations is
trading some false negatives for a low false positive rate, so as
to obtain a valid basis for the WiFi threat analysis. However, in
this way we may not be able to capture the full landscape of WiFi
threat in the wild. Second, limited by the information WiSC can
collect from end devices, some of our analyses and results lack direct
evidences and thus may deviate from the actual cause(s) due to other
possible impact factors. For them, we conduct best-effort validations
through multi-aspect correlation analysis or controlled experiments.
Third, our current dataset is inherently unable to provide a clear
picture regarding the actual attack vectors that enable adversaries to
compromise an AP, as our platform operates at the end side.
ACKNOWLEDGMENTS
We sincerely thank the anonymous reviewers for their insightful and
detailed comments, as well as the shepherd for guiding us through
the revision process. We also appreciate Prof. Tianyin Xu for his
valuable advice and participation in the early stage of the study. This
work is supported in part by the National Key R&D Program of
China under grant 2018YFB1004700, the National Natural Science
Foundation of China (NSFC) under grants 61822205, 61632020,
61632013 and 61902211, and the Beijing National Research Center
for Information Science and Technology (BNRist).
REFERENCES[1] 360zlzq.cn. 360zlzq: Providing Reliable Web Analytics. http://www.360zlzq.cn,
2019. (Now inaccessible. Last accessed on Nov. 25, 2019).[2] C. L. Abad and R. I. Bonilla. An Analysis on the Schemes for Detecting and
Preventing ARP Cache Poisoning Attacks. In Proc. of IEEE ICDCS, pages 60–60,2007.
[3] Adblock-Plus.org. Adblock Plus: Surf the Web with No Annoying Ads, 2020.https://adblockplus.org/.

[4] M. D. Aime et al. Dependability in Wireless Networks: Can We Rely on WiFi?IEEE Security & Privacy, 5(1):23–29, 2007.
[5] Alexa.com. Alexa Traffic Ranking for Websites, 2020. https://www.alexa.com/.[6] Android.org. Android Privacy: MAC Randomization, 2020. https://source.andro
id.com/devices/tech/connect/wifi-mac-randomization.[7] J. B. and S. S. 802.11 Denial-of-Service Attacks: Real Vulnerabilities and Practical
Solutions. In Proc. of USENIX Security, pages 2–2, 2003.[8] P. Bahl, R. Chandra, J. Padhye, L. Ravindranath, M. Singh, A. Wolman, and B. Zill.
Enhancing the Security of Corporate Wi-Fi Networks Using DAIR. In Proc. of
ACM MobiSys, pages 1–14, 2006.[9] Baidu.com. Baidu Analytics: Web Statistics Platform (in Chinese). https://tongji
.baidu.com/, 2020.[10] K. Balakrishnan. Exponential Distribution: Theory, Methods and Applications.
Routledge, 2018.[11] BBC.com. BBC, 2020. https://www.bbc.com/.[12] A. Bouch, A. Kuchinsky, and N. Bhatti. Quality is in the Eye of the Beholder:
Meeting Users’ Requirements for Internet Quality of Service. In Proc. of ACM
CHI, pages 297–304, 2000.[13] D. Bruschi, A. Ornaghi, and E. Rosti. S-ARP: A Secure Address Resolution
Protocol. In Proc. of IEEE ACSAC, pages 66–74, 2003.[14] J. Caballero, C. Grier, C. Kreibich, and V. Paxson. Measuring Pay-per-Install:
The Commoditization of Malware Distribution. In Proc. of USENIX Security,volume 13, 2011.
[15] C. Cimpanu. Hacker Group Has Been Hijacking DNS Traffic on D-Link Routersfor Three Months, 2019. https://www.zdnet.com/article/hacker-group-has-been-hijacking-dns-traffic-on-d-link-routers-for-three-months.
[16] P. Congdon, B. Aboba, A. Smith, G. Zorn, and J. Roese. IEEE 802.1X RemoteAuthentication Dial In User Service (RADIUS) Usage Guidelines. RFC, 3580:1–30, 2003.
[17] M. Conti, N. Dragoni, and V. Lesyk. A Survey of Man In the Middle Attacks.IEEE Communications Surveys & Tutorials, 18(3):2027–2051, 2016.
[18] H. M. Demoulin, T. Vaidya, I. Pedisich, B. DiMaiolo, J. Qian, C. Shah, Y. Zhang,A. Chen, A. Haeberlen, B. T. Loo, et al. DeDOS Declarative Dispersion OrientedSoftware. In Proc. of ACSAC, pages 712–722, 2018.
[19] S. Fahl et al. Why Eve and Mallory Love Android: An Analysis of Android SSL(In)Security. In Proc. of ACM CCS, pages 50–61, 2012.
[20] B. Fleck and J. Dimov. Wireless Access Points and ARP Poisoning, 2001.https://digilander.libero.it/SNHYPER/files/arppoison.pdf.
[21] J. Franklin, D. McCoy, P. Tabriz, V. Neagoe, J. V. Randwyk, and D. Sicker.Passive Data Link Layer 802.11 Wireless Device Driver Fingerprinting. In Proc.
of USENIX Security, volume 3, pages 16–89, 2006.[22] A. Goldfarb and C. Tucker. Online Display Advertising: Targeting and Obtrusive-
ness. INFORMS Marketing Science, 30(3):389–404, 2011.[23] Google.com. Clickthrough Rate (CTR): Definition, 2020. https://support.google
.com/google-ads/answer/2615875?hl=en.[24] A. Greenberg. Researchers Found They Could Hack Entire Wind Farms, 2017.
https://www.wired.com/story/wind-turbine-hack/.[25] I. . W. Group et al. IEEE Standard for Wireless LAN Medium Access Control
(MAC) and Physical Layer (PHY) Specifications. IEEE Std 802.11-2016 (Revision
of IEEE Std 802.11-2012), 802(11):1–3534, Dec 2016.[26] L. N. R. Group. Arpwatch, the Ethernet Monitor Program; For Keeping Track of
Ethernet/IP Address Pairings, 2016. https://ee.lbl.gov/.[27] HACKERNOON. A hacker intercepted your WiFi traffic, stole your contacts,
passwords, & financial data., 2019. https://hackernoon.com/a-hacker-intercepted-your-wifi-traffic-stole-your-contacts-passwords-financial-data-heres-how-4fc0df9ff152.
[28] H. Han, B. Sheng, C. C. Tan, Q. Li, and S. Lu. A Timing-based Scheme forRogue AP Detection. IEEE Transactions on Parallel and Distributed Systems,22(11):1912–1925, 2011.
[29] C. Hetting. New Numbers: Wi-Fi Share of US Mobile Data Traffic Lingersat Around 75% in Q2, 2018. https://wifinowevents.com/news-and-blog/new-numbers-wi-fi-share-of-us-mobile-traffic-lingers-at-around-75/.
[30] J. Hodges, C. Jackson, and A. Barth. HTTP Strict Transport Security (HSTS).RFC, 6797, 2012.
[31] A. Houmansadr, G. T. Nguyen, M. Caesar, and N. Borisov. Cirripede: Circumven-tion Infrastructure Using Router Redirection with Plausible Deniability. In Proc.
of ACM CCS, pages 187–200, 2011.[32] H. Hu, S. Myers, V. Colizza, and A. Vespignani. WiFi Networks and Malware
Epidemiology. Proceedings of the National Academy of Sciences, 106(5):1318–1323, 2009.
[33] Y.-W. Huang, F. Yu, C. Hang, C.-H. Tsai, D.-T. Lee, and S.-Y. Kuo. Securing WebApplication Code by Static Analysis and Runtime Protection. In Proc. of WWW,pages 40–52, 2004.
[34] IANA. Special-Use IPv4 Addresses, RFC3330. Technical report, 2002.[35] D. K. and R. D. Application of S-shaped Curves. Procedia Engineering, (9):559–
572, 2011.[36] T. Komori and T. Saito. The Secure DHCP System with User Authentication. In
Proc. of IEEE LCN, pages 123–131, 2002.
[37] J. Korhonen and Y. Wang. Effect of Packet Size on Loss Rate and Delay inWireless Links. In Proc. of IEEE WCNC, pages 1608–1613. IEEE, 2005.
[38] K. Levchenko, A. Pitsillidis, N. Chachra, B. Enright, M. Félegyházi, C. Grier,T. Halvorson, C. Kanich, C. Kreibich, H. Liu, et al. Click Trajectories: End-to-EndAnalysis of the Spam Value Chain. In Proc. of IEEE S&P, pages 431–446, 2011.
[39] Z. Li, W. Wang, C. Wilson, J. Chen, C. Qian, T. Jung, L. Zhang, K. Liu, X. Li, andY. Liu. FBS-Radar: Uncovering Fake Base Stations at Scale in the Wild. In Proc.
of NDSS, 2017.[40] Lifewire. The Dangers of "Evil Twin" Wi-Fi Hotspots, 2019. https://www.lifewi
re.com/dangers-of-evil-twin-wi-fi-hotspots-2487659.[41] B. Liu, C. Lu, H. Duan, Y. Liu, Z. Li, S. Hao, and M. Yang. Who is Answering My
Queries: Understanding and Characterizing Interception of the DNS ResolutionPath. In Proc. of USENIX Security, pages 1113–1128, 2018.
[42] W. Lootah, W. Enck, and P. McDaniel. TARP: Ticket-based Address ResolutionProtocol. Computer Networks, 51(15):4322–4337, 2007.
[43] M. Maxim and D. Pollino. Wireless Security. McGraw-Hill/Osborne, 2002.[44] T. Melsen and S. Blake. MAC-Forced Forwarding: A Method for Subscriber
Separation on An Ethernet Access Network. Technical report, RFC 4562, June,2006.
[45] J. Miley. Starbucks’ Free WiFi Hijacked Computers of Customers to MineCryptocurrency, 2017. https://interestingengineering.com/starbucks-free-wifi-hijacked-computers-of-customers-to-mine-cryptocurrency.
[46] N. J. Nagelkerke et al. A Note on A General Definition of the Coefficient ofDetermination. Biometrika, 78(3):691–692, 1991.
[47] Oeebee.com. Oeebee: A Web Analytics Platform. http://www.oeebee.com/, 2019.(Now inaccessible. Last accessed on Sept. 12, 2019).
[48] J. Onaolapo, E. Mariconti, and G. Stringhini. What Happens After You Are Pwnd:Understanding The Use Of Leaked Account Credentials In The Wild. In Proc. of
ACM IMC, pages 65–79, 2016.[49] R. Padmanabhan, P. Owen, A. Schulman, and N. Spring. Timeouts: Beware
Surprisingly High Delay. In Proc. of ACM IMC, pages 303–316, 2015.[50] K. Park, V. S. Pai, L. L. Peterson, and Z. Wang. CoDNS: Improving DNS
Performance and Reliability via Cooperative Lookups. In Proc. of USENIX OSDI,pages 14–14, 2004.
[51] C. . party. Free WiFi is dangerous, 2015. http://jingji.cntv.cn/2015/03/15/VIDE1426429086847804.shtml.
[52] P. Pearce, V. Dave, C. Grier, K. Levchenko, S. Guha, D. McCoy, V. Paxson, S. Sav-age, and G. M. Voelker. Characterizing Large-Scale Click Fraud in ZeroAccess.In Proc. of ACM CCS, pages 141–152, 2014.
[53] Phicomm.com. Phicomm: Smart WiFi Routers. http://www.phicomm.com/, 2019.[54] D. C. Plummer et al. An Ethernet Address Resolution Protocol: Or Converting
Network Protocol Addresses to 48.bit Ethernet Address for Transmission onEthernet Hardware. RFC, 826:1–10, 1982.
[55] B. Potter. Wireless Hotspots: Petri Dish of Wireless Security. ACM Communica-
tions, 49(6):50–56, 2006.[56] W. L. Pritchett and D. De Smet. Kali Linux Cookbook. Packt Publishing Ltd,
2013.[57] X. Qie, R. Pang, and L. Peterson. Defensive Programming: Using an Annotation
Toolkit to Build DoS-Resistant Software. In Proc. of USENIX OSDI, 2002.[58] V. Ramachandran and S. Nandi. Detecting ARP Spoofing: An Active Technique.
In Proc. of ICISS, pages 239–250, 2005.[59] B. Reaves, N. Scaife, D. Tian, L. Blue, P. Traynor, and K. R. Butler. Sending out
an SMS: Characterizing the Security of the SMS Ecosystem with Public Gateways.In Proc. of IEEE S&P, pages 339–356, 2016.
[60] C. Reis, S. D. Gribble, T. Kohno, and N. C. Weaver. Detecting In-Flight PageChanges with Web Tripwires. In Proc. of USENIX NSDI, volume 8, pages 31–44,2008.
[61] C. Report. Phicomm: Security Vulnerabilities, 2017. https://www.cvedetails.com/vulnerability-list/vendor_id-16810/Phicomm.html.
[62] C. Report. Vulnerability of Phicomm Hotspots: CVE-2019-19117, 2019. https://cxsecurity.com/cveshow/CVE-2019-19117/.
[63] E. Rescorla et al. HTTP over TLS. 2000.[64] M. Roesch et al. Snort: Lightweight Intrusion Detection for Networks. In Proc. of
USENIX LISA, number 1, pages 229–238, 1999.[65] D. S. and R. L. An Empirical Study of Visual Security Cues to Prevent the
SSLstripping Attack. In Proc. of ACM ACSAC, pages 287–296, 2011.[66] P. Salgueiro, D. Diaz, et al. Using Constraints for Intrusion Detection : the
NeMODe System. In Proc. of PADL, pages 115–129, 2011.[67] T. Security. 2018 Mobile Security Report by Tencent Mobile Security Lab (in
Chinese), 2018. https://m.qq.com/security_lab/news_detail_471.html.[68] F. Seredynski and P. Bouvry. Anomaly Detection in TCP/IP Networks Using
Immune Systems Paradigm. Computer Communications, 30(4):740–749, 2007.[69] O. Shijia. Security Report of China Public WiFi in 2017, 2018. http://www.chin
adaily.com.cn/business/tech/2017-03/08/content_28474488.htm.[70] B. Shneiderman. Response Time and Display Rate in Human Performance with
Computers. ACM Computing Surveys, 16(3):265–285, 1984.[71] Shopify.com. Create an Ecommerce Website and Sell Online! Ecommerce Soft-
ware by Shopify, 2020. https://www.myshopify.com/.
[72] A. Singh et al. Vulnerability Analysis for DNS and DHCP. In Vulnerability
Analysis and Defense for the Internet, pages 111–124. 2008.[73] R. Sommer and V. Paxson. Outside the Closed World: On Using Machine Learning
For Network Intrusion Detection. In Proc. of IEEE S&P, pages 305–316. IEEE,2010.
[74] K. Soska and N. Christin. Measuring the Longitudinal Evolution of the OnlineAnonymous Marketplace Ecosystem. In Proc. of USENIX Security, pages 33–48,2015.
[75] O. Spatscheck and L. L. Peterson. Defending Against Denial of Service Attacksin Scout. In Proc. of USENIX OSDI, pages 59–72, 1999.
[76] K. Springborn and P. Barford. Impression Fraud in On-line Advertising viaPay-per-view Networks. In Proc. of USENIX Security, pages 211–226, 2013.
[77] W. Stallings, L. Brown, M. D. Bauer, and A. K. Bhattacharjee. Computer Security:
Principles and Practice. Pearson Education Upper Saddle River, NJ, USA, 2012.[78] S. Stamm, B. Sterne, and G. Markham. Reining in the Web with Content Security
Policy. In Proc. of WWW, pages 921–930, 2010.[79] B. Sugavanesh, H. P. R, and S. Selvakumar. SHS-HTTPS Enforcer: Enforcing
HTTPS and Preventing MITM Attacks. ACM SIGSOFT, 38(6):1–4, 2013.[80] K. Thomas, E. Bursztein, C. Grier, G. Ho, N. Jagpal, A. Kapravelos, D. McCoy,
A. Nappa, V. Paxson, P. Pearce, et al. Ad Injection at Scale: Assessing DeceptiveAdvertisement Modifications. In Proc. of IEEE S&P, pages 151–167, 2015.
[81] K. Thomas, J. A. E. Crespo, R. Rasti, J.-M. Picod, C. Phillips, M.-A. Decoste,C. Sharp, F. Tirelo, A. Tofigh, M.-A. Courteau, et al. Investigating CommercialPay-Per-Install and the Distribution of Unwanted Software. In Proc. of USENIX
Security, pages 721–739, 2016.[82] K. Thomas, C. Grier, D. Song, and V. Paxson. Suspended Accounts in Retrospect:
An Analysis of Twitter Spam. In Proc. of ACM SIGCOMM, pages 243–258, 2011.[83] TMall.com. TMall: An Online Shopping Platform, 2020. https://www.tmall.com/.
[84] C. Torralba. Student Admitted to ARP Spoofing His School Network throughAndroid Device, 2012. https://www.androidauthority.com/student-admitted-to-arp-spoofing-his-school-network-through-android-device-49129/.
[85] Umeng.com. Umeng: A Web Analytics Solution. https://www.umeng.com/, 2020.[86] L. Von Bertalanffy. General System Theory. New York, 41973(1968):40, 1968.[87] Whitewinterwolf.com. DHCP Exploitation Guide, 2017. https://www.whitewinte
rwolf.com/posts/2017/10/30/dhcp-exploitation-guide/.[88] Z. Whittaker. Thousands of Vulnerable TP-Link Routers at Risk of Remote
Hijack, 2019. https://techcrunch.com/2019/05/22/tp-link-routers-vulnerable-remote-hijack/.
[89] Wifi8.com. Selective Broadcasting in Metro Station, 2020. http://www.wifi8.com/.[90] E. Wustrow et al. Telex: Anticensorship in the Network Infrastructure. In Proc. of
USENIX Security, page 45, 2011.[91] J. Xiong and K. J. Securearray: Improving WiFi Security with Fine-grained
Physical-layer Information. In Proc. of ACM MobiCom, pages 441–452, 2013.[92] H. Yin, G. Chen, and J. Wang. Detecting Protected Layer-3 Rogue APs. In Proc.
of IEEE BROADNETS, pages 449–458, 2007.[93] A. Zafft and E. Agu. Malicious WiFi Networks: A First Look. In Proc. of IEEE
LCN, pages 1038–1043, 2012.[94] C. Zhang, P. Patras, and H. Haddadi. Deep Learning in Mobile and Wireless
Networking: A Survey. IEEE Communications Surveys & Tutorials, 21(3):2224–2287, 2019.
[95] P. Zhang, Y. Jiang, C. Lin, Y. Fan, and X. Shen. P-coding: Secure Network CodingAgainst Eavesdropping Attacks. In Proc. of IEEE INFOCOM, pages 1–9, 2010.
[96] L. Zhu, Z. Hu, J. Heidemann, D. Wessels, A. Mankin, and N. Somaiya. Connection-oriented DNS to Improve Privacy and Security. In Proc. of IEEE S&P, pages171–186, 2015.