a multicomponent model of chromophoric dissolved organic matter photobleaching
TRANSCRIPT

Photochemistry and Photobiology, 2004, 80: 52-60
A Multicomponent Model of Chromophoric Dissolved Organic Matter PhotobIeachingqs
Jared V. Goldstonet‘!*, Rossana Del Vecchio**, Neil V. Blough*2 and Bettina M. Voelker*’ ‘Department of Civil and Environmental Engineering, Massachusetts Institute of Technology, Cambridge, MA 2Department of Chemistry and Biochemistry, University of Maryland, College Park, MD
Received 17 October 2003; accepted 24 March 2004
ABSTRACT
Light absorption by chromophoric dissolved organic matter (CDOM) plays a number of roles in natural waters, including both control of the underwater light field and the initiation of many photochemical reactions. A multicomponent analysis was used to describe the effects of UV and visible radiation on the optical absorption spectra of two natural water samples, a Suwannee River fulvic acid standard (SRFA) and a Delaware Bay water sample. This analysis used a con- strained minimization technique to fit independent spectral components to the observed bleaching behavior of the water samples under monochromatic irradiation. Spectra derived from these fits were used to predict the bleaching behavior of both samples under polychromatic irradiation (A > 320 nm). This approach reproduces the kinetics and spectral behavior of polychromatic photobleaching very well at times <48 h, but underpredicts the bleaching at longer time periods.
INTRODUCTION
Light absorption by the chromophore-containing constituents of dissolved organic matter plays a number of roles in natural waters. Absorption of ultraviolet wavelengths has important ecological consequences (1,2), and the transformation of UV and visible radiation to heat can influence the thermal structure of aquatic
TPosted on the website on 5 April 2004. ?Current address: Department of Biology, Woods Hole Oceanographic
Institution, Woods Hole, MA, USA. $Current address: Earth System Science Interdisciplinary Center, Univer-
sity of Maryland, College Park, MD, USA. *To whom correspondence should be addressed (NVB): Department of
Chemistry and Biochemistry, University of Maryland, College Park, MD 20742, USA. Fax: 301-314-9121; e-mail: [email protected]
*To whom correspondence should be addressed (BMV): Department of Chemistry and Geochemistry, Coolbaugh Hall, Colorado School of Mines, 1012 14th Street, Golden, CO 80401, USA. Fax: 303-273-3629; e-mail: [email protected]
gA portion of this material was presented in poster format at the ASLO- AGU Ocean Sciences Meeting, 11-15 February 2002, Honolulu, HI, and as a talk at the ACS Spring Meeting, 23-27 March 2003, New Orleans, LA.
Abbreviations: CDOM, chromophoric dissolved organic matter; SRFA, Suwannee River fulvic acid.
0 2004 American Society for Photobiology 0031-8655/04 $5.00+0.00
systems (3). In addition, light absorption by chromophoric dissolved organic matter (CDOM) in surface waters has a signif- icant effect on the remote sensing of ocean color (3-8). Another important process is the formation of photoproducts, such as dissolved inorganic carbon (9), carbon monoxide (1&13), low- molecular weight carbonyl compounds (14-16) and various reactive oxygen species (17,18). Light absorption also alters the bioavailability of CDOM (1,19-25). The various photochemical reactions initiated by light absorption eventually lead to the destruction of the chromophores and thus to the loss of CDOM light absorption (photobleaching) (26-30).
One method of investigating constituents contributing to the absorption spectra of CDOM is to model the bleaching behavior of CDOM under both monochromatic and polychromatic irradiation. This technique has been used in studies of photochemical and photobiological systems to examine the wavelength dependence of different phenomena (31). A system in which the effects of different monochromatic wavelengths can be easily summed to produce the effects under polychromatic irradiation is a linear system. Both CO and COz photoproduction from CDOM appear to be describable as linear systems (12,31-33).
Bleaching spectra of marine CDOM have been commonly described at various observation wavelengths by biexponential decay equations in which each different observation wavelength must be described by a different set of exponential decay functions and amplitude factors (28-30). This approach is purely observa- tional, and no previous attempt has been made to approach a thorough theoretical understanding of photobleaching. A possible solution is the description of CDOM absorption spectra as a superposition of multiple chromophores. A significant issue that must be addressed within this theoretical description of CDOM spectra is the bleaching of absorption at wavelengths far from the irradiation wavelengths (“off axis”) observed during photobleach- ing experiments (34).
The goals of this study are two-fold. First, we describe a chemically reasonable model of CDOM photobleaching under monochromatic irradiations on the basis of the linear superposition of independent chromophores. Second, we examine the feasibility of applying this linear model to the photobleaching of CDOM observed under polychromatic irradiations. We intended this to be a general, practical model of CDOM photobleaching that might be applicable in certain systems. However, we have found that polychromatic irradiations of CDOM cannot be adequately reproduced with the same model, suggesting that CDOM photo- bleaching is not describable as a linear system.
52

Photochemistry and Photobiology, 2004, 80 53
MATERIALS AND METHODS Theory
An approach to modeling photobleaching rates is possible if CDOM behaves as a mixture of independent chromophores bleaching to products that do not absorb light in the spectral range being observed. This model may hold true even if the different components are chemically bonded to each other, as long as they absorb light independently and the photobleaching of one chromophore does not affect the photobleaching of others. The important assumption that there is no production of intermediate products with different bleaching rates cannot be tested readily with the model presented here; it is an issue that should be addressed in future studies.
The direct proportionality of bleaching rate with photon-absorption rate under optically thin conditions is derived in the Appendix. A first-order decay of each chromophore is predicted
- _ dc' - -k,c, dt
where ci is the concentration of the ith chromophore, and under monochromatic light at wavelength hj,
where I&,) is the irradiance ~i(hj) is the decadic molar extinction co- efficient of the ith chromophore and +i(hj) is the quantum yield of the loss of the ith chromophore. Given an observation wavelength Lobs, the contribu- tion of chromophore i at time t to the total absorption (neglecting water, see Appendix), aT(hob,,t) is defined as ai(h,b,,t), so that
By integrating Eq. 1 , we obtain
c,(t) = ci(0)e-kJ, (4)
and thus
ai( Lobs, t) = Ei (h&s)Ci(0)e-"(5)'. (5)
This leads to the modeled equation
aT(hobsr t) = c ai(hobs,O)e-k~o+. (6) i=l t o n
The variable aT(hubs.t) is thus the experimental observations of bleaching of total absorption as a function of irradiation time. The goal of the modeling, then, is to find the component spectra a,(h,,bs,o) and rate coefficients k, which best fit the experimental data. Note that Eq. 6 implies that the bleaching rate coefficient of the ith component chromophore, ki(h,). must be independent of observation wavelength hob8 and directly proportional to the chromophore's molar extinction coefficient at the irradiation wavelength, ~ ~ ( h , ) , the quantum yield of photobleaching, +&), and the irradiance at wavelength h,, Io(hj) (see Eq. 2).
Relaxed model
An initial model was developed using an irradiation wavelength4ependent quantum yield, For each data set generated at monochromatic irradiation wavelength A,, then, there is a set of rate coefficients k,(h,) such that
ki(hj) = k:(hj)'b(hj), (7)
where, from Eqs. 2 and 3
k; (1,) = 0.0023034,( h , ) ~ ~ (1,) = 0.0023034i (hj).[ 1 /ci (0)].ai (h,, 0). (8)
Thus, the relaxed model seeks values of ai(hj,O) and an independent value of k;(h,) for each chromophore and irradiation wavelength.
//The quantum yield +i can be expressed in terms of a photobleaching cross section, CTP,~, and an absorption cross section, uA,i (both in units of mz mol photons-'): ~$i = O~,~(~)/CT,&). The absorption cross section is equal to ~(h)/1000, so ki(hj) is equal to 2.303,op,i(hj).Io(h,).
Constrained model
The simplest photochemical model of photobleaching consists of in- dependent, noninteracting chromophores each bleaching with a constant quantum yield to transparent products. If CDOM bleaching reactions arise from the lowest lying excited states, either singlet or triplet, then the quantum yield of bleaching of each chromophore (+i) should be independent of the wavelength of light used to excite the chromophore (hj) and Eq. 2 becomes:
k, (1,) 1 O.O0234i.&, (h,).Io (5). (9)
Natural waters contain unknown concentrations of various unidentified chromophores, such that neither ei(k;) nor ci(0) are known. Substituting ai(hj,O) for the product of these terms, as 'in Eqs. 3 and 8, allows us to redefine the decay equation in terms of absorption coefficients but causes us to use a term for the quantum yield that incorporates the initial con- centration of the ith chromophore:
ki( h,) = O.O023++i/~i (0)l.q (hj, O),Io( 1,). (10)
Here, in contrast to Eq. 7. kickJ) is constrained to be proportional to the fitted absorption coefficient at the irradiation wavelength. This model thus seeks to fit a&O) and irradiation wavelength-independent values of tpi/c,(0).
Photobleaching
Monochromatic bleaching spectra were obtained by irradiating Suwannee River fulvic acid (SRFA) and Delaware Bay water samples with monochromatic light as described previously (34). The samples were irradiated with five different wavelengths of light between 296 and 407 nm corresponding to the maximum emission lines of a high-pressure mercury lamp. These wavelengths also span the range of environmentally relevant wavelengths that are the most effective for photochemical and photo- bleaching reactions: UV-B (280-315 nm) through violet to blue (400430 nm). A monochromator was used to isolate 10 nm bandwidths. Spectral absorption values are reported as absorption coefficients in units of per meter. Polychromatic irradiation experiments were also conducted on the same samples. High-pressure xenon arc systems were used to simulate solar radiation, with cutoff filters used to exclude wavelengths below 320, 360 and 400 nm and water filters used to exclude infrared radiation (heat) so as to avoid thermal effects.
Modeling
All calculations were performed in MATLAB (Mathsoft Corp., Malden, MA). Our data set is composed of five different sets of absorption spectra, with each set being a photobleaching experiment in which the CDOM sample was irradiated with monochromatic light at a different wavelength 1, (296, 313, 334, 366 and 407 nm). Because we are attempting to use the same set of chromophores to describe all the different data sets, we have concatenated the five different experiments into a matrix A composed of columns of absorption spectra with the rows corresponding to the sampling times of the different experiments.
To determine the rate constants and the spectra of the independent chromophores, we set up an algorithm to find the matrices B and P that fit the data matrix A:
A = B * P . (11)
The matrix B contains the spectra of the n chromophores arranged in columns, such that each column is the spectrum of the ith chromophore at the observation wavelengths, a,(hObs). The matrix P describes the exponential decay of the spectral components in B (see Eq. 6), exp[-ki(h,).t], with each row representing a different component and each column a different time point of a monochromatic bleaching experiment (see Theory). For example, the column of the matrix equation (Eq. 11) corresponding to the spectrum of SRFA bleached with light of intensity 10 at wavelength 313 nm (Io(313)) at time t, is:
A(3 13, tx, hobs) = al (Lobs) exp( -k; (3 1 3 ) h (3 13)&) + a2(hobs) exp(-k;(313).Io(313).tX) + . . ' + a, ( Lobs) exp( -kA (3 13) .I0 (3 13) %) (12)
For any irradiation experiment, then, the data matrix A can be fit by the iterative calculation of the spectral components (B) and their associated

54 Goldstone et a/.
Figure 1. Decrease in the reduced x' for the residual values of the two different model fits to the two different data sets (A: SRFA, B: Delaware Bay). The reduced x2 is computed as C(A - B * P)'/(vD * o'), where VD is the degrees of freedom and o is an estimate of the error in each measurement. This error is approximated as both an absolute uncertainty of t0.04/m and a relative uncertainty of 20.4%.
kinetic behavior (P) if the spectral characteristics of the light source, I,(hj) are known. Our algorithm for the relaxed model consists of the following loop: (1) initial guess at a set of ki(hj) values to give an initial guess at P; (2) initial guess at B; (3) calculation of the sum of squared residuals of A - B * P as the cost function; and (4) iteration to determine a better set of k:(hj) and B using' a geometric search algorithm in Matlab (boundary constrained search routine using sequential quadratic pro- gramming, frnincon). The search routine was constrained to find only positive values of k[(hj) and B. An additional constraint held the sum of a,(h,O) less than or equal to the initial a,(h,O). The constrained model algorithm differed primarily in that rather than using a set of five k/(hj) for each ai(h,O), we used one [@i/ci(O)] value for each component i and included the spectral components (B) in the exponential function used to generate P (Eq. 9). The resulting model was iterated in the same manner as the unconstrained model.
To examine the possibility of returning local minima as solutions, the algorithm was initiated with different initial guesses of B and ki(hj), including minimum (zero) and maximum (maximum absorption at observation wavelength) values of the spectral components in B. Identical solutions were returned after iteration of the minimization algorithm. The algorithm iteration using more than four components (five to nine) in some cases returned very slightly different solutions for the same number of components, but this did not significantly alter the quality of the fits.
Polychromatic reconstruction
To examine the hypothesis of CDOM photobleaching as a linear system and to test the predictive abilities of the generated model fits, the modeled decay coefficients and spectral components generated from the monochromatic photobleaching data were used in a calculation of the spectral dependence of CDOM samples bleached with polychromatic light. The calculation of spectral components and exponential decay coefficients from the mono- chromatic photobleaching data represents an exercise in model fitting. That is, model parameters were modified according to criteria (defined above) to produce a good match between the model and the observed data. Reconstruction of the polychromatic bleaching data is not a fitting exercise, but instead a calculation produced by inserting the experimental parameters of the polychromatic irradiation experiments (time and irradiance) into the model obtained during the monochromatic fitting exercise. Reconstruction of polychromatic bleaching spectra was performed by binning the polychromatic irradiance in 10 nm wide bins at 10 nm increments between 280 and 410 nm in the same format as the monochromatic data. Note that this calculation assumes that any visible light (h > 410) present during the polychromatic irradiations has a negligible effect on photobleaching.
Relaxed model. Rate coefficients k[(hj) were determined for each component at the five monochromatic irradiation wavelengths. These coefficients were fit with a cubic interpolation to determine the rate coefficients at 10 nm intervals between 280 and 410 nm. These were then multiplied by the irradiance values and summed to produce the exponential rate coefficients, ki, in the polychromatic experiments:
kt = k:(h).I,,i,,~,,,,~(h). (13) h=280 to 410 nrn
Equation 6 was then used to calculate the predicted spectra.
Figure 2. Observed (dots) and modeled (four-component constrained model; lines) photobleaching of 10 mg/L SRFA under monochromatic irradiation with five different wavelengths. Data from each irradiation wavelength is plotted separately (A. 296 nm; B: 313 nm; C: 334 nm; D: 366 nm and E: 407 nm). Only observation wavelengths 300,320,340,360,380 and 400 nm are plotted (top to bottom of each plot). Spectral components are shown in Fig. 4B, whereas kinetic quantum yield parameters (&/ci(0)) are in Table 1. Composite residuals (the difference between the model and the data) are provided for all observation and irradiation wavelengths to show that the individual residuals are all less than 10%.
Constrained model. The rate coefficients k&) determined for each component ai were computed as $i/ci(0) multiplied by the amount of light absorbed from 280 to 410 nm:
The spectra were reconstructed as above using Eq. 6. These calculated polychromatic predictions were then compared with the actual poly- chromatic bleaching spectra obtained and with the results obtained from the application of the relaxed model to the same data sets.
RESULTS The use of a constrained minimization technique has allowed us to determine multiple sets of spectral components and associated wavelength-independent quantum yields (+Jci(0) in the con- strained model) or wavelength-dependent photobleaching coef- ficients (k[(hj) in the relaxed model) that successfully model the photochemical bleaching behavior of both SRFA and of Delaware Bay water under monochromatic irradiation. Both models can be used to describe the five different monochromatic bleaching datasets with a relatively small number of distinct components, although the more constrained model produces fits with larger residuals (mean, 2-19% versus 1 .54% for the relaxed models).

Photochemistry and Photobiology, 2004, 80 55
Figure 3. Same as Fig. 2 but for Delaware Bay seawater with five components. Spectral components are shown in Fig. 4E, whereas kinetic quantum yield parameters (+Jci(0)) are in Table 1. Individual residuals are all less than 19%.
F tests for the significance of fit exceed the critical values of the F function for all models that include more than one component, indicating that these models explain a significant portion of the variability in these data sets. Another measure of the goodness-of- fit, the reduced chi-squared values of the residual, xf, is plotted as a function of number of distinct components for both models for both CDOM samples and shown in Fig. 1. This measure includes an estimate of analytical uncertainty, in this case approximated as both an absolute uncertainty of 20.04 m-’ and a relative uncertainty of 20.4% in the measured values of a(h). These error estimates are based on our experience with this instrumentation. The x: values do not continue to decrease rapidly after four components, indicating that four components supply a good fit for both the constrained and relaxed models of SRFA and the Delaware Bay seawater. Because the xl values appear to approach
Table 1. “Concentration-normalized” quantum yields (&/ci(O)) for the “best-fit’’ number of components for the constrained model. The best fit was determined from the xf and analysis of variance as discussed in the Results
Component number SRFA Delaware Bay
a1 15.88 1.722
a3 0.3073 78.14
a5 - 18.16
a2 58.24 5.343
a4 107.8 354.5
280 300 3W 340 3W 380 4W 280 3(13 3W 340 3W 380 4W
W W & W wwdmgth
Figure 4. Absorption (ai) values of the three-, four- and five-component fits of the constrained model to the monochromatic bleaching data of SRFA (A-C) and Delaware Bay seawater (D-F).
numbers larger than one, it is likely that our estimation of the analytical uncertainty has been overly optimistic. More importantly, comparison of the two models shows that the fully constrained model displays greater xf values; in other words, this model does not describe the data as well as the relaxed model. However, there is no guarantee that, although these are significant fits, these com- puted components represent the best fits (the global minima).
Constrained model
Examples of constrained model fits to the SRFA and Delaware data are presented in Figs. 2 and 3. The values obtained from the fits for the wavelength-independent quantum yields ( ~ J C ~ , ~ ) of the constrained models are presented in Table 1, whereas the spectral shape of the three-, four- and five-component fits are presented in Fig. 4. As spectral components are added to the model, certain spectra aspects, notably a broad peak centered at 330 nm and another (apparently) centered at <280 nm in the SRFA data (A-C), are retained in the new fits, suggesting that these may be stable features. However, conserved features are not apparent in the fits of the Delaware Bay data (D-F).
Relaxed model
The multicomponent (more than two components) relaxed models produce excellent fits at all wavelengths in the time courses of absorption loss in each individual monochromatic bleaching experiment. These fits share some general characteristics. Each fit contains at least one component contributing a large portion of the absorption that has a shape similar to the initial CDOM spectra. This component generally bleaches more slowly (has a smaller k/(hj); Table 2) than the other components (for example, a3 for the four-component fit to SRFA and a, for the four-component fit to Delaware Bay in Table 2 and Fig. 5).
We are hesitant to conclude that the components calculated from the monochromatic data represent more than just mathematically derived functions. Some evidence for the constrained components as mathematical fits rather than real components can be discerned by examining the calculated component spectra (Fig. 4). The sharp positive and negative deviations from smooth lines in different components of the same constrained model fits, especially in the Delaware Bay fits (e.g. Fig. 4D, at 360 nm) argues that these do not represent real chromophores because most absorbing organic

56 Goldstone eta/.
Table 2. are the irradiance values for the SRFA and Delaware Bay monochromatic bleaching experiments (in photons m-2 s-' X 1019 binned every 10 nm)
The bleaching decay constants, k', in units of m2 (mol photons)-', for the best fit of the relaxed model to the monochromatic data sets. Also shown
Bleaching decay constants at monochromatic wavelengths Sample identity Component number k' (296) k' (313) k' (334) k' (366) k' (407)
SRFA a1 4 components a2
a3
Delaware a1 4 components a2
a3
a4
a4
Delaware Bay Irradiance SRFA
1.839 0.089 0.061 0.040 0.052 0.206 0.337 0.085 1.64 1.89
1.650 0.298 0.025 0.022 0.018 0.083 0.174 0.101 3.97 2.99
0.028 0.480 0.01 1 0.022 0.01 1 0.01 1 0.024 2.697 1.55 0.857
0 0.207 0.003 0.258 0.009 1.65 1 0 0.146 4.31 4.31
0.006 0.001 0 0.542 0.001 1.164 0 0 2.2 1 1.70
species do not exhibit abrupt spectral maxima. Although the spectral components produced by the relaxed model appear more reasonable, the explicit assumption of the model, i.e. that the quantum yield of an independent spectral component is not irradiation wavelength independent, precludes these components from representing chromophores undergoing simple photochemical reactions from the lowest lying excited states. However, despite this, it is possible that one or more of the spectral components calculated in the relaxed fits do represent actual chromophores, an idea that warrants further investigation.
Polychromatic reconstruction
To test the validity of the model as a predictor of CDOM photobleaching, spectra calculated from the components and rate constants determined from the monochromatic bleaching experi- ments were used to reconstruct the spectra of CDOM samples bleached with polychromatic light (hbb > 320, 360 and 400 nm). The computed absorption bleaching curves (lines) for SRFA are shown in Fig. 6 and compared with actual polychromatic bleaching spectra obtained on the same water samples (circles). The percent normalized residual values ((data-predicted)/data X 100%) at each wavelength for the four-component model of the polychromatic bleaching data are presented for the constrained model in Fig. 7A- C for SRFA and for the relaxed model in Fig. 8A-C. The residuals
w.rekWlh rrm- -m!=@
Figure 5. Absorption (&) values of the three-, four- and five-component fits of the relaxed model to the monochromatic bleaching data of SRFA ( A X ) and Delaware Bay seawater (D-F).
for the Delaware Bay CDOM constrained model are shown in Fig. 9A,B. The summed squared residual values are presented in Table 3. These residual values suggest that four components provide a decent reconstruction of the polychromatic data. Other numbers of components also provide reasonable reconstructions of the data. However, as can be noted by the disagreement between the computed polychromatic spectra (lines) and observed absorp-
35 I , 35, I
0 50 100 50 100 time (hr) time (hr) time (hr)
C C C p f 2 $ 2
4 1 i1 1 1
0 ' 1
0 50 100 0 50 100 0 50 100 time (hr)
25 C
$20
4 15 I 0
5
0 0 50
time (hr)
time (hr) time (hr)
I0
Figure 6. Comparison of reconstructed constrained model spectra calculated for different numbers of components (one to seven components: A-G, respectively) with observed absorption values for polychromatic (Aj > 320 nm) irradiation of SRFA. The four-component fit provides the best reconstruction of the polychromatic data. Only selected observation wavelengths are shown in each subplots, corresponding to (top to bottom) 300, 320, 340, 360, 380 and 400 nm.
Photochemistry and Photobiology, 2004, 80 57
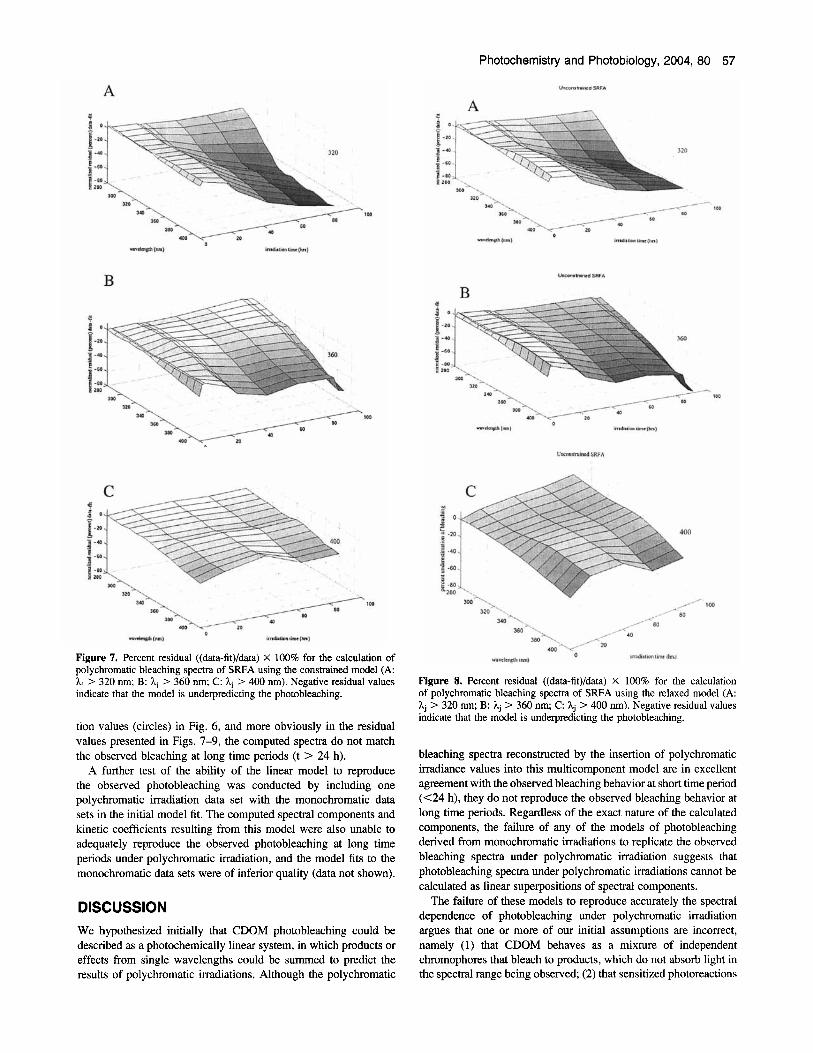
Figure 7. Percent residual ((data-fit)/data) X 100% for the calculation of polychromatic bleaching spectra of SRFA using the constrained model (A: k j > 320 nm; B: k, > 360 nm; C: kj > 400 nm). Negative residual values indicate that the model is underpredicting the photobleaching.
tion values (circles) in Fig. 6, and more obviously in the residual values presented in Figs. 7-9, the computed spectra do not match the observed bleaching at long time periods (t > 24 h).
A further test of the ability of the linear model to reproduce the observed photobleaching was conducted by including one polychromatic irradiation data set with the monochromatic data sets in the initial model fit. The computed spectral components and kinetic coefficients resulting from this model were also unable to adequately reproduce the observed photobleaching at long time periods under polychromatic irradiation, and the model fits to the monochromatic data sets were of inferior quality (data not shown).
DISCUSSION We hypothesized initially that CDOM photobleaching could be described as a photochemically linear system, in which products or effects from single wavelengths could be summed to predict the results of polychromatic irradiations. Although the polychromatic
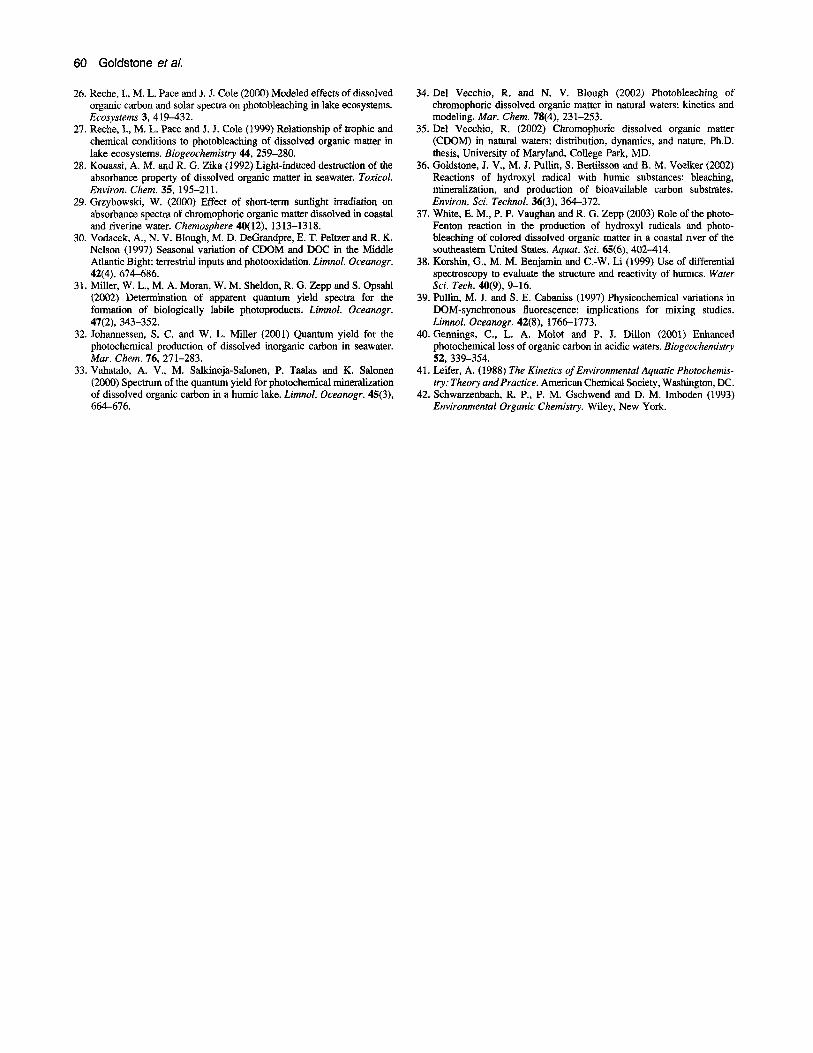
Figure 8. Percent residual ((data-fit)/data) X 100% for the calculation of polychromatic bleaching spectra of SRFA using the relaxed model (A: hj > 320 nm; B: hj > 360 nm; C: 4 > 400 nm). Negative residual values indicate that the model is underpredicting the photobleaching.
bleaching spectra reconstructed by the insertion of polychromatic irradiance values into this multicomponent model are in excellent agreement with the observed bleaching behavior at short time period (<24 h), they do not reproduce the observed bleaching behavior at long time periods. Regardless of the exact nature of the calculated components, the failure of any of the models of photobleaching derived from monochromatic irradiations to replicate the observed bleaching spectra under polychromatic irradiation suggests that photobleaching spectra under polychromatic irradiations cannot be calculated as linear superpositions of spectral components.
The failure of these models to reproduce accurately the spectral dependence of photobleaching under polychromatic irradiation argues that one or more of our initial assumptions are incorrect, namely (1) that CDOM behaves as a mixture of independent chromophores that bleach to products, which do not absorb light in the spectral range being observed; (2) that sensitized photoreactions

58 Goldstone et a/.
Table 3. Sum of squared normalized residuals (C((data-model)/data)*) for the comparison of calculated polychromatic bleaching spectra with observed spectra obtained under polychromatic irradiation (>320 nm)
Figure 9. Percent residual ((data-fit)/data) X 100% for the calculation of polychromatic bleaching spectra of Delaware Bay using the constrained model (A: ;lj > 320 nm; B: 2, > 360 MI). Negative residual values indicate that the model is underpredicting the photobleaching.
leading to nonlinear behavior are negligible; and (3) that visible light (1 > 410 nm) does not play an important role in photobleaching.
A previous study indicated that there is no production of new chromophores at wavelengths greater than 340 nm (35). However, the production of intermediate chromophores cannot be tested with this model and so remains a possible issue.
The assumption of negligible sensitized photoreactions seems likely to be accurate. The most probable candidate reactive oxygen species for indirect photobleaching effects, hydroxyl radical (OH.), does not represent a significant percentage of the total CDOM photobleaching at most natural fluxes (36). However, OH. does appear to be more efficient at bleaching the longer wavelengths of SRFA, and this tendency is more pronounced at higher OH. doses (equivalently longer irradiation times given a constant source of OH.; unpublished data). Thus, OH. may have some effect on the long-term bleaching behavior of some freshwater samples, for which this process has not been well studied (37).
These models might not account for much photobleaching due to visible wavelengths because the longest wavelength of mono- chromatic light used in this study was only 407 nm. However, these models were able to reproduce the spectra of CDOM samples irradiated with polychromatic light above 400 nm with minimal residuals (see Fig. SC), indicating that visible light does not account for the significant underprediction observed.
Sum of squared residuals
SRFA Delaware
Number of I > I > I > I > components 320nm 360nm 320nm 360nm
Constrained model 1 3.5 13.9 53 80 2 3.7 10.8 54 72 3 8.6 3.7 47 66 4 9.6 2.9 29 40 5 7.5 2.3 31 35 6 9.8 4.1 35 54 7 15.4 9.0 35 53
1 9.1 7.6 4.2 11 2 8.6 7.9 9.1 5.1 3 11 7.3 20 4.0 4 8.9 8.6 2.5 6.8 5 7.3 9.7 4.5 8.7 6 8.5 5 .O 1.2 7.8 7 8.3 7.4 1.1 4.9
Relaxed model
Because the other explanations appear unlikely, a prime candidate for the failure to reproduce the spectral evolution under polychromatic irradiation is the presence of nonnegligible electronic coupling of the absorbing chromophore with another portion of the CDOM (e.g. through energy or charge transfer). This hypothesis is not proven by this data but does merit further study. Data obtained under conditions designed to examine the presence of electronically coupled systems have produced results incom- patible with a model of independently bleaching chromophores (35, R. Del Vecchio and N. V. Blough, unpublished).
Interchromophore charge-transfer interactions (38) may produce the complex photobleaching behavior of CDOM. These inter- actions arise from electronic coupling, are most likely to be large for species that are closely adjacent to each other and should decrease rapidly with interchromophore distance. A conformational change, e.g. induced by a pH change, or a chemical disruption that alters the orientation or distance between two interacting species will also alter the magnitude of this electronic coupling. The pH-induced changes in absorption and fluorescence spectra of CDOM have been observed for a number of different CDOM sources, although it is not clear that these changes are due to this phenomenon (39,40).
The failure of the multicomponent monochromatic model developed in this study to fit polychromatic photobleaching data sets argues that CDOM photobleaching does not behave as a linear system but is instead a complex, nonlinear system that cannot be modeled in a simple manner. Despite these shortcomings, our model does appear to create a reasonable approximation of the time evolution of CDOM photochemical bleaching for SRFA during short time intervals. Because the model developed here explicitly contains the time and wavelength dependence of the spectra evolution of CDOM, it may be useful in the modeling of the alterations to the underwater light field caused by CDOM photobleaching.
Acknowledgements-David Glover and Andrew Beet helped with the sta- tistical analyses and with discussions about the Matlab coding. This work

Photochemistry and Photobiology, 2004, 80 59
was funded by the National Science Foundation (Grant OCE-9819089) and the Office of Naval Research (Grants N00014-91-5-1260 and N00014-95-1020 1).
APPENDIX The rate of destruction of a chromophore i present at concentration ci is described by:
where Wi(h) is the rate of photon absorption of chromophore i (E m-' day-') in a water column of depth D (in m), $i(h) is the quantum yield of i (moles of i bleached per E of photon absorbed) at wavelength h and the factor 1000 converts m3 to liters. The integral over wavelengths h is the integral over the range of irradiation wavelengths. The observed loss of absorption as a function of time for such a mixture of chromophores can then be derived from the treatments outlined in (41) and (42).
In the presence of a mixture of chromophores, the solution's total decadic absorption coefficient a (in m-I) at wavelength h is given by:
where a,&) represents the absorption of the medium (water) and ~ ( h ) is the decadic molar absorption coefficient (in M-' rn-I) of chromophore i. The value of a(h) is measured easily, but this measurement provides no information about the individual chromophores present. If light scattering is insignificant (i.e. under conditions of low turbidity) and if the light beam enters the solution perpendicular to the surface, the attenuation of light intensity with depth z is given by:
I,@) = b(h)(lO-"("") (-43)
where, I&) (Em-' day) is the irradiance of light at wavelength h entering the water and I& is the irradiance penetrating to depth z. By Beer's Law, for a pathlength dz short enough so that Iz+dz % I,, the rate of light absorption by chromophore i at wavelength h in a thin slice of solution at depth z is given by:
dWi(h) = 2.303I,(h)~,i(h)~j dz. (-44)
The rate of absorption of light of wavelength h by chromophore i, Wi(h), for a water column of depth D is obtained by integration (Eqs. A5 and A6, below):
Wi(h) = ID 2.303IZ(h)&i(h)ci dz
= 2.303b(h)&,(h)q 10-"(')* dz,
providing
For optically thin solutions (a(h)D < 0.02), the above simplifies to
W,(h) = 2.303b(h)&,(h)c,D. (A71
A first-order decay of each chromophore will thus be observed:
where from Eqs. A1 and A7,
REFERENCES 1. Zepp, R. G., T. V. Callaghan and D. J. Erickson (1998) Effects
of enhanced solar ultraviolet radiation on biogeochemical cycles. J . Photochem. Photobiol. B: Biol. 46, 69-82.
2. Williamson, C. E. (1995) What role does UV-B radiation play in freshwater ecosystems? Limnol. Oceanogr. 40(2), 386-392.
3. Kirk, J. T. 0. (1994) Light and Photosynthesis in Aquatic Ecosystems. Cambridge University Press, Cambridge, p. 5091.
4. Carder, K. L., R. G. Steward, G. R. Harvey and P. B. Ortner (1989) Marine humic and fulvic acids: their effects on remote sensing of ocean chlorophyll. Limnol. Oceanogr. 34(1), 68-8 1.
5. Twardowski, M. S. and P. L. Donaghay (2001) Separating in situ and tenigenous sources of absorption by dissolved materials in coastal waters. J . Geophys. Res.-Oceans 106(C2), 2545-2560.
6. Hoge, F. E., A. Vodacek and N. V. Blough (1993) Inherent optical properties of the ocean: retrieval of the absorption coefficient of chromophoric dissolved organic matter from fluorescence measure- ments. Limnol. Oceanogr. 38(7), 1394-1402.
7. Hoge, F. E. and P. E. Lyon (1999) Spectral parameters of inherent optical property models: method for satellite retrieval by matrix inversion of an oceanic radiance model. Appl. Opt. 38(9), 1657-1662.
8. Hoge, F. E., C. W. Wright, P. E. Lyon, R. N. Swift and J. K. Yungel (1999) Satellite retrieval of the absorption coefficient of phytoplankton phycoerythrin pigment: theory and feasibility status. Appl. Opt. 38(36),
9. Miller, W. L. and R. G. Zepp (1995) Photochemical production of dissolved inorganic carbon from terrestxial organic matter: significance to the global carbon cycle. J . Geophys. Res. 22, 417420.
10. Zuo, Y. and R. D. Jones (1995) Formation of carbon monoxide by photolysis of dissolved marine organic material and its significance in the carbon cycling of the oceans. Naturwissenschaften 82, 472-474.
11. Zuo, Y. and R. D. Jones (1997) Photochemistry of natural dissolved organic matter in lake and wetland waters-production of carbon monoxide. Water Res. 31(4), 850-858.
12. Ziolkowski, L. A. (2000) Marine photochemical production of carbon monoxide. M.Sc. thesis, Dalhousie University, Halifax, Canada.
13. Valentine, R. L. and R. G. Zepp (1993) Formation of carbon monoxide from the photodegradation of terrestrial dissolved organic carbon in natural waters. Environ. Sci. Technol. 27(2), 409414.
14. Mopper, K. and W. L. Stahovec (1986) Sources and sinks of low molecular weight organic carbonyl compounds in seawater. Mar. Chem. 19, 305-321.
15. Zhou, X. and K. Mopper (1997) Photochemical production of low- molecular-weight carbonyl compounds in seawater and surface micro- layer and their air-sea exchange. Mar. Chem. 56, 201-213.
16. Kieber, R. J., X. Zhou and K. Mopper (1990) Formation of carbonyl compounds from UV-induced photodegredation of humic substances in natural waters: fate of nverine carbon in the sea. Limnol. Oceanogr.
17. Cooper, W. J., C. W. Shao, D. R. S. Lean, A. S. Gordon and F. E. Scully (1994) Factors affecting the distribution of H202 in surface waters. In Environmental Chemistry of Lakes and Reservoirs, Vol. 231 (Edited by L. Baker), pp. 391422. American Chemical Society, Washington, DC.
18. Blough, N. V. and R. G. Zepp (1995) Reactive oxygen species (ROS) in natural waters. In Active Oxygen in Chemistry (Edited by C. S. Foote and J. S. Valentine), pp. 280-333. Chapman and Hall, New York.
19. Bertilsson, S. and B. Allard (1996) Sequential photochemical and microbial degradation of refactory dissolved organic matter in a humic freshwater system. Arch. Hydrobiol.lAdv. Limnol. 48, 133-141.
20. Bertilsson, S. and L. Tranvik (1998) Photochemically produced carboxylic acids as substrates for freshwater bacterioplankton. Limnol. Oceanogr. 43(5), 885-895.
21. Anesio, A., C. M. T. Denward, L. J. Tranvik and W. GranCli (1999) Decreased bacterial growth on vascular plant detritus due to photo- chemical modification. Aquat. Microb. Ecol. 17, 159-165.
22. Anesio, A,, J. Theil-Nielsen and W. GranCli (2000) Bacterial growth on photochemically transformed leachates from aquatic and terrestrial primary producers. Microb. Ecol. 40(3), 200-208.
23. Tranvik, L. and S. Kokalj (1998) Decreased biodegradability of algal DOC due to interactive effects of UV radiation and humic matter. Aqat. Microb. Ecol. 14, 301-307.
24. Moran, M. A., W. M. Sheldon and R. G. Zepp (2000) Carbon loss and optical property changes during long-term photochemical and biological degradation of estuarine dissolved organic matter. Limnol. Oceanogr. 45(6), 1254-1264.
25. Moran, M. A. and R. G. Zepp (1997) Role of photoreactions in the formation of biologically labile compounds from dissolved organic matter. Limnol. Oceanogr. 42(6), 1307-1316.
7431-7441.
35(7), 1503-15 15.
60 Goldstone etal.
26. Reche, l., M. L. Pace and J. J. Cole (2000) Modeled effects of dissolved organic carbon and solar spectra on photobleaching in lake ecosystems. Ecosystems 3,419432.
27. Reche, I., M. L. Pace and J. J. Cole (1999) Relationship of trophic and chemical conditions to photobleaching of dissolved organic matter in lake ecosystems. Biogeochemistry 44,259-280.
28. Kouassi, A. M. and R. G. Zika (1992) Light-induced destruction of the absorbance property of dissolved organic matter in seawater. Toxicol. Environ. Chem. 35, 195-211.
29. Grzybowski, W. (2000) Effect of short-term sunlight irradiation on absorbance spectra of chromophoric organic matter dissolved in coastal and riverine water. Chemosphere 40(12), 1313-1318.
30. Vodacek, A., N. V. Blough, M. D. DeGrandpre, E. T. Peltzer and R. K. Nelson (1997) Seasonal variation of CDOM and DOC in the Middle Atlantic Bight: terrestrial inputs and photooxidation. Limnol. Oceanogr. 42(4), 674-686.
31. Miller, W. L., M. A. Moran, W. M. Sheldon, R. G. Zepp and S. Opsahl (2002) Determination of apparent quantum yield spectra for the formation of biologically labile photoproducts. Limnol. Oceanogr.
32. Johannessen, S. C. and W. L. Miller (2001) Quantum yield for the photochemical production of dissolved inorganic carbon in seawater. Mar. Chem. 76, 271-283.
33. Vahatalo, A. V., M. Salkinoja-Salonen, P. Taalas and K. Salonen (2000) Spectrum of the quantum yield for photochemical mineralization of dissolved organic carbon in a humic lake. Limnol. Oceanogr. 45(3), 664-676.
47(2), 343-352.
34. Del Vecchio, R. and N. V. Blough (2002) Photobleaching of chromophoric dissolved organic matter in natural waters: kinetics and modeling. Mar. Chem. 78(4), 231-253.
35. Del Vecchio, R. (2002) Chromophoric dissolved organic matter (CDOM) in natural waters: distribution, dynamics, and nature. Ph.D. thesis, University of Maryland, College Park, MD.
36. Goldstone, J. V., M. I. Pullin, S. Bertiisson and B. M. Voelker (2002) Reactions of hydroxyl radical with humic substances: bleaching, mineralization, and production of bioavailable carbon substrates. Environ. Sci. Technol. 36(3), 364-372.
37. White, E. M., P. P. Vaughan and R. G. Zepp (2003) Role of the photo- Fenton reaction in the production of hydroxyl radicals and photo- bleaching of colored dissolved organic matter in a coastal river of the southeastern United States. Aquut. Sci. 65(6), 402-414.
38. Korshin, G., M. M. Benjamin and C.-W. Li (1999) Use of differential spectroscopy to evaluate the structure and reactivity of humics. Wafer Sci. Tech. 40(9), 9-16.
39. Pullin, M. I. and S. E. Cabaniss (1997) Physicochemical variations in DOM-synchronous fluorescence: implications for mixing studies. Limnol. Oceanogr. 42(8), 1766-1773.
40.Gennings, C., L. A. Molot and P. I. Dillon (2001) Enhanced photochemical loss of organic carbon in acidic waters. Siogeochemistry 52,339-354.
41. Leifer, A. (1988) The Kinetics of Environmental Aquatic Photochemis- try: Theory and Practice. American Chemical Society, Washington, DC.
42. Schwarzenbach, R. P., P. M. Gschwend and D. M. Imboden (1993) Environmental Organic Chemistry. Wiley, New York.