a multi-level parallel implementation of a program for finding frequent patterns in a large sparse...
Post on 21-Dec-2015
216 views
TRANSCRIPT
A Multi-Level Parallel Implementation of a Program for Finding Frequent Patterns in a Large Sparse Graph
Steve Reinhardt, Interactive Supercomputing [email protected]
George Karypis, Dept. of Computer Science, University of Minnesota

Outline Problem definition Prior work Problem and Approach Results Issues and Conclusions
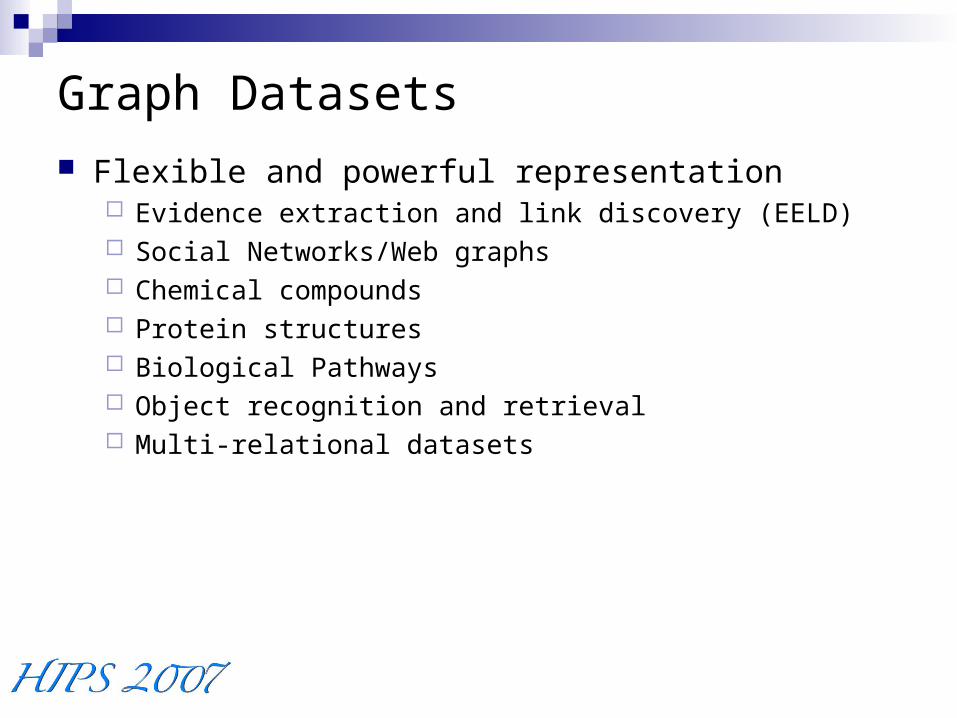
Graph Datasets Flexible and powerful representation
Evidence extraction and link discovery (EELD) Social Networks/Web graphs Chemical compounds Protein structures Biological Pathways Object recognition and retrieval Multi-relational datasets
Finding Patterns in GraphsMany Dimensions
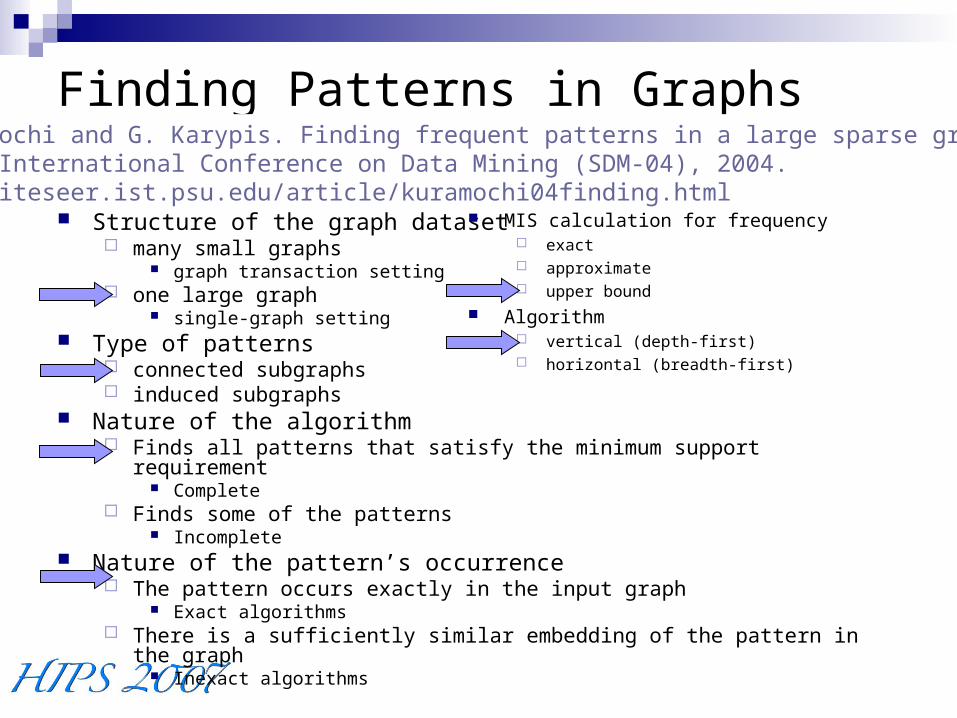
Structure of the graph dataset many small graphs
graph transaction setting one large graph
single-graph setting Type of patterns
connected subgraphs induced subgraphs
Nature of the algorithm Finds all patterns that satisfy the minimum support requirement
Complete Finds some of the patterns
Incomplete Nature of the pattern’s occurrence
The pattern occurs exactly in the input graph Exact algorithms
There is a sufficiently similar embedding of the pattern in the graph Inexact algorithms
MIS calculation for frequency exact approximate upper bound
Algorithm vertical (depth-first) horizontal (breadth-first)
M. Kuramochi and G. Karypis. Finding frequent patterns in a large sparse graph. In SIAM International Conference on Data Mining (SDM-04), 2004. http://citeseer.ist.psu.edu/article/kuramochi04finding.html

Single Graph Setting
Find all frequent subgraphs from a single sparse graph. Choice of frequency definition
Input Graph Size 7Frequency = 6
Size 6Frequency = 1

vSIGRAM: Vertical Solution Candidate generation by extension
Add one more edge to a current embedding. Solve MIS on embeddings in the same equivalence class. No downward-closure-based pruning
Two important components Frequency-based pruning of extensions Treefication based on canonical labeling
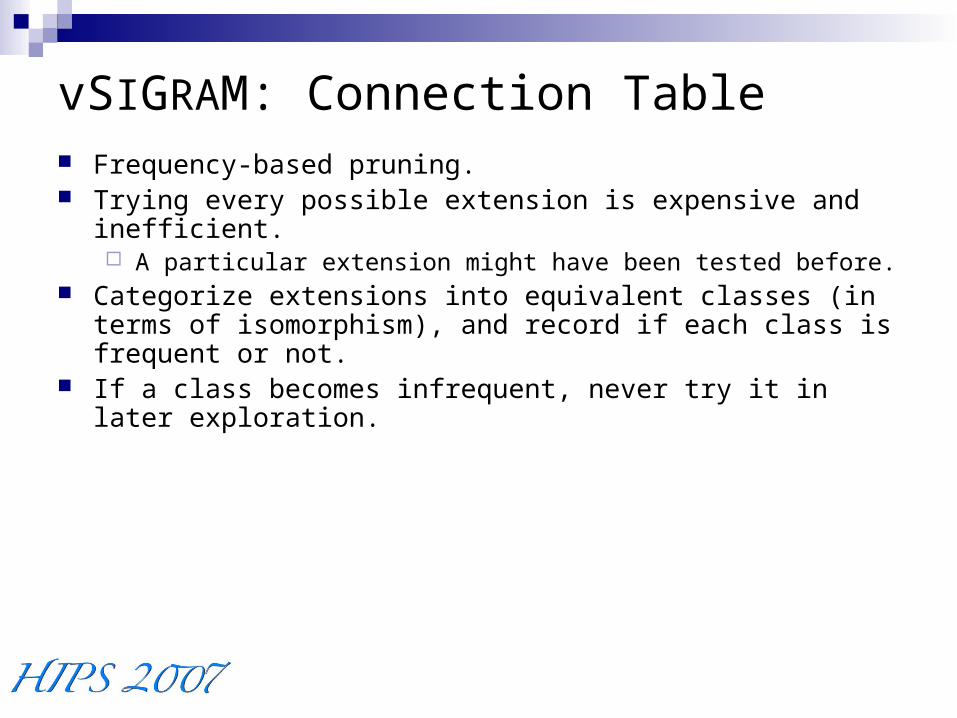
vSIGRAM: Connection Table Frequency-based pruning. Trying every possible extension is expensive and inefficient.
A particular extension might have been tested before. Categorize extensions into equivalent classes (in terms of
isomorphism), and record if each class is frequent or not. If a class becomes infrequent, never try it in later exploration.

Parallelization Two clear sources of parallelism in the algorithm
Amount of parallelism from each source not known in advance The code is typical C code
structs, pointers, frequent mallocs/frees of small areas, etc. nothing like the “Fortran”-like (dense linear algebra) examples shown for
many parallel programming methods Parallel structures need to accommodate dynamic parallelism
Dynamic specification of parallel work Dynamic allocation of processors to work
Chose OpenMP taskq/task constructs Proposed extensions to OpenMP standard Support parallel work being defined in multiple places in a program, but
be placed on a single conceptual queue and executed accordingly ~20 lines of code changes in ~15,000 line program
Electric Fence was very useful in finding coding errors

Algorithmic ParallelismvSiGraM (G, MIS_type, f)1. F ← 2. F1 ← all frequent size-1 subgraphs in G3. for each F1 in F1 do4. M(F1) ← all embeddings of F1
5. for each F1 in F1 do // high-level parallelism6. F ← F vSiGraM-Extend(F1, G, f)return F
vSiGraM-Extend(Fk, G , f)1. F ← 2. for each embedding m in M(Fk) do // low-level parallelism3. Ck+1 ← C k+1 {all (k+1)-subgraphs of G containing m}4. for each Ck+1 in Ck+1 do5. if Fk is not the generating parent of Ck+1 then6. continue7. compute Ck+1.freq from M(Ck+1)8. if Ck+1.freq < f then9. continue10. F ← F vSiGraM-Extend(Ck+1, G, f)11.return F
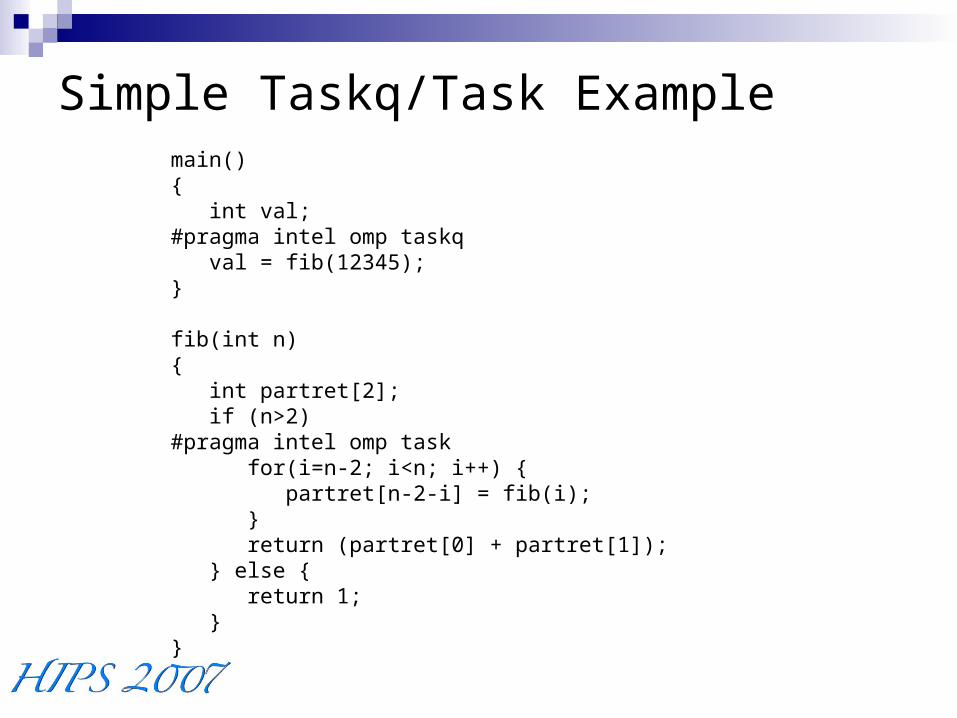
Simple Taskq/Task Examplemain(){ int val;#pragma intel omp taskq val = fib(12345);}
fib(int n){ int partret[2]; if (n>2)#pragma intel omp task for(i=n-2; i<n; i++) { partret[n-2-i] = fib(i); } return (partret[0] + partret[1]); } else { return 1; }}

High-Level Parallelism with taskq/task// At the bottom of expand_subgraph, after all child
// subgraphs have been identified, start them all.
#pragma intel omp taskq
for (ii=0; ii<sg_set_size(child); ii++) {
#pragma intel omp task captureprivate(ii)
{
SubGraph *csg = sg_set_at(child,ii);
expand_subgraph(csg, csg->ct, lg, ls, o);
} // end-task
}

Low-Level Parallelism with taskq/task#pragma omp parallel shared(nt, priv_es) {#pragma omp master { nt = omp_get_num_threads(); //#threads in par priv_es = (ExtensionSet **)kmp_calloc(nt, sizeof(ExtensionSet *)); } #pragma omp barrier#pragma intel omp taskq { for (i = 0; i < sg_vmap_size(sg); i++) {#pragma intel omp task captureprivate(i) { int th = omp_get_thread_num(); if (priv_es[th] == NULL) { priv_es[th] = exset_init(128); } expand_map(sg, ct, ams, i, priv_es[th], lg); } } } } // end parallel section; next loop is serial reduction for (i=0; i < nt; i++) { if (priv_es[i] != NULL) { exset_merge(priv_es[i],es); } } kmp_free(priv_es);}
Implementation due to Grant Haab and colleagues from Intel OpenMP library group
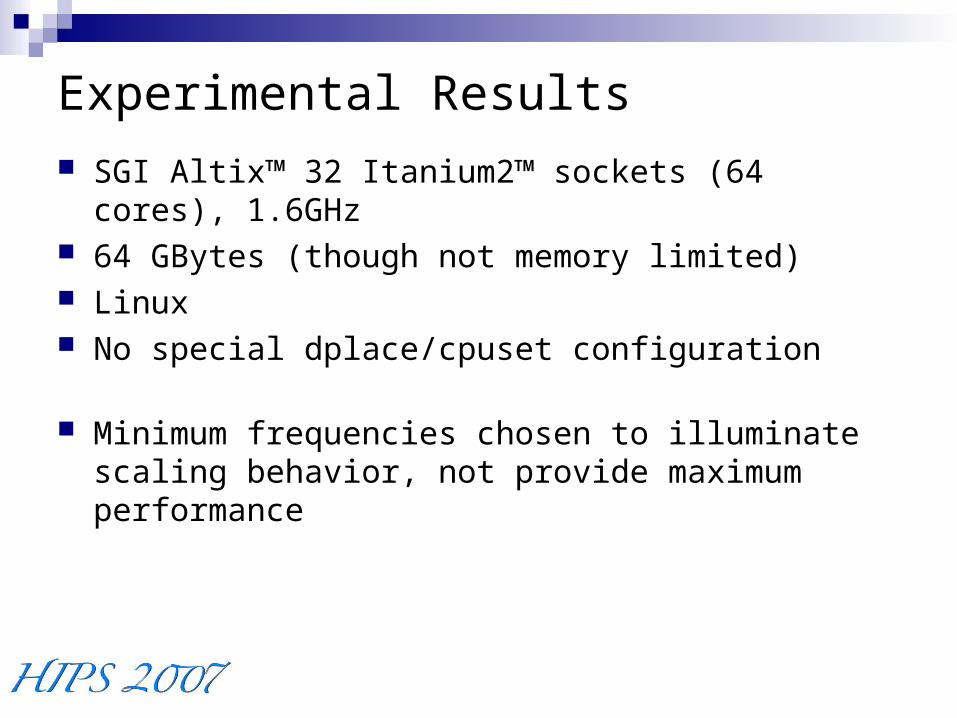
Experimental Results SGI Altix™ 32 Itanium2™ sockets (64 cores), 1.6GHz 64 GBytes (though not memory limited) Linux No special dplace/cpuset configuration
Minimum frequencies chosen to illuminate scaling behavior, not provide maximum performance

Dataset 1 - ChemicalGraph Frequency Type of
ParallelismNumber of processors
1 2 4 8 16 30 60
Time in seconds (speed-up)
dtp
500
High31.94 17.01
(2.03)14.76 (2.40)
13.89(2.58)
14.00(2.56)
13.97(2.57)
Low32.51(0.98)
31.52(1.01)
37.95(0.83)
42.18(0.74)
49.56(0.63)
Both17.52(1.96)
14.88(2.37)
15.80(2.21)
29.85(1.08)
44.37(0.70)
100
High93.96 48.86
(1.97)27.12(3.71)
16.82(6.39)
15.05(7.29)
14.52(7.61)
Low94.36(1.00)
92.18(1.02)
112.17(0.83)
133.40(0.70)
116.31(0.80)
Both48.38(1.99)
27.27(3.69)
61.52(1.55)
315.94(0.29)
281.83(0.33)
50
High282.15 142.02
(2.00)62.73(4.64)
34.44(8.76)
19.40(16.56)
15.06(22.27)
15.80(21.03)
Low283.19(1.00)
293.6(0.96)
400.55(0.70)
262.82(1.07)
197.27(1.44)
Both140.47(2.03)
81.18(3.55)
242.09(1.17)
513.39(0.55)
581.04(0.48)

Dataset 2 – aviationGraph Frequency Type of
ParallelismNumber of processors
1 2 4 8 16 30 60
Time in seconds (speed-up)
air1
1750
High358.27 54.92
(7.19)21.74
(22.30)18.85
(27.29)
Low171.04(2.13)
1500 High771.82 112.30
(7.20)39.40
(22.89)33.99
(27.30)
1250 High1503.49 209.08
(7.37)67.54
(24.31)56.56
(29.58)
1000High
3909.95 490.38(8.06)
155.33(26.13)
158.14(25.65)
Performance of High-level Parallelism When sufficient quantity of work (i.e., frequency
threshold is low enough) Good speed-ups to 16P Reasonable speed-ups to 30P Little or no benefit above 30P No insight into performance plateau

Poor Performance of Low-level Parallelism
Several possible effects ruled out Granularity of data allocation Barrier before master-only reduction
Source: highly variable times for register_extension ~100X slower in parallel than serial, … but different instances from execution to execution Apparently due to highly variable run-times for malloc Not understood

Issues and Conclusions OpenMP taskq/task were straightforward to use in this
program and implemented the desired model Performance was good to a medium range of processor
counts (best 26X on 30P) Difficult to gain insight into lack of performance
High-level parallelism 30P and above Low-level parallelism

Backup

Datasets
DatasetConnected
ComponentsVertices Edges
Vertex
Labels
Edge
Labels
Aviation 2,703 101,185 98,482 6,173 51
Citation 16,999 29,014 42,064 50 12
VLSI 2,633 12,752 11,542 23 1
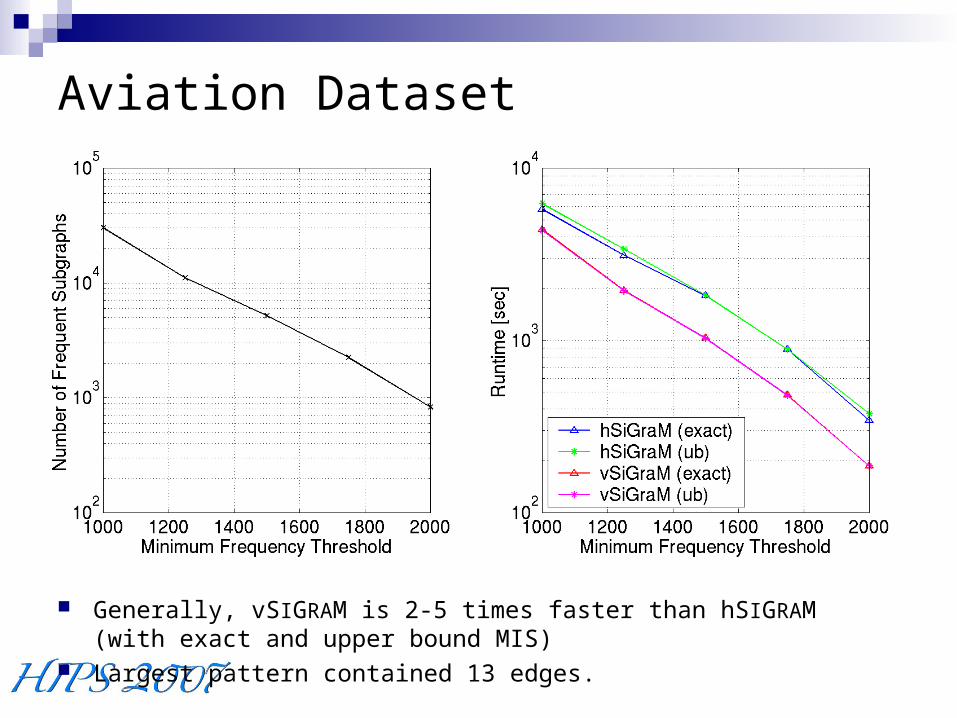
Generally, vSIGRAM is 2-5 times faster than hSIGRAM (with exact and upper bound MIS)
Largest pattern contained 13 edges.
Aviation Dataset

But, hSIGRAM can be more efficient especially with upper bound MIS (ub). Largest pattern contained 16 edges.
Citation Dataset

VLSI Dataset
Exact MIS never finished. Longest pattern contained 5 edges (constraint).

Comparison with SUBDUE
Dataset
SUBDUE vSIGRAM (approximate MIS)
Freq. SizeRuntime
[sec]Freq.
Largest
SizePatterns
Runtime
[sec]
Credit
341
395
387
6
5
5
517200 9 11,696 4
20 13 613,884 461
DTP
4,957
4,807
1,950
2
2
6
1,525500 7 190 20
10 21 112,535 311
VLSI
773
773
244
1
1
1
16200 5 137 3
25 5 1,452 18
Similar results with SEuS

Summary With approximate and exact MIS, vSIGRAM is 2-5 times faster than
hSIGRAM. With upper bound MIS, however, hSIGRAM can prune a larger
number of infrequent patterns. The downward closure property plays the role.
For some datasets, using exact MIS for frequency counting is just intractable.
Compared to SUBDUE, SIGRAM finds more and longer patterns in shorter amount of runtime.
Thank You! Slightly longer version of this paper is also available as a
technical report.
SIGRAM executables will be available for download soon from http://www.cs.umn.edu/~karypis/pafi/

Complete Frequent Subgraph Mining—Existing Work So Far Input: A set of graphs (transactions) + support threshold Goal: Find all frequently occurring subgraphs in the input dataset.
AGM (Inokuchi et al., 2000), vertex-based, may not be connected. FSG (Kuramochi et. al., 2001), edge-based, only connected subgraphs AcGM (Inokuchi et al., 2002), gSpan (Yan & Han, 2002), FFSM (Huan et al.,
2003), etc. follow FSG’s problem definition. Frequency of each subgraph
The number of supporting transactions. Does not matter how many embeddings are in each transaction.
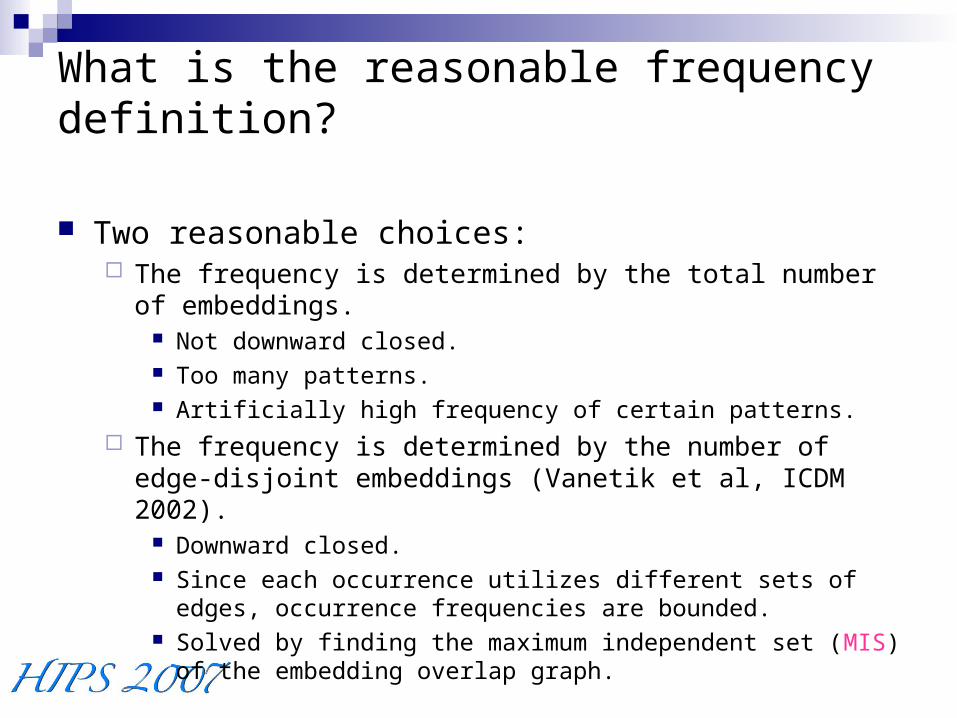
What is the reasonable frequency definition?
Two reasonable choices: The frequency is determined by the total number of embeddings.
Not downward closed. Too many patterns. Artificially high frequency of certain patterns.
The frequency is determined by the number of edge-disjoint embeddings (Vanetik et al, ICDM 2002).
Downward closed. Since each occurrence utilizes different sets of edges, occurrence
frequencies are bounded. Solved by finding the maximum independent set (MIS) of the
embedding overlap graph.

Embedding Overlap and MIS
Edge-disjoint embeddings { E1, E2, E3 }
{ E1, E2, E4 }
Create an overlap graph and solve MIS Vertex Embedding Edge Overlap
E1E2
E3 E4
OK. Definition is Fine, but … MIS-based frequency seems reasonable.
Next question: How to develop mining algorithms for the single graph setting.

How to Handle Single Graph Setting?
Issue 1: Frequency counting Exact MIS is often intractable.
Issue 2: Choice of search scheme Horizontal (breadth-first) Vertical (depth-first)

Issue 1: MIS-Based Frequency We considered approximate (greedy) and upper bound
MIS too. Approximate MIS may underestimate the frequency. Upper bound MIS may overestimate the frequency.
MIS is NP-complete and not be approximated. Practically simple greedy scheme works pretty well.
Halldórsson and Radhakrishnan. Greed is good, 1997.

Issue 2: Search Scheme Frequent subgraph mining
Exploration in the lattice of subgraphs Horizontal
Level-wise Candidate generation and pruning
Joining Downward closure property
Frequency counting Vertical
Traverse the lattice as if it were a tree.
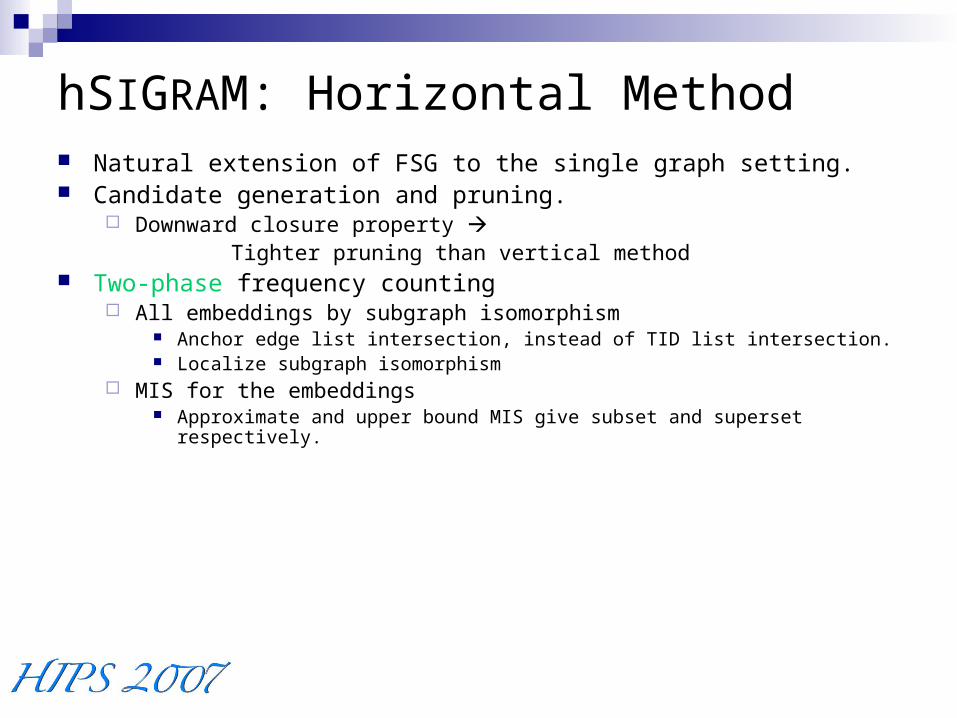
hSIGRAM: Horizontal Method Natural extension of FSG to the single graph setting. Candidate generation and pruning.
Downward closure property Tighter pruning than vertical method
Two-phase frequency counting All embeddings by subgraph isomorphism
Anchor edge list intersection, instead of TID list intersection. Localize subgraph isomorphism
MIS for the embeddings Approximate and upper bound MIS give subset and superset respectively.

TID List Recap
Lattice of Subgraphs
size k
size k + 1
TID( ) = { T1, T3 }TID( ) = { T1, T2, T3 }
T1
T2
T3
TID( ) TID( ) ∩ TID( ) ∩ TID( ) = { T1, T3 }
TID( ) = { T1, T2, T3 }
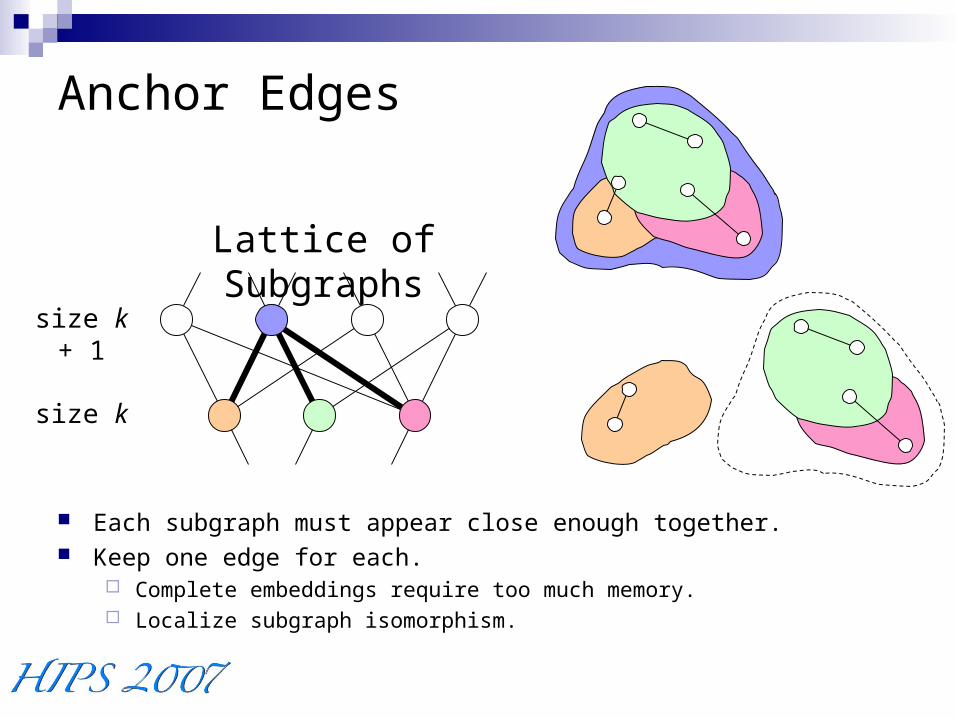
Anchor Edges
Each subgraph must appear close enough together. Keep one edge for each.
Complete embeddings require too much memory. Localize subgraph isomorphism.
Lattice of Subgraphs
size k
size k + 1

Treefication
Lattice of Subgraphs Treefied Lattice
size k - 1
size k
size k + 1
: a node in the search space (i.e., a subgraph) Based on subgraph/supergraph relation Avoid visiting the same node in the lattice more than once.