a more efficient method for extracting and analyzing
TRANSCRIPT

Kennesaw State UniversityDigitalCommons@Kennesaw State University
Master of Science in Chemical Sciences Theses Department of Chemistry and Biochemistry
Spring 5-7-2019
A More Efficient Method for Extracting andAnalyzing Pesticides in Baby foodsOluwatobi Fabunmi
Follow this and additional works at: https://digitalcommons.kennesaw.edu/mscs_etd
Part of the Chemistry Commons
This Thesis is brought to you for free and open access by the Department of Chemistry and Biochemistry at DigitalCommons@Kennesaw StateUniversity. It has been accepted for inclusion in Master of Science in Chemical Sciences Theses by an authorized administrator ofDigitalCommons@Kennesaw State University. For more information, please contact [email protected].
Recommended CitationFabunmi, Oluwatobi, "A More Efficient Method for Extracting and Analyzing Pesticides in Baby foods" (2019). Master of Science inChemical Sciences Theses. 24.https://digitalcommons.kennesaw.edu/mscs_etd/24

TABLE OF CONTENTS
ACKNOWLEDGEMENTS ......................................................................................................................... i
ABSTRACT ............................................................................................................................................... ii
LIST OF FIGURES ................................................................................................................................... iii
LIST OF TABLES ..................................................................................................................................... iv
CHAPTER 1. BACKGROUND TO PESTICIDES .................................................................................... 1
1.1 Introduction ................................................................................................................................. 1
1.2 History of Pesticides ................................................................................................................... 1
1.3 Common Uses of Pesticides ........................................................................................................ 2
1.4 Classification of pesticides based on Chemical structure ............................................................ 2
1.5 Pesticide toxicity ......................................................................................................................... 3
CHAPTER 2. CURRENT METHODS FOR PESTICIDES ANALYSIS ................................................... 6
2.1 Introduction ................................................................................................................................. 6
2.2 Spectroscopy-based method ........................................................................................................ 7
2.2.1 Principles of spectroscopy ................................................................................................... 7
2.2.2 Ultraviolet-Visible Spectroscopy ........................................................................................ 7
2.2.3 Fourier-transform infrared spectroscopy (FTIR/ATR) ........................................................ 8
2.2.4 Laser-induced Breakdown Spectroscopy (LIBS) ................................................................ 9
2.3 Chromatography methods ........................................................................................................... 9
2.3.1 Principles of Liquid Chromatography ............................................................................... 11
2.3.2 Mode of Operation ............................................................................................................ 11
2.4 Ultra-Performance Liquid Chromatography .............................................................................. 12
2.4.1 Principle of Ultra Performance Liquid Chromatography ................................................... 12
2.5 Data processing and analysis ..................................................................................................... 13
2.5.1 MS Excel ........................................................................................................................... 13
2.5.2 Principal component analysis (PCA) ................................................................................. 14
CHAPTER 3. DATA COLLECTION AND METHODOLOGY ............................................................. 16
3.1 Instrumentation ......................................................................................................................... 16
3.2 Materials ................................................................................................................................... 17
3.3 Experimental methods ............................................................................................................... 18
3.3.1 Structural comparison and pesticide detectability using FTIR and LIBS .......................... 18
3.3.2 Relative polarities and pH effects on pesticides using reverse phase HPLC-PDA ............ 20
3.3.3 LODs and LOQs using reverse phase UV-Vis detection ................................................... 20

3.3.4 Percent recoveries at different levels of concentration using (HPLC-PDA, UPLC-UV data)
21
CHAPTER 4. RESULTS AND DISCUSSION ........................................................................................ 23
4.1 Structural comparison of the pesticides ..................................................................................... 23
4.1.1 Analysis of variance and correlation coefficients .............................................................. 23
4.2 Relative polarities and pH effects on the pesticides .................................................................. 26
4.3 Presence or absence of pesticides in foods using FTIR/ATR and LIBS .................................... 30
4.3.1 Principal Component Analysis of the IR spectra ............................................................... 32
4.3.2 Principal Component Analysis (LIBS) .............................................................................. 34
4.4 Limit of detection (LOD) .......................................................................................................... 36
4.5 Percent recoveries at different levels of concentration using HPLC-PDA and UPLC-UV ....... 38
CHAPTER 5. CONCLUSION .................................................................................................................. 42
References ................................................................................................................................................ 44
APPENDIX A ........................................................................................................................................... 49

i
ACKNOWLEDGEMENTS
This project was supported by the Department of Chemistry and Biochemistry at Kennesaw
State University. Also, fractions of this research work were presented at the Southeastern Regional
Meeting of the American Chemical Society and The Federation of Analytical Chemistry and
Spectroscopy Societies.
During my quest of a Master in the Chemical Sciences, I am deeply thankful to God. To
my committee chair, Dr. Huggins Msimanga, I am thankful for his guidance and supervision while
working on this project. He has been a major source of motivation and inspiration. Also, my other
principal investigator Dr. Christopher Dockery, I am thankful of the effort you put into making
this research work a success. To Dr. Thomas Leeper, my other committee member, thank you for
your contribution to this project. Many thanks to Dr. Koether, my colleagues, most especially
Opeyemi Omosebi, Latanya Downer, and Dianne Diatta. Many thanks to Georgia Department of
Agriculture for sharing the results obtained from the Pesticide analysis carried out using the
QuEChERS method, as the research was based on obtaining a better result through method
development.
I would love to thank my parents and family who have encouraged and motivated me
throughout this journey. My sincere appreciation goes to Uncle Bimbo, Aunt Iyabo, Uncle Tunde,
Aunt Jibola, Timi and Tade. It is with your love and support that I have completed and achieved
this dream of mine with great success.
Finally, I would love to thank the laboratory staff and IT department for their prompt
availability during the research work. I am thankful to Ben Huck and Matthew Rosenberg for their
support in providing all that was needed for the research work. The successful completion was a
collective effort and I am sincerely grateful.

ii
ABSTRACT
Pesticides that are used to control pests such as insects, rodents, bacteria, mold, and fungus
in food production end up in the fruits and vegetables that we consume. Clearly, concentration
levels of pesticides must be carefully monitored. Successful monitoring of the concentrations is
critically dependent upon pesticide extraction efficiency, the pesticide structure and the matrix
(food product) in which the pesticide is found. Variables such as polarity, solubility, and pH must
be investigated. A common approach to develop analysis methods involves spiking food products
with pesticides and evaluating method efficiency by calculating percent recoveries from the foods.
Sample results from the Georgia Department of Agriculture Labs (Tifton, Ga) showed in some
cases, a range of 84% to 140% recoveries for some pesticides on the lower end of ppm
concentration levels. These recoveries were obtained from fruit extracts such as peaches, bananas,
carrots, and green beans that provided very complex matrices. In this study, recovery range of 95%
to 105% is our plausible goal to establish the efficiency of our extraction technique.
We propose to develop a method that will improve percent recoveries by modifying the
QuEChERS methods. This proposal entails spiking fruit matrices with known amounts of
pesticides and studying percent recoveries by quantifying the extracts with standard instruments
like High-performance liquid chromatography-photodiode array (HPLC-PDA), Gas
chromatography-mass spectrometer (GC/MS), and Ultra-performance liquid chromatography-
ultraviolet (UPLC/UV). The focus will be on improving the extraction process. Starting with eight
pesticides, we will study structural differences in the pesticides via middle-infrared spectroscopy
to establish extraction compatibility. Also, relative polarities under different pH conditions will be
determined using reverse-phase HPLC/UV. This aspect will help with optimizing the organic
solvents to be ultimately used for extraction. Lastly, the optimized conditions will be used to
analyze bulk pesticides using HPLC-PDA and UPLC-multiwavelength detector (UPLC-MWD)
for comparison.
An efficient method was developed by modifying the QuEChERS method using liquid-
liquid extraction and the percent recoveries were satisfactory and showed a good precision.

iii
LIST OF FIGURES
Figure 1: Chemical structures of studied pesticides
Figure 2: Schematic diagram of ATR sampling accessory
Figure 3: Schematic diagram of the LIBS system
Figure 4: Schematic diagram of HPLC system
Figure 5: Summary sketch of PCA
Figure 6: FTIR stacked plot spectra of all pesticides sample
Figure 7: PCA score plot of all pesticides
Figure 8: Relative polarities of studied pesticides on HPLC-PDA Chromatogram
Figure 9: Graph showing pH versus retention time (min) of pesticides
Figure 10: FTIR overlay plot of unspiked banana sample and pesticide-spiked sample
Figure 11: FTIR PCA score plot of unspiked banana sample and pesticide-spiked sample
Figure 12: LIBS overlay plot of unspiked banana sample and pesticide-spiked sample
Figure 13: LIBS PCA score plot of unspiked-banana sample and pesticide-spiked sample
Figure 14: HPLC spectra overlay of dodecenyl succinic anhydride and simazine pesticide
Figure 15: HPLC with PDA detection chromatogram overlay of clean banana baby food
extract and banana spiked at 0.5 mg/kg

iv
LIST OF TABLES
Table 1: Types and Physical properties of studied pesticides
Table 2: Maximum residue limit and lethal dose of studied pesticide
Table 3: Summary of ANOVA result
Table 4: Correlation table of all studied pesticides
Table 5: Retention times (min) and pH at optimum wavelengths
Table 6: FTIR summary of ANOVA for unspiked sample and pesticide-spiked sample
Table 7: FTIR correlation table for unspiked sample and pesticide-spiked sample
Table 8: LIBS summary of ANOVA for unspiked sample and pesticide-spiked sample
Table 9: LIBS correlation table for unspiked sample and pesticide-spiked sample
Table 10: Optimum wavelengths (nm), Retention times (tR), limits of detection (LOD), limits
of quantification (LOQ), maximum residue limits (MRL), and calibration data of the studied
pesticides
Table 11: Percent Recovery obtained using HPLC-PDA
Table 12: Percent Recovery obtained using UPLC-MWD

v
LIST OF EQUATIONS
Equation 1 X = TPt + EX
Equation 2 % RSD = (S.D/mean) x 100
Equation 3 LOD = (Sx/m) *3
Equation 4 LOQ = (Sx/m) *10

vi
LIST OF ACRONYMS
ACN Acetonitrile
ANOVA Analysis of variance
ATR Attenuated total reflectance
DF Degree of freedom
EPA Environmental Protection Agency
FTIR Fourier Transform Infrared
GC Gas chromatography
GDOA Georgia Department of Agriculture
HPLC High performance liquid chromatography
IR Infrared
LC Liquid chromatography
LIBS Laser Induced Breakdown Spectroscopy
LLE Liquid-liquid extraction
LOD Limit of detection
LOQ Limit of quantification
mL milliliter
MS Mass spectrometry
MRL Maximum Residue Limits
MWD Multi-wavelength detector
NIR Near infrared
OCPs Organochlorine pesticides
OPPs Organophosphate pesticides
PC Principal Component

vii
PCA Principal Component Analysis
PDA Photodiode array
PLSDA Partial Least Squares Discriminant Analysis
ppm Parts per million
QuEChERS quick, easy, cheap, effective, rugged, and safe
R2 Square of the correlation coefficient
RPM Revolutions per minute
RSD relative standard deviation
SPE Solid-phase extraction
UPLC Ultra Performance Liquid Chromatography
UV/Vis Ultraviolet / visible
VF Volumetric flask
v/v Volume/volume
w/w Weight/weight
ZnSe Zinc selenide

1
CHAPTER 1. BACKGROUND TO PESTICIDES
1.1 Introduction
Pesticides are chemical substances used in the agricultural and food industry to control
pests. The use of pesticides is of importance as it improves food production and protects plants
from pests and weeds. Pesticide is a general term which includes herbicide, rodenticide, insecticide
and fungicide depending on the target pest to be controlled. Many pesticides are associated with
health issues due to their carcinogenic nature as well as environmental hazards. 1-2
The most widely used pesticides in pest control are the organochlorine, organophosphorus
and carbamate pesticides. Other classes of pesticides include the neonicotinoid, triazine and phenyl
urea. This class of pesticides are associated with various health effects due to their ability to inhibit
the function of the enzyme cholinesterase.4
Extensive review on various classes of pesticides can be found in several publications
based on their uses and applications internationally. Pesticides serve various purposes which
include occupational pesticide use, commercial applications to foodstuffs, and household
applications such as the insecticides which are specific to insect control.4-5
1.2 History of Pesticides
Historical background of pesticides dates back to the beginning of agriculture and it
became pronounced as a result of increased pest population which was directly proportional to
decreasing soil fertility.6 Paul Muller discovered that DDT was an effective insecticide. DDT
belongs to the class of organochlorine pesticides and it was dominant. However, by 1975 DDT
were replaced in the U.S. by organophosphate and carbamates. The original definition of pesticide
in the Federal Insecticide, Fungicide, and Rodenticide Act (FIFRA) came from earlier California
law. According to FIFRA, an organism is declared as a pest if it is deleterious to man or the

2
environment. In 1997, FIFRA laid out foundation for the regulation of pesticide by the federal
government. Currently, pesticides are regulated by three federal agencies which are the US
Department of Agriculture (USDA), the Environmental Protection Agency (EPA), and the Food
and Drug Administration (FDA).7-9
1.3 Common Uses of Pesticides
After world war II, there was an emergence in pesticide use, firstly with the introduction
of DDT, BHC, aldrin, dieldrin and endrin. DDT was especially favored for its broad-spectrum
activity against insect pests of agriculture and human health.11Pesticides are used to control pests
such as ticks, mites and insects. In agriculture and lawns, pesticides control weeds, insects and
crop diseases.
1.4 Classification of pesticides based on Chemical structure
Pesticides are classified according to the chemical nature of their active ingredients. The
chemical composition of pesticides is significant to researchers because it gives an idea about the
efficacy, physical and chemical properties of the pesticides. Chemical classification of pesticides
is based on their functional group, namely, organochlorines, organophosphorus, carbamates,
pyrethrin and pyrethroids.10
Organochlorine pesticides (OCs) are organic compounds with five or more chlorine atoms
attached to it while organophosphate pesticides (OPs) contain a phosphate group as its basic
structural framework. Some of the widely used organophosphate pesticides are malathion,
parathion and diazinon. Carbamates are another class of organic pesticide derived from carbamic
acid. Pyrethrin’s are naturally occurring organic pesticides derived from the Chrysanthemum
flower. Figure 1 is a structural display of the studied pesticides. Table 1 summarizes the physical
properties of studied pesticides.

3
Figure 1. Chemical structure of selected pesticides.
1.5 Pesticide toxicity
Pesticide toxicity is measured by their lethal dose (LD50,) which is the dose needed to kill
50 percent of laboratory test animals (usually measured as milligrams of poison per kilogram body
weight). The smaller the LD50, the more toxic the poison. Also, chronic risk resulting from
pesticides intake is difficult to measure as it is based upon the type of pesticide, length of exposure,
dose and genetic differences among the organism involved.10 The dermal lethal dose of studied
pesticides are shown in Table 2. Biological activity of pesticides specific to a target pest is mainly
influenced by its physical and chemical properties. The physical properties of individual pesticides
determine its mode of action, dosage, mode of application and its interaction in the environment.

4
Table 1. Type and physical properties of studied pesticides.
Pesticide Name Type Physical
Properties Health Effects Route of entry
Aldicarb Carbamate
pesticide
White crystals
with a slightly
sulfurous odor
Super toxic:
probable oral
lethal dose for
humans
Inhalation, skin
and by ingestion
Carbaryl Carbamate
pesticide
White
crystalline solid
Highly toxic,
may be fatal if
inhaled,
swallowed or
absorbed
through the skin
Inhalation, skin
absorption,
ingestion, skin
and/or eye
contact
Carbofuran Carbamate
pesticide
Odorless white
crystalline solid
Fatal if inhaled,
fatal if
swallowed, very
toxic to aquatic
life with long
lasting effects
Inhalation, skin
absorption,
ingestion, skin
and/or eye
contact
Diuron Phenyl urea White
crystalline solid
Suspected of
causing cancer
Inhalation,
ingestion, skin
and/or eye
contact
Diazinon Organophosphorus
pesticide
Toxic colorless
liquid
Eye and skin
irritant, may
cause
gastrointestinal
symptoms
Inhalation,
ingestion, skin
Simazine Triazine pesticide solid
Suspected of
causing cancer,
very toxic to
aquatic life with
long lasting
effects
Inhalation or by
ingestion
Thiamethoxam Neonicotinoid
insecticide
Crystalline
powder
Harmful if
swallowed and
very toxic to
aquatic life
Inhalation or by
ingestion
Propiconazole Triazole fungicide Yellowish
odorless liquid
Harmful if
swallowed, may
cause an allergic
skin reaction and
very toxic to
aquatic life
Inhalation or by
ingestion

5
Table 2. Shows the maximum residue limit and lethal dose of studied pesticides.
Pesticide Commodity Maximum residue limits
(banana) mg/kg LD50 – Dermal
Aldicarb Bananas 0.20 >2000
Carbaryl Bananas 0.10 850
Carbofuran Bananas 0.10 >3000
Diuron Bananas 0.10 >5000
Diazinon Bananas 0.20 3600
Simazine Bananas 0.20 >3100
Thiamethoxam Bananas 0.30 >2000
Propiconazole Bananas 0.20 >4000

6
CHAPTER 2. CURRENT METHODS FOR PESTICIDES ANALYSIS
2.1 Introduction
Broad research has been carried out on multiresidue method for pesticides determination
in fruits and vegetables using various extraction techniques and instrumentation methods. These
researches can be found in various publications.12-16 Standard techniques used for the
determination of pesticides in fruits and vegetables are gas chromatography (GC) coupled with
mass spectrometry (MS), electron-capture detector (ECD), flame-photometric detector (FPD),
nitrogen phosphorus detector (NPD), thermionic specific detector (TSD), liquid chromatography
(i.e. HPLC, LC-MS). Each of these techniques are employed for the determination of various
pesticide classes, such as the organophosphorus and the organonitrogen pesticides.17-21
In the past, liquid-liquid extraction (LLE) was employed as the main extraction technique
in pesticide analysis. However, there is need to cut down on cost of analysis as LLE consumes
more organic solvent and is more laborious. Recently, solid phase extraction (SPE), supercritical-
fluid extraction and solid phase microextraction are modern techniques been used for the analysis
of pesticide residues due to its efficiency and reduced use of organic solvents for extraction. SPE
method is of great advantage as it can be used for multiple preconcentration of pesticides, clean-
up and water removal from the sorbent by air vacuum. Recent advances in determination of
pesticides present in environmental samples are also been done using capillary electrophoresis
(CE).22 The current trend has shifted to the use of QuEChERS method for the extraction and
preconcentration of pesticides. The simplicity of the method and ease of development make it very
attractive for multiresidue pesticide determination. The sample preparation in this technique is
followed by a quantitative analysis of the pesticides using these instruments such as LC-MS, UPLC
and GC-MS.

7
2.2 Spectroscopy-based method
Spectroscopy is the science concerned with the investigation and measurement of spectra
produced when materials interact with or emits electromagnetic radiation.22 It is a commonly used
technique employed for quantitative and qualitative analysis in various fields such as the food,
agriculture and textile industry. Spectroscopy method is widely used due to its non-destructive
mode of analysis as well as its durability, accuracy of measurement and reproducibility. It has been
used in various research studies for the detection of pesticides residue in fruits and vegetables.2
2.2.1 Principles of spectroscopy
Spectroscopy works on the principle that all atoms and molecules absorb and emits light at
certain wavelengths. It is a term used to refer to the measurement of radiation as a function of
wavelength after the radiation from the source interacts with the sample. There are different
spectroscopy techniques depending on the type of compound of study and the region in which
atoms absorb and emit within the electromagnetic region, such as Ultraviolet-visible absorption
spectroscopy (UV-Vis), infrared absorption spectroscopy (IR), and Raman spectroscopy. These
techniques use optical materials to disperse and focus the radiation and are often identified as
optical spectroscopies.22
2.2.2 Ultraviolet-Visible Spectroscopy
Ultraviolet-Visible (UV-Vis) spectroscopy is the commonly used analytical technique for
detecting numerous molecules. The UV-Vis radiation (I0) is passed through the sample and the
unabsorbed light (I) is measured. The signal (absorbance) is given by (-log10(I/I0)). The absorbance
of a compound as a function of the wavelength range gives the spectrum which is unique to the
compound. For a UV/Vis region the wavelength ranges from about 200 – 800 nm. Molecules
containing double bonds and triple bonds are normally UV active.22

8
2.2.3 Fourier-transform infrared spectroscopy (FTIR/ATR)
Fourier transform infrared spectroscopy (FTIR) is an analytical technique used to obtain
infrared spectrum of samples. Infrared techniques are capable of qualitative and quantitative
analysis. This technique relies on the fact that molecules absorb at specific frequencies which is
solely dependent on their chemical structure. There are three IR regions, near infrared (NIR) which
covers 0.75 to 2.5µm wavelengths, mid-IR which covers 2.5 to 20 µm and far infrared regions
which spans from 20 to 200 µm. For a molecule to be IR active, the molecule must have a non-
zero dipole moment, thus not all molecules are IR active. FTIR can also detect the presence of
specific functional groups in a sample and provide a unique fingerprint for it. When FTIR is
coupled to attenuated total reflectance (ATR) an infrared spectrum is made capable of acquiring
IR spectra directly on various phases of the sample (liquids, solids and gaseous). An advantage to
the FTIR/ATR technique is that it provides faster sampling with minimal or no preparation step,
non-destructive and excellent sample-to-sample reproducibility. The limitation involves ensuring
as good as possible optical contact between the sample and the internal reflection element (IRE).
Figure 2 summarizes the mode of action of the ATR accessory.
Figure 2. Schematic diagram of ATR sampling accessory.23

9
2.2.4 Laser-induced Breakdown Spectroscopy (LIBS)
Laser-induced breakdown spectroscopy is an atomic/ionic emission spectroscopic
technique which uses a focused pulsed laser beam to generate plasma from the sample, also called
laser-induced plasma spectroscopy.24 The plasma contains atoms, ions and free electrons which
emit electromagnetic radiation as the plasma cools down. The emitted light is resolved by a
spectrometer to form a spectrum. Recently, LIBS has become an emerging analytical technique
for characterization and identification of materials. This technique covers a broad range of
elements, including lighter elements such as H, Be, Li, C, N, O, Na, K, Mg and Phosphorus.24
Recently, LIBS has been used for the detection of phosphorus and chlorine containing
pesticide residues on fruit surfaces. This is as a result of the characteristic peaks of phosphorus at
213.62 nm, 214.91 nm, 253.6 nm and 255.33 nm and the characteristic peak of chlorine at 837.59
nm which are the major elements found in both organophosphorus pesticides and organochlorine
pesticides. An advantage to the LIBS technique is due to consumption of a small amount of sample
during the ablation process, it is non-destructive in nature and involves minimal or no sample
preparation. A major limitation is the variation in the laser ablation and resultant plasma which
affects reproducibility as well as detection limits (ppm).29-30 Figure 3 shows the schematic
representation of major components of a LIBS instrument.
2.3 Chromatography methods
Chromatography is an analytical method of separation in which components to be separated are
distributed between two phases, stationary phase and mobile phase. The compounds to be
separated are carried in the mobile phase through the stationary phase in a column. For successful
separation, the affinities of the compounds towards the stationary phase or mobile phase must be
different. The components of the sample interact with stationary phase and separate into bands.

10
Figure 3. Schematic representation of the Laser induced breakdown spectroscopy.11
The samples appear at the end of the column in order of their interaction with the two phases.5 The
compounds that interact least elute first while the one that interacts most with the stationary phase
elutes lastly. The mobile phase can either be gas or liquid, and the stationary phase is either liquid
or solid. Gas chromatography (GC) has a gaseous mobile phase and a solid or liquid stationary
phase. GC is suitable for separating thermally stable, volatile organic and inorganic compounds.
High performance liquid chromatography (HPLC) has a liquid mobile phase and a solid stationary
phase. It is used extensively for the separation of thermally unstable and organic compounds of
different polarities. Based on the different polarities of compounds two modes of HPLC are
commonly used, the normal phase and reverse phase. For normal phase HPLC, the stationary phase
is a polar and the mobile phase is non-polar while for reverse phase HPLC the stationary phase is
non-polar, and the mobile phase is a polar.

11
2.3.1 Principles of Liquid Chromatography
Liquid Chromatography (LC) is essentially a separation technique in which sample mixture
in a liquid phase is subjected to a competitive distribution between two phases, one of which is a
moving liquid and the other is a stationary solid (silica or alumina).7
The separation mechanism involves the use of pumps to push a liquid solvent containing a
mixture of samples through a column made up of a solid adsorbent material. Each component in
the sample mixture will interact with the adsorbent material present in the column in a slightly
different way. Thus, different flow rates in the various components will cause the components to
separate as they elute out of the column.
2.3.2 Mode of Operation
HPLC works by pumping at high pressure a sample (analyte) dissolved in an organic
solvent which is the mobile phase through a column with a chromatographic packing material
which is called the stationary phase. Compound separation can either be through isocratic elution,
where the composition of the mobile phase is held constant or gradient elution in which the
composition of the mobile phase is changed during the separation toward conditions favoring
analyte dissociation from the stationary phase. On exiting the column, the eluents pass through a
detection system, such as a UV-Visible detector where the signal is produced. The detector
generates a signal corresponding to the quantity of analyte emerging from the column, which is
then transferred to and recorded by the HPLC computer program and data is made available for
subsequent preview and analysis. For a set of analytes of different concentrations, corresponding
peak areas are used to create a calibration point for quantitative analysis.

12
2.4 Ultra-Performance Liquid Chromatography
Ultra-Performance Liquid Chromatography is a chromatographic separation
technique with unique possibilities in liquid chromatography. The UPLC is designed to
withstand high system back-pressures and equipped with a C18 packed with 1.5 – 2 µm
particles used in connection with the system. Separation on UPLC is performed under very
high pressures (up to 100 MPA) without negative impact on the analytical column.25
2.4.1 Principle of Ultra Performance Liquid Chromatography
The UPLC principle is based on the use of a stationary phase consisting of particles
less than 2.5 µm unlike HPLC columns filled with about 3 – 5 µm particles. The
principles are governed by the Van Deemter equation, which is an empirical formula that
Figure 4. Schematic diagram of High-Performance Liquid Chromatography (HPLC) System.6

13
describes the relationship between linear velocity (flow rate) and plate height (HETP or
column efficiency. Given the equation, H = A +B/v + Cv
Where; A, B, and C are constants. v is the linear velocity, the carrier gas flow rate.
The A term represents ‘eddy’ mixing and is independent of velocity. It is smallest when
the packed column particles are small and uniform. The B term represents natural
diffusion or axial diffusion tendency of molecules. This effect is reduced at high flow
rates and so this term is divided by v. The C term is due to kinetic resistance to
equilibrium in the separation process. The kinetic resistance is the time delay involved in
moving from the gas phase to the packing stationary phase and back again. The greater
the flow of gas, the more a molecule on the packing tends to stay behind molecules in
the mobile phase. Thus, term is proportional to v.
2.5 Data processing and analysis
2.5.1 MS Excel
The preprocessing of spectra data set prior to analysis was done using MS Excel.
Chemometric techniques require accurate experimental data to achieve good result for
discrimination and comparison. Common preprocessing techniques used for spectroscopic data
collected include, baseline correction, normalization, analysis of variance, (ANOVA), linear
regression and correlation analysis. Firstly, baseline correction and normalization to unity ensure
that the replicated spectra from the same instrument are of equal magnitude for true comparison.
Also, if one is to compare a spectrum of acetaminophen with that of aspirin, normalization of the
two spectra will highlight the structural differences in the two molecules. Normalization to unity
ensures that intensity values for the total spectrum range from zero to unity. Normalization was
carried out by dividing each absorbance point by the maximum absorbance point in the total

14
spectrum. However, preprocessing techniques tend to alter the original data set, optimum care is
important when applying these changes.
ANOVA and correlation coefficients are employed to evaluate data precision within a
batch and to obtain spectra similarities or differences within-group or between-groups. ANOVA
is used to test multiple means, perform pairwise comparisons, and introduce within-group
variance. In MS Excel, there are two types of ANOVA: one-way and multi-way. However, only
one instrumental method will be used at a time in this study, one-way is appropriate. The two-
way or multi-way analysis would be utilized when more than one instrument or method is used,
while comparisons must be made between their differing units of measure.
2.5.2 Principal component analysis (PCA)
Principal component analysis is the most widely used chemometric technique. PCA is also
sometimes referred to as single value decomposition (SVD) or eigenvector analysis.26 In the PCA
model, an orthogonal set of correlated variables is transformed into a set of linearly uncorrelated
variables called principal components (PCs). These uncorrelated variables are then projected onto
a two- or three-dimensional plot to achieve the following such as
1) summarizing and visualizing the data set,
2) multivariate classification and discriminant analysis and
3) discovering quantitative relationships among the variables.
PCA produces very quickly, a data summary showing how similar/different each of the
observations are to one another, as well as any deviation from the groups in the data set. The data
table for this analysis is the matrix obtained through each collected IR spectrum (intensity vs.
wavenumber). While the matrices are quite large, they are not a challenge for PCA analysis.

15
This technique is extremely useful when the dimensionality of the measurements is large
and the samples themselves exist in small dimensional space; meaning it handles data matrices
with many more variables than observations extremely well. It can also handle data that are noisy
or highly collinear (correlated). This small dimensional space relates to the number of principal
components that are needed in order to define the information in the data set to the noise in the
spectra. The number of principal components in the data set are less than or equal to the number
of original variables. Determining the number of relevant PCs for inquiry is one of the greatest
challenges, as choosing too many or too few could disrupt the interpretation of the data. Therefore,
the process of dimensionality reduction through PCA must take place in order to make the data
more easily visualized, thereby, reducing the time and possible memory required for analysis and
helping to eliminate irrelevant or redundant features and to reduce noise. In summary, PCA
highlights the underlying structure of a matrix by reducing the dimensionality of that matrix and
summarizing the results into score plots. Mathematically, PCA decomposes the X matrix into a
two meaningful matrices, T and P, where T is the score matrix and P is the loading matrix as
summarized in equation (1).
X = TPt + Ex (1)
In Eq. (1), T is the score matrix and Pt is the transpose of the loadings, and Ex is the residual matrix.
Figure 5. Summary sketch of PCA.

16
CHAPTER 3. DATA COLLECTION AND METHODOLOGY
3.1 Instrumentation
FTIR analysis was carried out using a Perkin Elmer Frontier 400 FTIR spectrometer
equipped with a universal attenuated total reflectance accessory, which uses a diamond crystal in
contact with ZnSe. LIBS analysis was performed using a LIBS 2000+, Ocean Optics Inc.
equipped with a pulsed laser, glass fiber optics, a delay generator, spectrometer, and a housed
sample chamber equipped with rotating sample holder. A Q-switched Nd:YAG laser emitting at
1064 nm and a repetition rate of 10 Hz was used as an excitation source. UV-Vis analyses were
performed using the Cary 4000 high performance UV-visible spectrophotometer with
photometric performance in the 175 – 900 nm range, controlled by the Cary WinUV software
and equipped with temperature control and multicell holders.
HPLC analyses were performed using a Waters 2795 Alliance HT separation HPLC system
equipped with an auto sampler and a photodiode array detector (Waters 2996) was employed.
HPLC separation was achieved using a Luna C18 column (100 x 4.6 mm, i.d., 5µm particle size,
Waters, Milford MA, US), with a mobile phase flow rate of 0.5 mL min-1 at a column temperature
of 24.1℃ and sample maintained at 22℃. The HPLC operating pressure was 600 psi under
isocratic conditions and a reverse phase C18 stainless steel column with matching guard column as
a stationary phase and a mixture of acetonitrile – water as the mobile phase was used. UPLC
analyses were performed using a Shimadzu Ultra High-Performance LC system (Shimadzu, US).
UPLC separation was achieved using a Hypersil GOLD C18 column (100 x 4.6 mm, i.d., 1.7 µm
particle size), maintained at 30℃. The Shimadzu operating pressure was at 6000 psi using a binary
gradient pump to deliver the solvent mixtures into the column. Isocratic elution and a run time of
twelve minutes. The mobile phase was a mixture of water in solvent A and acetonitrile in solvent

17
B, flow rate of 1.0mL/min making the pumps to deliver 0.60mL/min for solvent A and 0.40mL/min
for solvent B. Mobile phase was degassed automatically upon setting the parameters. The injection
volume was set at 10.0 µL. Determination was performed using a Shimadzu multiwavelength
detector (MWD)
3.2 Materials
Pesticide standards (diazinon, thiamethoxam, aldicarb, simazine, carbofuran, carbaryl,
diuron and propiconazole) were purchased from Sigma-Aldrich chemical company (St.Louis, MO)
(Chemical structures shown in Figure 1). Working standards solutions were prepared by dissolving
original stock solutions in acetonitrile and diluting to 50 ppm. An internal standard solution was
prepared by dissolving 20 mg of diuron in acetonitrile and diluting to 8 ppm with acetonitrile. The
internal standard was used to compensate for possible loses encountered during preparation steps.
Acetonitrile (HPLC grade) were obtained from Fisher Chemical. All the solvents were
filtered prior to use. Ultra-pure water (18ꭥ) was prepared in the Biochemistry laboratory at
Kennesaw State University using a Milli-Q water purification system. PSA/Carbon cartridges and
sorbents were purchased from Waters Corporation (Milford, MA). A 0.45 µm PTFE filter (Fisher
brand) was used for the filtration of the extraction solvent and pesticide standards in acetonitrile.
QuEChERS sorbent (composed of homogeneous mixture of sodium acetate and magnesium
sulfate), vortex instrument (Vortex Genie 2), Rotavapor (B.U.CHI), Eppendorf centrifuge 5430 R,
weigh balance (Mettler Toledo), spatula, mortar/pestle, and pellet presser.
Gerber Banana baby food pellets were purchased from Walmart Store in Kennesaw
Georgia.

18
3.3 Experimental methods
3.3.1 Structural comparison and pesticide detectability using FTIR and LIBS
Infrared spectra of all eight pesticides were collected using Spectrum v5.0.2 software was
used to produce the spectra for exporting to MS Excel. A force gauge setting of 70-75 was used to
reduce noise observed in lower settings. Sample collection was done over the mid infrared range
(4000 – 650 cm-1) at a resolution of 4cm-1 averaged over seven spectra per sample batch. These
settings produced a spectrum with 3351 wavenumbers (variables). Initially, spectra for each of the
samples were obtained singly; the first batch obtained was one spectrum per pesticide standard,
then subsequent 9 spectra per sample without reloading. Spectra were recorded in the absorbance
mode. When samples are analyzed without reloading, instrument precision is put to test as well as
real life sampling in an analytical field where only few samples will be available. Spectra averaging
per sample batch are done to increase the signal to noise ratio that can be observed when only one
scan is obtained. With the use of a spatula, a small scoop of each original pesticide standards was
placed on a clean FTIR-ATR crystal beam and wiped away using a Kim-wipe, which removed
contaminants left as a result of cleaning with methanol; an additional scoop was then placed on
the crystal beam for identification. After the spectra were collected for each of the eight pesticide
samples (aldicarb, thiamethoxam, diazinon, diuron, carbaryl, carbofuran, simazine and
propiconazole) with the above settings, spectra data obtained were analyzed by MS Excel and
PCA.
For FTIR/ATR experiments, about ten grams of homogenized Gerber baby food was
spiked with five concentrations of Diuron pesticide (0.1 ppm, 0.5 ppm, 2.0 ppm, 5.0 ppm and 10.0
ppm). Infrared spectra of unspiked homogenized Gerber baby food and pesticide-spiked Gerber
baby food was collected. Five spectra per sample batch were collected without reloading. Using a

19
spatula, a small portion of both unspiked Gerber banana sample and pesticide-spiked Gerber
banana samples were placed on a clean FTIR/ATR crystal for identification after using a Kim-
wipe and methanol to remove any contaminants that must have accumulated on the crystal. After
the spectra were collected for each of the six sample groupings (unspiked homogenized Gerber
banana, 0.1 ppm, 0.5 ppm, 2.0 ppm, 5.0 ppm and 10.0 ppm pesticide-spiked homogenized Gerber
banana) with the above instrument settings, spectra data obtained were analyzed by MS Excel and
PCA.
For LIBS experiments, about one gram of grounded baby food was spiked with three levels
of concentrations of Diazinon pesticide (20.0 ppm, 40.0 ppm and 50.0 ppm) and left to dry for few
hours so that the Diazinon was sufficiently absorbed into the powdered Gerber banana prior to
conversion into pellet using a pellet maker. The ground powder was pelletized to provide a uniform
surface to obtain uniform LIBS emission. LIBS spectra of unspiked and pesticide-spiked banana
baby food were collected LIBS use a short laser pulse to create micro plasma on the sample surface.
The Q-switch delay time was optimized at 4.0 following a precision study carried out on the
various delay times. The emitted light from plasma was collected by a collimating lens and
transferred to a broadband spectrometer measuring emission lines from 200 – 965 nm with a
spectral resolution of 0.1 nm. During measurements, the sample holder was manually rastered to
provide a fresh surface of a pellet sample. Eight spectra were collected for each of the four sample
groupings (unspiked Gerber banana, 20.0 ppm, 40.0 ppm and 50.0 ppm) with the above instrument
settings, spectra data obtained were analyzed by MS Excel and PCA. Spectra precision were
obtained by calculating %RSD using the formula,
% RSD = (S.D/mean) x 100 (2)

20
3.3.2 Relative polarities and pH effects on pesticides using reverse phase HPLC-PDA
A mixture of 5.0 ppm pesticide standards were prepared in acetonitrile from the stock
standard solution. Several compositions of mobile phase using acetonitrile/ultra-pure water
were tried out to achieve resolved peaks of the pesticides. The mobile phase was prepared by
degassing and vacuum filtering prior to use. Reversed phase HPLC-PDA was used for the
relative polarities study using a C18 Luna column at a flow rate of 0.5 mL/min and a column
temperature of 30℃. Samples were run under isocratic elution.
For pH effect studies, the mobile phase was made up in different pH phosphate buffer
solutions. Purpose was to determine what optimum pH could be used for extraction.
Phosphate buffers were prepared using a mixture of monobasic dihydrogen phosphate and
dibasic monohydrogen phosphate. The mobile phase mixture was degassed, vacuum filtered
to get rid of particles and pH was confirmed using a pH meter prior to analysis. The pH for
analysis ranged from 2.1 – 10.1 inclusive of the mobile-phase which has a pH of 4.85. A
mixture of pesticide standards of 12.5 ppm was run via reverse phase HPLC-PDA using the
mobile phase buffered at different pH ranges. The retention time (min) of each pesticide at
their optimum wavelength was recorded against the pH been analyzed and a graph was plotted
to monitor the changes observed as pH increases.
3.3.3 LODs and LOQs using reverse phase UV-Vis detection
For LOD and LOQ determinations, absorbances of individual pesticides using a range of
0.5 ppm – 10.0 ppm concentration of individual pesticide working standard solution in acetonitrile
were obtained using acetonitrile as a blank. The absorbances, measured at max, were obtained by

21
placing the standard solutions in a quartz cuvette and obtaining the spectra using the Cary 4000
Spectrophotometer. The absorbances of individual pesticides plotted against the concentrations to
obtain a linear calibration curve. The data analysis tool kit on MS Excel was then used to obtain
regression statistics which gives the standard deviation of the response (Sy) and the slope of the
calibration curve (S) at levels approximating the LOD. The parameters obtained from the
regression statistics was used for the determination of LOQ also. Limits of detection (LOD) and
limits of quantitation (LOQ) were calculated as:
LOD = 3.3 (Sy / S) (3)
LOQ = 10 (Sy / S) (4)
3.3.4 Percent recoveries at different levels of concentration using (HPLC-PDA, UPLC-UV
data)
Five different calibration standards of a mixture of thiamethoxam, aldicarb, simazine,
carbofuran, carbaryl, diuron, and propiconazole were prepared in acetonitrile. Their concentration
range was between 2.0 – 12.5 ppm. The linear calibration curve was obtained by plotting peak
areas of individual pesticides as a function of the concentration using the internal standard method.
Diuron pesticide was used as the internal standard. The internal standard was used to correct for
instrument fluctuations from one injection to the next.
For sample preparation, about ten grams of homogenized banana pellet was weighed into
a 50 mL centrifuge tube. Ground sample was spiked with an appropriate volume of pesticide
standard solution to give a spiking level equivalent to 2.5 ppm, 1.0 ppm and 0.5 ppm respectively.
About 30-35 mL of Acetonitrile was introduced into the spiked banana sample, homogenized in
the centrifuge tube and shaken thoroughly to prevent clumping which can interfere with the
extraction. This step was followed by the addition of pre-weighed QuEChERS sorbents made up

22
of sodium acetate and magnesium sulfate. The contents were shaken thoroughly for about three
minutes. Sample present in the centrifuge tube is then centrifuged at about 4000 rpm for fifteen
minutes. The supernatant which contains the analyte of interest present in the acetonitrile layer
was then transferred into the round bottom flask for evaporation. This was done to evaporate the
organic solvent leaving behind the residue analyte containing the pesticides. The residue analyte
was then reconstituted into 2.0 mL of Acetonitrile and vortexed vigorously. About 2.0 mL of the
reconstituted sample was filtered using a 0.45 μL microtex filter, transferred into an ampule and
analyzed by HPLC-PDA and UPLC/UV. The best mobile phase composition obtained was used
to acquire chromatograms for this study. Mobile phase was degassed and filtered using a sonicator
and vacuum filter prior to use to get rid of particles that may clog the column during separation
analysis. Isocratic elution was employed throughout the analysis at a run time of twenty minutes
for both the calibration standards and the spiked food samples of various concentrations. The
injection volume was set at 10.0 µl and the eluents were monitored by the UV detection
wavelengths at 254 nm for HPLC-PDA and four different wavelengths of 210nm, 220 nm, 248
nm, and 263 nm for UPLC-MWD.
Percent recoveries of pesticides from the banana baby food were determined by four
replications at three different spiking levels (2.5 ppm, 1.0 ppm, and 0.5 ppm) using the internal
standard calibration curve in Equation 6.

23
CHAPTER 4. RESULTS AND DISCUSSION
4.1 Structural comparison of the pesticides
Structural comparison analysis was important to carry out since all studied pesticides will
be subjected to a common extraction method. Figure 6 shows a stacked plot of all the spectra with
aldicarb, carbaryl and carbofuran showing spectra similarities at a wavenumber of 1716 cm-1,
which depicts the presence of the carbonyl groups functional groups. Aldicarb, carbaryl and
carbofuran belongs to the same pesticide class which is known as the carbamates and further
reinforces the similarities observed in the spectra. Thiamethoxam shows a distinct spectrum
compared to others as there is no vibrational activity between wavenumber 3650 – 1600 cm-1,
thiamethoxam belongs to the neonicotinoid class of pesticides and has a distinct chemical structure
with the presence of two different electronegative atoms attached to the ring structure as shown in
Figure 1. Diuron shows the C-Cl stretching vibration at a wavenumber between 1080 – 1000 cm-1
and diazinon with a C-S stretching vibrations present in the region 800 – 600 cm-1. Additional
structural comparisons can be further reinforced via ANOVA, correlation coefficients, and PCA.
4.1.1 Analysis of variance and correlation coefficients
Analysis of variance (ANOVA) was used to analyze the IR spectra of all pesticides. Table
3 summarizes the information. For the variation across the pesticides, row 2, show Fcalc (24.381)
value that was higher than Fcrit (2.010) with 7 degrees of freedom (DF) at 95% confidence level,
and a p-value of 0.000 indicating that the spectra across the pesticide are significantly different.

24
The Fcalc, in rows 3-10, for diazinon (0.006), thiamethoxam (0.023), aldicarb (0.016),
simazine (0.021), carbofuran (0.057), carbaryl (0.038), diuron (0.210) and propiconazole (0.015)
are all less than the Fcrit, (1.939) at a 95 % confidence level, 8 degrees of freedom and p-value >
0.989, indicating there are no significant differences between the 8 spectra (each repeated 9 times).
Percent RSD obtained for within group analysis is ≤ 5% and depicts a good spectra precision. The
correlation values in Table 4, rows 2 – 9, further show the variations present for between group
analysis, as they vary greatly in an overall range of least correlated (0.099) to most correlated
(0.752). The least correlation shown by carbofuran and diazinon is expected due to the distinct
functional groups present in their structure as well as the class of pesticides in which they belong.
Carbaryl and carbofuran exhibits the most correlation as expected, this is resulting from the amino
functional group present in their structures and both belong to the same class of pesticides
(carbamates). Further analysis was carried out to conclude if all pesticides can be subjected to the
same extraction method using the PCA.
Figure 6. FTIR stacked plot spectra of all pesticide samples. Spectra obtained using Perkin
Elmer Spectrum 400 FTIR/ATR for wavenumbers 4000-650cm-1.
0
1
2
3
4
5
6
7
8
9
650115016502150265031503650
Aldicarb
Carbaryl
Carbofuran
Diazinon
Diuron
Simazine
Thiamethoxam
Propiconazole

25
4.1.2 Principal Component Analysis
When the 72 x 3351 matrix of the eight spectra (each repeated 9 times) was subjected to
PCA, the score plot in Figure 7 was obtained and showed that carbofuran, carbaryl, propiconazole,
thiamethoxam, and aldicarb are more closely grouped together in the upper left quadrant as
compared to diazinon, simazine, and diuron. This strong grouping can be attributed to the presence
of the amino and carbonyl functional groups attached to carbofuran, carbaryl, and aldicarb. The
rationale for propiconazole and thiamethoxam grouping with the carbamates is not clear. Diazinon,
simazine and diuron appears far apart from other pesticides and this observation is also supported
by their correlation coefficients, all less than 0.5 versus the other pesticides.
Table 3. Summary of ANOVA results for the eight different pesticides (Diazinon, Thiamethoxam,
Aldicarb, Simazine, Carbofuran, Carbaryl, Diuron, and Propiconazole) as well as the pesticides
within a group (All Pesticide Types).

26
Table 4. Correlation table on the averages for each of the pesticide types for
comparison. MS Excel v15.19.1
Structurally, the grouping of diazinon, simazine, and diuron displayed in the score plot may
be explained as follows:- Diuron contains a phenyl group in its structure linked to a nitrogen atom
of a urea group while simazine structure shows the presence of a heterocyclic nitrogen ring which
is unique as compared to others. Diazinon uniquely contains O-P=S functional groups, with five-
CH3 groups. Simazine contains a -C-N- ring, whereas diuron contains a -C=C- ring. Therefore,
all pesticides can be subjected to the same extraction method as all pesticides fall within the T2 at
95% confidence level.
4.2 Relative polarities and pH effects on the pesticides
Initially, several mobile phase compositions were tried out to resolve the peaks, starting
with 50:50 v/v acetonitrile/water. Finally, a 40:60 v/v acetonitrile/water resolved the seven peaks
successfully. Diazinon spectrum was not evident in the chromatogram and this could be as a result
of breakdown of diazinon under warm storage temperature as opposed to keeping it refrigerated.
Figure 8 shows the relative polarities of all the pesticide studied, thiamethoxam shows a shorter

27
Figure 7. PCA score plot of all pesticides. Hoteling’s T2 at the 95% confidence level:
PCA was performed using SIMCA v13.0.2.0.
elution time which depicts a more polar pesticide while propiconazole shows a longer retention
time and thus, the least polar pesticide.
The relative polarities exhibited by the pesticides are mainly due to their chemical
structure, thiamethoxam structure has oxadiazole-4-imine ring, where rings consist of atoms of
different electronegativity (N and O), but in propiconazole, the structure consists of symmetric
triazole ring, dioxolidine ring and benzene ring. Propiconazole rings contain symmetric structures
and not much polarity is expected. Under the isocratic conditions used, all the pesticides elute
within 18 minutes run-time.
Table 5 and Figure 9 show the retention times of pesticides as a function of the buffered
mobile phase. Thiamethoxam which is a more polar pesticide shows a shorter retention time than

28
Figure 8. Showing relative polarities of studied pesticides on the HPLC-PDA Chromatogram.
propiconazole which is the least polar with a longer elution time further reinforces the relative
polarities as shown in Figure 8. Thiamethoxam, aldicarb and simazine showed little or no
fluctuations in retention times at different pHs of the mobile phase. However, carbofuran, carbaryl,
diuron and propiconazole showed a decrease in retention time around pH 9 to 10. As shown in
Figure 9, if chromatograms are acquired at pH 5.5 for instance, pesticides will show a longer
elution time. However, at pH 9-10 there was a slight convergence which gives a clue that extraction
of all studied pesticides will be optimum under basic condition. In summary, Figure 9 provides
two important pieces of information:
1) All the eight pesticides can be easily resolved when the 40:60 acetonitrile: water mobile
phase is buffered around pH 5.5.
2) For effective liquid-liquid extraction of a mixture of the pesticides, a more basic (pH
9-10) acetonitrile would be more suitable. This is probably the reason why in the
“QuEChERS” method, sodium acetate is added in the extraction step to set the pH
around 9-10.

29
Table 5. Showing the retention time (min) and the Buffer pH at pesticide optimum wavelengths
λ-max 253 248 222 281 222 251 212
pH Thiamethoxam Aldicarb Simazine Carbofuran Carbaryl Diuron Propiconazole
2.1 3.342 7.108 7.450 11.588 13.884 15.730 18.079
3.2 3.338 7.066 8.114 11.455 13.711 15.414 17.790
4.3 3.397 7.268 8.319 11.823 14.174 15.845 18.444
4.9 3.505 7.591 8.669 12.558 15.257 17.171 20.101
7.1 3.343 7.078 8.179 11.486 13.708 15.426 17.675
8.0 3.239 6.487 7.431 10.138 11.883 13.043 15.085
9.2 3.150 5.998 6.861 8.988 10.308 11.189 12.640
9.5 3.268 6.646 7.617 10.488 12.337 13.544 15.142
10.1 3.244 6.546 7.489 10.256 12.041 13.159 14.167
Figure 9. Showing graph of Retention time (min) versus pH of pesticides.
0
5
10
15
20
25
0.0 2.0 4.0 6.0 8.0 10.0 12.0Ret
enti
on
tim
e (m
in)
Buffer pH
Retention time (min) versus Buffer pH
Thiamethoxam Aldicarb Simazine Carbofuran
Carbaryl Diuron Propiconazole

30
4.3 Presence or absence of pesticides in foods using FTIR/ATR and LIBS
When analyzing a food product for pesticides, it is worthwhile to know beforehand whether
the food contains pesticides or not. Figure 10 shows the spectra overlay of unspiked banana sample
versus 0.1, and 10.0 ppm pesticide spiked banana. At a vibration mode around 1050cm-1, there is
an increase in the intensity of 10.0 ppm spiked concentration. However, not much difference can
be observed in the plot thus there is need to subject the spectra collected to statistical techniques
using statistics to reveal any underlying differences. ANOVA results in Table 6 summarize the
analysis of multiple IR spectra of spiked food at different levels in the 650 – 1800 cm-1 range. The
“All Groups” row in Table 6 shows Fcalc = 8.053, which is greater than Fcrit = 1.430 with 34 degrees
of freedom (DF), at 95% confidence level, and a p-value of 0.000. This is to say that overall, the
spiked and unspiked banana samples are significantly different. The Fcalc, in Table 6, rows 3 – 8,
for unspiked banana (0.004), 0.1 ppm pesticide-spiked banana (0.010), 0.5 ppm pesticide-spiked
banana (0.027), 2.0 ppm pesticide-spiked banana (0.090), 5.0 ppm pesticide-spiked banana (0.011)
and 10.0 ppm pesticide-spiked banana (0.015) are all less than the Fcrit (2.375) at a 95% confidence
level, 7 degrees of freedom and a p-value greater than 0.986, indicating there is good precision
within group. Good precision is highly desirable if one is to successfully compare several objects
(spectra).
The correlation table (Table 7) summarizes the relationship between the unspiked banana
sample and the various spiked concentrations. Recall that the closer a correlation value is to 1.00,
the stronger the association. Each sample is correlated with itself in a correlation value of 1.00 and
they are found on diagonals in the correlation table. All correlation values are equal to or greater
than 0.90 which is indicative of the existence of a strong correlation; the least correlation exists
between unspiked banana and 10.0 ppm pesticide-spiked banana (0.987). Correlation coefficients

31
alone cannot distinguish highly similar spectra. To further identify the variation between these
highly correlated samples, PCA was employed.
Figure 10. FTIR Overlay plot showing variations of unspiked banana versus concentrations
of Pesticide-spiked banana samples (0.1 ppm, and 10.0 ppm) obtained in the IR region 650
– 1800 cm-1.
Table 6. FTIR summary of ANOVA results for the six different samples (Unspiked banana, 0.1
ppm, 0.5 ppm, 2.0 ppm, 5.0 ppm and 10.0 ppm pesticide-spiked banana) as well as the samples
within a group.
Objects Mean % RSD F-Calc F-Crit DF P-Value
All Groups 0.067 13.263 8.053 1.430 34 0.000
Unspiked Banana 0.064 0.289 0.004 2.375 4 1.000
0.1 ppm Pesticide-spiked Banana 0.069 0.471 0.010 2.375 4 1.000
0.5 ppm Pesticide-spiked Banana 0.071 0.762 0.027 2.375 4 0.999
2.0 ppm Pesticide-spiked Banana 0.073 1.339 0.090 2.375 4 0.986
5.0 ppm Pesticide-spiked Banana 0.074 0.499 0.011 2.375 4 1.000
10.0 ppm Pesticide-spiked Banana 0.073 0.561 0.015 2.375 4 1.000
0
0.05
0.1
0.15
0.2
0.25
0.3
0.35
0.4
650850105012501450165018502050
banana clean
0.1 ppm
10.0 ppm
Overlay plot of unspiked banana and pesticide-spiked banana

32
4.3.1 Principal Component Analysis of the IR spectra
Figure 11 shows the score plot of all six objects (unspiked banana, spiked banana at five
levels of pesticide concentration). All the six objects were successfully grouped, with the unspiked
banana sample far apart on the right quadrant of the score plot away from the various
concentrations of the pesticide-spiked banana samples. The 0.1 ppm spiked sample is nearest to
the unspiked banana sample, because it resembles the unspiked banana more than the 10.0 ppm
spiked banana. A 0.1 ppm spiked banana can be discriminated from an unspiked banana sample
using IR spectra and PCA. Further increase in the spiking concentration as observed with 10.0
ppm and 20.0 ppm shows a farther distance apart from the unspiked banana sample, thus they
appear in opposite quadrants of the score plot.
Table 7. FTIR correlation table on the averages for each of the six different samples (Unspiked
banana, 0.1 ppm, 0.5 ppm, 2.0 ppm, 5.0 ppm and 10.0 ppm pesticide-spiked banana) for
comparison. MS Excel v15.19.1.

33
Figure 12 shows the LIBS spectra overlay plot of unspiked banana sample versus 20.0,
40.0, and 50.0 ppm pesticide spiked banana. At a wavelength of around 589nm, there is an increase
in the intensity of 50.0 ppm spiked concentration which depicts a high spiking concentration
different from the unspiked banana sample. However, not much difference can be observed in the
plot thus there is need to subject the spectra collected to statistical techniques using means,
ANOVA and correlation coefficients. The variation summaries for LIBS as shown in Table 8, row
2, have Fcalc (3.846) value higher than the Fcrit (2.613) with 3 degrees of freedom (DF), at 95%
confidence level, and a p-value of 0.000 which is indicative that the means on the averages
obtained for the four groups are significantly different.
Figure 11. FTIR PCA score plots of the first and second principal components for unspiked
banana sample and the various spiking concentrations showing possible discriminations at 95%
confidence level: (Unspiked banana, 0.1 ppm, 0.5 ppm, 2.0 ppm, 5.0 ppm and 10.0 ppm
pesticide-spiked banana).

34
The disparities in the means tend to be far apart as the concentration of Diazinon pesticide
increases from 40.0 ppm to 50.0 ppm, but not so obvious for 20.0 ppm concentration because the
concentration is negligible to cause a significant difference. The Fcalc, in Table 8, rows 3 – 6, for
unspiked banana (1.780), 20.0 ppm pesticide-spiked banana (0.133), 40.0 ppm pesticide-spiked
banana (0.335), and 50.0 ppm pesticide-spiked banana (0.086) are all less than the Fcrit (2.014) at
a 95% confidence level, 7 degrees of freedom and a p-value greater than 0.087, indicating there
are no significant differences between the 8 spectra collected within each group. In addition,
overall % RSD of about 7.00 shows a good spectroscopic precision.
The Correlations in Table 9, rows 2 – 5, further supports the dissimilarities present for the
within group analysis. The least correlated of (0.570) to most correlated (0.986) which is again
indicative of the concentrations of the pesticide-spiked in the banana sample. Unspiked banana is
strongly correlated to 20.0 ppm pesticide-spiked banana because the concentration is negligible to
give a distinct correlation. However, at an increased concentration of 50.0 ppm pesticide spiked,
there is a least correlation when compared to the unspiked banana. To further highlight the
difference, it will require the use of multivariate statistical techniques using the PCA and PLS-DA
if possible, for a better visual discrimination between the unspiked banana and the three spiking
levels of the pesticide-spiked banana.
4.3.2 Principal Component Analysis (LIBS)
PCA may provide additional information in discerning spectra that show high similarities. Figure
13 is a score plot of unspiked banana sample along with pesticide-spiked banana (20.0 ppm, 40.0
ppm and 50.0 ppm).

35
Figure 12. LIBS Overlay plot showing variations of Unspiked banana sample versus
concentrations of Pesticide-spiked banana samples (20.0 ppm, 40.0 ppm, and 50.0 ppm) obtained
in the UV-Vis region 200 – 965 nm.
Table 8. LIBS summary of ANOVA results for the four different samples (Unspiked banana, 20.0
ppm. 40.0 ppm and 50.0 ppm pesticide-spiked banana) as well as the samples within a group.
Objects Mean % RSD F-Calc F-Crit DF P-Value
All Groups 17.210 6.235 3.846 2.613 3 0.000
Unspiked banana 16.205 3.266 1.780 2.014 7 0.087
20.0 ppm spiked banana 16.481 0.987 0.133 2.014 7 0.996
40.0 ppm spiked banana 17.625 2.195 0.335 2.014 7 0.938
50.0 ppm spiked banana 18.530 1.220 0.086 2.014 7 0.999
Table 9. LIBS correlation table on the averages for each of the four different samples (Unspiked
banana, 20.0 ppm. 40.0 ppm and 50.0 ppm pesticide-spiked banana).
Unspiked
banana
20.0 ppm spiked
banana
40.0 ppm spiked
banana
50.0 ppm
spiked banana
Unspiked banana 1.000
20.0 ppm spiked banana 0.986 1.000
40.0 ppm spiked banana 0.982 0.978 1.000
50.0 ppm spiked banana 0.629 0.570 0.683 1.000
0
20
40
60
80
100
120
140
160
180
0 200 400 600 800 1000 1200
pesticide-free
20.0 ppm
40.0 ppm
50.0 ppm

36
Three clusters are evident in the score plot. The “Clean Banana” merging with the 20.0 ppm spiked
banana, the 40.0 ppm and 50.0 ppm spiked banana away from the unspiked banana. The scattering
of object members in each group may reflect imprecision in the instrument, or heterogeneity in the
preparation of the target sample. concentration, the unspiked is close but still well separated on the
score plot. At 20.0 ppm concentration, the unspiked is close but still well separated on the score
plot. This is because the 20.0 ppm concentration is indistinguishable from the unspiked banana
negligible to cause a significant discrimination. By increasing the pesticide concentration to 50.0
ppm, a significant difference is observed as compared to the unspiked banana. At 50.0 ppm
pesticide spiked, the discrimination can be well established when compared to the unspiked banana
as it appears on the right quadrant of the score plot far apart from the unspiked banana sample.
Both FTIR and LIBS technique showed satisfactory results for detecting presence or
absence of pesticides in food. However, FTIR gave a lower level of detectability at 0.1 ppm
compared to LIBS level of detectability at 20.0 ppm. Also, FTIR technique showed a better spectra
precision and discrimination between spiked and unspiked banana when compared to LIBS and
this is as a result of the fluctuations in the laser beam pulse used as an excitation source in the
LIBS instrument as well as sample preparation (homogeneous mixture).
4.4 Limit of detection (LOD)
Table 10 summarizes the detection and quantification limits obtained for each pesticide at their
optimum wavelength. Under the chromatographic conditions selected and extracting 10 gram of
banana baby food, the limit of detection for the studied pesticides ranged from 0.10 mg/kg to 1.40
mg/kg while the limit of quantification varied from 0.3 mg/kg to 4.2 mg/kg. The results obtained
for quantification were slightly higher than the maximum residue limits (MRLs) for these

37
Figure 13. PCA score plots of the first and second principal components for unspiked banana
sample and the various spiking concentrations showing possible discriminations at 95%
confidence level: 5 total scores per sample, 3351 wavenumbers. (Unspiked banana, 20.0 ppm, 40.0
ppm and 50.0 ppm pesticide-spiked banana).
pesticides established by the USA Global MRL database on fruits and vegetables, which range
between 0.10 mg/kg – 5.00 mg/kg. The lowest concentration that can be quantitated using the UV-
Vis was obtained at a concentration of around 1.0 ppm. Also, the detector response was linear in
the range of concentrations studied, and the correlation coefficients for the pesticides ranged from
0.980 – 1.000 (Table 10). Sensitive detection of pesticides in banana baby food using this method
will require the use of more sensitive instrumentation such as LC-MS/MS.
Table 10. Showing Optimum wavelengths (nm), limits of detection (LOD), limits of quantification
(LOQ), and calibration data of the studied pesticides.

38
Compound λ max (nm) Slope R2 LOD (mg/kg) LOQ (mg/kg)
Thiamethoxam 253 0.061 1.000 0.1 0.4
Aldicarb 248 0.010 0.996 0.8 2.5
Simazine 221 0.166 0.997 0.3 0.8
Carbaryl 215 0.269 0.980 1.4 4.2
Carbofuran 222 0.014 1.000 0.1 0.4
Diuron 251 0.111 0.999 0.2 0.7
Propiconazole 220 0.062 0.991 0.1 0.3
4.5 Percent recoveries at different levels of concentration using HPLC-PDA and
UPLC-UV
Acetonitrile extraction with different clean up procedures were used for the analysis of
pesticides in banana baby food sample. Using the QuEChERS procedure with the SPE clean-up,
we encountered strong interferences compromising both identification and quantification of the
pesticides at lower concentration levels. However, the modified QuEChERS procedure with the
LLE clean-up and pre-concentration step gave a satisfactory percent recovery and was effective in
the removal of interference during the extraction process. The sodium acetate which is a conjugate
base was used during the extraction process and made up for the stability of basic pH sensitive
analyte.
The HPLC/PDA and UPLC-MWD optimized conditions were employed for the analysis
of percent recovery. Generally, researchers have made use of acetonitrile for the extraction of
pesticides in fruits and vegetables solely because of the solvent’s high polarity.26-28 Other
commonly used nonpolar solvents for polar pesticide extraction include chloroform, toluene,
hexane and dimethyl ether.
Table 11 and 12 summarizes the average percent recovery of all pesticides at a spiking
level of 0.5, 1.0 and 2.5 mg/kg from banana baby food. Average recoveries obtained were

39
satisfactory and ranged from 62.30 to 123.0 % and 85.90 – 115.1 % using HPLC-PDA and UPLC-
UV respectively. Also, the precision obtained after four repeated analysis were acceptable as %
RSD was ≤ 20. Percent recovery obtained for simazine using HPLC-PDA was low and this can be
a result of the spectra overlap observed at the monitoring wavelength between the spectrum of
dodecenyl succinic anhydride present in the banana baby food and simazine pesticide as shown in
Figure 14. Percent recovery results obtained using UPLC-MWD gave a better precision as
compared to analysis done using HPLC-PDA and this can be attributed to the fact that UPLC
operates under a higher pressure (psi) and produces narrower peaks with better resolutions. Also,
simazine showed a significant increase in percent recovery using the UPLC-UV. This may likely
be since wavelengths selected during analysis using the multiwavelength detector subdued the
interference caused by dodecenyl succinic anhydride, thus there was no peak eluting closely to
simazine on the chromatogram.
Figure 15 shows a representative chromatogram of unspiked banana baby food extract and
a banana baby food spiked at 0.5 mg/kg analyzed by HPLC with a PDA detector. The
chromatographic program used for the separation allows a good resolution of the pesticide mixture
under twenty minutes and twelve minutes using the HPLC-PDA and UPLC-MWD respectively.
The chromatogram observed from the blank banana extract showed a peak at a retention time of
9.0 minutes known to be dodecenyl succinic anhydride (DDSA) corn starch which is part of the
active ingredients of the banana baby food sample. The peak was obtained by collecting eluates at
the retention time and diluting with acetonitrile prior to confirmation using GC-MS, which gave
an 87 % match of the identified interferent. No additional interference compounds were present in
the extract as the clean-up step was efficient in achieving a satisfactory percent recovery as
compared with some literature review articles.29-34

40
Table 11. Showing percent recoveries obtained at three spiking levels using modified QuEChERS
method and HPLC-PDA.
n=4
2.5 (mg/kg) 1.0 (mg/kg) 0.5 (mg/kg)
Compound Banana Banana Banana
Thiamethoxam 105.3 ± 6.0 114.6 ± 11.6 107.8 ± 1.5
Aldicarb 104.5 ± 4.2 107.7 ± 11.0 88.5 ± 12.1
Simazine 62.3 ± 19.3 59.6 ± 9.0 55.3 ± 9.3
Carbofuran 100.8 ± 9.1 104.8 ± 6.6 90.3 ± 2.7
Carbaryl 110.8 ± 4.9 123.1 ± 4.6 111.3 ± 5.6
Propiconazole 104.9 ± 8.7 104.2 ± 5.3 98.7 ± 6.7
*Results are mean of four replicates ± % RSD
Table 12. Showing percent recoveries obtained using modified QuEChERS method and UPLC-
MWD.
n=4
2.5 (mg/kg) 1.0 (mg/kg) 0.5 (mg/kg)
Compound Banana Banana Banana
Thiamethoxam 97.4 ±0.6 93.8 ±1.8 87.4 ±1.0
Aldicarb 115.1 ±6.6 102.1 ±2.6 88.1 ±2.5
Simazine 91.9 ±1.7 90.5 ±3.1 105.3 ±2.9
Carbofuran 90.0 ±2.4 88.9 ±4.2 85.9 ±4.4
Carbaryl 94.3 ±0.8 93.7 ±5.1 97.7 ±5.9
Propiconazole 97.3 ±1.4 96.7 ±2.8 95.7 ±5.10
*Results are mean of four replicates ± % RSD

41
Figure 14. HPLC spectra overlay of dodecenyl succinic anhydride (red) and simazine pesticide
(blue).
Figure 15. HPLC-PDA chromatogram overlay of unspiked banana baby food extract (red) and
banana spiked at 0.5 mg/kg (blue).
(Thiamethoxam)
(Aldicarb)(Simazine)
(Carbofuran)
(Carbaryl) (Diuron)
(Propiconazole)

42
CHAPTER 5. CONCLUSION
The HPLC-PDA and UPLC-MWD results for pesticide analysis were successfully
developed. Modification of QuEChERS method was simple, suitable and reliable for the
successful determination of pesticides in banana baby food at low concentration levels. The
modified QuEChERS procedure gave satisfactory percent recoveries and data precision compared
to the results obtained from the Georgia Department of Agriculture (Tifton, GA). When
determining pesticide of different classes, it is important to carry out a structural comparison and
pH study to ensure that the proposed extraction method can accommodate for all pesticides. The
study of relative polarities and pH-dependence of retention times assisted in the optimization of
the extraction method. A significant advantage was that UPLC-MWD gave a shorter analysis time
and better peak resolution as compared to HPLC-PDA which gave a longer analysis time. Also,
percent recovery data obtained using UPLC-MWD gave better data precision as compared to
HPLC-PDA. The limit of detection obtained were slightly higher than the MRLs stipulated by the
USA Global MRLs database for each pesticide in banana matrix.
Additionally, by combining Chemometrics techniques with spectra precision obtained
from unspiked banana baby food and spiked banana baby food using FTIR and LIBS, it was
possible to discriminate pesticide-infected food from the un-infected. FTIR and LIBS technique
provided an efficient method that is non-destructive and requires no preparation step for
establishing the presence or absence of pesticide in baby food sample and PCA provided a strong
statistical argument for the visual cluster analysis.
However, there were challenges in the sample preparation step for LIBS analysis. This was
rectified using a pellet presser to produce pellets of the same size and height in order to obtain a
better spectra precision. Also, with FTIR, detection limit for the discrimination was as low as 0.1

43
ppm whereas for LIBS the lowest detection limit was at 20.0 ppm. Hopefully, this study in its
entirety can be extended to other food products.
44
References
1.Nicolopoulou-Stamati, P.; Maipas, S.; Kotampasi, C.; Stamatis, P.; Hens, L. Chemical Pesticides
and Human Health: The Urgent Need for a New Concept in Agriculture. Frontiers in public
health 2016, 4, 148.
2. Anonymous public health.
3. Matzner, S. Introduction; 2018;
4. Repetto R, Baliga S. Trends and patterns of pesticide use: In Pesticides and the immune system;
Public Health Risks, 3-8. World Resources Institute; Washington, D.C.: 1996.
5. Department of Environmental Protection. Chemical evaluated for carcinogenicity, Office of
pesticides programs. Washington, DC.: 2002.
6. April; 2017 Pesticide Toxicity and Hazard.
7. EPA (US Environmental Protection Agency). 1992. Incentives for Development and
Registration of Reduced Risk Pesticides. Federal Register. 57(139):32140–32145.
8. EPA (US Environmental Protection Agency). 1998. Status of Pesticides in Registration,
Reregistration, and Special Review (Rainbow Report). Washington, DC: EPA, Office of Pesticide
Programs.
9.EPA (US Environmental Protection Agency). 1999. What are biopesticides. Office of Pesticide
Program. [Online]
10. Buchel, K. H. (1983). Chemistry of Pesticides, John Wiley & Sons, Inc. New York, USA
11. Anonymous Edwards, Clive D; 2012; Vol. 2, pp 753.
12. States: History; Benefits; Risks Pesticide Usage in the United.

45
13. Sivaperumal, P.; Anand, P.; Riddhi, L. Rapid determination of pesticide residues in fruits and
vegetables, using ultra-high-performance liquid chromatography/time-of-flight mass
spectrometry. Food Chemistry 2015, 168, 356-365.
14. Parrilla Vázquez, P.; Hakme, E.; Uclés, S.; Cutillas, V.; Martínez Galera, M.; Mughari, A. R.;
Fernández-Alba, A. R. Large multiresidue analysis of pesticides in edible vegetable oils by using
efficient solid-phase extraction sorbents based on quick, easy, cheap, effective, rugged and safe
methodology followed by gas chromatography–tandem mass spectrometry. Journal of
Chromatography A, 2016, 1463, 20-31.
15. Sivaperumal, P.; Anand, P.; Riddhi, L. Rapid determination of pesticide residues in fruits and
vegetables, using ultra-high-performance liquid chromatography/time-of-flight mass
spectrometry.Food Chemistry 2015, 168, 356-365.
16. Petrarca, M. H.; Fernandes, J. O.; Godoy, H. T.; Cunha, S. C. Multiclass pesticide analysis in
fruit-based baby food: A comparative study of sample preparation techniques previous to gas
chromatography–mass spectrometry. Food Chemistry 2016, 212, 528-536.
17. Camino-Sánchez, F. J.; Zafra-Gómez, A.; Ruiz-García, J.; Bermúdez-Peinado, R.; Ballesteros,
O.; Navalon, A.; Vílchez, J. L. UNE-EN ISO/IEC 17025:2005 accredited method for the
determination of 121 pesticide residues in fruits and vegetables by gas chromatography–tandem
mass spectrometry. Journal of Food Composition and Analysis 2011, 24, 427-440.
18.Štajnbaher, D.; Zupančič-Kralj, L. Multiresidue method for determination of 90 pesticides in
fresh fruits and vegetables using solid-phase extraction and gas chromatography-mass
spectrometry. Journal of Chromatography A 2003, 1015, 185-198.
19. AnonymousContents. Food Chemistry 2009, 114, vi.

46
20. LAL, A.; TAN, G.; CHAI, M. Multiresidue Analysis of Pesticides in Fruits and Vegetables
Using Solid-Phase Extraction and Gas Chromatographic Methods. Analytical Sciences 2008, 24,
231-236.
21.Payá, P.; Anastassiades, M.; Mack, D.; Sigalova, I.; Tasdelen, B.; Oliva, J.; Barba, A. Analysis
of pesticide residues using the Quick Easy Cheap Effective Rugged and Safe (QuEChERS)
pesticide multiresidue method in combination with gas and liquid chromatography and tandem
mass spectrometric detection. Anal Bioanal Chem 2007, 389, 1697-1714.
22.Fenik, J.; Tankiewicz, M.; Biziuk, M. Properties and determination of pesticides in fruits and
vegetables. Trends in Analytical Chemistry 2011, 30, 814-826.
23. Chang, P.; Hsieh, M.; Chiu, T. Recent Advances in the Determination of Pesticides in
Environmental Samples by Capillary Electrophoresis. International journal of environmental
research and public health 2016, 13, 409.
24. Robinson, James W.; Skelly Frame, Eileen M.; Frame II, G. M. Undergraduate Instrumental
Analysis, Seventh Ed.; CRC Press: Boca Raton, 2014.
25.Markiewicz-Keszycka, M.; Cama-Moncunill, X.; Casado-Gavalda, M. P.; Dixit, Y.; Cama-
Moncunill, R.; Cullen, P. J.; Sullivan, C. Laser-induced breakdown spectroscopy (LIBS) for food
analysis: A review. Trends in Food Science & Technology 2017, 65, 80-93.
26. Nováková, L.; Matysová, L.; Solich, P. Advantages of application of UPLC in pharmaceutical
analysis. Talanta 2006, 68, 908-918
27. Willard, H. H.; Merritt, L. L.; Dean, J. A. Instrumental methods of analysis; Princeton, N.J.,
Van Nostrand 1965]; 4th ed: 1965

47
28. Msimanga, H. Z.; Lam, T. T. H.; Latinwo, N.; Song, M. K.; Tavakoli, N. Reduction of
interferences in the analysis of Children's Dimetapp using ultraviolet spectroscopy data and target
factor analysis. Spectrochimica Acta Part A: Molecular and Biomolecular Spectroscopy 2018,
192, 159-167.
29. Bernardi, G.; Kemmerich, M.; Ribeiro, L. C.; Adaime, M. B.; Zanella, R.; Prestes, O. D. An
effective method for pesticide residues determination in tobacco by GC-MS/MS and UHPLC-
MS/MS employing acetonitrile extraction with low-temperature precipitation and d-SPE clean-
up. Talanta 2016, 161, 40-47.
30. Melo, A.; Cunha, S. C.; Mansilha, C.; Aguiar, A.; Pinho, O.; Ferreira, Isabel M. P. L. V. O.
Monitoring pesticide residues in greenhouse tomato by combining acetonitrile-based extraction
with dispersive liquid–liquid microextraction followed by gas-chromatography–mass
spectrometry. Food Chemistry 2012, 135, 1071-1077.
31. Wilkowska, A.; Biziuk, M. Determination of pesticide residues in food matrices using the
QuEChERS methodology. Food Chemistry 2011, 125, 803-812.
32. Kaihara, A.; Yoshii, K.; Tsumura, Y.; Nakamura, Y.; Ishimitsu, S.; Tonogai, Y. Multiresidue
Analysis of Pesticides in Fresh Fruits and Vegetables by Supercritical Fluid Extraction and
HPLC. Journal of Health Science 2000, 46, 336-342.
33. S Kontou; D Tsipi; V Oreopoulou; C Tzia Determination of ETU in Tomatoes and Tomato
Products by HPLC-PDA. Evaluation of Cleanup Procedures. Journal of agricultural and food
chemistry 2001, 49, 1090-1097.

48
34. Hirotaka Obana; Msahiro Okihashi; Kazuhiko Akutsu; Yoko Kitagawa; Shinjiro Hori
Determination of Acetamiprid, Imidacloprid, and Nitenpyram Residues in Vegetables and Fruits
by High-Performance Liquid Chromatography with Diode-Array Detection. Journal of
agricultural and food chemistry 2002, 50, 4464-4467.
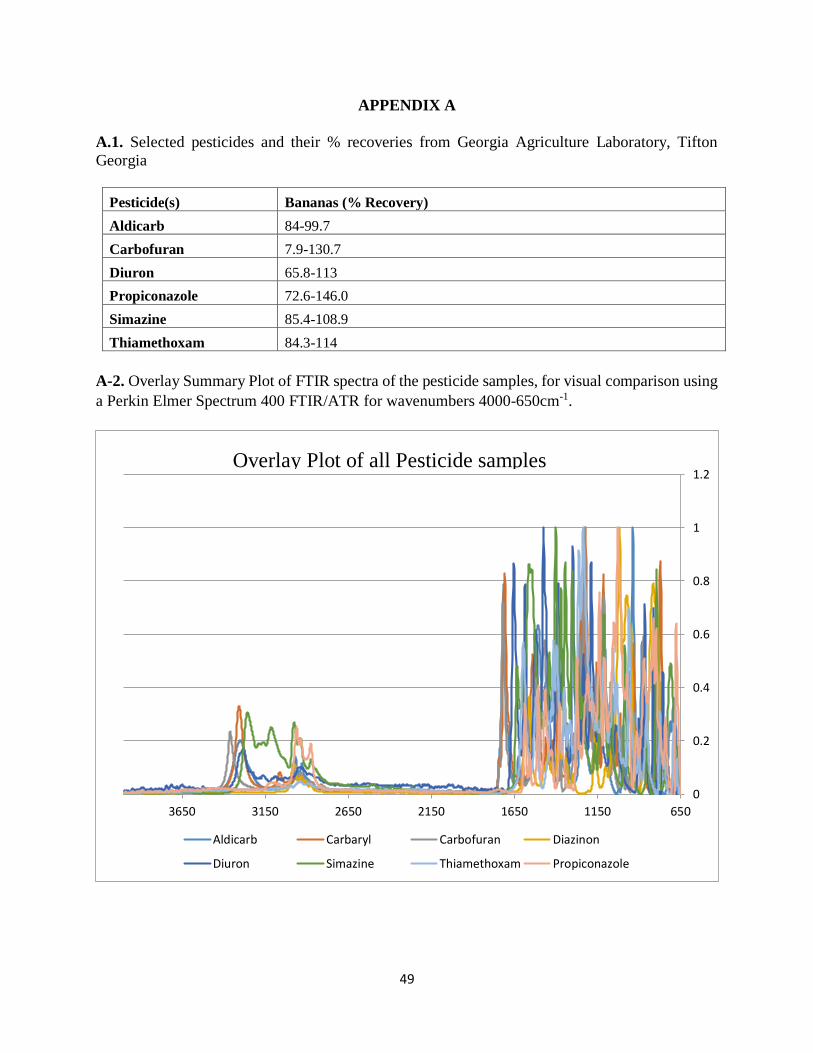
49
APPENDIX A
A.1. Selected pesticides and their % recoveries from Georgia Agriculture Laboratory, Tifton
Georgia
Pesticide(s) Bananas (% Recovery)
Aldicarb 84-99.7
Carbofuran 7.9-130.7
Diuron 65.8-113
Propiconazole 72.6-146.0
Simazine 85.4-108.9
Thiamethoxam 84.3-114
A-2. Overlay Summary Plot of FTIR spectra of the pesticide samples, for visual comparison using
a Perkin Elmer Spectrum 400 FTIR/ATR for wavenumbers 4000-650cm-1.
0
0.2
0.4
0.6
0.8
1
1.2
650115016502150265031503650
Aldicarb Carbaryl Carbofuran Diazinon
Diuron Simazine Thiamethoxam Propiconazole
Overlay Plot of all Pesticide samples

50
A-3. Overlay Summary Plot of FTIR spectra of homogenized unspiked banana sample and various
concentrations of pesticide-spiked banana sample.
0
0.05
0.1
0.15
0.2
0.25
0.3
0.35
0.4
6508501050125014501650
Plot of Unspiked banana versus concentrations of Pesticide-
spiked
banana clean 0.1 ppm 0.5 ppm 2.0 ppm 5.0 ppm 10.0 ppm

51
A-4. Chromatogram and spectrum of blank homogenized banana sample under established
HPLC/PDA conditions.
A-5. Chromatogram of spiked homogenized banana baby food at 0.5 mg/kg.
A-6: UV-Vis absorption spectra of Aldicarb pesticide
A-6: UV-Vis absorption spectra of Aldicarb pesticide
(Thiamethoxam)
(Aldicarb)
(Simazine)
(Carbofuran)
(Carbaryl)
(Diuron) (Propiconazole)

52
A-6. UV-Vis absorption spectra of Aldicarb pesticide.
A-7. UV-Vis absorption spectra of Carbaryl pesticide.

53
A-8. UV-Vis absorption spectra of Carbofuran pesticide.
A-9. UV-Vis absorption spectra of Diazinon pesticide.

54
A-10. UV-Vis absorption spectra of Diuron pesticide.
A-11. UV-Vis absorption spectra of Simazine pesticide.

55
A-12. UV-Vis absorption spectra of Thiamethoxam pesticide.
A-13. UV-Vis absorption spectra of Propiconazole pesticide.

56
A-14. Calibration curve for Aldicarb pesticide
A-15. Calibration curve for Carbofuran pesticide
y = 0.1047x - 0.0012R² = 0.9999
0
0.05
0.1
0.15
0.2
0.25
0.000 0.500 1.000 1.500 2.000 2.500
AV
G (
area
std
/are
a is
td)
Concentration (ppm)
y = 0.145x - 0.0055R² = 0.9995
0
0.05
0.1
0.15
0.2
0.25
0.3
0.000 0.500 1.000 1.500 2.000 2.500
AV
G (
area
std
/are
a is
td)
Concentration (ppm)

57
A-16. Calibration curve for Carbaryl pesticide.
A-17. Calibration curve for Simazine pesticide.
y = 0.2367x - 0.0041R² = 0.9996
0
0.05
0.1
0.15
0.2
0.25
0.3
0.35
0.4
0.45
0.5
0.000 0.500 1.000 1.500 2.000 2.500
AV
G (
area
std
/ ar
ea i
std)
Concentration (ppm)
y = 1.3871x - 0.0078R² = 0.9997
0
0.5
1
1.5
2
2.5
3
0.000 0.500 1.000 1.500 2.000 2.500
AV
G (
area
std
/ ar
ea i
std)
Concentration (ppm)

58
A-18. Calibration curve for Thiamethoxam pesticide.
A-19. Calibration curve for Propiconazole pesticide.
y = 0.6425x - 0.0006R² = 0.9997
0
0.2
0.4
0.6
0.8
1
1.2
1.4
0.000 0.500 1.000 1.500 2.000 2.500
AV
G (
area
std
/are
a is
td)
Concentration (ppm)
y = 0.661x - 0.011R² = 0.9972
0
0.2
0.4
0.6
0.8
1
1.2
1.4
0.000 0.500 1.000 1.500 2.000 2.500
AV
G (
area
std
/ ar
ea i
std)
Concentration (ppm)