a molecular dynamics simulation study of the plastic...
TRANSCRIPT

J. Phys. C: Solid State Phys., 16 (1983) 5969-5983. Printed in Great Britain
A molecular dynamics simulation study of the plastic crystalline phase of sulphur hexafluoride
M T Dove and G S Pawley Department of Physics, University of Edinburgh, Edinburgh E H 9 3JZ, UK
Received 5 May 1983
Abstract. A molecular dynamics simulation study of the plastic crystalline phase of SF6 is reported. Various equilibrium properties have been measured and, where possible, com- pared with corresponding experimental measurements. The form of the molecular orien- tational distribution function has been obtained and is found to be in good agreement with that determined in a recent neutron scattering study. Information concerning the single- molecule dynamics has been obtained from calculations of linear and angular velocity autocorrelation functions, and it has been shown that the SF6 molecules undergo hindered rotation. The existence of coupling between the translational and rotational motions has been demonstrated, and it is shown how the behaviour of the plastic crystal is related to the form of the intermolecular potential. In addition, a transition to a trigonal low-temperature crystal phase at 80 K has been observed, and the structure of this phase has been identified and found to be in good agreement with experimental results. The calculations have been performed using a large parallel-array processor, and features of the simulation algorithms that reflect the architecture of such a computer are discussed.
1. Introduction
The molecular dynamics simulation (MDS) method is a useful tool to augment experi- mental studies of matter in the various condensed phases. That most reported MDS studies are of simulations of the liquid state is understandable: experimental studies of this state of matter, e.g. diffraction or resonance studies (Hansen and MacDonald 1976), are often unable to probe the fine detail of the static and dynamic nature of this state, and the results from such studies are often difficult to interpret in a unique manner. Thus the MDS method is often the most sensitive tool for quantitative evaluation of theoretical models. Another condensed state of matter for which it might seem that an application of the MDS method might prove fruitful is the plastic crystalline state (Sherwood 1979). In such studies of this state one is able to measure various quantities related to the static and dynamic properties of the orientational disorder that characterises this state in ways not currently possible experimentally. Some examples that will illustrate this point will be presented below.
The range of crystals and molecules that exhibit plastic crystalline phases is diverse, and hence there is no one type of orientational disorder or rotational motion that characterises fully the plastic crystalline state. On one hand, there are crystals such as (NH4)’C1- and K’(CN)- in which each molecular ion is able to occupy either of two or more equivalent sites in a crystal lattice to give an approximate ‘pseudo-spin’ sublattice
@ 1983 The Institute of Physics 5969

5970 M T Dove and G S Pawley
within the true lattice of the single ions. In other cases, as exemplified by the tetrahedral A& molecules such as methane and carbon tetrachloride, electrically neutral molecules occupy sites that have a higher symmetry than the symmetry of the individual molecule. The molecules cited here have symmetry Td but lie on sites with the cubic Oh symmetry. In this case the orientational disorder is a direct result of the differences between these two point groups, as has been discussed by Dolling eta1 (1979). In yet another case: the symmetries of the molecule and the lattice sites are identical and the plastic crystalline properties arise because the near-spherical shape of the molecule allows the existence of large-amplitude librations and hence molecular reorientation and effective orienta- tional disorder. An example is the cubic AX6-type molecules. The first two cases have been subject to considerable study in recent years, both experimentally and theoretically (Sherwood 1979). Moreover the plastic crystalline phases of the two tetrahedral mol- ecules discussed above have recently been studied through MDS calculations (Bounds er a1 1980, MacDonald et a1 1982). However, the third case has received comparatively little attention. Thus the subject of the present study is an MDS study of the plastic crystalline phase of a cubic AX6 molecule, with the parameters corresponding to atomic masses, interatomic bond lengths and intermolecular potential functions chosen to reproduce as closely as possible those for sulphur hexafluoride (SF6).
Sulphur hexafluoride has a plastic crystalline phase that exists over an exceptionally wide temperature range, from 96 K to the melting point of 223 K. The crystal structure of the plastic crystalline phase has been investigated by x-ray and neutron powder diffraction (Michel er a1 1970, Dolling er a1 1979), showing that the lattice is body-centred cubic with the molecules lying on the sites of cubic symmetry. The latter authors developed a theoretical method for obtaining information concerning the orientational structure from diffraction data, and analysed their neutron diffraction results in the light of this method (discussed further in 0 3). The only available information concerning the low-temperature structure of SF6 was obtained by electron diffraction (Raynerd et a1 1982). These measurements suggested the existence of two low-temperature crystal phases above and below -50 K. The higher-temperature crystal phase was shown to have trigonal symmetry, and a possible structure was postulated on the basis of packing arguments and lattice energy calculations. The low-temperature phase was found to have monoclinic or lower symmetry, but no further detail was given.
Pawley (1981) initiated MDS studies on this material by performing a preliminary calculation with a small array of molecules and restricting the molecular motions to rotational motion only. More recently, Pawley and Thomas (1982a) extended these calculations by removing all restrictions on the molecular motions and demonstrated the existence of a phase transition to a truly crystalline low-temperature structure at 25 K. This structure is triclinic (space group P i ) and is not inconsistent with the electron diffraction measurements of Raynerd et a1 (1982), particularly since the resolution of such measurements is not sufficient to detect the small deviations of the unit cell angles from 90" predicted by the MDS calculations. The present study is aimed at further extending the range of calculations in order to obtain some information concerning several thermodynamic, static and dynamic properties of interest for the plastic crystal- line phase, thus laying the essential foundation for future MDS studies of the detailed nature of the molecular dynamics through the plastic crystalline phase transition. The results of the present study can then be compared with the results of the MDS studies of the plastic crystalline phases of the tetrahedral molecules in order to highlight some of the features of such a system. Moreover, the calculations presented here have been performed on an ICL Distributed Array Processor (DAP), whose unique architecture

Plastic phase of SF6 5971
has enabled us to use a large MDS sample of 4096 molecules thereby using the DAP to maximum efficiency; by way of comparison, the samples used in the MDS studies of tetrahedral molecules were of 108 molecules. Thus the results of this study will serve to illustrate the potential of the use of large parallel-array processors for MDS calculations, and accordingly some attention to the details of the computational aspects of the work will be given below.
The primary purpose of such studies should, however, be noted at the outset. Although the various parameters used in the present study were chosen to model as closely as possible the behaviour in the ‘real’ SF6 system, the study is not to be judged solely according as to how closely the results of the MDS calculations resemble those obtained from experimental studies of the ‘real’ system, even though such comparisons can be fruitful. On the contrary, the purpose is to study the properties of a model plastic crystalline phase of an AX6-type molecule, with parameters chosen to resemble a ‘real’ system in order to ensure that a plastic crystalline state will occur within some finite temperature range and that a transition to a crystalline phase exists. Hence the primary interest of such studies is in the physical properties displayed by such systems, properties which may well have their counterparts in nature. Furthermore, it is a long-term aim to be able to relate the microscopic behaviour of molecular crystals to features of the intermolecular potential (Huller 1980) and the MDS tool will doubtless prove to be invaluable for testing the detail of models of such systems (Schneider and Stoll1978).
2. Experimental
The potential energy W12 between two SF6 molecules 1 and 2 was modelled following Pawley (1981) by assuming that the energy can be expressed as a sum of Lennard- Jones-type interactions between the individual F atoms only:
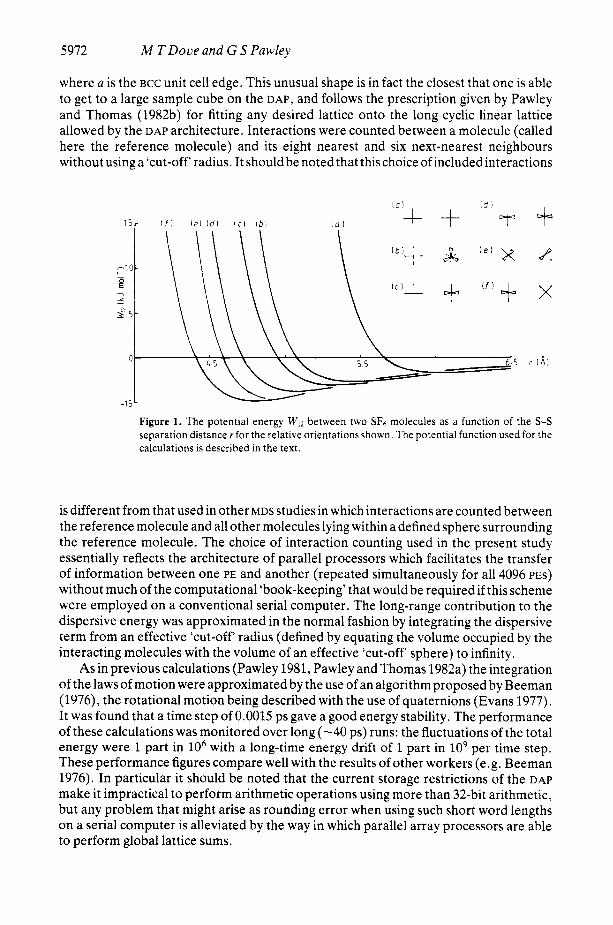
w12 = - 4 a ‘I [ (;I6 - (;y2] where rij is the distance between the ith atom of molecule 1 and thejth atom of molecule 2. The value of a o f 2.7 8, was chosen in order to reproduce the unit cell length of the static SF6 BCC crystal of 5.78 8, as determined by Dolling er a1 (1979) for an S-F bond length of 1.565 8,. Clearly this procedure has an inherent inadequacy since the dynamic and orientational disorder effects have not been taken into account, but it was considered that this approximation was good enough considering the approximate nature of the form of the model potential. The value of &was estimated as 0.586 kJ mol-’ in order to give a good estimation of the lattice potential energy. Electrostatic interactions, which are the interactions that usually count for the greatest discrepancies between model and ‘real’ potentials, can be neglected in the case of SF6 since the lowest non-zero multipole moment is the short-range hexadecapole moment. The potential energy between two molecules for different relative orientations is shown in figure 1.
The DAP has been described in relation to its role in performing lattice calculations by Pawley and Thomas (1982b). Each SF6molecule was assigned to a separate processing element (PE), and the MDS sample of 4096 molecules was mapped onto a BCC lattice within a parallelepiped with periodic boundary conditions and edge vectors
ZI = a(13, -1,O) 12 = a( -0.5,12.5, -0.5) (2) 13 = ~ ( 0 . 5 , 3 . 5 , 12.5)
5972 M T D o v e and G S Pawley
-1 0
E --
where a is the BCC unit cell edge. This unusual shape is in fact the closest that one is able to get to a large sample cube on the DAP, and follows the prescription given by Pawley and Thomas (1982b) for fitting any desired lattice onto the long cyclic linear lattice allowed by the DAP architecture. Interactions were counted between a molecule (called here the reference molecule) and its eight nearest and six next-nearest neighbours without using a ‘cut-off‘ radius. It should be noted that this choice of includedinteractions
~
l j r i f 1 l e ) Id) I c l I b l l a I
-15 Ot \ I C 1 ’ I ( f l I
B,
x
Figure 1. The potential energy W12 between two SF6 molecules as a function of the S-S separation distance r for the relative orientations shown. The potential function used for the calculations is described in the text.
is different from that used in other MDS studies in which interactions are counted between the reference molecule and all other molecules lying within a defined sphere surrounding the reference molecule. The choice of interaction counting used in the present study essentially reflects the architecture of parallel processors which facilitates the transfer of information between one PE and another (repeated simultaneously for all 4096 PES) without much of the computational ‘book-keeping’ that would be required if this scheme were employed on a conventional serial computer. The long-range contribution to the dispersive energy was approximated in the normal fashion by integrating the dispersive term from an effective ‘cut-off radius (defined by equating the volume occupied by the interacting molecules with the volume of an effective ‘cut-off‘ sphere) to infinity.
As in previous calculations (Pawley 1981, Pawley and Thomas 1982a) the integration of the laws of motion were approximated by the use of an algorithm proposed by Beeman (1976), the rotational motion being described with the use of quaternions (Evans 1977). It was found that a time step of 0.0015 ps gave a good energy stability. The performance of these calculations was monitored over long (-40 ps) runs: the fluctuations of the total energy were 1 part in lo6 with a long-time energy drift of 1 part in lo9 per time step. These performance figures compare well with the results of other workers (e.g. Beeman 1976). In particular it should be noted that the current storage restrictions of the DAP make it impractical to perform arithmetic operations using more than 32-bit arithmetic, but any problem that might arise as rounding error when using such short word lengths on a serial computer is alleviated by the way in which parallel array processors are able to perform global lattice sums.

Plastic phase of SF6 5973
Equilibration of the MDS sample was achieved as follows. It was desirable to perform the MDS calculations with the samples at zero pressure. Thus during the first 1500 time steps the temperature was adjusted to maintain the required temperature and the unit cell edge was similarly automatically adjusted to offset any pressure changes. When these adjustments became consistently small, the calculations continued with no further adjustments until equilibrium was reached. This point was monitored by calculations of the constant-volume heat capacity (Lebowitz et a1 1967) which is a fairy sensitive test of the time evolution of the size of the temperature fluctuations. The heat capacity was calculated for different time intervals, and when a reproducible value from different data samples was obtained it was adjudged that equilibrium had been achieved. It was clear from the results obtained during the equilibration period that the temperature reached a steady value and that equipartition was achieved relatively quickly after the end of the period of thermal adjustment, but it was considerably longer (-12 ps) before the fluctuations in the mean temperature reached a steady level: at shorter times the fluctuations had larger amplitudes than in the equilibrated state. Simulations were carried out at several temperatures in order to explore features of the zero-pressure phase diagram, and at three temperatures (115, 150 and 200K) longer runs were undertaken in order to obtain good thermodynamic measurements for the plastic crystalline phase. The simulations at 115 and 200 K lasted for -12 ps following a suitable period of equilibration, and the run at 150 K was allowed to continue for -40 ps in order to obtain information concerning the dynamics of the plastic crystalline phase.
For the long-time MDS runs the configurational analyses, including the calculations of thermodynamic, static and dynamic properties, were performed after every five time steps during the simulation run. This is in contrast to the usual procedure of generating and storing the configurations, and performing the analyses as a separate task. With samples as big as 4096 molecules, the storage size required for each configuration would be about 0.2 Mbytes, and with a computer as powerful as the DAP we have now entered a stage in which it is quicker to regenerate the vast quantities of data than to manipulate the large data files required!
3. Results
3.1. Phase diagram
The phase diagram for SF6 has been well established (Stewart 1962); at atmospheric pressure the plastic crystalline phase extends over the temperature range 96-223 K above and below which exist the liquid phase and a true crystalline phase respectively. Although in the present MDS study of SF6 at pressures close to atmospheric we have not sought to define the phase behaviour exactly, we have been able to determine the approximate temperature range of the existence of the plastic crystalline phase. Melting of the simulation sample could be observed by monitoring the mean square displace- ments of the molecules from their respective crystal origins. In this way, the melting temperature in the MDS sample was found to lie between 250 and 300 K. The transition to a low-temperature crystal phase was not so easy to observe. In this case, the transition was noticeable by difficulties experienced in establishing the zero-pressure condition, and confirmation of the transition was obtained by drawing layers of molecules and inspecting for new symmetries (Pawley and Thomas 1982a). It was found that the transition to a crystal phase occurs between 80 and 100 K. In the next section it will be

5974 M T Dove and G S Pawley
shown that this phase can be identified with the trigonal phase revealed by the electron diffraction measurements of Raynerd et al(l982). The MDS study of Pawley and Thomas (1982a) has also shown that at a temperature above 25 K the MDS sample undergoes a further phase transition to a triclinic phase.
The fact that the simulations show that the phase transitions occur at temperatures close to those in the real SF6 system indicates that the model intermolecular potential
Figure 2. Section through the MDS cell at 80 K. Those molecules whose axis perpendicular to the plane of the diagram is less than 30" from the cubic axis in that direction have been shaded in order to show the channels of disordered molecules more clearly. Note that the left- and right-hand edges are equivalent but displaced, showing the skew-periodic boundary imposed
does indeed contain many of the features of the true potential. Further confirmation of the realism of the model potential will be given in following sections,
3.2. The low-temperature structure
The structure of SF6 at 80 K was examined by plotting layers of molecules, and one such plot is shown in figure 2 which gives one section through the MDS cell. A high proportion of the molecules are oriented close to the cubic axes, and those which deviate by less than 30" from the cube axis perpendicular to the plane of the diagram have been shaded so that it is easier to see the arrangement to the remaining molecules. The sample has clearly rearranged into smaller crystallites, each of which contains a high degree of

Plastic phase of SF6 5975
ordering with channels of disordered molecules surrounded by approximately twice as many ordered (shaded) molecules. The structure observed by Pawley and Thomas (1982a) at 25 K is such that the molecules in the channels are ordered, but it is clear that such an ordering has not taken place at 80 K. This simulated structure is therefore very similar to one of the phases of methane (Baer et a1 1978) in which one-quarter of the molecules are thought to be in free rotation while the remaining three-quarters are ordered. In the present case, two-thirds of the molecules are ordered and one-third undergo hindered rotation. If we replace the latter molecules by spheres to represent their time-averaged symmetry, the crystal structure of this phase is trigonal (space group P3ml) with three molecules in the unit cell. The structure is shown in figure 3, and is in
Figure 3. A unit cell of the rhombohedral phase of SFs at 80 K from the simulation. The circles represent orientationally disordered molecules.
excellent agreement with the electron diffraction results of Raynerd et a1 (1982). The transitions between the three solid-state phases of SF6 involve only small distortions of the shape of the unit cell and has been discussed in more detail elsewhere (Pawley and Dove 1983). Our future plans are to study the two low-temperature phases in more detail by setting up a single crystal MDS sample with 4095 molecules.
3.3. Thermodynamic properties
Various thermodynamic quantities of interest were calculated from the long-time simu- lations of SF6 at 115, 150 and 200 K, and the results are given in table 1. The pressure P was calculated from the virial in the normal manner, including the continuum contri- bution from the distant potential, and the heat capacity at constant volume, C,, was evaluated from the temperature fluctuations following Lebowitz er a1 (1967). The stan- dard deviations given in table 1 indicate the thermal fluctuations associated with these quantities. Dolling eta1 (1979) have measured the mean square displacement (U’) of the SF6 molecule in the plastic crystal at 110 K, obtaining a value of 0.102 A2. This is smaller than the value of 0.154 A2 obtained from the corresponding simulation data.

5976 M T D o v e and G S Pawley
5 9 -
c
58-
5 7 -
Table 1. Equilibrium thermodynamic properties of the plastic crystalline phase of SF6 as determined in the present study for three different temperatures. All quantities are given with their standard deviations.
Quantity Values Unit
Unit cell edge ( a ) Total energy ( E ) Temperature ( T ) Potential energy ( W ) Pressure (P) Heat capacity (CO) Mean square
(F2/mkBT)”’$ displacement ( ( u 2 ) )
(T/IkgT)”$
5.7064 -18.920 115.15 ? 0.64
-21.794 f 0.016 0.024 t 0.027 --i
0.154 t 0.002 4.014 t 0.038 1.791 ? 0.026
5,7637 -16.908 150.46 ? 0.78
-20.663 f 0.019 0.006 t 0.033
37.04 ? 0.33
0.197 t 0.005 4.468 t 0.048 1.996 t 0.023
5.8589 -13.943 200.05 ? 1.10 -18.936 f 0.024
0.032 t 0.039 39.9 2 1.0
0.318 f 0.009 4.968 ? 0.061 2.258 f 0.030
A kJ mol-‘ K kJ mol-’ kbar kJ mol-’ K-’
A2
THz THz
f Insufficient statistics for reliable determination. $ Fis the force acting on the molecule; t i s the torque acting on the molecule; m is the mass of the molecule; I is the moment of inertia of the molecule.
3.4. Structure
The temperature dependence of the unit cell edge a of SF6 as determined by adjusting for zero pressure during the MDS calculations is shown in figure 4. This corresponds to a thermal expansion coefficient of 3 X K-’. Dolling eta1 (1979) have measured the unit cell length for SF6 at 100 K, obtaining a value of 5.78 A. This is slightly larger than the value obtained from the simulation at the corresponding temperature (5.68 A), the discrepancy being due to the fact that the model intermolecular potential was fitted to a structure containing no disorder. Since such a structure will have contained more close F . . F contacts than might be expected in the plastic crystal, the model potential will be softer than the true potential, thereby allowing the simulation sample to be more dense than the true SF6 plastic crystal. The discrepancy between the observed and calculated mean squared displacements discussed above is also consistent with the model potential
5.61 50 100 150 200 250
T IKI Figure 4. Temperature dependence of the unit cell length a as determined in the MDS studies by adjusting for zero pressure.
Plastic phase of SF6 5977
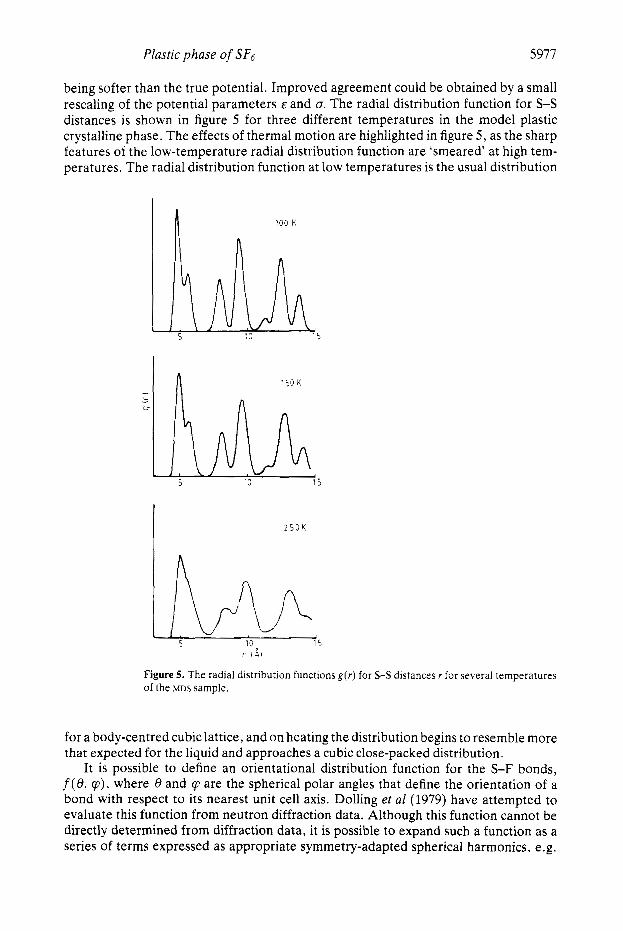
being softer than the true potential. Improved agreement could be obtained by a small rescaling of the potential parameters E and o, The radial distribution function for S-S distances is shown in figure 5 for three different temperatures in the model plastic crystalline phase. The effects of thermal motion are highlighted in figure 5 , as the sharp features of the low-temperature radial distribution function are ‘smeared’ at high tem- peratures. The radial distribution function at low temperatures is the usual distribution
I
2 5 0 K
r iAi
Figure 5. The radial distribution functions g ( r ) for S-S distances r for several temperatures of the ?ADS sample.
for a body-centred cubic lattice, and on heating the distribution begins to resemble more that expected for the liquid and approaches a cubic close-packed distribution.
It is possible to define an orientational distribution function for the S-F bonds, f (e, q), where 8 and Q, are the spherical polar angles that define the orientation of a bond with respect to its nearest unit cell axis. Dolling et a1 (1979) have attempted to evaluate this function from neutron diffraction data. Although this function cannot be directly determined from diffraction data, it is possible to expand such a function as a series of terms expressed as appropriate symmetry-adapted spherical harmonics, e.g.

5978 M T Dove and G S Pawley
the cubic harmonics, establishing the values of the various coefficients of the included terms in the structure least-squares refinement. In a MDS study, however, it is possible to determine f( 8, q) directly. The form of this function for the MDS sample of SF6 at 150 K is shown in figure 6, where the function has been averaged over cp. This function is in good agreement with the form evaluated by Dolling er a1 (1979), with the main lobes of the full three-dimensional function oriented along the directions of the three unit cell axes and having significant non-zero values for all values of 8 and q.
1 0 10 20 30 LO
e ldegl
Figure 6 . The S-F bond orientational distribution function f( 0, q) for the MDS sample at 150 K. The function has been averaged over values of qx
It is of considerable interest to establish the extent of coupling between the transla- tional and rotational motions in the plastic crystal. The static scattering factor S(Q) can be written as
where Q is the scattering vector, N is the number of molecules and r, is the position of the centre of gravity of the mth molecule. /3, contains the information concerning the orientation of the molecule, and is given by
P m = exp(-iQ * Xim) (4) i
where xi, is the position of the ith atom of the mth molecule with respect to r,. All scattering lengths have been arbitrarily taken to be equal to unity. If the translational and rotational motions are decoupled, then it is possible to use the expression
(Pm exp(-iQ * r m ) ) = (Pm)(exp(-iQ * rm))* ( 5 ) This decoupling has been assumed among others by Bounds et aI (1980) in the analysis of data obtained from a MDS study of methane in the plastic crystalline phase. We have attempted to obtain a quantitative estimate of the extent and nature of such couplings in the plastic crystalline phase of SF6 by assessing the validity of equation (5) at the three

Plastic phase of SF6 5979
temperatures of the long simulation runs. The averaged quantities given in equations (3)-(5) were evaluated directly for different values of Q along (hOO) and (hhO). We define two quantities that give a useful guide to the extent of coupling between the rotational and translational modes:
A = (Pexp(-iQ. r ) ) - (P)(exp(-iQ * r ) )
Are' = A/(Pexp(-iQ * r ) ) . (6)
Some of the results of this analysis are given in table 2. It can be seen that the value of Are' is significantly large, reaching values of 25% in some of the cases given in table 2.
Table 2. Results of the evaluation of the effects of coupling between the translational and rotational molecular motions. The parameters are defined in the text (equations (3)-(6)). All figures have been multiplied by 100.
T = 115K T = 150K T = 200 K
Are) ') A Are' ( @ - ' a ') A Are1 Q ( @ - l e 9 A
200 400 600 800 110 220 330 440 550
66.352 167.644
17.186 139.885
58.252 40.171
-27.372
- 136.740
-8.648
0.090 0.491
0.047 -0.313
-0.074 -1.743 -2.843
0.446 -0.144
0.14 0.29 1.14 0.27 0.05 1.27 4.87 1.11 1.66
61.448 145.440
11.888 143.991
42.382 29.071 -5.953
-27.976
-129.772
0.873 3.027
0.067 -2.769
-0.134 -2.790 -3.234
0.883 -0.094
1.42 2.08 9.89 0.56 0.09 2.15 7.62 3.04 1.58
47.714 92.991
-12.854 3.589
147.084 -106.438
19.428 13.945
-2.241
2.459 8.500
-1.469 0.838
-0.304 -5.238 -3.282
2.855 -0.574
5.16 10.22 11.40 23.34 0.21 4.94
16.91 20.58 25.63
For some larger values of Q that are not tabulated here, the scattering factors are small and A is of the same size as the averaged quantities themselves. Thus it can be concluded that there is significant coupling between the rotational and translational motions of the molecules in the plastic crystalline phase of SF6, and that the approximate form of the scattering factor implied by equation ( 5 ) should always be used with caution. Moreover, it can be seen from table 2 that the size of this coupling increases with increasing temperature, implying that this is a dynamic effect. This can be explained from a consideration of the intermolecular potential given below.
3.5. Intermolecular forces
The results presented above can be qualitatively understood by a consideration of the SF6 intermolecular potential energy curves given in figure 1. If two molecules sited on neighbouring corners of the unit cell cube are aligned so that the S-F bonds all lie along the unit cell axes, then the closest F . . F contact (2.625 A) is sufficiently short that there will be a repulsive overlap of the electron clouds. This is seen in figure 1, where curve ( a ) , which represents this particular molecular configuration, shows strong repulsion at this molecular separation. However, the relative orientations corresponding to the nearest neighbour in the crystal (curve (f)) shows the strongest attractions. It thus appears that the plastic crystal behaviour arises from the delicate balance of forces that exists in the crystal as follows: the forces at distances corresponding to the third-nearest

5980 M T Dove and G S Pawley
neighbours in the crystal are effectively isotropic, and together with the nearest-neigh- bour interactions favour a body-centred cubic lattice. However, the forces between the next-nearest neighbours in the orientationally ordered crystal are repulsive, and it is these forces that favour the disordered structure. The high degree of rotational freedom arises because of the near-spherical symmetry of the molecule leading to the effective isotropy of forces at comparatively small intermolecular separations.
The existence of the coupling between the translational and rotational motions can also be qualitatively understood from a consideration of the intermolecular potential. It can be seen from figure 1 that the repulsive force between two closely approaching molecules is strongly dependent upon their relative orientations. Thus, for example, two neighbouring molecules of relative orientation ( a ) as defined in figure 1 are unable to move toward each other from their respective lattice sites without an accompanying change in their relative orientation. In this way, a molecule that is displaced from its lattice site will experience a strong reorientating torque. Because the amplitudes of such displacements increase with increasing temperature, this coupling between the linear displacements and reorientations of the SF6 molecules will also increase with tempera- ture, as demonstrated by the results given in table 2.
3.6. Crystal dynamics
As a first examination of the dynamic properties of the plastic crystalline phase of SF6 at 150 K in our MDS studies we have calculated the single-molecule velocity autocorre- lation functions for the translational, Z(r) , and rotational, C ( t ) , motions:
where u ( r ) and w( t ) are respectively the linear and angular velocities of the mth molecule at time t . These two functions, together with their associated power spectra Z( f ) and C(f) as simply obtained by Fourier transformation are shown in figure 7. The power spectra are directly related to the one-phonon density of states corresponding to the particular motion. An examination of the angular velocity autocorrelation function is able to point to certain features of the rotational and reorientational motions of the SF6 molecules. The non-zero value of C(f = 0) is due to the existence of rotational diffusion of the molecules in the plastic crystal, and yields an estimate of the reorientational correlation time of 0.1135 ps. By contrast, the fact that Z(f = 0) is equal to zero shows that the translational diffusion of SF6 molecules is negligible on the time scale of the MDS, as expected. The fact that C ( t ) falls to negative values implies that the rotational motion is hindered, in the same way that the corresponding feature in the linear Z ( t ) follows from the fact that the translational motion in the solid consists primarily of vibrations about a lattice site similar to the ‘cage effect’ observed in liquids (Hansen and MacDonald 1976). The feature is also observedin the MDS studies of the plastic crystalline phase of carbon tetrachloride (MacDonald et a1 1982), but not in the similar study of methane (Bounds er a1 1980) in which the motion more resembles free rotation of the molecules. The broad peak observed in the power spectra C(f) for SF6 and CC14 are further evidence of hindered rotation; in contrast the same function for methane falls monotonically to zero with increasing frequency thus showing no well defined librational frequencies.

Plastic phase of SF6 5981
O - G- 0 1 2 3 4
t (psi
1 0 1 2 3 L
t ips1
Figure 7. The linear and angular velocity autocorrelation functions Z( t ) and C ( t ) (equation ( 7 ) ) and their associated Fourier transforms (power spectra).
f I T H z I Figure 8. Approximate form of the dynamic scattering factor S(Q,f) for Q = (2/13,0,0)a* allowing for transverse modes only.

5982 M T Dove and G S Pawley
In addition to the single-molecule dynamics, it is possible to use MDS methods to study the collective modes of the plastic crystalline state. We have undertaken some preliminary calculations aimed at obtaining the frequencies of acoustic phonons by using an approximate form of the dynamic scattering factor S ( Q , f ) (Bounds e t d 1980). Figure 8 shows this function for one acoustic phonon mode. One of the obvious disadvantages of using a parallelepipedal shape for the repeating MDS sample is that there will be no allowed wavevectors that will correspond to rational fractions of reciprocal lattice vectors. However, this restriction is not as serious as it seems at first sight since with 2048 independent allowed wavevectors there will in fact be some that do lie close enough to symmetry directions in reciprocal space that the differences will not matter in practice. From the results of the MDS study of SF6 at 150 K, the velocities of sound for acoustic phonons propagating in the 100 direction (along which the two transverse modes are degenerate) have been determined as 750 m s-l (longitudinal) and 375 m s-l (trans- verse). More detailed calculations of the dispersion of these modes will be presented elsewhere.
4. Conclusions
We have presented here the results of a detailed MDS study of a system that models the plastic crystalline phase of SF6. The simulation has reproduced many of the thermodyn- amic, static and dynamic features expected for a plastic crystal, and it has been possible to relate some of these to the nature of the balance of forces that exists in the crystal. Comparisons have been made between the results obtained in the present study and those obtainedfromMDs studiesof the plastic crystalline phasesof tetrahedralmolecules. In the latter case the plastic crystal behaviour can be seen to arise from the fact that the equilibrium structures of these systems correspond to molecules occupying lattice sites of higher symmetry than the molecular symmetry. However, in the case of SF6, where the' molecule and site symmetries are identical, the existence of the plastic crystalline phase is related to the fact that the molecules are nearly spherical but that there are strong local repulsions between molecules that are oriented with the crystal lattice. The existence of coupling between the translational and rotational molecular motions is demonstrated and is shown to arise from the same strong local repulsions.
The scope of the present study has been restricted to an investigation of the gross structure of the plastic crystal and of the dynamics of single molecules. Of more interest is the nature of correlations between the motions of neighbouring molecules resulting in cooperative excitation which cannot be phonon-like. Pawley (1981) has performed some preliminary MDS calculations rhat have indicated some simple features of the cooperative motion that might be expected to characterise the plastic crystalline state for molecules such as SF6. The basic groundwork essential for such studies has now been completed, and further MDS studies of SF6 aimed at elucidating this cooperative behav- iour are now in progress.
Finally, this study has demonstrated the potential application of massively parallel computers such as the DAP to MDS studies. The differences in the simulation algorithms that arise through the different architectures of array processors and serial computers have been discussed. With such true array processors it is now possible to perform MDS studies of polyatomic molecules in the solid state using samples that are an order of magnitude larger than previously possible. Such samples are expected to be large enough that finite-size restrictions have a negligible artefact effect.

Plastic phase of SF6 5983
Acknowledgments
We wish to thank the SERC for financial support. We are also grateful to the staff of the computer centres of Queen Mary College and Edinburgh University where these cal- culations were performed.
References
Baer D R, Fraas B A, Riehl D H and Simmons R 0 1978 J . Chem. Phys. 68 2597 Beeman D 1976 J . Comput. Phys. 20 130 Bounds D G, Klein M L and Patey G N 1980 J . Chem. Phys. 72 5348 Dolling G, Powell B M and Sears V F 1979 Mol. Phys. 37 1859 Evans D J 1977 Mol. Phys. 34 317 Hansen J-L and MacDonald I R 1976 Theory ofSimple Liquids (London: Academic Press) Huller A 1980 Dbcccss. Faraday Soc. 69 66 Lebowitz J L, Percus J K and Verlet L 1967 Phys. Reu. 153 250 MacDonald I R , Bounds D G and Klein M L 1982 Mol. Phys. 45 521 Michel J, Drifford M and Rigny P 1970 J . Chim. Phys. 67 31 Pawley G S 1981 Mol. Phys. 43 1321 Pawley G S and Dove M T 1983 Chem. Phys. Lett. 99 45 Pawley G S and Thomas G W 1982a Phys. Rev. Lett. 48 410 - Raynerd G, Tatlock G J and Venables J A 1982Acta Crystallogr. B38 1896 Schneider T and Stoll E 1978 Phys. Reu. B 13 1216 Sherwood J N (ed.) 1979 The Plastically Crystalline State (Chichester: Wiley) Stewart J W 1962 J . Chem. Phys. 36 400
1982b J . Comput. Phys. 47 165