a model linking store attributes, service quality and ...7)-vol_10(2)_chan... · customer...
TRANSCRIPT
Int. Journal of Economics and Management 10(2): 321 – 342 (2016)
IJEMInternational Journal of Economics and Management
Journal homepage: http://www.econ.upm.edu.my/ijem
321
CHAN, SUZ JACKa,b AND TAN, CHENG LINGa*
aGraduate School of Business, Universiti Sains Malaysia, Malaysia bB.Braun Medical Industries Sdn Bhd, Malaysia
ABSTRACT
Community pharmacies are one of the few healthcare premises in Malaysia that provide service and products concurrently. It is of essential importance to research into the factors that could enhance customer experience during their shopping trip. Based on this premise, a model linking service quality and store attributes and customer experience is tested. Data were collected from a survey of 194 customers from community pharmacies in Malaysia. Analysis using partial least square method revealed security and reliability and store attributes have direct effects on the specific dimensions of customer emotional experiences. This implies store attributes and reliability of community pharmacies are a significant predictor of customer emotional experience among community pharmacies customers.
JEL Classification: C21, M10, M31
Keywords: Community Pharmacies, Customer Emotional Experience, Service quality, Store Attributes.
A Model Linking Store Attributes, Service Quality and Customer Experience: A Study Among Community Pharmacies
Article history:Received: 05 March 2016Accepted: 31 October 2016
*Corresponding author: Email : [email protected]
INTRODUCTION
Retail is one of the fastest-growing sectors of Malaysia’s economy, significantly contributing through the provision of job opportunities, foreign direct investment, and acting as the link between other sectors of the economy (Mokhlis, 2014). In 2009, this industry contributed RM57 billion to the gross national income (GNI) and created an estimated 500,000 jobs in the country (ETP, 2015). World Bank report dated in 2013 showed Malaysia’s GNI stands at 669.5
billion PPP (purchasing power parity) dollars. Also, the retail sector contributed more than 60% of gross national product (GDP) through domestic consumption.
Int. Journal of Economics and Management 10(2): 321 – 342 (2016)
322
The pharmaceutical industry is a vital component of the whole retail industry where its contribution is significant for Malaysia’s financial health. Pacific Bridge Medical, a consulting firm with expertise in the Asian medical market, reported that Malaysia’s pharmaceutical market is worth USD 3.2 billion and is currently growing at a rapid pace of 11 percent per annum. Also, the private over-the-counter (OTC) market is estimated to be worth over RM 68 million, where its main contribution is from retail healthcare outlets such as Chinese medical halls, pharmacies, and convenience stores. MOPI, a Malaysian pharmaceutical organization, forecasted that the market worth of traditional medicines, health supplements, and health food is around RM 3 billion (MOPI, 2011).
In Malaysia, a person or a business organization is allowed to own one or more pharmacy stores with the legal requirement of having one or more registered pharmacists attached to the particular outlet. In other words, a community pharmacy in Malaysia does not exclusively belong to a pharmacist; rather any person can own a pharmacy similarly to any normal retail outlet business. It is different from Spain or Australia, whereby only the pharmacist can be the owner. This legislation opened up the opportunities for the nonpharmacist to invest in the community business, which is evident from the increasing number of pharmacies nationwide in these past few years. As more pharmacy stores enter the market, the more competitive the market will be for the community retailers.
The progressive changes in Malaysia’s community pharmacy landscape started with an exponential increase of standalone pharmacies followed by the expansion of chain stores such as the Guardian and Georgetown pharmacies. Subsequently, standalone pharmacies grew and expanded to become local chain outlets in the late 1990s. Finally, pharmacy chain stores consolidate, continued with the growth of Guardian Pharmacy and emergence of regional pharmacy chains (Kareem & Farid, 2013). During this period, an influx of large foreign-based pharmacy retailers invested in this industry, including Guardian Pharmacy, one of the biggest community chain pharmacy owned by Hong Kong Dairy Farm Group and Watsons Pharmacy, a subsidiary of Watsons Group, a Hong Kong-based company. Major retailers with different specialties, too, have shown interest to invest in the healthcare industry. Aeon Wellness, a healthcare subsidiary of Aeon Corporation, which is Asia’s largest retailer based in Japan, expanded its products and service offerings through pharmacy-supermarket concept. Berjaya Group, one of Malaysia’s largest conglomerates with diversified interest in various business sectors such as hotels, food and beverages, and education, expanded its business model to healthcare through the introduction of a chain of community pharmacies as COSWAY Pharmacy. In 2009, retail sales and other providers of medical goods made up 7 percent of total health expenditures in Malaysia, accounting for almost RM 2.4 billion, according to the World Health Organization. Total health expenditures contribute to 4.0 percent of Malaysia’s GDP.
A community pharmacy is a service and product provider in which its success as a service provider is dependent on the quality of the relationship with its customers (Panda, 2002). A healthy and high-quality relationship with its clients increases satisfaction, thus creating a continuous, uninterrupted care flow (Schommer & Kucukarslan, 1997) and develops a strong positive relationship between the customers (Crosby, Evans, & Cowles, 1990). As Cameran, Moizer, and Pettinicchio, (2010) revealed that integration of service quality is the main
Int. Journal of Economics and Management 10(2): 321 – 342 (2016)
323
differentiation agenda to outcompete a business rival. Service quality has been carried out in Malaysia and mainly focused on banks (Kheng, Mahamad, Ramayah, & Mosahab, 2010), grocery stores (Ahmad, Ihtiyar, & Omar, 2014), apparel specialty stores (Leen, Ramayah, & Ma’ruf, 2004), tourism (Khairunnisak & Ng, 2015), and hotels (Mey, Akbar, & Fie, 2006). However, it has not been adequately addressed in the healthcare industries and, therefore, lags comparatively with others (Borkowski & Gordon, 2006).
Store attributes fundamentally shape the image of a store and assist in precise marketing strategy formulation (Erdem, Oumlil, & Tuncalp, 1999), and store attributes differ according to the type of store format evaluated. As a community pharmacy is a unique blend of being a healthcare provider and as a retailer, it is relevant to investigate the influences of store attributes in a community pharmacy, as this industry has not been much focused on retail marketing research (Wongsuphasawat, Kittisopee, & Powpaka, 2010).
A community pharmacy exhibits a dual role as a retail business and health care provider, thus making it a challenge to provide the customer with a positive experience on top of the primary functional activities (Gavilan, Avello, & Abril, 2014). Besides, shopping trips to a community pharmacy have yet to be perceived as an enjoyable experience for customers (Nilsson & Ek, 2012). There is limited literature on the research of attributes that can enhance customers’ shopping experience in a community pharmacy. Therefore, the aim of the present study was to examine the effects of the store attributes and the service quality of the customer experience with the community pharmacy stores in Malaysia. The research question was formulated as “Does service quality influence customer experience and does store attributes influences customer experience?”
This study is expected to provide practical evidence to researchers in the research area of service quality and store attributes in the community pharmacy industry literature where the findings of this study will assist community pharmacy owners to develop strategies to achieve competitive advantage to maximize their profit margin and sustain their business. This study aims to assist pharmacy owners to direct their focus on marketing efforts to increase consumer patronage and profitability through differentiation and understanding of the market segment needs that influences a consumer’s decision to selectively patron certain pharmacies. Also, a community pharmacy is able to identify offerings that are valued or not valued by its respective customers.
In general, this paper is presented in five sections. The introduction highlights the background of the study of interest, research problems, research questions, and the significance of the study. This is followed by the reviews of literature involving independent and dependent variables. The developed theoretical framework and formulated hypotheses were discussed accordingly. Next, the methodology used for this research includes details of population and sample, questionnaire design, measurements, data collection techniques, and statistical analysis techniques followed by a discussion of the statistical analysis results. Last, findings observed and their implication were discussed accordingly.

Int. Journal of Economics and Management 10(2): 321 – 342 (2016)
324
REVIEW OF LITERATURE
Customer Experience
Customer experience is a new battleground for organizations (Badgett, Boyce, & Kleinberger, 2007) and is currently being utilized as a business strategy to gain a competitive advantage over others (Johnston & Kong, 2011). Since the emergence of customer experience, many service industries have shifted their attention from service-based to the experience-based economy (Kim, Cha, Knutson, & Beck, 2011). Emotion experience has been central to the understanding of consumer behavior in service environments, especially in the retail industry (Watson & Spence, 2007). In recent studies, researchers posited the necessity to shift the focus on an emotional aspect of a customer rather than a cognition function (Lin & Bennett, 2014), thus necessitating a need to implement strategic objectives for such firms (Klaus & Maklan, 2013).
The role of emotions has been noted as a distinguishing feature of the customer experience. It is a stimulus that has a positive affective outcome for one consumer that may have an adverse result for another consumer with a different emotional disposition (Oliver, 2014) or become highly involving for some or low involving toward the same product or service (Palmer, 2010). Söderlund and Rosengren (2007) suggested that a consumer’s emotional experience has a tremendous impact on an organization’s business, as emotions are socially contagious where one person is easily attracted to the emotions displayed by someone else with whom they interact. As evidence in a study by Balakrishnan (2011), the way a consumer makes an economic decision is based on 70 percent emotions and 30 percent rationale. As such, emotional experience goes beyond physical attributes such as quality and quantity (Leventhal et al., 2006).
Store Attributes
Store attributes were defined as an impression of a store’s physical, functional, and cognitive traits in a consumer’s mind (Martineau, 1958). Effort and time were invested in determining which attributes tha customer prioritizes during store choice (Reutterer & Teller, 2009) and brings customer satisfaction (Nilsson, Gärling, & Marell, 2013). Store attributes were first categorised into nine dimensions: merchandising, service, clientele, physical facilities, convenience, promotion, store atmosphere, institutional factors and past transactions (Lindquis, 1974). Studies on pharmacy store attributes exhibit mixed results. Horsfield, Kelly, Clark, and Sheridan (2014) found that young people ranked accessibility via public transport, availability of consultation area, and the presence of female staff as being among the highest priority, which could affect young peoples’ use of community pharmacies. Kareem and Farid (2013) concluded that none of the physical attributes investigated were significant to influence the behaviour of consumer patronage. Franic, Haddock, Tucker, and Wooten (2007) even found the effect of store attributes varies from the type of pharmacy retail format investigated. Mixed study results indicated response variation, underlying the importance of store attributes identification that will enhance the business performance.
Scholars typically use a total of seven dimensions as certain pharmacy store attributes, including store convenience, service quality, store atmosphere, product attribute, personnel

Int. Journal of Economics and Management 10(2): 321 – 342 (2016)
325
competence, store facilities, and information management. Among these seven dimensions, the researchers would like to focus on store convenience (Kareem & Farid, 2013; Horsfield et al., 2014; Gavilan et al., 2014) and store atmosphere (Kareem & Farid, 2013; Gavilan et al., 2014).
Store Convenience
Pan and Zinkhan (2006) described store convenience as one of the key features that consumer seeks in the modern environment, as it is an important consideration for consumers while selecting store choice (Eastlick & Feinberg, 1999). Store location, distance traveled, and parking facilities are known to be major contributors in the determination of a consumer’s selection of store choice (Sinha & Banerjee, 2004). Consumers weigh the trade-offs between inconvenience and store attraction when they decide to patronize a store (Darley & Lim, 1999); therefore the ease of store accessibility influences customer retention (East, Hammond, Harris, & Lomax, 2000), store preference (Tripathi, 2009), attracts customers (Bellenger, Robertson, & Greenberg, 1977), improves store loyalty (McGoldrick & Andre, 1997), and positively influence customer satisfaction (Berry, Seiders, & Grewal, 2002).
Spies, Hesse, and Loesch (1997) refer to in-store convenience as the store’s layout and design. Consumers appreciate and value retailers that make an effort to make the layout presentable and convenient for them to shop and to move around (Vazquez, Rodrıguez, Dıaz, & Ruiz, 2001). Thang and Tan (2003) found that stores that incorporate attributes of convenience in their operations are highly regarded, as it helps to save a consumer’s time. This agrees well with consumers who are inclines to maximize visits to their preferred store and are less enticed to change store selection due to the risk of disutility, which is link with travel, unavailability of products, and parking inconvenience.
Store Atmosphere
Kotler (1973) suggested that store atmosphere is represented by environmental cues in a retail store. Baker, Levy, and Grewal (1992) categorized the elements of store environment into social factors, design factors, and ambient factors where social factors are related to the presence of others in stores (Baker, Grewal, & Parasuraman, 1994). Store physical traits can create an image of the store in the mind of the consumer (Wang & Ha, 2011), and a well-structured and planned element creates a favorable environment, which can act as a communication medium between retailers and consumers (Seock & Bailey, 2009). A positive and pleasing atmosphere provides comfort and gratification, leading to a consumer’s sense of well-being (Thang & Tan, 2003). Negative emotions can have an impact on store image, which, in turn, jeopardizes a store’s performance. Retailers have to make the effort to control the equity of the store so as to be able to manage the profitability and sustainability of their stores (Das, Hayes, & Taylor, 2015).
Service Quality
Traditional service quality refers to the quality of all non-Internet-based customer interactions and experiences with companies (Parasuraman, Zeithaml, & Malhotra, 2005). Service quality is recognized as a critical success factor in a firm’s endeavours to differentiate itself from its
Int. Journal of Economics and Management 10(2): 321 – 342 (2016)
326
competitors (Ladhari, 2009). Dadfar and Bregre (2012) defined service quality as an overall judgment of a service provider and the outcome of the comparison between customers’ perception and expectations. Broadly stated, service quality is the gap or discrepancy between the customers’ expectation and perception. The measurement of a service, however, is complex due to the intangible nature of service and the higher consumer involvement requirement (Gronoos, 1982).
The SERVQUAL instrument and its variations have been used for measuring service quality in many proprietary and published studies (Parasuraman et al., 2005). Much of the research effort regarding service quality has been devoted to the development of reliable and replicable instruments for measuring the construct (Ladhari, 2009). Measurement of service quality in a community pharmacy is commonly based on SERVQUAL scale (Adat & Noel, 2014; Adoyo et al., 2012; Dadfar & Brege, 2012; White & Klinner, 2012), though SERVPEF had been used for service quality assessment (Chen & Fu, 2015). Dadfar and Brege (2012) argued that SERVQUAL is more appropriate for use in measuring service quality in a community pharmacy, as the model has been widely used in different service-based organizations, healthcare sectors, and cultures. The application of SERVQUAL has been widely utilized in the healthcare industry such as in th private healthcare sector (Butt & Cyril, 2010), hospitals (Dasanayaka, Gunasekera & Sardana, 2014), and healthcare organizations (Amjeriya & Malviya, 2012).
Jain and Gupta (2004) compared and commented that SERVQUAL is superior to SERVPERF in diagnosing service quality shortfalls. This allows business owners to identify and intervene in the event of service quality shortfall, while SERVPERF is more suited to undertake service quality comparisons across service industries. One of the objectives of this study is to be able to identify gaps, shortfalls, and discrepancies between community pharmacy customer’s expectations and perceptions. Once identified, efforts are made to close such gaps to improve business performance. Therefore, an SERVQUAL-based measurement scale is selected and adopted in this study.
Early literature showed that physical environment and surrounding of a store will trigger an emotional reaction (Robert & John, 1982). In subsequent studies, it was found that particular store attributes can engage a consumer’s emotions (Babin & Darden, 1996), including arousal and pleasure (Sherman, Mathur, & Smith, 1997), both of which are expected to be influenced by store attributes. Positive emotions triggered by a set of store attributes encourage customers to stay longer and interact with other employees, further enhancing the buying experience and customer satisfaction (Babin & Darden, 1996). These findings leads to our first hypothesis:
H1: Store Attributes will positively influence Customer Experience
H1a: Store Convenience will positively influence Customer Experience
H1b: Store Atmosphere will positively influence Customer Experience
Sandström et al. (2008) linked service quality to the customer, as the value in use is the evaluation of the service experience, meaning the individual judgment of the total of all the functional and emotional experience outcomes. Sanders and Stappers (2008) added that an

Int. Journal of Economics and Management 10(2): 321 – 342 (2016)
327
organization must be able to manage and handle the emotional dimension of experience with the same rigor that was brought to the management of service functionality. During rendering of service, customers could elicit various emotional types, and these emotions convey an important message on how the customers will ultimately assess the service encounter and, subsequently, overall relationship quality (Wong, 2004). Also, a deeper understanding of negative and positive customer emotions helps one to better understand customer perceived service quality. Hence, the better the basis for managing service quality.
Roos and Friman (2008) identified negative emotion such as annoyance, anxiety, disappointment, distress, and tension as emotions that considerably shape customers’ service-switching processes. Zeelenberg and Pieters (2004) stated that service encounters can be a source of negative emotions, contributed during the delivery of a service that does not match previously held expectations. And, even when expectations are met when customers realize that the obtained delivery of service could have been better had they gone for an alternative service or service provider. Given the discussion above, we posit the following hypothesis:
H2: Service quality will positively influence Customer Experience.
H2a: Information will positively influence Customer Experience
H2b: Security and reliability will positively influence Customer Experience
H2c: Empathy will positively influence Customer Experience
H2d: Appearance will positively influence Customer Experience
H2e: Time Commitment will positively influence Customer Experience
RESEARCH METHODOLOGY
Sample and Data Collection
The respondents of this study were customers of community pharmacies in Peninsular Malaysia. The number of samples needed for this study was calculated using stratified random sampling based on the distribution of community pharmacy outlet located in Peninsular Malaysia. Questionnaires packets were delivered or mailed to the owner, store manager, or pharmacist. Each packet contained two sets of questionnaires, which were to be distributed by them in order to randomly select two customers who visited the pharmacy. Two months were given, after which the manager had to mail the questionnaires back in a return sealed envelope. A total of 204 questionnaires were collected within a period of two months. During the screening of response, only 194 questionnaires were usable and subsequently analyzed.
Measures and Analysis
Our independent variables, relating to five service quality dimensions (information, security and reliability, empathy, appearance and time commitment) and comprising 20 items, were adapted

Int. Journal of Economics and Management 10(2): 321 – 342 (2016)
328
from Dadfar and Brege (2012). Meanwhile, two store attribute dimensions (store atmosphere and store convenience) were measured using eight items procured from Wong, Osman, Jamaluddin, and Yin (2012) and Thang and Tan (2003). Dependent variables of customer experience comprising 10 items were adopted from Naina and Borhan (2014). The measurement items for all variables of this study are listed in Table 1. Respondents responded to the items using a 5-point Likert-type scale with “1” = “strongly disagree” to “5” = “strongly agree”. Our hypotheses were tested with partial least-squares (PLS) software developed by Ringle, Winde, and Will (2005). We employed PLS-SEM, a second-generation technique in favor of a covariance-based approach, as PLS-SEM accounts for the prediction objectives, which were excluded in the application of CB-SEM. (Hair, Ringle, & Sarstedt, 2011). The application of Smart PLS is suited, as SEM methods are capable of measuring latent variables evaluation and testing of relationships between latent variables (Babin, Hair, & Boles, 2008), and handle problems occurred in social science modeling issues such as formative measurement constructs, small sample sizes, and non-normal data (Hair, Sarstedt, Hopkins, & Kuppelwieser, 2014). For reflective outer models, Hair et al. (2011) suggest that measurement includes indicator reliability, internal consistency, convergent validity, and discriminant validity.
Table 1 Source and number of measurement items pertaining Service Quality (SQ), Store Attributes (SA), and Customer Experience (CEXP.
Variables No. of items Source of measurementService Quality
Adopted from Dadfar and Brege (2012)
Information 3Security and Reliability 6Empathy 4Appearance 4Time commitment 3
Store AttributesStore Convenience 4 Adopted from Wong et al., (2012)Store Atmosphere 4 Adopted from Thang and Tan (2003)
Customer Experience 10 Adopted from Naina and Borhan (2014)

Int. Journal of Economics and Management 10(2): 321 – 342 (2016)
329
RESULTS
Sample Profile
An overview of customer respondents is shown in Table 2.
Table 2 Profile and Descriptive Statistics of Customer RespondentsVariable Frequency Percentage (%)
GenderMale 88 45.4Female 106 54.6Age16 – 25 31 16.026 – 35 43 22.236 – 45 56 28.946 – 55 31 16.056 – 65 24 12.3More than 65 9 4.6OccupationStudent 19 9.8Government 25 12.9Self Employed / Own Business 41 21.1Private Sector 74 38.1Retired 1 0.5Pensioner 25 12.9Unemployed 9 4.7Education LevelNo Formal Education 2 1.0Primary 5 2.6Secondary 70 36.1College or University 103 53.1Postgraduate 14 7.2
Measurement Model Results
We used the factor loadings, composite reliability (CR), and average variance extracted (AVE) to assess convergence validity. Convergent validity examines if a particular item measures a latent variable (Urbach & Ahlemann, 2010). Hair et al. (2011) suggested that the value indicator of absolute standardized loading (outer loading) should be higher than 0.70. Indicators with loadings between 0.40 and 0.70 can be retained and should only be scrutinized and examined for removal of the scale if the deletion of indicators with these values can lead to an increase of composite reliability value above the minimum threshold of 0.70. One item of information

Int. Journal of Economics and Management 10(2): 321 – 342 (2016)
330
(INFO1) was dropped due to poor factor loading (<0.50). Average variance extracted (AVE) is defined as the grand mean value of the square loadings of the indicators associated with the construct and is a standard tool used to establish convergent validity on the construct level. According to Hair et al. (2013), the value of the AVE for each variable should exceed 0.50. The AVE ranged from 0.569 to 0.773. Composite reliability is applied to evaluate the constructs measures’ internal consistency reliability, as suggested by Hair et al. (2014). The often cited classic reliability standard of 0.70 or greater indicates a satisfactory composite reliability, although acceptable reliabilities below 0.70 may be obtained when an overall causal or CFA model fits satisfactorily (Bagozzi & Yi, 2012). The composite reliability values in this study ranged from 0.870 to 0.953, as shown in Table 3. Thus, it can be concluded that the measurement model is reliable and demonstrates adequate convergent validity.
Table 3 Items loadings, composite reliability and the average variance extracted for the measurement model.
Construct Items Loadings AVE CRInformation INFO2 0.860 0.773 0.872
INFO3 0.898Security & Reliability SECUR2 0.792 0.657 0.905
SECUR3 0.843SECUR4 0.831SECUR5 0.784SECUR6 0.800
Empathy EMPA1 0.850 0.769 0.930EMPA2 0.894EMPA3 0.891EMPA4 0.872
Appearance APPE1 0.723 0.573 0.840APPE2 0.848APPE3 0.843APPE4 0.583
Time Commitment TICOM1 0.864 0.692 0.870TICOM2 0.727TICOM3 0.896
Store Convenience SCON1 0.670 0.569 0.840SCON2 0.816SCON3 0.788SCON4 0.734
Store Atmosphere SATM1 0.836 0.608 0.861SATM2 0.761SATM3 0.796SATM4 0.722

Int. Journal of Economics and Management 10(2): 321 – 342 (2016)
331
Customer Experience CEXP1 0.872 0.669 0.953CEXP2 0.776CEXP3 0.839CEXP4 0.811CEXP5 0.789CEXP6 0.771CEXP7 0.859CEXP8 0.819CEXP9 0.819CEXP10 0.819
Note: INFO = information, SECUR = security and reliability, EMPA = empathy, APPE = appearance, TICOM = time commitment, SCON = store convenience, SATM = store atmosphere and CEXP = customer experience
Next, the measurement model is tested on its discriminant validity. There were two criteria to check for discriminant validity: the Fornell–Larcker and cross-loadings (Hair et al., 2012). The acceptable recommendation for the Fornell–Larcker criterion is that each construct’s AVE should be higher than its squared correlation with any other construct. One item of security and reliability (SECUR1) was dropped to fulfil the criterion of Fornel–Larcker. Table 4 shows that the square root of the AVE of the latent variable exceeded the correlations of other constructs.
Table 4 Discriminant validity of constructsAPPE CEXP EMPA INFO SATM SCON SECUR TICOM
APPE 0.757CEXP 0.519 0.818EMPA 0.482 0.577 0.877INFO 0.444 0.592 0.744 0.879SATM 0.723 0.629 0.471 0.485 0.780 SCON 0.410 0.524 0.461 0.421 0.444 0.754SATM 0.594 0.732 0.802 0.808 0.618 0.421 0.810
TICOM 0.579 0.544 0.748 0.742 0.572 0.533 0.694 0.832 Diagonals (bold) represent the square root of the average variance extracted while the other entries represent the correlations.
Note: INFO = information, SECUR = security and reliability, EMPA = empathy, APPE = appearance, TICOM = time commitment, SCON = store convenience, SATM = store atmosphere and CEXP = customer experience
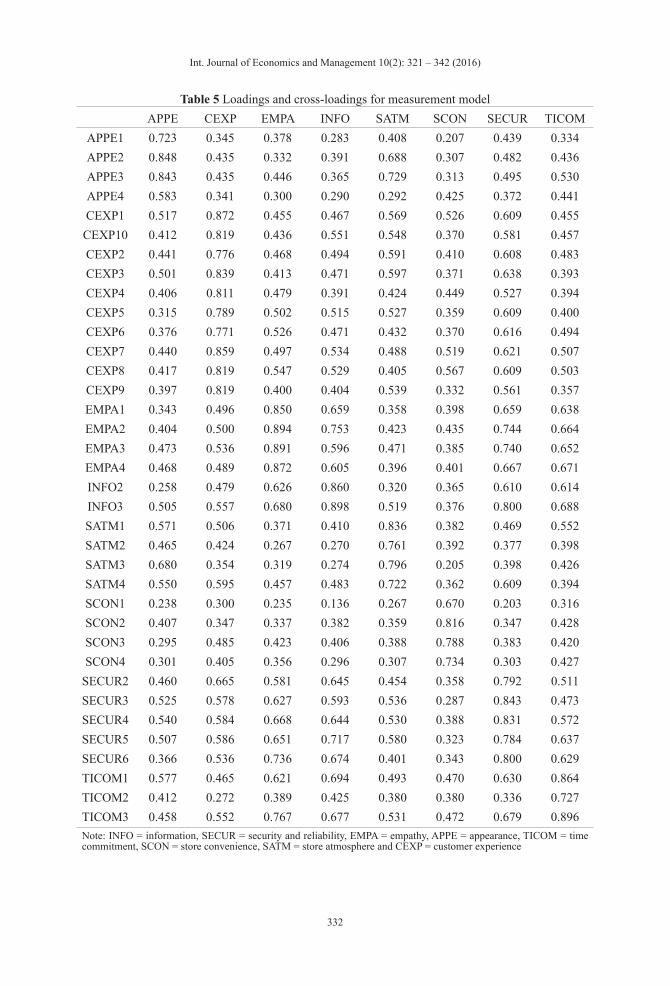
For cross-loadings, each indicator should load largest on the construct it is intended to measure. Table 5 presents the cross loading for each item. According to Vinzi et al. (2010), each measure should be strongly related to the construct it attempts to reflect, but it should not have a stronger connection with another construct. In sum, the measurement model demonstrated adequate discriminant validity.
Table 3 (Cont.)
Int. Journal of Economics and Management 10(2): 321 – 342 (2016)
332
Table 5 Loadings and cross-loadings for measurement modelAPPE CEXP EMPA INFO SATM SCON SECUR TICOM
APPE1 0.723 0.345 0.378 0.283 0.408 0.207 0.439 0.334APPE2 0.848 0.435 0.332 0.391 0.688 0.307 0.482 0.436APPE3 0.843 0.435 0.446 0.365 0.729 0.313 0.495 0.530APPE4 0.583 0.341 0.300 0.290 0.292 0.425 0.372 0.441CEXP1 0.517 0.872 0.455 0.467 0.569 0.526 0.609 0.455CEXP10 0.412 0.819 0.436 0.551 0.548 0.370 0.581 0.457CEXP2 0.441 0.776 0.468 0.494 0.591 0.410 0.608 0.483CEXP3 0.501 0.839 0.413 0.471 0.597 0.371 0.638 0.393CEXP4 0.406 0.811 0.479 0.391 0.424 0.449 0.527 0.394CEXP5 0.315 0.789 0.502 0.515 0.527 0.359 0.609 0.400CEXP6 0.376 0.771 0.526 0.471 0.432 0.370 0.616 0.494CEXP7 0.440 0.859 0.497 0.534 0.488 0.519 0.621 0.507CEXP8 0.417 0.819 0.547 0.529 0.405 0.567 0.609 0.503CEXP9 0.397 0.819 0.400 0.404 0.539 0.332 0.561 0.357EMPA1 0.343 0.496 0.850 0.659 0.358 0.398 0.659 0.638EMPA2 0.404 0.500 0.894 0.753 0.423 0.435 0.744 0.664EMPA3 0.473 0.536 0.891 0.596 0.471 0.385 0.740 0.652EMPA4 0.468 0.489 0.872 0.605 0.396 0.401 0.667 0.671INFO2 0.258 0.479 0.626 0.860 0.320 0.365 0.610 0.614INFO3 0.505 0.557 0.680 0.898 0.519 0.376 0.800 0.688SATM1 0.571 0.506 0.371 0.410 0.836 0.382 0.469 0.552SATM2 0.465 0.424 0.267 0.270 0.761 0.392 0.377 0.398SATM3 0.680 0.354 0.319 0.274 0.796 0.205 0.398 0.426SATM4 0.550 0.595 0.457 0.483 0.722 0.362 0.609 0.394SCON1 0.238 0.300 0.235 0.136 0.267 0.670 0.203 0.316SCON2 0.407 0.347 0.337 0.382 0.359 0.816 0.347 0.428SCON3 0.295 0.485 0.423 0.406 0.388 0.788 0.383 0.420SCON4 0.301 0.405 0.356 0.296 0.307 0.734 0.303 0.427
SECUR2 0.460 0.665 0.581 0.645 0.454 0.358 0.792 0.511SECUR3 0.525 0.578 0.627 0.593 0.536 0.287 0.843 0.473SECUR4 0.540 0.584 0.668 0.644 0.530 0.388 0.831 0.572SECUR5 0.507 0.586 0.651 0.717 0.580 0.323 0.784 0.637SECUR6 0.366 0.536 0.736 0.674 0.401 0.343 0.800 0.629TICOM1 0.577 0.465 0.621 0.694 0.493 0.470 0.630 0.864TICOM2 0.412 0.272 0.389 0.425 0.380 0.380 0.336 0.727TICOM3 0.458 0.552 0.767 0.677 0.531 0.472 0.679 0.896Note: INFO = information, SECUR = security and reliability, EMPA = empathy, APPE = appearance, TICOM = time commitment, SCON = store convenience, SATM = store atmosphere and CEXP = customer experience

Int. Journal of Economics and Management 10(2): 321 – 342 (2016)
333
Structural Model Results
We proceed to test our hypotheses using path analysis. The R2 value of CEXP was 0.628, suggesting that 62.8% of the variance in CEXP can be explained by service quality and store attributes. Figure 1 illustrates the research model conceptualized in this study.
Figure 1 Measurement Model Framework
Next, we run the bootstrapping procedure with 5000 re-samples to test the significance of the regression coefficients. The results showed that security and reliability (β = 0.597, p < 0.01), store atmosphere (β = 0.258, p < 0.01), and store convenience (β = 0.247, p < 0.01) were positively related to CEXP. Therefore, hypotheses H1a, H1b, and H2b were supported; while the rest were not supported (Table 6).
Table 6 Hypothesis testingHypothesis Relationship Beta Standard error t value Decision
H1a SCON→CEXP 0.247 0.066 3.753** SupportedH1b SATM→CEXP 0.258 0.064 4.056** SupportedH2a INFO→CEXP 0.005 0.089 0.050 Not supportedH2b SECUR→CEXP 0.597 0.120 4.990** SupportedH2c EMPA→CEXP -0.054 0.092 0.591 Not supportedH2d APPE→CEXP -0.052 0.067 0.771 Not supportedH2e TICOM→CEXP -0.082 0.079 1.027 Not supported
* P < 0.05; ** P < 0.01
Note: INFO = information, SECUR = security and reliability, EMPA = empathy, APPE = appearance, TICOM = time commitment, SCON = store convenience, SATM = store atmosphere and CEXP = customer experience

Int. Journal of Economics and Management 10(2): 321 – 342 (2016)
334
In addition to the path analysis, predictive capability of the model was examined via Q2
statistic. Predictive relevance was examined to evaluate the magnitude of the R2 value as a criterion of predictive accuracy by using blindfolding to obtain cross-validated redundancy (Hair et al., 2013). In essence, the model in this study has predictive relevance as the endogenous latent constructs’ Q2 value is larger than zero (Chin, 2010; Hair et al., 2013). A Q2 value greater than zero for a reflective endogenous latent variable indicates the path model’s predictive relevance for this particular construct (Hair et al., 2014). There are two kinds of Q2 statistics estimates: cross-validated communality (H2
j) and cross-validated redundancy (F2j). Both H2
j and F2
j values should be greater than zero. By performing blindfolding, our results revealed that H2
j = 0.667 and F2j = 0.415. The results of blindfolding, as shown in Table 7, indicated
that the proposed model had good predictive relevance. Therefore, it can be concluded that CEXP were well-explained by service quality and store attributes.
Table 7 Summary of SmartPLS: Predictive Relevance of the Model
Exogenous VariableEndogenous
VariableH2
j F2j
Predictive Relevance
SCON
CEXP 0.667 0.415 Yes
INFOSECUREMPAAPPE
TICOMSATM
Note: INFO = information, SECUR = security and reliability, EMPA = empathy, APPE = appearance, TICOM = time commitment, SCON = store convenience, SATM = store atmosphere and CEXP = customer experience
DISCUSSION
The aim of this study was to examine the influence of service quality and store attributes on a customer’s emotional experience. In general, the statistical results provide partial support for all the hypothesized relationships. Service quality being intangible cues does have a substantial effect on emotions (Jang & Namkung, 2009). Consistent with researchers findings, service quality can generate a favorable or unfavorable experience (Gracia, Bakker, & Grau, 2011), whereby the component of quality significantly has an impact on positive emotions in a favorable experience. A community pharmacy selected for this study may have exhibited quality of the service that exceeds the expectation of customers, which leads to positive emotions. Van Hagen and Bron (2014) elaborated upon customers’ experiencing positive and healthy emotions when the experience is higher than expectation, therefore giving a proper evaluation of service quality provided.
In this particular study, only security and reliability of the service quality dimensions are found to be significant, which is consistent with Chowdhary and Prakash (2007). Thus, the security and reliability can be concluded as one of the most important dimensions of service

Int. Journal of Economics and Management 10(2): 321 – 342 (2016)
335
quality across different service-based providers. Customers expect the service process from the beginning until the end to be reliable, as a breakdown of communication or provision of service will adversely affect the customer. Customers may feel annoyed, frustrated, dissatisfied, or angry, which may subsequently weaken their loyalty and dampen the effort to retain customers. Hence, it is vital for the pharmacy to keep its promise and compromise the privacy of its clients to ensure the pharmacy is always credible and reliable.
Conversely, time commitment, empathy, appearance, and information were found to be not significant with a customer’s emotional experience. One of the probable explanations could be that the time commitment may not be crucial for the emotional experience because the pharmacy usually practices first-come/first-serve when dealing with customers. Information, when viewed as a platform for healthcare and medication counseling, may be perceived as being less important and does not bring any significant results. This may be due to the customers already knowing the prescribed medication information given by a doctor and being less dependent on the pharmacist. The insignificance of empathy may be attributable to the increase of service provider personal conflict when an emotional investment is unable to meet the customer demands. Besides, the insignificance of appearance could be due to the customer perceiving it as being the least critical when compared with other dimensions.
Store convenience and store atmosphere play a significant role in predicting customer experience. The study result is consistent with several studies, where the researchers ascertained the trigger points and engagement of consumer emotions through a set of store attributes (Babin et al., 1994; Walsh, Shiu, Hassan, Michaelidou, & Beatty, 2011). The practical understanding is that store attributes are tangible and are considered as a cue of functionality, space, design, and appearance, which form a mental picture in a consumer’s mind and which precedes the emotional response (Ching, 2014; Jang & Namkung, 2009). As such, the mental picture processed by consumers generates uplifting emotions, which, in turn, influences consumers to develop positive emotions (approach) or negative emotions (avoid) toward such stimuli.
Retailers may not be able to foresee the effect of store location on consumers. However, they can design the environment of the store holistically to such effects, as the environment of a pharmacy store is a dimension and not a combination of multiple points (Chang, Chang, & Yeh, 2013). Attributes that are in the retailer’s control such as lighting, color, design layout, background music, and appearance should be harmoniously designed to have an impact on consumers’ emotions. As mentioned by Chang et al. (2013), congenial atmosphere through the integration of environmental component amplifies the effect of environment on the consumer.
Pharmacy retailers also should consider their target consumer during the design of store attributes. Studies have shown a distinct preference for store attributes among different ethnics and cultural (Mokhlis, 1999). Researchers reckon the perception of consumers varies and is more prevalent in a multicultural country such as Malaysia (Osman, Sim Ong, Othman, & Khong, 2014). Retailers also need to understand that external stimuli only influences the development of a customer’s basic emotions (Lunardo & Mbengue, 2009), and extra effort is required to ideally develop an environment that has an impact beyond the first impression in order to enhance customer retention (Chang et al., 2013).
Int. Journal of Economics and Management 10(2): 321 – 342 (2016)
336
This study provides an understanding of the role of service quality (information, security and reliability, empathy, appearance, and time commitment), store attributes (store convenience and store atmosphere), and customer experience on community pharmacies. On the findings, this study can better help to postulate the conceptualization of service quality, store attributes, and customer emotional experience.
Practically, store attributes are found to influence the customer’s emotional experience. This knowledge should empower and assist community pharmacy owners in carefully considering the interior and exterior design of the shop to enhance customer experience, which may lead to better store performance. Business owners should be able to look within themselves to build up a rapport as a good quality service provider. In this modern era, consumers are always looking beyond value-added products, and excellent service and desirable store environment may prove to be a competitive advantage tool.
CONCLUSION
Customer experience management has become the focal topic of many companies in recent years. It has been proven that the outcome of a positive customer emotional experience leads to many favorable results from a business perspective. Therefore, this study can serve as a foundation for community pharmacy owners to start looking deeper into the management of customer experience. Favorable service quality and store attributes can be a starting point for owners to build, implement, and sustain positive customer experience.
The results of this study need to be viewed with several limitations. First, for this study, Sabah and Sarawak were excluded given the limited budget and time frame available. As this study measures the emotional experience of a customer, it must be pointed out the scale design used was a general scale, as no scale exist for this particular industry setting. This may cause uncertainty toward the reliability, validity, and applicability of the emotion measurement model. Besides, there is a need to consider the evolution of total experience over time, which thus necessitates longitudinal research in order to fully explore the drivers of customer experience. This study limits customer experience to emotional experience, and future studies can research other types of experiences such as brand experience or consumption experience.
Future studies can explore different dimensions of the SERVQUAL model. It is also suggested to use the SERVPEF model as a framework to determine service quality in a community pharmacy, as it will contribute to the literature knowledge to compare both models in a community pharmacy setting in Malaysia as well as to identify a more suitable service quality measurement model for the retail healthcare industry.
ACKNOWLEDGEMENTS
The authors would like to extend their gratitude to the participating community pharmacies outlets that help the researchers to distribute the questionnaire to their customers.
Int. Journal of Economics and Management 10(2): 321 – 342 (2016)
337
REFERENCES
Adat, N. and Noel, D. T. (2014), “Customers’ expectations and perceptions of service quality: The case of a retail pharmacy chain in South Africa”, Mediterranean Journal of Social Sciences, Vol 5 No 20, pp. 2648-2655.
Adoyo, B., Ondoro, C. O., Ojera, P. B., Abong’o, B., Aila, F. O. and Jeremiah, S. N. (2012), “The relationship between customer service quality and customer loyalty among retail pharmacies in Western Kenya”, Business and Management Review, Vol 2 No 3, pp. 11-21.
Ahmad, F. S., Ihtiyar, A. and Omar, R. (2014), “A comparative study on service quality in the grocery retailing: Evidence from Malaysia and Turkey”, Procedia-Social and Behavioral Sciences, Vol 109, pp. 763-767.
Amjeriya, D. and Malviya, R. K. (2012), “Measurement of service quality in healthcare organization”, International Journal of Engineering Research and Technology, Vol 1 No 8, pp. 1-18.
Babin, B. J. and Darden, W. R. (1996), Good and bad shopping vibes: Spending and patronage satisfaction”, Journal of Business Research, Vol 35 No 3, pp. 201-206.
Babin, B. J., Hair, J. F. and Boles, J. S. (2008), “Publishing research in marketing journals using structural equation modeling”, Journal of Marketing Theory and Practice, Vol 16 No 4, pp. 279-286.
Bagozzi, R. P. and Yi, Y. (2012), “Specification, evaluation, and interpretation of structural equation models”, Journal of the Academy of Marketing Science, Vol 40 No 1, pp. 8-34.
Baker, J., Grewal, D. and Parasuraman, A. (1994), “The influence of store environment on quality inferences and store image”, Journal of the Academy of Marketing Science, Vol 22 No 4, pp. 328-339.
Baker, J., Levy, M. and Grewal, D. (1992), “An experimental approach to making retail store environmental decisions”, Journal of Retailing, Vol 68 No 4, pp. 445-460.
Bellenger, D. N., Robertson, D. H. and Greenberg, B. A. (1977), “Shopping Centre patronage motives”, Journal of Retailing, Vol 53 No 2, pp. 29-38.
Berry, L. L. (2000). Cultivating service brand equity. Journal of the Academy of Marketing Science, 28(1), 128-137.
Berry, L. L., Seiders, K. and Grewal, D. (2002), “Understanding service convenience”, Journal of Marketing, Vol 66 No 3, pp. 1-17.
Borkowski, N. and Gordon, J. (2006), “Entrepreneurial organizations: The driving force for improving quality in the healthcare industry”, Journal of Health and Human Services Administration, 531-549.
Cameran, M., Moizer, P. and Pettinicchio, A. (2010), “Customer satisfaction, corporate image, and service quality in professional services”, The Service Industries Journal, Vol 30 No 3, pp. 421-435.
Chang, W.-C., Chang, L.-H. and Yeh, S.-S. (2013), “Customers’ perceived experiences of restaurant environment”, Advances in Hospitality and Leisure, Vol 9, pp. 185-205.
Chebat, J.-C., Filiatrault, P., Gelinas-Chebat, C. and Vaninsky, A. (1995), “Impact of waiting attribution and consumer's mood on perceived quality”, Journal of Business Research, Vol 34 No 3, pp. 191-196.
Chen, Y. and Fu, F. Q. (2015), “The Behavioral Consequences of Service Quality: An Empirical Study in the Chinese Retail Pharmacy Industry”, Health Marketing Quarterly, Vol 32 No 1, pp. 14-30.

Int. Journal of Economics and Management 10(2): 321 – 342 (2016)
338
Ching, F. D. (2014), Architecture: Form, Space, and Order (4th edition), New Jersey, John Wiley & Sons, United States of America.
Chowdhary, N. and Prakash, M. (2007), “Prioritizing service quality dimensions”, Managing Service Quality: An International Journal, Vol 17 No 5, pp. 493-509.
Crosby, L. A., Evans, K. R. and Cowles, D. (1990), “Relationship quality in services selling: An interpersonal influence perspective”, The Journal of Marketing, pp. 68-81.
Dadfar, H. and Brege, S. (2012), “Differentiation by improving quality of services at the last touch point: The case of Tehran pharmacies”, International Journal of Quality and Service Sciences, Vol 4 No 4, pp. 345-363.
Darley, W. K. and Lim, J.-S. (1999), “Effects of store image and attitude toward secondhand stores on shopping frequency and distance traveled”, International Journal of Retail & Distribution Management, Vol 27 No 8, pp. 311-318.
Das, G., Hayes, S. and Taylor, G. (2015), “Impact of store attributes on consumer-based retailer equity: An exploratory study of department retail stores”, Journal of Fashion Marketing and Management: An International Journal, Vol 19 No 2, pp. 188-204.
Dasanayaka, S. W. S. B., Gunasekera, G. S. P. and Sardana, G. D. (2012), “Quality of healthcare service delivery in public sector hospitals: A case study based on Western Province in Sri Lanka”, World Review of Entrepreneurship, Management and Sustainable Development, Vol 8 No 2, pp. 148-164.
Dennis, C., Joško Brakus, J. and Alamanos, E. (2013), “The wallpaper matters: Digital signage as customer-experience provider at the Harrods (London, UK) department store”, Journal of Marketing Management, Vol 29, No 3-4, pp. 338-355.
East, R., Hammond, K., Harris, P. and Lomax, W. (2000), “First-store loyalty and retention”, Journal of Marketing Management, Vol 16 No 4, pp. 307-325.
Eastlick, M. A. and Feinberg, R. A. (1999), “Shopping motives for mail catalog shopping”, Journal of Business Research, Vol 45 No 3, pp. 281-290.
Erdem, O., Ben Oumlil, A. and Tuncalp, S. (1999), “Consumer values and the importance of store attributes”, International Journal of Retail & Distribution Management, Vol 27 No 4, pp. 137-144.
Economic Transformation Programme (2015). Retrieved from http://etp.pemandu.gov.my/upload/etp_handbook_chapter_8_wholesale_and_retail.pdf
F. Hair Jr, J., Sarstedt, M., Hopkins, L. and G. Kuppelwieser, V. (2014), “Partial least squares structural equation modeling (PLS-SEM) An emerging tool in business research”, European Business Review, Vol 26 No 2, pp. 106-121.
Franic, D. M., Haddock, S. M., Tucker, L. T. and Wooten, N. (2007), “Pharmacy patronage: Identifying key factors in the decision making process using the determinant attribute approach”, Journal of the American Pharmacists Association: JAPhA, Vol 48 No 1, pp. 71-85.
Gavilan, D., Avello, M. and Abril, C. (2014), “Shopper marketing: A new challenge for Spanish community pharmacies”, Research in Social and Administrative Pharmacy, Vol 10 No 6, pp. 125-136.
Gracia, E., Bakker, A. B. and Grau, R. M. (2011), “Positive emotions: The connection between customer quality evaluations and loyalty”, Cornell Hospitality Quarterly, Vol 52 No 4, pp. 458-465.

Int. Journal of Economics and Management 10(2): 321 – 342 (2016)
339
Gronoos, C. (1982), “Strategic management and marketing in the service sector”, International Journal of Service Industry Management, Vol 5 No 1, pp. 5-20.
Hair, J. F., Ringle, C. M. and Sarstedt, M. (2011), “The use of partial least squares (PLS) to address marketing management topics”, Journal of Marketing Theory and Practice, Vol 19 No 2, pp. 135-138.
Hair, J. F., Sarstedt, M., Pieper, T. M. and Ringle, C. M. (2012), “The use of partial least squares structural equation modeling in strategic management research: A review of past practices and recommendations for future applications”, Long Range Planning, Vol 45 No 5, pp. 320-340.
Hair Jr, J. F., Hult, G. T. M., Ringle, C. and Sarstedt, M. (2013), A Primer on Partial Least Squares Structural Equation Modeling (PLS-SEM), Washington, Sage Publications, United States of America.
Horsfield, E., Kelly, F., Clark, T. and Sheridan, J. (2014), “How youth-friendly are pharmacies in New Zealand? Surveying aspects of accessibility and the pharmacy environment using a youth participatory approach”, Research in Social and Administrative Pharmacy, Vol 10 No 3, pp. 529-538.
Hortman, S. M., Allaway, A. W., Mason, J. B. and Rasp, J. (1990), “Multisegment analysis of supermarket patronage”, Journal of Business Research, Vol 21 No 3, pp. 209-223.
Jain, S. K. and Gupta, G. (2004), “Measuring service quality: SERVQUAL vs. SERVPERF scales”, Vikalpa, Vol 29 No 2, pp. 25-37.
Jang, S. S. and Namkung, Y. (2009), “Perceived quality, emotions, and behavioral intentions: Application of an extended Mehrabian–Russell model to restaurants”, Journal of Business Research, Vol 62 No 4, pp. 451-460.
Kareem, A. and Farid, A. (2013), Determinant attributes influencing retail pharmacy selection by Malaysian consumers, Doctoral dissertation, University of Malaya.
Khairunnisak, L. and Ng, S. I. (2015), “The Impact of Tourism Service Quality on Satisfaction”, International Journal of Economics and Management, Vol 9 Special Issue, pp. 67-94.
Kheng, L. L., Mahamad, O., Ramayah, T. and Mosahab, R. (2010), “The impact of service quality on customer loyalty: A study of banks in Penang, Malaysia”, International Journal of Marketing Studies, Vol 2 No 2, pp. 57-66
Kim, S., Cha, J., Knutson, B. J. and Beck, J. A. (2011), “Development and testing of the Consumer Experience Index (CEI)”, Managing Service Quality: An International Journal, Vol 21 No 2, pp. 112-132.
Klaus, P. and Maklan, S. (2013), “Towards a better measure of customer experience”, International Journal of Market Researh, Vol 55 No 2, pp. 227-246.
Kotler, P. (1973), “Atmospherics as a marketing tool”, Journal of Retailing, Vol 49 No 4, pp. 48-64.
Leen, J. Y. A., Ramayah, T. and Ma’ruf, J. J. (2004), “Validating a retail service quality instrument in apparel specialty stores”, In The Proceedings of the International Borneo Business Conference,“The Impact of Contemporary Environment on Economics and Business”, Kota Kinabalu, Malaysia.
Leventhal, R. C., Mascarenhas, O. A., Kesavan, R. and Bernacchi, M. (2006), “Lasting customer loyalty: A total customer experience approach”, Journal of Consumer Marketing, Vol 23 No 7, pp. 397-405.
Lin, Z. and Bennett, D. (2014), “Examining retail customer experience and the moderation effect of loyalty programmes”, International Journal of Retail & Distribution Management, Vol 42 No 10, pp. 929-947.
Int. Journal of Economics and Management 10(2): 321 – 342 (2016)
340
Lindquis, J. D. (1974), “Meaning of image-survey of empirical and hypothetical evidence”, Journal of Retailing, Vol 50 No 4, pp. 29.
Lunardo, R. and Mbengue, A. (2009), “Perceived control and shopping behavior: The moderating role of the level of utilitarian motivational orientation”, Journal of Retailing and Consumer Services, Vol 16 No 6, pp. 434-44.
Martineau, P. (1958), “The personality of the retail store”, Harvard Business Review, Vol 36 No 1, pp. 47-55.
Mattila, A. S., & Enz, C. A. (2002). The role of emotions in service encounters. Journal of Service Research, 4(4), 268-277.
McGoldrick, P. J. and Andre, E. (1997), “Consumer misbehaviour: promiscuity or loyalty in grocery shopping”, Journal of Retailing and Consumer Services, Vol 4 No 2, pp. 73-81.
Mey, L. P., Akbar, A. K. and Fie, D. Y. G. (2006), “Measuring service quality and customer satisfaction of the hotels in Malaysia: Malaysian, Asian and non-Asian hotel guests”, Journal of Hospitality and Tourism Management, Vol 13 No 2, pp.144-160.
Meyer, C., & Schwager, A. (2007). Understanding customer experience. Harvard Business Review, 85(2), 116.
Mokhlis, S. (1999), “Religious differences in some selected aspects of consumer behavior: A Malaysian study”, The Journal of International Management Studies, Vol 4 No 76, pp. 67-76.
Mokhlis, S. (2014), “The image of retailing as a graduate career: Evidence from Malaysia”, International Business Management, Vol 8 No 2, pp. 146-152.
Malaysian Organization of Pharmaceutical Industries (MOPI). (2011), Retrieved from http://www.apcnmp2012.com.au/files/4fd7f6d298c78.pdf
Muhammad Butt, M. and Cyril de Run, E. (2010), “Private healthcare quality: applying a SERVQUAL model”, International Journal of Health Care Quality Assurance, Vol 23 No 7, pp. 658-673.
Naina Mohamed, R. and Borhan, H. (2014), “Exploring customer attachment behaviour to sustain the retail industry in Malaysia”, World Journal of Entrepreneurship, Management and Sustainable Development, Vol 10 No 1, pp. 69-76.
Nilsson, C. B. and Ek, C. L. (2012), Shopper Mode-Shopper marketing from a shopper perspective. Unpublished master’s thesis, School of Economics and Management, Lund University, Lund, Sweden.
Nilsson, E., Gärling, T. and Marell, A. (2013), “Consumers´ satisfaction with grocery shopping in supermarkets and convenience stores”, International Journal of Sales, Retailing and Marketing, Vol 2 No 4, pp. 72-90.
Oliver, R. L. (2014), Satisfaction: A behavioral perspective on the consumer (2nd ed.), Routledge, New York, United States of America.
Osman, S., Sim Ong, F., Nor Othman, M. and Wei Khong, K. (2014), “The mediating effect of mood on in-store behaviour among Muslim shoppers”, Journal of Islamic Marketing, Vol 5 No 2, pp. 178-197.
Palmer, A. (2010), “Customer experience management: a critical review of an emerging idea”, Journal of Services Marketing, Vol 24 No 3, pp. 196-208.
Pan, Y. and Zinkhan, G. M. (2006), “Determinants of retail patronage: A meta-analytical perspective”, Journal of Retailing, Vol 82 No 3, pp. 229-243.
Int. Journal of Economics and Management 10(2): 321 – 342 (2016)
341
Panda, T. K. (2002), “Creating customer life time value through effective CRM in financial services industry”, Journal of Services Research, Vol 2 No 2, pp. 157-174.
Parasuraman, A., Zeithaml, V.A. and Malhotra, A. (2005), “E-S-QUAL: A multiple-item scale for assessing electronic service quality”, Journal of Service Research, Vol 7 No 3, pp. 213-233.
Reutterer, T. and Teller, C. (2009), “Store format choice and shopping trip types”, International Journal of Retail & Distribution Management, Vol 37 No 8, pp. 695-710.
Ladhari, R. (2009), “A review of twenty years of SERVQUAL research”, International Journal of Quality and Service Sciences, Vol 1 No 2, pp. 172-198.
Ringle, C. M., Wende, S. and Will, A. (2005), SmartPLS 2.0 (Beta), Hamburg, Germany
Robert, D. and John, R. (1982), “Store atmosphere: an environmental psychology approach”, Journal of Retailing, Vol 58, pp. 34-57.
Roos, I. and Friman, M. (2008), “Emotional experiences in customer relationships - a telecommunication study”, International Journal of Service Industry Management, Vol 19 No 3, pp. 281-301.
Sanders, E. B.-N. and Stappers, P. J. (2008), “Co-creation and the new landscapes of design”, Co-design, Vol 4 No 1, pp. 5-18.
Sandström, S., Edvardsson, B., Kristensson, P. and Magnusson, P. (2008), “Value in use through service experience”, Managing Service Quality: An International Journal, Vol 18 No 2, pp. 112-126.
Schommer, J. C. and Kucukarslan, S. N. (1997), “Measuring patient satisfaction with pharmaceutical services”, American Journal of Health-System Pharmacy, Vol 54 No 23, pp. 2721-2732.
Seock, Y.-K. and Bailey, L. R. (2009), “Fashion promotions in the Hispanic market: Hispanic consumers' use of information sources in apparel shopping”, International Journal of Retail & Distribution Management, Vol 37 No 2, pp. 161-181.
Sherman, E., Mathur, A. and Smith, R. B. (1997), “Store environment and consumer purchase behavior: Mediating role of consumer emotions”, Psychology & Marketing, Vol 14 No 4, pp. 361-378.
Sinha, P. K. and Banerjee, A. (2004), “Store choice behaviour in an evolving market”, International Journal of Retail & Distribution Management, Vol 32 No 10, pp. 482-494.
Söderlund, M. and Rosengren, S. (2007), “Receiving word-of-mouth from the service customer: An emotion-based effectiveness assessment”, Journal of Retailing and Consumer Services, Vol 14 No 2, pp. 123-136.
Spies, K., Hesse, F. and Loesch, K. (1997), “Store atmosphere, mood and purchasing behavior”, International Journal of Research in Marketing, Vol 14 No 1, pp. 1-17.
Stephens Balakrishnan, M. (2011), “Gain the most from your marketing spend on loyalty”, Business Strategy Series, Vol 12 No 5, pp. 219-225.
Thang, D. C. L. and Tan, B. L. B. (2003), “Linking consumer perception to preference of retail stores: an empirical assessment of the multi-attributes of store image”, Journal of Retailing and Consumer Services, Vol 10 No 4, pp. 193-200
Tripathi, S. N. (2009), “An analysis of customer-pull factors and the process of store loyalty”, Paradigm, Vol 13 No 1, pp. 91.

Int. Journal of Economics and Management 10(2): 321 – 342 (2016)
342
Urbach, N. and Ahlemann, F. (2010), “Structural equation modeling in information systems research using partial least squares”, Journal of Information and Technology Theory Application, Vol 11 No 2, pp. 5–40.
Van Hagen, M. and Bron, P. (2014), “Enhancing the experience of the train journey: Changing the focus from satisfaction to emotional experience of customers”, Transportation Research Procedia, Vol 1 No 1, pp. 253-263.
Vazquez, R., Rodrıguez-Del Bosque, I. A., Dıaz, A. M. and Ruiz, A. n. V. (2001), “Service quality in supermarket retailing: identifying critical service experiences”, Journal of Retailing and Consumer Services, Vol 8 No 1, pp. 1-14.
Vinzi, V., Chin, W. W., Henseler, J. and Wang, H. (2010), Handbook of Partial Least Squares: Springer Handbooks of Computational Statistics, Springer Heidelberg, Dordrecth, London.
Walsh, G., Shiu, E., Hassan, L. M., Michaelidou, N. and Beatty, S. E. (2011), “Emotions, store-environmental cues, store-choice criteria, and marketing outcomes”, Journal of Business Research, Vol 64 No 7, pp. 737-744.
Wang, C.-H. and Ha, S. (2011), “Store attributes influencing relationship marketing: a study of department stores”, Journal of Fashion Marketing and Management: An International Journal, Vol 15 No 3, pp. 326-344.
Watson, L. and Spence, M. T. (2007), “Causes and consequences of emotions on consumer behaviour: A review and integrative cognitive appraisal theory”, European Journal of Marketing, Vol 41 No 5/6, pp. 487-511.
White, L. and Klinner, C. (2012), “Service quality in community pharmacy: An exploration of determinants”, Research in Social and Administrative Pharmacy, Vol 8 No 2, pp. 122-132.
Wong, A. (2004), “The role of emotional satisfaction in service encounters”, Managing Service Quality: An International Journal, Vol 14 No 5, pp. 365-376.
Wong, Y.-T., Osman, S., Jamaluddin, A. and Yin-Fah, B. C. (2012), “Shopping motives, store attributes and shopping enjoyment among Malaysian youth”, Journal of Retailing and Consumer Services, Vol 19 No 2, pp. 240-248.
Wongsuphasawat, K., Kittisopee, T. and Powpaka, S. (2010), “The relative importance of store attributes on consumers’ responses toward drugstore: The moderating effect of buying purposes”, Thai Journal of Hospital Pharmacy, Vol 18 No 1, pp. 11-26.
Zeelenberg, M. and Pieters, R. (2004), “Beyond valence in customer dissatisfaction: A review and new findings on behavioral responses to regret and disappointment in failed services”, Journal of Business Research, Vol 57 No 4, pp. 445-455.