a model for vertical-to-horizontal response spectral ...€¦ · a model for vertical-to-horizontal...
TRANSCRIPT
A Model for Vertical-to-Horizontal Response Spectral
Ratios for Europe and the Middle East
by Julian J. Bommer, Sinan Akkar, and Özkan Kale
Abstract In the framework of probabilistic seismic hazard analysis, the preferredapproach for obtaining the response spectrum of the vertical component of motion isto scale the horizontal spectrum by vertical-to-horizontal (V/H) spectral ratios. In orderto apply these ratios to scenario or conditional mean spectra, the V/H ratios need to bedefined as a function of variables such as magnitude, distance, and site classification.A new model for the prediction of V/H ratios for peak ground acceleration and spectralaccelerations from 0.02 to 3.0 s is developed from the database of strong-motionaccelerograms from Europe and the Middle East. A simple functional form, expres-sing the V/H ratios as a function of magnitude, style of faulting, distance, and siteclass, is found to be appropriate, and the associated aleatory variability is foundto be at least as low as that obtained in other studies using more complex models.The predicted ratios from the new European model are found to be in broad agreementwith recent models derived from predominantly western North America data.
Introduction
Lateral loads imposed on structures are the primary causeof damage in earthquakes, but the vertical component ofground shaking can also contribute to the destructive capacityof the motion in many situations. For consideration of suchcases, and formodeling the interaction between the horizontaland vertical components of the ground motion, it is necessaryto define the input to structural design in terms of both verticaland horizontal accelerations. The reader is referred to Bozorg-nia and Campbell (2004a) for the significance of verticalground motions in engineering design applications. Whengenerating design response spectra through probabilisticseismic hazard analysis (PSHA), one option is to repeat thehazard integrations conducted in terms of horizontal responsespectral ordinates using ground-motion prediction equations(GMPEs) for the vertical spectral ordinates. The problem withsuch an approach is that, if the hazard at a particular responseperiod is subsequently disaggregated for a given annualexceedance frequency, it may often be found that the verticaland horizontal spectral accelerations are controlled by differ-ent earthquake scenarios. This shortcoming becomes particu-larly important if three-component acceleration time-historiesare subsequently required for dynamic structural analyses.The preferred approach, therefore, is to generate the verticalspectrum by multiplying the horizontal spectrum by vertical-to-horizontal (V/H) ratios.
Such V/H ratios can be applied to the uniform hazardspectrum (UHS), to a scenario spectrum, or to a conditionalmean spectrum (CMS) (Baker and Cornell, 2006), as dis-cussed by Gülerce and Abrahamson (2011). The CMS, in
effect, is a special case of the scenario spectrum that accountsfor the decreasing correlation of the variability of spectralordinates with increasing separation of response periods. Thefirst option (UHS) has two important shortcomings, the firstbeing that the UHS is not a suitable target for the selectionand scaling of accelerograms (e.g., Thenhaus and Campbell,2002), and the second that generic rather than scenario-specific V/H factors would need to be used. The latter optionsof applying V/H ratios to a scenario spectrum or CMS arepreferable, but they require models for predicting V/H ratiosas a function of the explanatory variables that characterizethe controlling earthquake scenario and the site of interest.Therefore, as a minimum, such a model should include theinfluence of earthquake magnitude, source-to-site distance,and site class; style of faulting may also be a relevantparameter.
Another point that should be noted regarding suchmodels is that the vertical component of ground motion tendsto be most pronounced at short response periods, and verticalvibration modes of structures tend to have much shorter peri-ods than do modes of horizontal vibration. Therefore, modelsfor V/H spectral ratios should ideally be derived for a widerange of response periods and in particular to provide goodcoverage of the short-period range of the response spectrum.
For application to a UHS or to a scenario spectrum, onlythe median values of the V/H ratios are required. This makesthe implicit assumption that the aleatory variability asso-ciated with the prediction of the vertical component is equalto that associated with the horizontal component, whereas
1783
Bulletin of the Seismological Society of America, Vol. 101, No. 4, pp. 1783–1806, August 2011, doi: 10.1785/0120100285

the results of some studies suggest that the former mightactually be slightly larger (Campbell and Bozorgnia, 2003).For the most accurate generation of vertical spectra, Gülerceand Abrahamson (2011) propose applying the V/H ratios tothe CMS and additionally adjusting for the period-to-periodcorrelation between the horizontal spectral ordinates and theV/H ratios. This approach requires a measure of the variabil-ity of the predicted V/H ratios, so this becomes anotherrequirement for these models.
Despite the clear need for V/H spectral ratio models,relatively few have been presented in the literature, and thereare important shortcomings with some of the existingmodels. In the next section, models for the V/H ratios ofresponse spectral ordinates are reviewed, after which wepresent the generation of a new V/H model using the currentEuropean strong-motion database.
Models for V/H Response Spectral Ratios
The existing models for predicting the V/H ratio ofresponse spectral ordinates can be grouped into three cate-gories: (1) codes and regulations, which present genericratios that usually vary only as a function of site classifica-tion; (2) independent predictions of the vertical and horizon-tal components of motion, which allow the median V/H ratioto be calculated for a given scenario; and (3) direct predic-tions of the V/H ratio, which have the advantage of generallyincluding a measure of the associated variability. The cur-rently available models in each of these three categoriesare reviewed in the following three subsections.
V/H Ratios from Codes and Regulations
Many seismic design codes do not consider the verticalcomponent of motion at all, and, among those that do specifya vertical response spectrum, it is not uncommon for this tobe specified simply as 2=3 of the horizontal spectrum at allresponse periods. There are, however, a few code-specifiedvertical spectra that more realistically reflect the variation ofthe V/H ratio with response period. The earliest of these isRegulatory Guide (RG) 1.60 (United States Atomic EnergyCommission [USAEC], 1973), in which the V/H spectralratio is equal to 2=3 for frequencies of less than 0.25 Hzbut equal to 1.0 for frequencies above 3.5 Hz. McGuire et al.(2001) proposed updates intended to replace the RG 1.60spectra, for which they put forward distinct V/H spectralshapes for the western United States and for central and east-ern United States. These ratios are defined for rock sites andvary with the range of expected peak ground acceleration(PGA) value in rock, as a surrogate for capturing the influ-ence of magnitude and distance.
Eurocode 8 (2004) was among the first codes for theseismic design of buildings to include a vertical spectrumdefined independently from the horizontal spectrum, basedlargely on the proposed V/H model of Elnashai and Papazo-glu (1997). The National Earthquake Hazards Reduction
Program [NEHRP] (2009) provisions have similarly intro-duced an independent specification of the vertical spectrum,based in this case on the proposals of Bozorgnia and Camp-bell (2004b). Other recent proposals for simple V/H spectralratios include those of Malhotra (2006) and Cauzzi andFaccioli (2008). Figure 1 compares the implied ratios fromEC8 and NEHRP (2009) with other simplified models.Figure 1a presents the V/H ratios embedded in these codes,as well as those proposed in the McGuire et al. (2001) study.Figure 1b plots include the empirical relationships of Cauzziand Faccioli (2008) and Bozorgnia and Campbell (2004b),which is derived from the equations of Campbell andBozorgnia (2003) that are discussed in the next section.The comparisons in Figure 1 clearly illustrate one of thekey shortcomings of simplified V/H ratios such as thoseembedded in seismic design codes: they are generally unableto capture the strong influence of source-to-site distance. Asnoted previously in this paper, the approach of McGuire et al.(2001) to condition the V/H ratios to the rock PGA at the site,partially overcomes this problem. However, in general theuse of such simplified V/H ratios is not ideal for site-specificapplications. The main use of the generic V/H ratios encoun-tered in design codes and regulations is to transform a hori-zontal UHS (approximated by the design spectrum) to avertical UHS, for which little more than the site classificationand the site-specific levels of motion will generally beknown, unless a disaggregation is performed.
V/H Ratios from Independent Predictionsof Spectral Ordinates
The V/H spectral ratio can be constructed for any earth-quake scenario using independent GMPEs for the horizontaland vertical spectral ordinates, provided these are derivedfrom the same dataset. We have identified 16 such pairsof predictive models in the current literature; their key char-acteristics are summarized in Table 1 in terms of the magni-tude and distance ranges covered, as well as the range ofresponse periods for which V/H ratios are provided (apartfrom PGA, which can be assumed as being equivalent tothe spectral acceleration at 0.01 s).
Although included in Table 1, it should be noted thatBragato and Slejko (2005) used 3168 records for the verticalcomponent model but only 1402 horizontal pairs for theequations to predict horizontal spectra, which means thatthe models cannot really be considered as compatible.Limitations with several of the other models in Table 1 areimmediately apparent, with several of them being spe-cific to individual countries or even subregions of countries.If we eliminate models for which the maximum magnitudeconsidered is not greater than moment magnitude (Mw) 7and those for which the minimum period covered is0.10 s, 10 of the 16 models would be eliminated from furtherconsideration.
From the six surviving models, Campbell (1997)can also be excluded because it has been superseded by
1784 J. J. Bommer, S. Akkar, and Ö. Kale

Campbell and Bozorgnia (2003). Berge-Thierry et al.(2003) and Cauzzi and Faccioli (2008), while nominallyapplicable to larger magnitudes, have the disadvantage ofbeing based on hypocentral distance (Rhyp), which is not anappropriate measure for larger events. Moreover, Berge-Thierry et al. (2003) only differentiates between rock andsoil sites, without any additional refinement in terms of siteclassification.
This leaves just three models, two of which only extenddown to 0.05 s (Ambraseys et al., 2005a, 2005b; Campbelland Bozorgnia, 2003), with only Abrahamson and Silva(1997) including periods as short as 0.01 s. The Ambraseyset al. (2005a) model is for the larger horizontal componentof motion, whereas ground-motion predictions are increas-
ingly based on the geometric mean component; conver-sions can be easily made (e.g., Beyer and Bommer, 2006,2007), but this adds uncertainty to the vertical spectrumprediction.
If,in addition to the various criteria discussed thus farin this paper, one were to make it a requirement to predictspectral ratios at response periods below 0.05 s, then onlythe model of Abrahamson and Silva (1997) would stillbe in contention. However, that model would not servefor all applications because it does not include an estimateof variability associated with the V/H predictions, andthis could only be obtained by calculating all of the residualsfor their dataset. Of the 16 studies listed in Table 1, onlyCampbell and Bozorgnia (2003) performed the exercise
Table 1Characteristics of GMPEs for Horizontal and Vertical Spectral Accelerations
Study Data Region Mmin Mmax Rmin Rmax Tmin Tmax
Sabetta and Pugliese (1996) Italy 4.6 6.8 0 100 0.04 4.0Ambraseys et al. (1996); Ambraseys
and Simpson (1996)Europe and Middle East 4.0 7.5 0 200 0.10 2.0
Abrahamson and Silva (1997) Western United States/Global 4.4 7.4 0 200 0.01 5.0Campbell (1997) Western United States/Global 4.7 8.1 3 60 0.05 4.0Ambraseys and Douglas (2003) Global 5.8 7.8 0 15 0.10 2.0Lussou et al. (2001) Japan 3.5 6.3 10 200 0.02 10.0Berge-Thierry et al. (2003) Europe and California 4.0 7.9 4 330 0.03 10.0Campbell and Bozorgnia (2003) Western United States/Global 4.7 7.7 3 60 0.05 4.0Kalkan and Gülkan (2004a, 2004b) Turkey 4.2 7.4 1.2 250 0.10 2.0Bragato and Slejko (2005) Northeast Italy 2.5 6.3 0 130 0.10 2.0Ambraseys et al. (2005a, 2005b) Europe and Middle East 5.0 7.6 0 100 0.05 2.5Bindi et al. (2007) Northwest Turkey 0.5 5.9 1.5 190 0.10 1.0Massa et al. (2008) Northern Italy 3.5 6.5 0 100 0.04 2.0Morasca et al. (2008) Molise, Italy 2.7 5.7 11 39 0.04 2.0Cauzzi and Faccioli (2008) Mainly Japan 5.0 7.2 6 150 0.05 20.0Bindi et al. (2010) Italy 4.0 6.9 1 100 0.03 2.0
(a) (b)
Figure 1. (a) Comparisons of V/H ratios from Eurocode 8 (EC8), NEHRP (2009), and McGuire et al. (2001) for western North America,for rock sites, compared with (b) those from Cauzzi and Faccoli (2008) and Bozorgnia and Campbell (2004b) for different distances. “Rocksite” is taken as an NEHRP B site class definition for NEHRP (2009), whereas it is a Type A site class for EC8. Among the individual studies,Cauzzi and Faccioli (2008) define rock site conditions for VS30 ≥ 800 m=s, and Bozorgnia and Campbell (2004b) consider the sites withVS30 � 800–330 m=s as rock.
A Model for Vertical-to-Horizontal Response Spectral Ratios for Europe and the Middle East 1785
of calculating V/H residuals and reporting the standarddeviations.
Direct Predictions of V/H Ratios
To our knowledge, there are only four current models forthe prediction of V/H ratios as a function of magnitude, dis-tance, and site class. The models of Ambraseys and Simpson(1996) and of Kalkan and Gülkan (2004a) both predict thenatural value of the V/H ratio rather than its logarithm, whichmeans that the ratio could become negative for low exceed-ance levels. There are also other deficiencies with thesemodels, as noted in the discussion in the preceding section(V/H Ratios from Independent Predictions of SpectralOrdinates), but they do not warrant further discussion.The model of Ambraseys and Douglas (2003) is a functiononly of style of faulting, being based on data from earth-quakes of surface-wave magnitude (Ms) 5.8–7.8 and record-ings obtained at distances of not more than 15 km from thesource. This restriction to very short distances, and the factthat it considers a minimum period of 0.10 s, severely limitthe applicability of this model.
The model of Gülerce and Abrahamson (2011) consid-ers the main explanatory variables such as magnitude,distance, and site class in estimating the V/H ratio. Gülerceand Abrahamson (2011) use the horizontal-componentPacific Earthquake Engineering Research–Next GenerationAttenuation of Ground Motions (PEER NGA) dataset ofAbrahamson and Silva (2008) with small changes due toexclusion of recordings with missing vertical components.The dataset consists of 2,636 recordings from 126 shallowcrustal earthquakes from active tectonic regions around theworld. The magnitude range of the events is 4:3≤ Mw ≤7:9.The model developers consider both mainshock and after-shock recordings. The rupture distance (closest distance tothe rupture plane, Rrup) of the records extends as far as
300 km. The proposed model is based on the Abrahamsonand Silva (2008) functional form and classifies the sites as acontinuous function of VS30 (average shear-wave velocityover the top 30 m). The aleatory variability (i.e., sigma) isa function of magnitude, decreasing with increasing magni-tude values. The Gülerce and Abrahamson (2011) V/H modelaccounts for the nonlinear soil response, and this leads tostronger influence of site effects than in most other models,with high V/H ratios on soft soil sites at short distances. TheV/H spectral ratio equations are derived for spectral periodsup to 10.0 s, based on the recommended usable period rangesof horizontal and vertical ground motions in the PEER NGAdatabase (Chiou et al., 2008).
Database and Record Processing
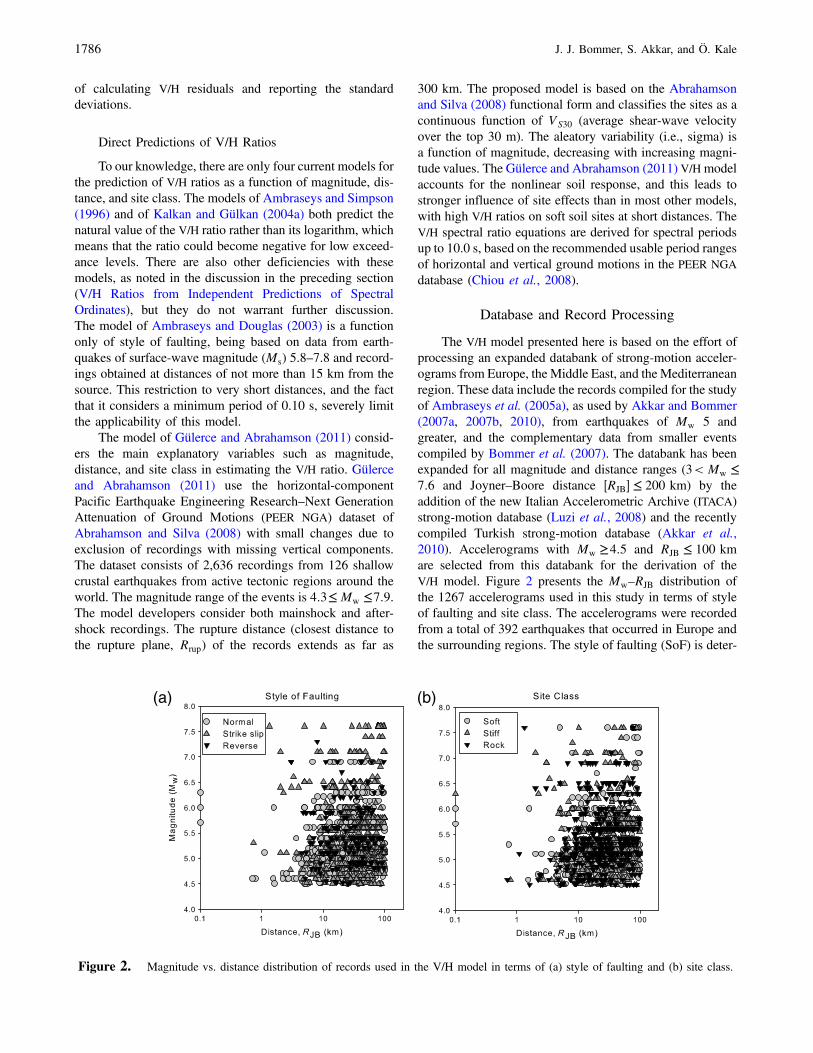
The V/H model presented here is based on the effort ofprocessing an expanded databank of strong-motion acceler-ograms from Europe, the Middle East, and the Mediterraneanregion. These data include the records compiled for the studyof Ambraseys et al. (2005a), as used by Akkar and Bommer(2007a, 2007b, 2010), from earthquakes of Mw 5 andgreater, and the complementary data from smaller eventscompiled by Bommer et al. (2007). The databank has beenexpanded for all magnitude and distance ranges (3< Mw ≤7:6 and Joyner–Boore distance �RJB� ≤ 200 km) by theaddition of the new Italian Accelerometric Archive (ITACA)strong-motion database (Luzi et al., 2008) and the recentlycompiled Turkish strong-motion database (Akkar et al.,2010). Accelerograms with Mw ≥4:5 and RJB ≤ 100 kmare selected from this databank for the derivation of theV/H model. Figure 2 presents the Mw–RJB distribution ofthe 1267 accelerograms used in this study in terms of styleof faulting and site class. The accelerograms were recordedfrom a total of 392 earthquakes that occurred in Europe andthe surrounding regions. The style of faulting (SoF) is deter-
(a) (b)
Figure 2. Magnitude vs. distance distribution of records used in the V/H model in terms of (a) style of faulting and (b) site class.
1786 J. J. Bommer, S. Akkar, and Ö. Kale

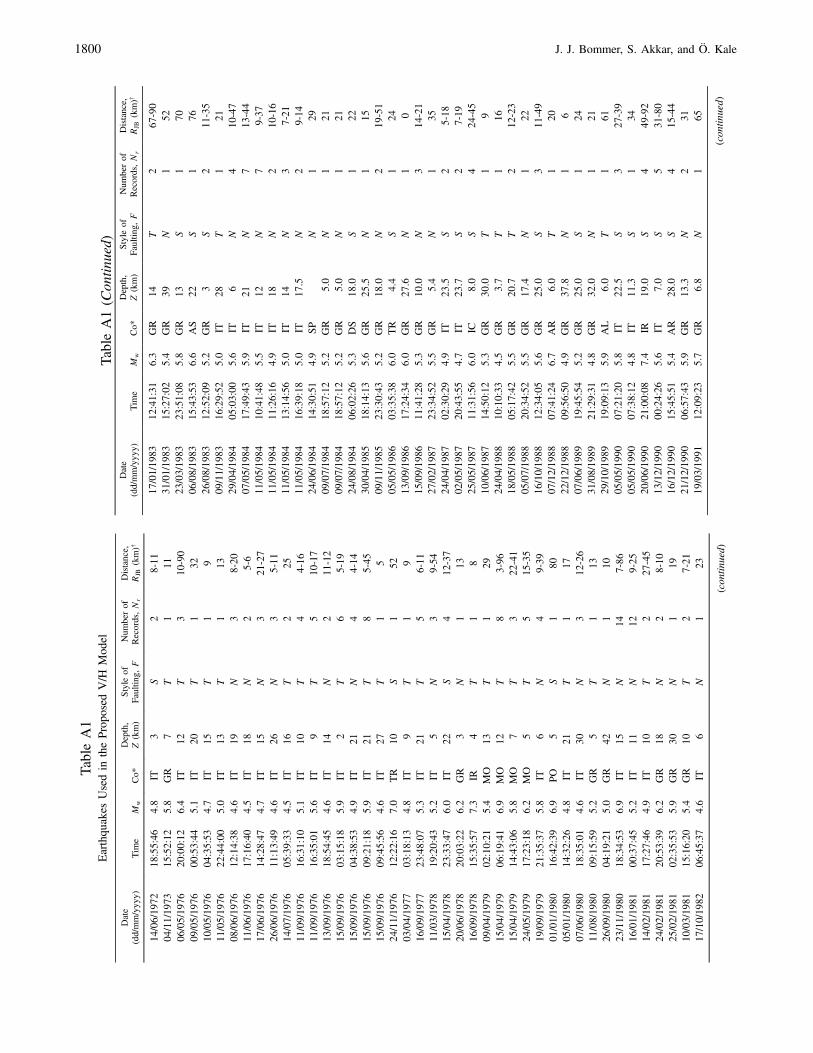
mined by using (a) the P, T, and B parameters of the faultplane solutions (Frohlich and Apperson, 1992) wheneverthey are available and (b) the rake angle intervals proposedby Boore et al. (1997), Campbell (1997), and Sadigh et al.(1997). This approach used for classifying the style of fault-ing has been the state of practice in the previously compiledEuropean datasets; we chose not to update it by following therecent NGA criteria, which differ from one model developerto another (Abrahamson et al., 2008). The site classificationis based on specific VS30 intervals, inferred either from in situgeophysical measurements or geological explorations,and it is consistent with the site-class definitions describedin EC8 (Eurocode 8, 2004) and NEHRP (2009): rock (VS30 ≥750 m=s), stiff soil (360 m=s ≤ VS30 < 750 m=s), and softsoil (180 m=s ≤ VS30 < 360 m=s). Major features of earth-quakes in the database, number of accelerograms used fromeach event, and their distance ranges are given in Table A1(see Appendix).
The long-period filter parameters (low-cut filter values)are determined by applying the criteria outlined in Akkar andBommer (2006). For the selection of high-cut filter values,the high-frequency noise behavior discussed in Douglas andBoore (2011) is used. After identifying the noisy portion atthe high-frequency end of the Fourier acceleration spectrum,it is removed by choosing a high-cut filter value that isjudged to be appropriate. On the basis of the results in Akkaret al. (2011), the high-cut filtering influence becomesnegligible for vibration periods greater than 0.05 s. Thecurrent database consists of horizontal and vertical acceler-ograms for which the spectral ordinate of the filtered recorddiffers by less than 10% from that of the mean-removedrecord for T ≤ 0:05 s. This criterion was proposed by Akkaret al. (2011) after looking at the simple statistics of the spec-tral ratios of the filtered to mean-removed records at severalshort-response periods for both the horizontal and verticalcomponents. For periods longer than 0.05 s, the criteria
described in Akkar and Bommer (2006) are applied to mini-mize the filtering distortions at longer periods. Figure 3shows the period-dependent data variation in terms of SoFand site class after applying the Akkar and Bommer (2006)and Akkar et al. (2011) criteria. Regardless of SoF and siteclasses, the loss of data due to filtering effects becomesnoticeable after T � 1:0 s. There is also a significant lossof events with multiple recordings at T � 3:0 s that resultsin an increase in the percentage of singly-recorded earth-quakes in the database. On the basis of these observations,it was judged that at periods beyond 3.0 s the data would beinsufficient to allow robust regression analyses, and this wastherefore selected as the limiting period for the proposed V/Hmodel in this study.
Regression Analyses
The actual V/H trends at several vibration periods andseveral functional forms (complex to simple) are exploredbefore executing the final regression analyses. This sectionfirst describes the behavior of V/H trends under differentestimator parameters and then presents our observations ondifferent functional forms that identified the optimum V/Hmodel proposed in this study.
Observed Trends of V/H Ratios withExplanatory Variables
Figure 4 shows the average V/H ratios for a set ofpredetermined spectral periods (T � 0:0 [PGA], 0.10,0.20, 0.40, 1.0, and 2.0 s ). For a given period, the data aredivided into three magnitude ranges (i.e., 4:5≤ Mw <5:5,5:5≤ Mw <6:5, andMw ≥6:5) and the data falling into theseMw intervals are clustered into 10-km distance bins. The dataare initially modified for strike-slip faulting and rock siteconditions by using empirical scaling factors obtained froma preliminary set of regression analyses in order to utilize the
(a) (b)
Figure 3. Period-dependent variation of usable recordings as a function of (a) style of faulting and (b) site class.
A Model for Vertical-to-Horizontal Response Spectral Ratios for Europe and the Middle East 1787

results of the whole dataset in the examination of V/H trends.The average V/H ratio of each distance cluster is plotted onthe scatter diagram of the corresponding spectral period. Theaverage V/H ratio is computed whenever the number ofrecords in a cluster is greater than 4. Regardless of the spec-tral period, the V/H trends in Figure 4 do not display strongmagnitude dependence. The data from the largest magnitudeinterval (i.e., Mw ≥6:5) also do not exhibit a significantsaturation trend at short periods and at close distances. Theratios tend to decay with increasing distance for T ≤ 0:05 s,they are almost independent of distance at T � 0:20 s, andthey mildly increase with increasing distance for T ≥ 0:40 s.The gradient of distance-dependent V/H variation seems tobe free of magnitude effects. Several investigators offeredseismological explanations for the observed dependencyof V/H on distance that are related to S-to-P-wave conversionand the dominance of incident SV and P waves, dependingon the source-to-site distance and other geological conditions(Kawase and Aki, 1990; Silva, 1997; Amirbekian and Bolt,1998; Beresnev et al., 2002). These discussions are beyondthe scope of this study, and the interested reader is referredto the literature cited previously in this paper for furtherinformation. The V/H becomes maximum at very short
periods and attains minimum values at T � 0:20 s andT � 0:40 s.
Exploration of Functional Forms
Three functional forms are investigated in the light ofobservations presented in the previous section. The basefunctional form is presented in equation (1), which consid-ers magnitude-dependent geometrical spreading and alsoincludes a second-order magnitude term to account for thesaturation effects. This functional form has been used inAkkar and Bommer (2007a, 2007b, 2010) and Bommer et al.(2007) to estimate PGA, peak ground velocity (PGV),and 5%-damped spectral ordinates for the previous versionsof the pan-European strong-motion databases:
log10�Y� � b1 � b2Mw � b3M2w
� �b4 � b5Mw� log10�������������������R2JB � b26
q� b7SS
� b8SA � b9FN � b10FR: (1)
In equation (1), SS and SA are dummy variables takingthe value of 1 for soft (180 m=s ≤ VS30 < 360 m=s) and stiff
Figure 4. Average V/H ratios as a function of distance for a set of spectral periods for three magnitude intervals: 4:5≤ Mw <5:5,5:5≤ Mw <6:5, and Mw ≥6:5. The average V/H ratios are calculated for distance bins of 10 km. The data are initially modified forstrike-slip and rock site conditions by using empirical scaling factors obtained from a preliminary set of regression analyses.
1788 J. J. Bommer, S. Akkar, and Ö. Kale

(360 m=s ≤ VS30 < 750 m=s) sites, respectively (and 0 other-wise), and FN and FR are similarly defined for normal andreverse faulting earthquakes, respectively. The hypotheticaldepth term b6 is kept as 7.5 km while exploring the func-tional forms.
Figure 5 presents the median V/H trends obtained byrunning the regression analysis for equation (1). The regres-sion analysis is conducted using the one-stage maximum-likelihood technique proposed in Joyner and Boore(1993). The plots use the same set of spectral periods givenin Figure 4 and show the variation in median V/H as a func-tion of distance for Mw 5, 6, and 7 (midpoints of magnitudeclusters used for the discussion of actual data trends inFigure 4). The median curves in Figure 5 display a signifi-cant sensitivity to the changes in magnitude at short periods.For PGA, the median V/H curve of Mw 5 is between thecorresponding curves of Mw 6 and 7, for which it wouldbe difficult to provide a physical explanation. As for thelonger-period (i.e., T ≥ 0:4 s) median V/H behavior, theambiguity in terms of magnitude scaling still persists. Thistime the median V/H curves ofMw 7 almost overlap theMw 6median curves. These observations are contrary to the actualdata trends discussed in the previous section, and they sug-gest not using equation (1) for estimating the V/H ratio. It
may also be the case that the database used in this studymay not be sufficient to fully constrain the complex seis-mological estimator terms in equation (1). On the basis ofthe preceding discussions, two simplified versions of equa-tion (1) are evaluated to determine the most appropriate func-tional form for the proposed V/H model. The first simplifiedversion mutes the coefficient b5 (magnitude-dependentmultiplier on the distance term), and the second version (thesimplest among all tested functional forms) mutes both b3(second-order magnitude term that accounts for saturationeffects) and b5. Median V/H ratios are presented in Figure 6for the second simplified version. In view of the mediancurves presented in Figure 6, the simplest functional formseems to fit very well the V/H trends of the actual data. Thisform avoids the deficiencies discussed for equation (1) andyields unbiased estimations that are verified by conventionalresidual analysis, which is described in detail in the nextsection.
Regression Analyses
Regression analyses to estimate V/H ratios for PGA and5%-damped spectral accelerations up to a period of 3.0 s areconducted for the simplest functional form that is found to beoptimal with respect to the other two alternatives. We do not
Figure 5. Median V/H trends for a set of spectral periods as a function of magnitude and distance using equation (1).
A Model for Vertical-to-Horizontal Response Spectral Ratios for Europe and the Middle East 1789
derive V/H ratios for PGV because vertical PGV is not widelyused in current engineering design practice. The aleatoryvariability is represented by homoscedastic sigma, as inthe case of Akkar and Bommer (2010), and it is decomposedinto inter- and intraevent components. The final functionalform is given in equation (2) for completeness:
log10�V=H� � b1 � b2Mw � b4 log10
�������������������R2JB � b26
q� b7SS
� b8SA � b9FN � b10FR: (2)
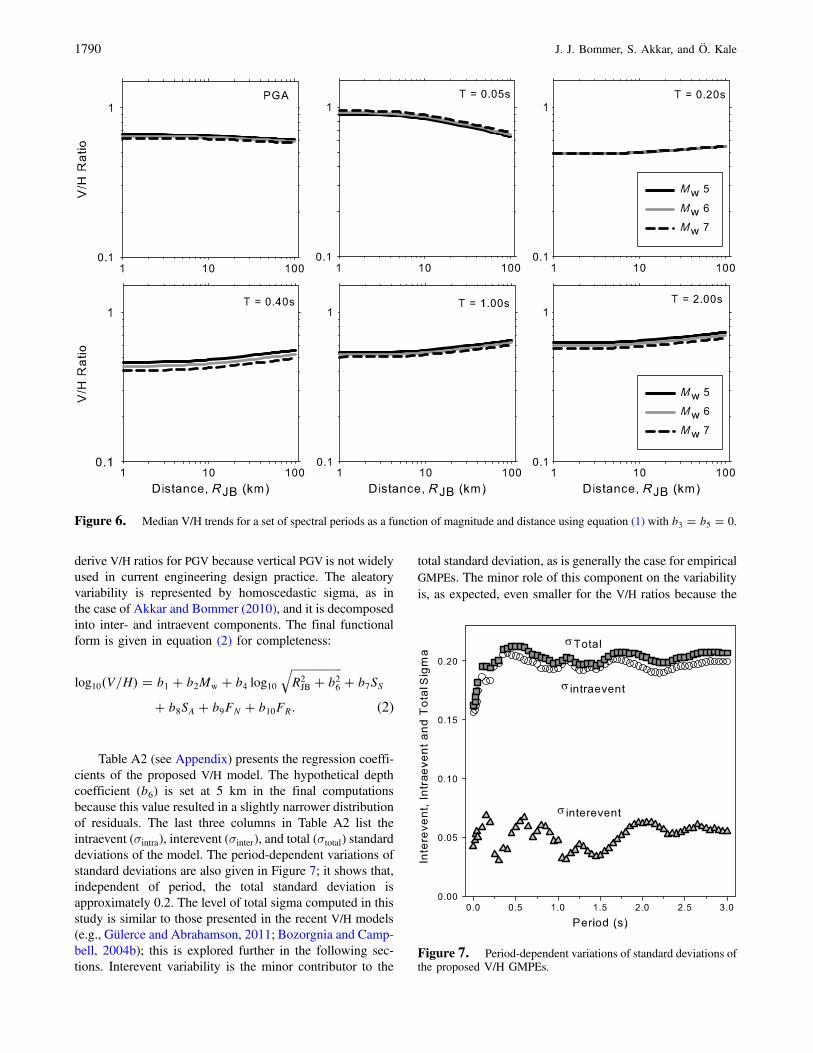
Table A2 (see Appendix) presents the regression coeffi-cients of the proposed V/H model. The hypothetical depthcoefficient (b6) is set at 5 km in the final computationsbecause this value resulted in a slightly narrower distributionof residuals. The last three columns in Table A2 list theintraevent (σintra), interevent (σinter), and total (σtotal) standarddeviations of the model. The period-dependent variations ofstandard deviations are also given in Figure 7; it shows that,independent of period, the total standard deviation isapproximately 0.2. The level of total sigma computed in thisstudy is similar to those presented in the recent V/H models(e.g., Gülerce and Abrahamson, 2011; Bozorgnia and Camp-bell, 2004b); this is explored further in the following sec-tions. Interevent variability is the minor contributor to the
total standard deviation, as is generally the case for empiricalGMPEs. The minor role of this component on the variabilityis, as expected, even smaller for the V/H ratios because the
Figure 6. Median V/H trends for a set of spectral periods as a function of magnitude and distance using equation (1) with b3 � b5 � 0.
Figure 7. Period-dependent variations of standard deviations ofthe proposed V/H GMPEs.
1790 J. J. Bommer, S. Akkar, and Ö. Kale
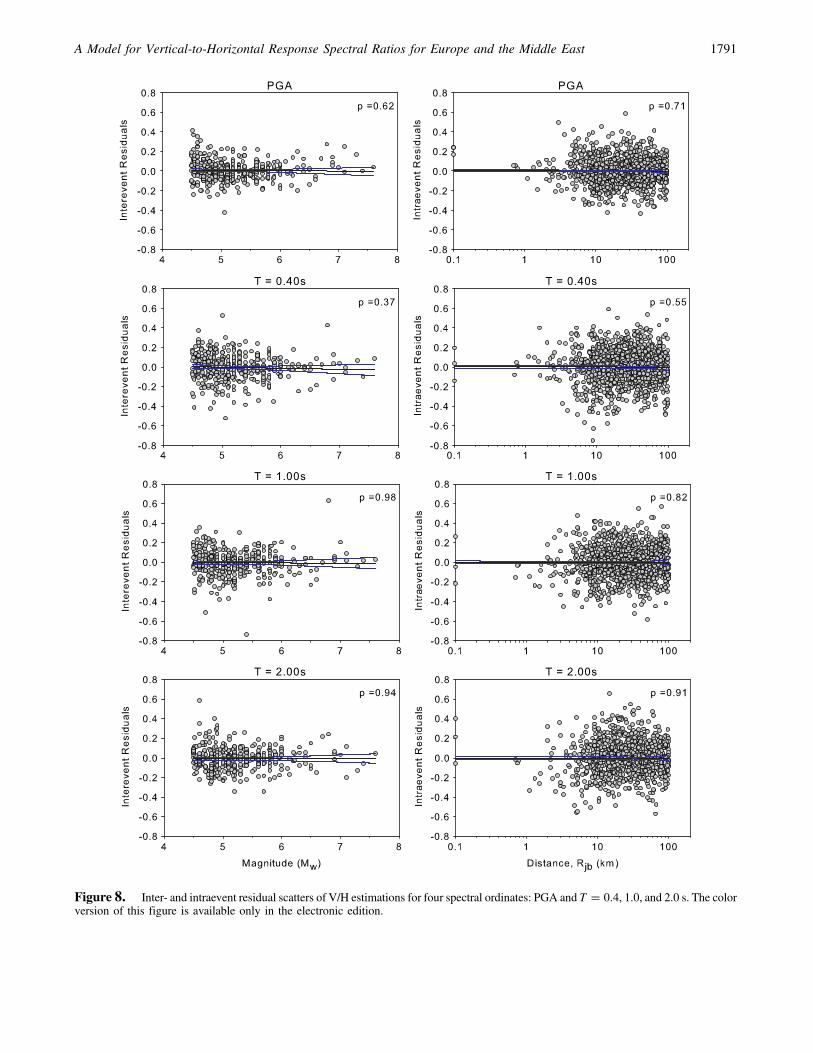
Figure 8. Inter- and intraevent residual scatters of V/H estimations for four spectral ordinates: PGA and T � 0:4, 1.0, and 2.0 s. The colorversion of this figure is available only in the electronic edition.
A Model for Vertical-to-Horizontal Response Spectral Ratios for Europe and the Middle East 1791

interevent terms of vertical and horizontal ground-motioncomponents (which are correlated) cancel each other, whichresults in an overall reduction in the interevent variability ofthe proposed model.
The overall performance of the proposed V/H GMPEsis evaluated through conventional residual analysis. Figure 8shows the inter- and intraevent residual scatters of prese-lected short- to long-period V/H estimates (i.e., PGA andT � 0:4, 1.0, and 2.0 s). The possible bias in median V/Hestimates with respect to magnitude is investigatedby studying the interevent residual trends (left panel ineach row). The dependence of median V/H estimates ondistance is explored from the intraevent residuals (rightpanel in each row). The plots also contain straight-line fitsand their 95% confidence intervals to better visualize thepossible trends in residuals in terms of these estimatorparameters. Whenever the straight-line fits have a slopeterm that is significantly different than zero, the V/H esti-mates can be considered as biased for the correspondingestimator parameter.
We applied sample t statistics to test the null hypothesisthat the slope term of a straight-line fit is zero. The signif-icance level (p) provided by this statistical test is used forrejecting or not rejecting the null hypothesis. A p value thatis well above 0.05 is generally accepted as sufficient for notrejecting the null hypothesis, namely the insignificance ofthe slope term in the straight-line fit. The results in Figure 8indicate a fairly good performance in the median V/H esti-mates from the model proposed in this study. The p valuespresented in the upper right corners of the magnitude- anddistance-dependent residual plots attain values much largerthan 0.05. This observation suggests that the slopes of thestraight-line fits are not significant and that there is nomodel misfit for magnitude and distance. Relatively largeresiduals at the high- and low-magnitude ranges can resultfrom the uneven data distribution toward larger magnitudesand increased magnitude uncertainty for smaller events.Nonetheless, the overall evaluations suggest an acceptablelevel of accuracy in the V/H estimates of the proposedmodel.
Figure 9. Median V/H spectra for different magnitude and distance ranges computed from the proposed model.
1792 J. J. Bommer, S. Akkar, and Ö. Kale

Predicted V/H Spectral Ratios
Variations in median V/H under the influence of theconsidered explanatory variables are presented in this sectionthrough different scenarios. We also compared the estima-tions of our model with the recent V/H GMPEs of Gülerceand Abrahamson (2011) and Bozorgnia and Campbell(2004b) (abbreviated as GA11 and BC04, respectively). Thesemodels constitute the most up-to-date developments on V/Hratio predictions and provide sigma values that are a funda-mental requirement for this application.
Median V/H Ratios of the Proposed Modeland Associated Variability
Figure 9 shows the variation of median V/H spectra forthe entire period band by considering the specific magnitude
and distance combinations for strike-slip faulting and rocksite conditions. V/H ratios corresponding to PGA are pre-sented at T � 0:01 s in Figure 9, as well as in Figures 10to 15, because PGA mimics the spectral acceleration atT � 0:01 s. The plots confirm the negligible effect ofmagnitude on V/H ratios. Small magnitude events result inslightly larger V/H ratios at very short periods (i.e.,T ≤ 0:04 s) and for T > 0:2 s. This trend is reversed betweenthese two response periods. The V/H ratio attains its maxi-mum at very short periods that increase slightly with increas-ing distance. Independent of the variations in magnitude anddistance, the V/H spectrum tends to increase for T ≥ 0:5 s.This trend is more noticeable at larger distances.
Figures 10 and 11 show the median V/H estimationsfor different site classes and style of faulting, respectively.Both figures consider a site located 5 km from the causative
Figure 10. Median V/H spectra for different site classes for a site located at a distance of RJB � 5 km from a strike-slip fault.
Figure 11. Median V/H spectra for different style of faulting for a rock site located RJB � 5 km from the causative source.
A Model for Vertical-to-Horizontal Response Spectral Ratios for Europe and the Middle East 1793
fault rupture of small and large magnitude earthquakeswith Mw 5 and 7, respectively. The V/H spectra in Figure 10indicate that the site term becomes influential for T > 0:20 s,and it is independent of the variations in magnitude. The dif-ference between the V/H ratios steadily increases with thestiffness of the site, and it becomes more apparent towardslonger periods. The V/H plots in Figure 11 show the dom-inance of strike-slip events in the short-period interval withrespect to the other style of faulting. The median V/H valuesresulting from normal and reverse events exceed the strike-slip V/H ratios as the period shifts toward the long-periodrange of the spectrum. These patterns are consistent withthe predictive V/H models proposed by Bozorgnia andCampbell (2004b) and Gülerce and Abrahamson (2011).The latter models also suggest the dominance of strike-slip V/H ratios in the short periods that are overtaken byeither normal or reverse style of faulting in the longerperiod range.
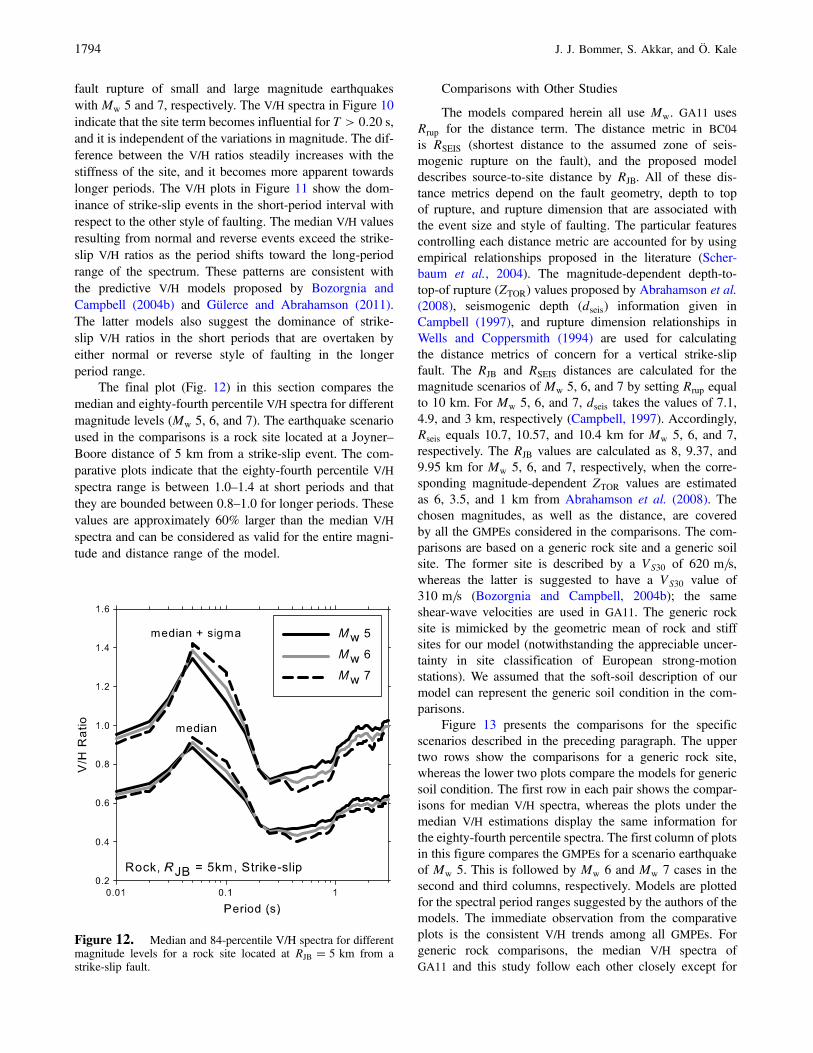
The final plot (Fig. 12) in this section compares themedian and eighty-fourth percentile V/H spectra for differentmagnitude levels (Mw 5, 6, and 7). The earthquake scenarioused in the comparisons is a rock site located at a Joyner–Boore distance of 5 km from a strike-slip event. The com-parative plots indicate that the eighty-fourth percentile V/Hspectra range is between 1.0–1.4 at short periods and thatthey are bounded between 0.8–1.0 for longer periods. Thesevalues are approximately 60% larger than the median V/Hspectra and can be considered as valid for the entire magni-tude and distance range of the model.
Comparisons with Other Studies
The models compared herein all use Mw. GA11 usesRrup for the distance term. The distance metric in BC04is RSEIS (shortest distance to the assumed zone of seis-mogenic rupture on the fault), and the proposed modeldescribes source-to-site distance by RJB. All of these dis-tance metrics depend on the fault geometry, depth to topof rupture, and rupture dimension that are associated withthe event size and style of faulting. The particular featurescontrolling each distance metric are accounted for by usingempirical relationships proposed in the literature (Scher-baum et al., 2004). The magnitude-dependent depth-to-top-of rupture (ZTOR) values proposed by Abrahamson et al.(2008), seismogenic depth (dseis) information given inCampbell (1997), and rupture dimension relationships inWells and Coppersmith (1994) are used for calculatingthe distance metrics of concern for a vertical strike-slipfault. The RJB and RSEIS distances are calculated for themagnitude scenarios of Mw 5, 6, and 7 by setting Rrup equalto 10 km. For Mw 5, 6, and 7, dseis takes the values of 7.1,4.9, and 3 km, respectively (Campbell, 1997). Accordingly,Rseis equals 10.7, 10.57, and 10.4 km for Mw 5, 6, and 7,respectively. The RJB values are calculated as 8, 9.37, and9.95 km for Mw 5, 6, and 7, respectively, when the corre-sponding magnitude-dependent ZTOR values are estimatedas 6, 3.5, and 1 km from Abrahamson et al. (2008). Thechosen magnitudes, as well as the distance, are coveredby all the GMPEs considered in the comparisons. The com-parisons are based on a generic rock site and a generic soilsite. The former site is described by a VS30 of 620 m=s,whereas the latter is suggested to have a VS30 value of310 m=s (Bozorgnia and Campbell, 2004b); the sameshear-wave velocities are used in GA11. The generic rocksite is mimicked by the geometric mean of rock and stiffsites for our model (notwithstanding the appreciable uncer-tainty in site classification of European strong-motionstations). We assumed that the soft-soil description of ourmodel can represent the generic soil condition in the com-parisons.
Figure 13 presents the comparisons for the specificscenarios described in the preceding paragraph. The uppertwo rows show the comparisons for a generic rock site,whereas the lower two plots compare the models for genericsoil condition. The first row in each pair shows the compar-isons for median V/H spectra, whereas the plots under themedian V/H estimations display the same information forthe eighty-fourth percentile spectra. The first column of plotsin this figure compares the GMPEs for a scenario earthquakeof Mw 5. This is followed by Mw 6 and Mw 7 cases in thesecond and third columns, respectively. Models are plottedfor the spectral period ranges suggested by the authors of themodels. The immediate observation from the comparativeplots is the consistent V/H trends among all GMPEs. Forgeneric rock comparisons, the median V/H spectra ofGA11 and this study follow each other closely except for
Figure 12. Median and 84-percentile V/H spectra for differentmagnitude levels for a rock site located at RJB � 5 km from astrike-slip fault.
1794 J. J. Bommer, S. Akkar, and Ö. Kale

Figure 13. Comparisons of selected V/H GMPEs with the proposed model at different magnitudes for a generic rock site (upper 2 rows)and generic soil site (lower 2 rows) located at a distance of Rrup � 10 km from a vertical strike-slip fault (i.e., dip angle, δ � 90°).The selected models are abbreviated with the initials of their developers: GA11 stands for Gülerce and Abrahamson (2011) and BC04is Bozorgnia and Campbell (2004b).
A Model for Vertical-to-Horizontal Response Spectral Ratios for Europe and the Middle East 1795

the short-period V/H values of the Mw 7 case, where GA11yields higher estimations. The discrepancy between ourmodel and that in GA11 increases with increasing magnitudefor the median estimations of generic soil class. Specula-tively, this can be attributed to the lack of soil nonlinearityin our model, as well as to the uncertainty imposed by thegeneric site class definitions in our database. Regardless ofthe magnitude, the discrepancy between these models in-crease for the eighty-fourth percentile spectra as GA11 esti-mations are considerably higher than this study. The BC04model generally agrees well with this study and GA11 forT > 0:1 s, independent of the variations in magnitude, site,and exceedance level. The BC04 model estimates rather highV/H ratios at short periods with respect to GA11 and thisstudy for rock sites. Both GA11 and BC04 predict similarmedian V/H estimations for the generic soil at short periods,but this consistent trend diminishes for the eighty-fourth per-centile spectra, as BC04 estimates are higher with respect toGA11. We believe that any apparent regional differences atthe larger magnitudes that drive seismic hazard assessmentsarise predominantly from data distributions and functionalforms rather than pronounced and systematic regional differ-ences. Having said this, the presented model as well as theother ones discussed in the paper, are applicable to activeregions of shallow crustal seismicity, and additional workwould be required before applying them to subduction zonesor stable continental regions. Figure 14 compares the totalsigma values (transformed to natural logarithms) from thesethree models, all of which are heteroscedastic except for thenew model derived in this study. As can be immediately ap-preciated from this figure the aleatory variability of the cur-rent model is generally rather low compared with the others.For the Mw 7.5 case, the Bozorgnia and Campbell (2004b)model has slightly smaller sigma values at longer periodswith respect to the new model.
The last set of comparisons presented in this sectioncomprise the V/H ratios obtained from our model and thoseof Ambraseys et al. (2005a, 2005b) that estimate the horizon-tal and vertical spectral ordinates from separate expressions.The Ambraseys et al. model was derived using a differentdataset for estimating the ground motions for Europe andthe Middle East. Because it estimates the maximum oftwo horizontal components, we used the empirical adjust-ment factors in Beyer and Bommer (2006, 2007) to converttheir horizontal spectral estimates to a geometric-mean hor-izontal-component definition. No further adjustment isrequired between the two models because they use the sameestimator parameters for magnitude and distance. Both mod-els use the same methodology for site classification. Thecomparisons are done only for the rock site scenario thatis described in the previous paragraphs and are presentedin Figure 15. The models agree fairly well forMw 6 but differfor the smaller (Mw 5) and larger (Mw 7) events. Theobserved differences at large and small magnitudes tendto diminish with increasing period (i.e., T > 0:2 s). TheV/H ratios calculated from Ambraseys et al. (2005a, 2005b)are sensitive to the magnitude variations, which is observedneither in our model nor in the models discussed in theprevious paragraphs. The pronounced differences betweenthese two pan-European models may stem from the databasedifferences. The database presented in this study is largerthan the Ambraseys et al. database; it also contains moreup-to-date metadata information, particularly for the siteclasses of strong-motion stations. Another source of differ-ence between these models could be the discrepancy in thelower magnitude limits because Ambraseys et al. (2005a,2005b) considers events with Mw ≥5, whereas the smallestmagnitude in our model is Mw 4.5. Differences in the mag-nitude ranges of predictive models may seriously affect theirground-motion estimations (Bommer et al., 2007).
Figure 14. Total sigmas of ln�V=H� for spectral ordinates as a function of response period for the four models and for small (left) andlarge (right) magnitudes.
1796 J. J. Bommer, S. Akkar, and Ö. Kale

Discussion and Conclusions
In this paper we have presented a model for the pre-diction of the ratios of vertical-to-horizontal spectral accel-erations at response periods up to 3.0 s, using strong-motiondata from Europe and the Middle East. We believe that themodel can be used to estimate the distribution of V/H ratiosof ground motions generated by shallow crustal earthquakesin this region with magnitudes from Mw 4.5 to 7.6. Theequations predict V/H ratios as a function of magnitude,style of faulting (reverse, normal, strike-slip), distance,and site classification (rock, stiff soil, soft soil). The equa-tions are applicable for Joyner–Boore distances up to100 km, which is likely to be sufficient because V/H ratioswill generally be applied to scenarios determined from dis-aggregation of PSHA. For regions of crustal seismicity andfor annual exceedance frequencies of engineering interest,the controlling earthquake scenarios will usually be locatedat relatively short source-to-site distances. The model uses arather simple functional form, and its extrapolation for mag-nitudes and distances exceeding the bounds of the datasetshould be performed with caution.
This new V/H model addresses a lack of predictiveequations for the logarithm of vertical-to-horizontal ratiosof response spectral ordinates as a function of these explan-atory variables, and it is the first such model derived specif-ically for application in the European, Mediterranean, andMiddle Eastern regions. In order to fully address the issueof epistemic uncertainty in ground-motion prediction, asingle predictive model is not sufficient. Having said this,fewer models are required for V/H ratios than those includedin the logic-tree formulation for the horizontal responsespectra (e.g., Bommer et al., 2005) because the epistemicuncertainty in the ground motion will already be capturedto a large degree in the horizontal motion. Nonetheless, a
comprehensive PSHA should also address the epistemicuncertainty in the prediction of the V/H ratios. A feasibleapproach would be to combine this new model with that ofGülerce and Abrahamson (2011), which is derived from theNGA dataset and, if a third model is required, that ofBozorgnia and Campbell (2004b), notwithstanding that thelatter does not cover the shortest response periods. Becauseit has been shown that the NGA models are applicable to theEuropean region (Stafford et al., 2008), combining theGülerce and Abrahamson (2011) model with the modelpresented in this paper may offer a suitable way to captureepistemic uncertainty in V/H ratios for seismic hazard ana-lyses in Europe. We might also dare to suggest that pendingthe publication of new V/H models from the NGA-West 2project (see Data and Resources), the same combinationof V/H models could be used meanwhile in hazard studiesin western North America. The two models—Gülerce andAbrahamson (2011) and our European model—are compa-tible, or at least consistent, in terms of parameter defini-tions, a fact that facilitates their combination. Oneexception to this is that, whereas their model employsthe Rrup distance metric, we use RJB; this means that adjust-ments will be needed (Scherbaum et al., 2004), or the earth-quake sources will need to be simulated in the hazardcalculations in a way that allows the two distance metricsto be calculated correctly for each scenario (Scherbaumet al., 2006). The other important difference between ourmodel and the Gülerce and Abrahamson (2011) model isthe definition of site terms, for which the latter use a con-tinuous VS30-dependent function and the former is based ongeneric site classes (an abiding weakness due to the lack ofwell-determined VS30 values for strong-motion sites inEurope). Nonetheless, the close agreement between theNGA and global pan-European models (e.g., Stafford et al.,2008; Campbell and Bozorgnia, 2006) encourages their
Figure 15. Comparisons of median V/H ratios between Ambraseys et al. (2005a, b) (left) and this study (right) for the same scenariodescribed in Figure 13.
A Model for Vertical-to-Horizontal Response Spectral Ratios for Europe and the Middle East 1797

complementary use for defining the hazard in Europe andthe surrounding regions.
An element missing from this study is a model for theperiod-to-period correlations between the residuals of theV/H ratios and the residuals of the horizontal spectralordinates, which are required to generate vertical CMS, asdescribed by Gülerce and Abrahamson (2011). As noted inthe Introduction, the vertical CMS produced from such amethodology is the most realistic way of considering theinteraction between the horizontal and vertical motions thatcan serve for the scaling of three-component accelerationtime-histories in structural analysis. This requires the genera-tion of a compatible GMPE for the horizontal spectral ordi-nates, which is beyond the scope of this paper. However,because our next project is the development of a newEuropean GMPE for the prediction of spectral ordinatesfor an extended range of magnitudes, which will be devel-oped from the full dataset that was considered for this study,such a correlation model will be generated as part of thatendeavor. In the meantime, we recommend the use of themodel of Gülerce and Abrahamson (2011) for this purpose.
Data and Resources
The ground motions used in this study are obtained from(a) the web site www.daphne.deprem.gov.tr, operated andmaintained by the Earthquake Division of the TurkishDisaster and Emergency Management Agency (DEMA),(b) the Italian strong-motion database, available at www.itaca.mi.ingv.it, and (c) the Internet-Site for European Strong-Motion Data, available at http://www.isesd.hi.is/ESD_Local/frameset.htm.
The NGA-West 2 project is available at http://peer.berkeley.edu/ngawest2/index.html.
Acknowledgments
The work was originally conducted for the PEGASOS RefinementProject, and we acknowledge the support from that project. The workto develop the strong-motion database used herein and the processingof the horizontal components of the records have been supported by theSHARE (Seismic Hazard Harmonization in Europe) project, funded undercontract 226967 of the EC-Research Framework Programme FP7. Withinthe context of that project, we would like to express our thanks to EmrahYenier for his assistance in the processing of the horizontal strong-motiondata employed in this study. We also benefitted significantly from the con-structive comments of two anonymous reviewers, who helped to improvethe overall quality of the paper, and we acknowledge their contributionswith gratitude.
References
Abrahamson, N. A., G. Atkinson, D. M. Boore, Y. Bozorgnia, K. Campbell,B. Chiou, I. M. Idriss, W. Silva, and R. Youngs (2008). Comparisonof the NGA ground-motion relations, Earthq. Spectra 24, no. 1,45–66.
Abrahamson, N. A., and W. J. Silva (1997). Empirical response spectralattenuation relations for shallow crustal earthquakes, Seismol. Res.Letters 68, no. 1, 94–127.
Abrahamson, N. A., and W. J. Silva (2008). Summary of the Abrahamsonand Silva NGA ground motion relations, Earthq. Spectra 24, no. 1,67–98.
Akkar, S., and J. J. Bommer (2006). Influence of long-period filter cut-off onelastic spectral displacements, Earthq. Eng. Struct. Dyn. 35, no. 9,1145–1165.
Akkar, S., and J. J. Bommer (2007a). Prediction of elastic displacementresponse spectra in Europe and the Middle East, Earthq. Eng. Struct.Dyn. 36, 1275–1301.
Akkar, S., and J. J. Bommer (2007b). Empirical prediction equationsfor peak ground velocity derived from strong-motion recordsfrom Europe and the Middle East, Bull. Seismol. Soc. Am. 97,1275–1301.
Akkar, S., and J. J. Bommer (2010). Empirical equations for theprediction of PGA, PGV and spectral accelerations in Europe, theMediterranean region and the Middle East, Seismol. Res. Lett. 81,no. 1, 195–206.
Akkar, S., Z. Çağnan, E. Yenier, Ö. Erdoğan, A. Sandıkkaya, and P. Gülkan(2010). The recently compiled Turkish strong motion database:Preliminary investigation for the seismological parameters, J. Seismol.14, no. 3, 457–479.
Akkar, S., Ö. Kale, E. Yenier, and J. J. Bommer (2011). The high-frequencylimit of usable response spectral ordinates from filtered analogueand digital strong-motion accelerograms, Earthq. Eng. Struct. Dyn.40, doi 10.1002/eqe.1095.
Ambraseys, N. N., and J. Douglas (2003). Near-field horizontal andvertical earthquake ground motions, Soil Dyn. Earthq. Eng. 23,no. 1, 1–18.
Ambraseys, N. N., J. Douglas, P. Smit, and S. K. Sarma (2005a). Equationsfor the estimation of strong ground motions from shallow crustal earth-quakes using data from Europe and the Middle East: Horizontal peakground acceleration and spectral acceleration, Bull. Earthq. Eng. 3,no. 1, 1–53.
Ambraseys, N. N., J. Douglas, P. Smit, and S. K. Sarma (2005b). Equationsfor the estimation of strong ground motions from shallow crustalearthquakes using data from Europe and the Middle East: Vertical peakground acceleration and spectral acceleration, Bull. Earthq. Eng. 3,no. 1, 55–73.
Ambraseys, N. N., and K. A. Simpson (1996). The prediction of verticalresponse spectra in Europe, Earthq. Eng. Struct. Dyn. 25, 401–412.
Ambraseys, N. N., K. A. Simpson, and J. J. Bommer (1996). The predictionof horizontal response spectra in Europe, Earthq. Eng. Struct. Dyn. 25,371–400.
Amirbekian, R. V., and B. A. Bolt (1998). Spectral comparison of verticaland horizontal seismic strong ground motions in alluvial basins,Earthq. Spectra 14, 573–595.
Baker, J. W., and C. A. Cornell (2006). Spectral shape, epsilon and recordselection, Earthq. Eng. Struct. Dyn. 35, 1077–1095.
Beresnev, I. A., A. M. Nightengale, and W. J. Silva (2002). Properties ofvertical ground motions, Bull. Seismol. Soc. Am. 92, 3152–3164.
Berge-Thierry, C., F. Cotton, O. Scotti, D.-A. Griot-Pommera, andY. Fukushima (2003). New empirical spectral attenuation laws formoderate European earthquakes, J. Earthq. Eng. 7, no. 2, 193–222.
Beyer, K., and J. J. Bommer (2006). Relationships between median valuesand between aleatory variabilities for different definitions of thehorizontal component of motion, Bull. Seismol. Soc. Am. 96, no. 4A,1512–1522.
Beyer, K., and J. J. Bommer (2007). Erratum to relationships betweenmedian values and between aleatory variabilities for differentdefinitions of the horizontal component of motion, Bull. Seismol.Soc. Am. 97, no. 5, 1769.
Bindi, D., L. Luzi, M. Massa, and F. Pacor (2010). Horizontal and verticalground motion prediction equations derived from the Italianaccelerometric archive (ITACA), Bull. Earthq. Eng. 8, no. 5, 1209–1230.
Bindi, D., S. Parolai, H. Grosser, C. Milkereit, and E. Durukal (2007).Empirical ground-motion prediction equations for northwestern
1798 J. J. Bommer, S. Akkar, and Ö. Kale
Turkey using the aftershocks of the 1999 Kocaeli earthquake,Geophys. Res. Lett. 34, L08305, doi 10.1029/2007GL029222.
Bommer, J. J., F. Scherbaum, H. Bungum, F. Cotton, F. Sabetta, andN. A. Abrahamson (2005). On the use of logic trees for ground-motionprediction equations in seismic hazard assessment, Bull. Seismol. Soc.Am. 95, no. 2, 377–389.
Bommer, J. J., P. Stafford, J. Alarcon, and S. Akkar (2007). The influenceof magnitude range on empirical ground-motion prediction, Bull. Seis-mol. Soc. Am. 97, no. 6, 2152–2170.
Boore, D. M., W. B. Joyner, and T. E. Fumal (1997). Equations for estimat-ing horizontal response spectra and peak acceleration from westernNorth American earthquakes: A summary of recent work, Seismol.Res. Lett. 68, no. 1, 128–153.
Bozorgnia, Y., and K. W. Campbell (2004a). Engineering characterization ofground motion, in Earthquake Engineering: From EngineeringSeismology to Performance-Based Engineering, Y. Bozorgnia andV. V. Bertero (Editors), CRC Press, Boca Raton, Florida,215–315.
Bozorgnia, Y., and K. W. Campbell (2004b). The vertical-to-horizontalspectral ratio and tentative procedures for developing simplifiedV/H and vertical design spectra, J. Earthq. Eng. 4, no. 4,539–561.
Bragato, P. L., and D. Slejko (2005). Empirical ground-motion relations forthe Eastern Alps in the magnitude range 2.5–6.3, Bull. Seismol. Soc.Am. 95, no. 1, 252–272.
Campbell, K. W. (1997). Empirical near-source attenuation relationshipsfor horizontal and vertical components of peak ground acceleration,peak ground velocity, and pseudo-absolute acceleration responsespectra, Seismol. Res. Lett. 68, no. 1, 154–179.
Campbell, K. W., and Y. Bozorgnia (2003). Updated near-source groundmotion (attenuation) relations for the horizontal and vertical compo-nents of peak ground acceleration and acceleration response spectra,Bull. Seismol. Soc. Am. 93, no. 1, 314–331.
Campbell, K. W., and Y. Bozorgnia (2006). Next Generation Attenuation(NGA) empirical ground motion models: Can they be used in Europe,paper no. 458, Proceedings of the First European Conference onEarthquake Engineering and Seismology, Geneva, Switzerland, 3–8September 2006.
Cauzzi, C., and E. Faccioli (2008). Broadband (0.05 to 20 s) prediction ofdisplacement response based on worldwide digital records, J. Seismol.12, 453–475.
Chiou, B., R. Darragh, N. Gregor, and W. Silva (2008). NGA project strongmotion database, Earthq. Spectra 24, no. 1, 23–44.
Douglas, J., and D. M. Boore (2011). High-frequency filtering of strong-motion records, Bull. Earthq. Eng., 9, no. 2, 395–409.
Elnashai, A. S., and A. J. Papazoglu (1997). Procedure and spectra foranalysis of RC structures subjected to vertical earthquake loads, J.Earthq. Eng. 1, no. 1, 121–155.
Eurocode 8 (2004). Design of structures for earthquake resistance, part 1:General rules, seismic actions, and rules for buildings, EN 1998-1, Eur-opean Committee for Standardization (CEN), http://www.cen.eu/cenorm/homepage.htm.
Frohlich, C., and K. D. Apperson (1992). Earthquake focal mechanisms,moment tensors, and the consistency of seismic activity near plateboundaries, Tectonics 11, 279–296.
Gülerce, Z., and N. A. Abrahamson (2011). Site-specific spectra for verticalground motion, Earthq. Spectra, 27, no. 4 (in press).
Joyner, W. B., and D. M. Boore (1993). Methods for regression analysis ofstrong-motion data, Bull. Seismol. Soc. Am. 83, 469–487.
Kalkan, E., and P. Gülkan (2004a). Empirical attenuation equations forvertical ground motion in Turkey, Earthq. Spectra 20, no. 3,853–882.
Kalkan, E., and P. Gülkan (2004b). Site-dependent spectra derivedfrom ground motion records in Turkey, Earthq. Spectra 20, no. 4,111–1138.
Kawase, H., and K. Aki (1990). Topography effect at the critical SV-waveincidence: Possible explanation of damage pattern by the Whittier
Narrows, California, earthquake of 1 October 1987, Bull. Seismol.Soc. Am. 80, 1–30.
Lussou, P., P.-Y. Bard, F. Cotton, and Y. Fukushima (2001). Seismic designregulation codes: Contributions of K-Net data to site effect evaluations,J. Earthq. Eng. 5, no. 1, 13–33.
Luzi, L., S. Hailemikael, D. Bindi, F. Pacor, F. Mele, and F. Sabetta (2008).ITACA (ITalian ACcelerometric Archive): A web portal for thedissemination of Italian strong-motion data, Seismol. Res. Lett. 79,no. 1, 716–772.
Malhotra, P. K. (2006). Smooth spectra of horizontal and vertical groundmotions, Bull. Seismol. Soc. Am. 96, no. 2, 506–518.
Massa, M., P. Morasca, L. Moratto, S. Marzorati, G. Costa, andD. Spallarossa (2008). Empirical ground-motion equations for north-ern Italy using weak- and strong-motion amplitudes, frequency con-tent, and duration parameters, Bull. Seismol. Soc. Am. 98, no. 3,1319–1342.
McGuire, R. K., W. J. Silva, and C. J. Costantino (2001). Technical basis forrevision of regulatory guidance on design ground motions: Hazard-and risk-consistent ground motion spectra guidelines, U.S. NuclearRegulatory Commission NUREG/CR-6728, Washington, D.C.,1020 pp
Morasca, P., F. Zolezzi, D. Spallarossa, and L. Luzi (2008). Ground motionmodels for the Molise region (southern Italy), Soil Dyn. Earthq. Eng.28, 198–211.
National Earthquake Hazards Reduction Program (NEHRP; 2009). 2009NEHRP recommended seismic provisions for new buildings and otherstructures: Part 1, Provisions, National Earthquake HazardsReduction Program, Washington D.C., 373 pp.
Sabetta, F., and A. Pugliese (1996). Estimation of response spectra andsimulation of nonstationary earthquake ground motions, Bull. Seismol.Soc. Am. 86, no. 2, 337–352.
Sadigh, K., C. Y. Chang, J. A. Egan, F. Makdisi, and R. R. Youngs (1997).Attenuation relationships for shallow crustal earthquakes basedon California strong motion data, Seismol. Res. Lett. 68, no. 1,180–189.
Scherbaum, F., J. J. Bommer, F. Cotton, H. Bungum, and F. Sabetta(2006). Ground-motion prediction in PSHA: A post-PEGASOS per-spective, paper no. 1312, Proceedings of the First European Confer-ence on Earthquake Engineering, Geneva, Switzerland, 3–8September 2006.
Scherbaum, F., J. Schmedes, and F. Cotton (2004). On the conversion ofsource-to-site distance measures for extended earthquake sourcemodels, Bull. Seismol. Soc. Am. 94, no. 3, 1053–1069.
Silva, W. (1997). Characteristics of vertical strong ground motions forapplications to engineering design, in Proceedings of the FHWA/NCEER Workshop on the National Representation of Seismic GroundMotion for New and Existing Highway Facilities, Tech. Rept. NCEER-97-0010, M. Friedland, M. S. Power, and R. L. MayesNational Centerfor Earthquake Engineering Research, Buffalo, New York, 205–252.
Stafford, P. J., F. O. Strasser, and J. J. Bommer (2008). An evaluation of theapplicability of the NGA models to ground motion prediction in theEuro-Mediterranean region, Bull. Earthq. Eng. 6,149–177.
Thenhaus, P. C., and K. W. Campbell (2002). Seismic hazard analysis, inEarthquake Engineering Handbook W.-F. Chen and C. Scawthorn(Editors), CRC Press, Boca Raton, Florida, 8-1–8-43.
United States Atomic Energy Commission (USAEC; 1973). Designresponse spectra for seismic design of nuclear power plants, Regula-tory Guide RG 1.60, Atomic Energy Commission, Washington, D.C.
Wells, D. L., and K. J. Coppersmith (1994). New empirical relationshipsamong magnitude, rupture length, rupture width, rupture area, andsurface displacement, Bull. Seismol. Soc. Am. 84, 974–1002.
Appendix
Major features of earthquakes in the database (from Am-braseys et al., 2005a; Akkar and Bommer, 2007a, 2007b,
A Model for Vertical-to-Horizontal Response Spectral Ratios for Europe and the Middle East 1799
TableA1
Earthquakes
Usedin
theProposed
V/H
Model
Date
(dd/mm/yyyy)
Tim
eM
wCo*
Depth,
Z(km)
Styleof
Faultin
g,F
Num
berof
Records,N
r
Distance,
RJB
(km)†
14/06/1972
18:55:46
4.8
IT3
S2
8-11
04/11/1973
15:52:12
5.8
GR
7T
111
06/05/1976
20:00:12
6.4
IT12
T3
10-90
09/05/1976
00:53:44
5.1
IT20
T1
3210/05/1976
04:35:53
4.7
IT15
T1
911/05/1976
22:44:00
5.0
IT13
T1
1308/06/1976
12:14:38
4.6
IT19
N3
8-20
11/06/1976
17:16:40
4.5
IT18
N2
5-6
17/06/1976
14:28:47
4.7
IT15
N3
21-27
26/06/1976
11:13:49
4.6
IT26
N3
5-11
14/07/1976
05:39:33
4.5
IT16
T2
2511/09/1976
16:31:10
5.1
IT10
T4
4-16
11/09/1976
16:35:01
5.6
IT9
T5
10-17
13/09/1976
18:54:45
4.6
IT14
N2
11-12
15/09/1976
03:15:18
5.9
IT2
T6
5-19
15/09/1976
04:38:53
4.9
IT21
N4
4-14
15/09/1976
09:21:18
5.9
IT21
T8
5-45
15/09/1976
09:45:56
4.6
IT27
T1
524/11/1976
12:22:16
7.0
TR
10S
152
03/04/1977
03:18:13
4.8
IT9
T1
916/09/1977
23:48:07
5.3
IT21
T5
6-11
11/03/1978
19:20:43
5.2
IT5
N3
9-54
15/04/1978
23:33:47
6.0
IT22
S4
12-37
20/06/1978
20:03:22
6.2
GR
3N
113
16/09/1978
15:35:57
7.3
IR4
T1
809/04/1979
02:10:21
5.4
MO
13T
129
15/04/1979
06:19:41
6.9
MO
12T
83-96
15/04/1979
14:43:06
5.8
MO
7T
322-41
24/05/1979
17:23:18
6.2
MO
5T
515-35
19/09/1979
21:35:37
5.8
IT6
N4
9-39
01/01/1980
16:42:39
6.9
PO5
S1
8005/01/1980
14:32:26
4.8
IT21
T1
1707/06/1980
18:35:01
4.6
IT30
N3
12-26
11/08/1980
09:15:59
5.2
GR
5T
113
26/09/1980
04:19:21
5.0
GR
42N
110
23/11/1980
18:34:53
6.9
IT15
N14
7-86
16/01/1981
00:37:45
5.2
IT11
N12
9-25
14/02/1981
17:27:46
4.9
IT10
T2
27-45
24/02/1981
20:53:39
6.2
GR
18N
28-10
25/02/1981
02:35:53
5.9
GR
30N
119
10/03/1981
15:16:20
5.4
GR
10T
27-21
17/10/1982
06:45:37
4.6
IT6
N1
23
(contin
ued)
TableA1(Con
tinued)
Date
(dd/mm/yyyy)
Tim
eM
wCo*
Depth,
Z(km)
Styleof
Faultin
g,F
Num
berof
Records,N
r
Distance,
RJB
(km)†
17/01/1983
12:41:31
6.3
GR
14T
267-90
31/01/1983
15:27:02
5.4
GR
39N
152
23/03/1983
23:51:08
5.8
GR
13S
170
06/08/1983
15:43:53
6.6
AS
22S
176
26/08/1983
12:52:09
5.2
GR
3S
211-35
09/11/1983
16:29:52
5.0
IT28
T1
2129/04/1984
05:03:00
5.6
IT6
N4
10-47
07/05/1984
17:49:43
5.9
IT21
N7
13-44
11/05/1984
10:41:48
5.5
IT12
N7
9-37
11/05/1984
11:26:16
4.9
IT18
N2
10-16
11/05/1984
13:14:56
5.0
IT14
N3
7-21
11/05/1984
16:39:18
5.0
IT17.5
N2
9-14
24/06/1984
14:30:51
4.9
SPN
129
09/07/1984
18:57:12
5.2
GR
5.0
N1
2109/07/1984
18:57:12
5.2
GR
5.0
N1
2124/08/1984
06:02:26
5.3
DS
18.0
S1
2230/04/1985
18:14:13
5.6
GR
25.5
N1
1509/11/1985
23:30:43
5.2
GR
18.0
N2
19-51
05/05/1986
03:35:38
6.0
TR
4.4
S1
2413/09/1986
17:24:34
6.0
GR
27.6
N1
015/09/1986
11:41:28
5.3
GR
10.0
N3
14-21
27/02/1987
23:34:52
5.5
GR
5.4
N1
3524/04/1987
02:30:29
4.9
IT23.5
S2
5-18
02/05/1987
20:43:55
4.7
IT23.7
S2
7-19
25/05/1987
11:31:56
6.0
IC8.0
S4
24-45
10/06/1987
14:50:12
5.3
GR
30.0
T1
924/04/1988
10:10:33
4.5
GR
3.7
T1
1618/05/1988
05:17:42
5.5
GR
20.7
T2
12-23
05/07/1988
20:34:52
5.5
GR
17.4
N1
2216/10/1988
12:34:05
5.6
GR
25.0
S3
11-49
07/12/1988
07:41:24
6.7
AR
6.0
T1
2022/12/1988
09:56:50
4.9
GR
37.8
N1
607/06/1989
19:45:54
5.2
GR
25.0
S1
2431/08/1989
21:29:31
4.8
GR
32.0
N1
2129/10/1989
19:09:13
5.9
AL
6.0
T1
6105/05/1990
07:21:20
5.8
IT22.5
S3
27-39
05/05/1990
07:38:12
4.8
IT11.3
S1
3420/06/1990
21:00:08
7.4
IR19.0
S4
49-92
13/12/1990
00:24:26
5.6
IT7.0
S5
31-80
16/12/1990
15:45:51
5.4
AR
28.0
S4
15-44
21/12/1990
06:57:43
5.9
GR
13.3
N2
3119/03/1991
12:09:23
5.7
GR
6.8
N1
65
(contin
ued)
1800 J. J. Bommer, S. Akkar, and Ö. Kale

TableA1(Con
tinued)
Date
(dd/mm/yyyy)
Tim
eM
wCo*
Depth,
Z(km)
Styleof
Faultin
g,F
Num
berof
Records,N
r
Distance,
RJB
(km)†
03/05/1991
20:19:39
5.6
CU
15.0
T4
11-28
26/05/1991
12:26:01
5.1
IT30.3
S2
32-42
15/06/1991
00:59:20
6.0
CU
6.0
T3
37-56
23/01/1992
04:24:17
5.4
GR
24.9
T2
14-42
13/03/1992
17:18:40
6.6
TR
22.6
S2
3-63
15/03/1992
16:16:16
5.9
TR
28.5
S2
26-42
06/11/1992
19:08:09
6.0
AS
17.2
S1
3818/11/1992
21:10:41
5.9
GR
15.0
N1
2515/02/1993
14:49:18
4.6
GR
7.1
S1
1726/03/1993
11:45:16
5.1
GR
31.7
S2
2-15
26/03/1993
11:56:14
5.1
GR
26.4
S2
4-13
26/03/1993
11:58:15
5.5
GR
45.2
S1
2429/04/1993
07:54:29
5.1
GR
10.0
S1
313/06/1993
23:26:40
5.6
GR
19.6
T1
3314/07/1993
12:31:50
5.5
GR
12.4
S5
9-30
14/07/1993
12:39:13
4.5
GR
30.0
S2
5-6
04/11/1993
05:18:37
5.3
GR
10.0
N3
10-19
23/12/1993
14:22:34
5.2
SP18.0
N1
604/01/1994
08:03:15
5.2
SP16.0
N2
24-41
25/02/1994
02:30:50
5.5
GR
23.5
S5
12-29
27/02/1994
22:34:52
4.5
GR
10.0
T2
21-28
20/06/1994
09:09:03
5.9
IR9.0
S6
7-58
29/11/1994
14:30:30
5.2
GR
21.0
S2
15-17
03/05/1995
21:36:54
4.9
GR
20N
127
03/05/1995
21:43:27
5.0
GR
24N
227-33
04/05/1995
00:34:11
5.3
GR
14N
328-43
13/05/1995
08:47:15
6.1
GR
14N
614-78
14/05/1995
14:46:57
4.8
GR
19N
18
15/05/1995
04:13:57
5.4
GR
26N
39-27
16/05/1995
23:57:28
5.2
GR
25N
29-21
19/05/1995
06:48:49
5.4
GR
10N
415-28
19/05/1995
07:36:19
4.6
GR
8N
118
20/05/1995
21:06:25
4.9
GR
27S
27-8
06/06/1995
04:36:00
5.1
GR
24N
410-26
11/06/1995
18:51:48
5.1
GR
27N
31-9
15/06/1995
00:15:51
6.1
GR
3N
47-35
25/06/1995
01:05:32
4.5
GR
11N
16
17/07/1995
23:18:15
5.5
GR
22N
122
18/08/1995
00:52:23
5.1
TR
18N
132
30/09/1995
10:14:34
5.2
IT27
T3
22-46
01/10/1995
15:57:13
6.4
TR
5N
30-87
22/11/1995
04:15:12
7.1
EG
13S
148
23/11/1995
18:07:13
5.7
EG
24S
132
05/12/1995
18:49:32
5.8
TR
26S
159
(contin
ued)
TableA1(Con
tinued)
Date
(dd/mm/yyyy)
Tim
eM
wCo*
Depth,
Z(km)
Styleof
Faultin
g,F
Num
berof
Records,N
r
Distance,
RJB
(km)†
05/12/1995
18:52:40
5.8
TR
10S
166
26/12/1995
06:19:38
4.5
EG
12S
181
02/04/1996
07:59:26
5.4
GR
15N
165
15/07/1996
00:13:30
4.7
FR4
S1
2111/08/1996
11:43:45
4.9
GR
48S
18
14/08/1996
01:55:03
5.7
TR
12S
143
14/08/1996
02:59:41
5.6
TR
3S
144
02/09/1996
19:07:01
4.6
SP17
N1
109/10/1996
13:10:50
6.8
CY
19S
184
15/10/1996
09:56:01
5.4
IT26
T3
13-28
13/01/1997
10:19:25
5.7
CY
15S
253-77
22/01/1997
17:57:20
5.7
TR
45N
119
24/02/1997
07:09:50
4.6
SP14
N10
2-32
28/02/1997
00:03:52
5.2
TR
5S
140
26/03/1997
04:22:51
5.1
LE
5N
175
26/04/1997
22:18:34
4.9
GR
45S
126
02/07/1997
12:53:07
4.5
SP25
S2
33-54
03/09/1997
22:07:29
4.9
IT3
N2
10-21
26/09/1997
00:33:12
5.7
IT4
N11
0-78
26/09/1997
09:40:25
6.0
IT10
N14
0-66
26/09/1997
13:30:52
4.5
IT14
N1
2527/09/1997
08:08:08
4.7
IT9
N2
2-15
02/10/1997
10:59:56
4.7
IT8
N3
2-15
03/10/1997
08:55:22
5.2
IT12
N9
6-36
04/10/1997
16:13:33
4.9
IT1
N4
7-18
06/10/1997
23:24:53
5.4
IT4
N10
4-66
07/10/1997
01:24:34
4.6
IT9
N4
8-19
07/10/1997
05:09:57
4.9
IT4
N7
5-39
12/10/1997
05:06:07
4.6
TR
60T
111
12/10/1997
11:08:36
5.2
IT0
N13
7-53
13/10/1997
13:09:21
4.8
IT8
N3
9-25
14/10/1997
15:23:09
5.6
IT7
N16
7-74
16/10/1997
04:52:55
4.5
IT4
N1
616/10/1997
12:00:31
4.8
IT1
S5
3-11
19/10/1997
16:00:18
4.7
IT8
N5
7-15
05/11/1997
21:10:28
5.6
GR
24N
128
09/11/1997
19:07:33
5.0
IT4
N7
4-34
18/11/1997
13:07:41
6.0
IS10
T3
39-65
07/02/1998
00:59:44
4.9
IT4
N7
5-18
05/03/1998
01:45:08
4.8
TR
23N
248-100
21/03/1998
16:45:09
5.0
IT1
N9
6-23
28/03/1998
00:29:57
4.5
TR
6S
142
03/04/1998
07:26:36
5.1
IT2
N12
5-36
03/04/1998
07:59:51
4.7
IT4
N6
2-19
(contin
ued)
A Model for Vertical-to-Horizontal Response Spectral Ratios for Europe and the Middle East 1801

TableA1(Con
tinued)
Date
(dd/mm/yyyy)
Tim
eM
wCo*
Depth,
Z(km)
Styleof
Faultin
g,F
Num
berof
Records,N
r
Distance,
RJB
(km)†
04/04/1998
16:16:47
5.2
TR
19N
242-88
05/04/1998
15:52:20
5.0
IT10
N11
6-37
12/04/1998
10:55:33
5.6
IT8
S1
2413/04/1998
15:14:33
5.2
TR
15S
176
09/05/1998
15:38:00
5.1
TR
27S
248-53
04/06/1998
21:36:54
5.4
ICS
66-49
27/06/1998
13:55:52
6.2
TR
47S
140
04/07/1998
02:15:46
5.4
TR
55S
152
09/07/1998
05:19:07
6.1
PO10
S2
11-72
09/07/1998
17:36:46
5.0
TR
17N
175
09/09/1998
11:28:00
5.6
IT29
N3
10-34
08/10/1998
20:48:06
4.6
TR
18S
124
10/11/1998
05:39:32
4.8
TR
24S
134
13/11/1998
10:38:34
5.1
ICS
29-11
20/12/1998
03:21:14
4.8
TR
10S
155
14/02/1999
11:45:53
4.7
IT21
N2
11-24
11/06/1999
05:25:18
4.9
TR
23N
194
07/07/1999
17:16:12
4.7
IT12
N1
1020/07/1999
04:22:40
4.8
TR
41S
17
24/07/1999
16:05:50
5.0
TR
10S
138
25/07/1999
06:56:54
5.2
TR
15S
135
17/08/1999
00:01:40
7.6
TR
17S
181-97
17/08/1999
01:07:52
4.9
TR
22S
186
17/08/1999
02:50:47
5.1
TR
11S
194
19/08/1999
01:52
4.7
TR
28S
149
19/08/1999
14:16:00
4.7
TR
3N
146
19/08/1999
15:17:79
5.1
TR
12S
341-48
20/08/1999
10:00:19
5.1
TR
26S
186
22/08/1999
11:12:04
4.6
TR
28S
151
29/08/1999
10:15:04
4.9
TR
14N
46-57
31/08/1999
08:10:63
5.1
TR
4S
1414-89
31/08/1999
08:33:25
4.5
TR
6N
237-87
07/09/1999
11:56:51
6.0
GR
17N
115-13
09/09/1999
08:15:35
4.8
TR
24N
152
13/09/1999
11:55:30
5.8
TR
10S
239-100
24/09/1999
19:08:04
5.0
TR
12S
197
29/09/1999
00:13:07
5.2
TR
12S
186
05/10/1999
00:53:28
5.2
TR
17N
176
07/11/1999
16:54:41
5.1
TR
7T
75-27
11/11/1999
14:41:23
5.6
TR
8S
1231-82
12/11/1999
16:57:20
7.1
TR
10S
150-98
12/11/1999
17:17:00
5.0
TR
9S
78-54
12/11/1999
17:26:15
4.7
TR
10S
18
12/11/1999
17:47:16
5.0
TR
20S
163
(contin
ued)
TableA1(Con
tinued)
Date
(dd/mm/yyyy)
Tim
eM
wCo*
Depth,
Z(km)
Styleof
Faultin
g,F
Num
berof
Records,N
r
Distance,
RJB
(km)†
12/11/1999
20:04:44
4.8
TR
10S
327-45
12/11/1999
21:38:32
4.7
TR
12S
611-40
12/11/1999
22:20:53
5.0
TR
25S
630-63
13/11/1999
00:54:43
5.0
TR
5N
510-48
15/11/1999
16:26:58
4.5
TR
11S
518-39
16/11/1999
17:51:18
5.0
TR
5S
547-81
19/11/1999
19:59:08
4.9
TR
5N
415-55
20/11/1999
08:44:13
5.1
TR
7S
351-56
21/11/1999
22:27:32
4.7
TR
9S
353-58
13/12/1999
19:13:40
4.7
TR
14S
110
29/12/1999
20:42:34
5.1
SW5
N12
8-69
29/12/1999
20:42:35
4.8
IT5
N1
1431/12/1999
04:55:54
4.5
IT15
N8
9-21
20/01/2000
10:35:59
4.9
TR
13S
615-60
14/02/2000
06:56:35
5.3
TR
10S
249-55
01/04/2000
18:08:03
4.5
IT2
N1
202/04/2000
11:41:09
4.6
TR
28S
166
02/04/2000
18:57:40
4.5
TR
9S
116
06/04/2000
17:40:37
4.6
SW5
N5
1021/04/2000
12:23:06
5.4
TR
20N
323-85
10/05/2000
16:52:11
4.8
IT23
T1
806/06/2000
02:41:51
6.0
TR
10N
38-91
06/06/2000
05:59:40
4.6
TR
8S
124
08/06/2000
21:27:56
4.9
TR
33N
19
17/06/2000
15:40:41
6.5
IC15
S20
5-76
21/06/2000
00:51:48
6.4
ICS
132-53
01/08/2000
04:35:46
5.1
PO13
S1
3921/08/2000
17:14:28
4.8
IT24
N1
623/08/2000
13:41:28
5.3
TR
11S
514-94
08/09/2000
05:46:46
4.7
TR
5S
134
04/10/2000
02:33:58
5.0
TR
3N
210-90
04/10/2000
07:58:50
4.6
TR
2N
124
15/11/2000
15:05:34
5.5
TR
48S
137
15/11/2000
16:06:03
5.0
TR
45T
144
02/02/2001
09:51:39
4.6
TR
18N
15
25/02/2001
18:34:41
4.9
FR10
T1
3508/04/2001
06:12:24
4.9
GR
14N
216-20
29/05/2001
13:14:27
4.9
TR
20S
134
29/05/2001
14:15:53
4.9
TR
10T
160
22/06/2001
11:54:51
5.2
TR
7N
134
23/06/2001
12:18:21
4.8
TR
8S
128
25/06/2001
13:28:46
5.4
TR
10N
241-74
10/07/2001
21:42:04
5.4
TR
23S
131
17/07/2001
15:06:12
5.1
IT2
S2
19-69
(contin
ued)
1802 J. J. Bommer, S. Akkar, and Ö. Kale
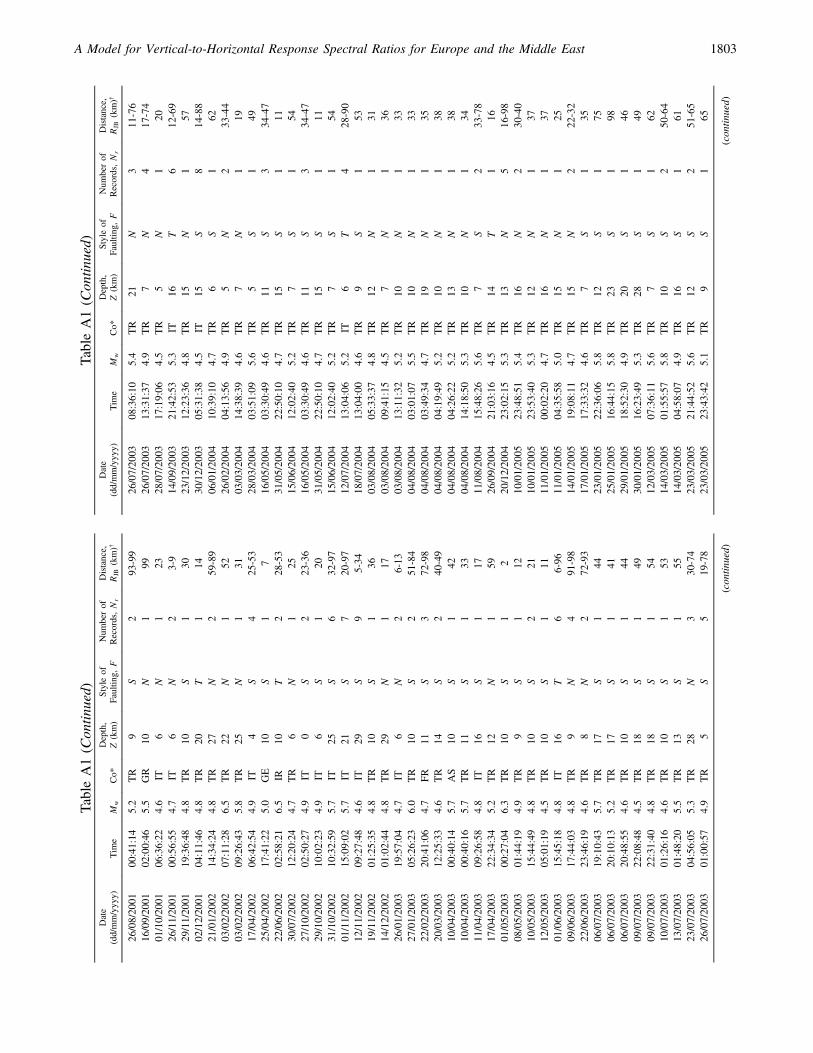
TableA1(Con
tinued)
Date
(dd/mm/yyyy)
Tim
eM
wCo*
Depth,
Z(km)
Styleof
Faultin
g,F
Num
berof
Records,N
r
Distance,
RJB
(km)†
26/08/2001
00:41:14
5.2
TR
9S
293-99
16/09/2001
02:00:46
5.5
GR
10N
199
01/10/2001
06:36:22
4.6
IT6
N1
2326/11/2001
00:56:55
4.7
IT6
N2
3-9
29/11/2001
19:36:48
4.8
TR
10S
130
02/12/2001
04:11:46
4.8
TR
20T
114
21/01/2002
14:34:24
4.8
TR
27N
259-89
03/02/2002
07:11:28
6.5
TR
22N
152
03/02/2002
09:26:43
5.8
TR
25N
131
17/04/2002
06:42:54
4.9
IT4
S4
25-53
25/04/2002
17:41:22
5.0
GE
10S
17
22/06/2002
02:58:21
6.5
IR10
T2
28-53
30/07/2002
12:20:24
4.7
TR
6N
125
27/10/2002
02:50:27
4.9
IT0
S2
23-36
29/10/2002
10:02:23
4.9
IT6
S1
2031/10/2002
10:32:59
5.7
IT25
S6
32-97
01/11/2002
15:09:02
5.7
IT21
S7
20-97
12/11/2002
09:27:48
4.6
IT29
S9
5-34
19/11/2002
01:25:35
4.8
TR
10S
136
14/12/2002
01:02:44
4.8
TR
29N
117
26/01/2003
19:57:04
4.7
IT6
N2
6-13
27/01/2003
05:26:23
6.0
TR
10S
251-84
22/02/2003
20:41:06
4.7
FR11
S3
72-98
20/03/2003
12:25:33
4.6
TR
14S
240-49
10/04/2003
00:40:14
5.7
AS
10S
142
10/04/2003
00:40:16
5.7
TR
11S
133
11/04/2003
09:26:58
4.8
IT16
S1
1717/04/2003
22:34:34
5.2
TR
12N
159
01/05/2003
00:27:04
6.3
TR
10S
12
08/05/2003
01:44:19
4.9
TR
9S
112
10/05/2003
15:44:49
4.8
TR
10S
221
12/05/2003
05:01:19
4.5
TR
10S
111
01/06/2003
15:45:18
4.8
IT16
T6
6-96
09/06/2003
17:44:03
4.8
TR
9N
491-98
22/06/2003
23:46:19
4.6
TR
8N
272-93
06/07/2003
19:10:43
5.7
TR
17S
144
06/07/2003
20:10:13
5.2
TR
17S
141
06/07/2003
20:48:55
4.6
TR
10S
144
09/07/2003
22:08:48
4.5
TR
18S
149
09/07/2003
22:31:40
4.8
TR
18S
154
10/07/2003
01:26:16
4.6
TR
10S
153
13/07/2003
01:48:20
5.5
TR
13S
155
23/07/2003
04:56:05
5.3
TR
28N
330-74
26/07/2003
01:00:57
4.9
TR
5S
519-78
(contin
ued)
TableA1(Con
tinued)
Date
(dd/mm/yyyy)
Tim
eM
wCo*
Depth,
Z(km)
Styleof
Faultin
g,F
Num
berof
Records,N
r
Distance,
RJB
(km)†
26/07/2003
08:36:10
5.4
TR
21N
311-76
26/07/2003
13:31:37
4.9
TR
7N
417-74
28/07/2003
17:19:06
4.5
TR
5N
120
14/09/2003
21:42:53
5.3
IT16
T6
12-69
23/12/2003
12:23:36
4.8
TR
15N
157
30/12/2003
05:31:38
4.5
IT15
S8
14-88
06/01/2004
10:39:10
4.7
TR
6S
162
26/02/2004
04:13:56
4.9
TR
5N
233-44
03/03/2004
14:38:39
4.6
TR
7N
119
28/03/2004
03:51:09
5.6
TR
5S
149
16/05/2004
03:30:49
4.6
TR
11S
334-47
31/05/2004
22:50:10
4.7
TR
15S
111
15/06/2004
12:02:40
5.2
TR
7S
154
16/05/2004
03:30:49
4.6
TR
11S
334-47
31/05/2004
22:50:10
4.7
TR
15S
111
15/06/2004
12:02:40
5.2
TR
7S
154
12/07/2004
13:04:06
5.2
IT6
T4
28-90
18/07/2004
13:04:00
4.6
TR
9S
153
03/08/2004
05:33:37
4.8
TR
12N
131
03/08/2004
09:41:15
4.5
TR
7N
136
03/08/2004
13:11:32
5.2
TR
10N
133
04/08/2004
03:01:07
5.5
TR
10N
133
04/08/2004
03:49:34
4.7
TR
19N
135
04/08/2004
04:19:49
5.2
TR
10N
138
04/08/2004
04:26:22
5.2
TR
13N
138
04/08/2004
14:18:50
5.3
TR
10N
134
11/08/2004
15:48:26
5.6
TR
7S
233-78
26/09/2004
21:03:16
4.5
TR
14T
116
20/12/2004
23:02:15
5.3
TR
13N
516-98
10/01/2005
23:48:51
5.4
TR
16N
230-40
10/01/2005
23:53:40
5.3
TR
12N
137
11/01/2005
00:02:20
4.7
TR
16N
137
11/01/2005
04:35:58
5.0
TR
15N
125
14/01/2005
19:08:11
4.7
TR
15N
222-32
17/01/2005
17:33:32
4.6
TR
7S
135
23/01/2005
22:36:06
5.8
TR
12S
175
25/01/2005
16:44:15
5.8
TR
23S
198
29/01/2005
18:52:30
4.9
TR
20S
146
30/01/2005
16:23:49
5.3
TR
28S
149
12/03/2005
07:36:11
5.6
TR
7S
162
14/03/2005
01:55:57
5.8
TR
10S
250-64
14/03/2005
04:58:07
4.9
TR
16S
161
23/03/2005
21:44:52
5.6
TR
12S
251-65
23/03/2005
23:43:42
5.1
TR
9S
165
(contin
ued)
A Model for Vertical-to-Horizontal Response Spectral Ratios for Europe and the Middle East 1803

TableA1(Con
tinued)
Date
(dd/mm/yyyy)
Tim
eM
wCo*
Depth,
Z(km)
Styleof
Faultin
g,F
Num
berof
Records,N
r
Distance,
RJB
(km)†
09/04/2005
19:28:23
4.8
TR
11S
129
06/06/2005
07:41:30
5.6
TR
11S
345-64
09/08/2005
01:28:06
4.7
TR
4S
131
20/08/2005
10:08:44
4.7
TR
11N
126
17/10/2005
05:45:18
5.5
TR
21S
253-74
17/10/2005
05:59:22
4.8
TR
4S
162
17/10/2005
08:28:52
5.1
TR
2S
158
17/10/2005
08:34:44
5.2
TR
4S
160
17/10/2005
09:46:56
5.8
TR
19S
251-72
17/10/2005
09:55:31
5.2
TR
11S
156
17/10/2005
12:43:28
5.0
TR
21S
166
18/10/2005
16:00:47
5.0
TR
26S
169
20/10/2005
21:40:02
5.8
TR
15S
254-75
20/10/2005
21:43:59
4.9
TR
5S
154
31/10/2005
05:26:39
4.8
TR
16S
160
31/10/2005
06:48:22
4.8
TR
2S
159
02/11/2005
04:27:12
4.8
TR
3S
168
26/11/2005
15:56:57
5.1
TR
19N
148
10/12/2005
00:09:46
5.4
TR
19S
262-65
08/02/2006
04:07:42
4.9
TR
7S
198
18/04/2006
01:21:44
4.5
TR
24N
124
03/06/2006
14:40:26
4.7
TR
9S
137
02/07/2006
19:39:39
5.0
TR
15S
263-64
09/10/2006
05:01:35
4.7
TR
11N
170
12/10/2006
03:20:07
4.6
TR
6N
125
19/10/2006
21:00:48
4.7
TR
9S
144
(contin
ued)
TableA1(Con
tinued)
Date
(dd/mm/yyyy)
Tim
eM
wCo*
Depth,
Z(km)
Styleof
Faultin
g,F
Num
berof
Records,N
r
Distance,
RJB
(km)†
20/10/2006
18:15:26
5.1
TR
17S
433-98
24/10/2006
14:00:22
5.2
TR
8N
107-97
01/11/2006
21:19:44
4.8
TR
5N
348-66
19/12/2006
19:15:38
4.9
TR
19S
734-91
21/01/2007
07:38:58
5.1
TR
3S
117
23/01/2007
21:21:58
4.9
TR
27N
522-73
26/01/2007
08:20:35
4.9
TR
9S
134
25/08/2007
22:05:48
5.3
TR
16S
11
29/10/2007
09:23:16
5.3
TR
29N
60-99
09/11/2007
01:43:05
5.2
TR
16S
1100
16/11/2007
09:08:22
5.1
TR
22N
137
23/12/2008
15:24:21
5.4
IT27
T17
32-91
23/12/2008
21:58:25
4.9
IT31
T10
9-91
06/04/2009
01:32:39
6.3
IT9
N18
0-96
06/04/2009
02:37:04
5.1
IT10
N13
5-99
06/04/2009
23:15:37
5.1
IT9
N15
8-93
07/04/2009
09:26:28
5.0
IT10
N18
4-65
07/04/2009
17:47:37
5.6
IT15
N29
5-98
07/04/2009
21:34:29
4.6
IT7
N18
1-63
09/04/2009
00:52:59
5.4
IT15
N27
9-83
09/04/2009
19:38:16
5.3
IT17
N25
10-89
13/04/2009
21:14:24
5.1
IT8
N16
16-66
*Coisthecountryor
region
where
theearthquake
occurred:AS,
AegeanSea;
AL,Algeria;AR,
Arm
enia;CU,Caucasus;
CY,Cyprus;
DS,
DeadSea;
EG,Egypt;FR
,France;GE,Georgia;GR,
Greece;
IC,Iceland;
IS,Ionian
Sea;
IR,Iran;IT,Italy;
LE,Lebanon;MO,Montenegro;
PO,
Portugal;SP,Sp
ain;
SW,Sw
itzerland;TR,Tu
rkey.
† RJB
istheJoyner–B
oore
distance
rangeof
therecordsused
from
agivenearthquake.
1804 J. J. Bommer, S. Akkar, and Ö. Kale
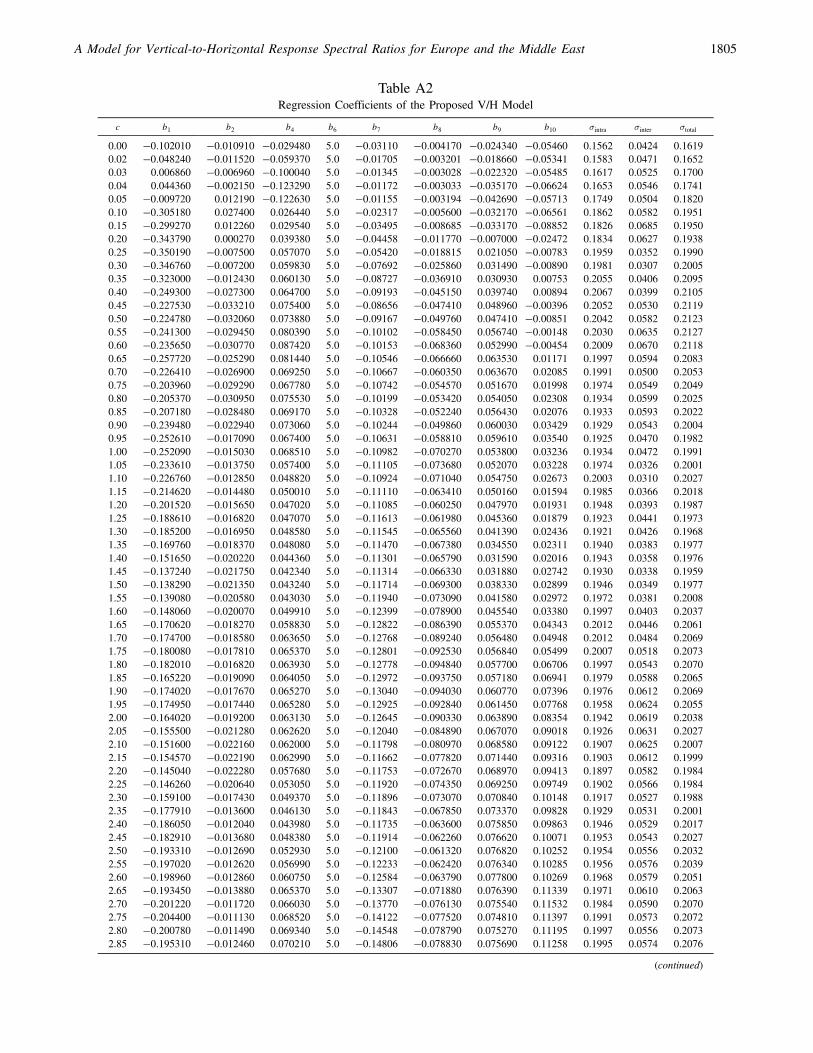
Table A2Regression Coefficients of the Proposed V/H Model
c b1 b2 b4 b6 b7 b8 b9 b10 σintra σinter σtotal
0.00 �0:102010 �0:010910 �0:029480 5.0 �0:03110 �0:004170 �0:024340 �0:05460 0.1562 0.0424 0.16190.02 �0:048240 �0:011520 �0:059370 5.0 �0:01705 �0:003201 �0:018660 �0:05341 0.1583 0.0471 0.16520.03 0.006860 �0:006960 �0:100040 5.0 �0:01345 �0:003028 �0:022320 �0:05485 0.1617 0.0525 0.17000.04 0.044360 �0:002150 �0:123290 5.0 �0:01172 �0:003033 �0:035170 �0:06624 0.1653 0.0546 0.17410.05 �0:009720 0.012190 �0:122630 5.0 �0:01155 �0:003194 �0:042690 �0:05713 0.1749 0.0504 0.18200.10 �0:305180 0.027400 0.026440 5.0 �0:02317 �0:005600 �0:032170 �0:06561 0.1862 0.0582 0.19510.15 �0:299270 0.012260 0.029540 5.0 �0:03495 �0:008685 �0:033170 �0:08852 0.1826 0.0685 0.19500.20 �0:343790 0.000270 0.039380 5.0 �0:04458 �0:011770 �0:007000 �0:02472 0.1834 0.0627 0.19380.25 �0:350190 �0:007500 0.057070 5.0 �0:05420 �0:018815 0.021050 �0:00783 0.1959 0.0352 0.19900.30 �0:346760 �0:007200 0.059830 5.0 �0:07692 �0:025860 0.031490 �0:00890 0.1981 0.0307 0.20050.35 �0:323000 �0:012430 0.060130 5.0 �0:08727 �0:036910 0.030930 0.00753 0.2055 0.0406 0.20950.40 �0:249300 �0:027300 0.064700 5.0 �0:09193 �0:045150 0.039740 0.00894 0.2067 0.0399 0.21050.45 �0:227530 �0:033210 0.075400 5.0 �0:08656 �0:047410 0.048960 �0:00396 0.2052 0.0530 0.21190.50 �0:224780 �0:032060 0.073880 5.0 �0:09167 �0:049760 0.047410 �0:00851 0.2042 0.0582 0.21230.55 �0:241300 �0:029450 0.080390 5.0 �0:10102 �0:058450 0.056740 �0:00148 0.2030 0.0635 0.21270.60 �0:235650 �0:030770 0.087420 5.0 �0:10153 �0:068360 0.052990 �0:00454 0.2009 0.0670 0.21180.65 �0:257720 �0:025290 0.081440 5.0 �0:10546 �0:066660 0.063530 0.01171 0.1997 0.0594 0.20830.70 �0:226410 �0:026900 0.069250 5.0 �0:10667 �0:060350 0.063670 0.02085 0.1991 0.0500 0.20530.75 �0:203960 �0:029290 0.067780 5.0 �0:10742 �0:054570 0.051670 0.01998 0.1974 0.0549 0.20490.80 �0:205370 �0:030950 0.075530 5.0 �0:10199 �0:053420 0.054050 0.02308 0.1934 0.0599 0.20250.85 �0:207180 �0:028480 0.069170 5.0 �0:10328 �0:052240 0.056430 0.02076 0.1933 0.0593 0.20220.90 �0:239480 �0:022940 0.073060 5.0 �0:10244 �0:049860 0.060030 0.03429 0.1929 0.0543 0.20040.95 �0:252610 �0:017090 0.067400 5.0 �0:10631 �0:058810 0.059610 0.03540 0.1925 0.0470 0.19821.00 �0:252090 �0:015030 0.068510 5.0 �0:10982 �0:070270 0.053800 0.03236 0.1934 0.0472 0.19911.05 �0:233610 �0:013750 0.057400 5.0 �0:11105 �0:073680 0.052070 0.03228 0.1974 0.0326 0.20011.10 �0:226760 �0:012850 0.048820 5.0 �0:10924 �0:071040 0.054750 0.02673 0.2003 0.0310 0.20271.15 �0:214620 �0:014480 0.050010 5.0 �0:11110 �0:063410 0.050160 0.01594 0.1985 0.0366 0.20181.20 �0:201520 �0:015650 0.047020 5.0 �0:11085 �0:060250 0.047970 0.01931 0.1948 0.0393 0.19871.25 �0:188610 �0:016820 0.047070 5.0 �0:11613 �0:061980 0.045360 0.01879 0.1923 0.0441 0.19731.30 �0:185200 �0:016950 0.048580 5.0 �0:11545 �0:065560 0.041390 0.02436 0.1921 0.0426 0.19681.35 �0:169760 �0:018370 0.048080 5.0 �0:11470 �0:067380 0.034550 0.02311 0.1940 0.0383 0.19771.40 �0:151650 �0:020220 0.044360 5.0 �0:11301 �0:065790 0.031590 0.02016 0.1943 0.0358 0.19761.45 �0:137240 �0:021750 0.042340 5.0 �0:11314 �0:066330 0.031880 0.02742 0.1930 0.0338 0.19591.50 �0:138290 �0:021350 0.043240 5.0 �0:11714 �0:069300 0.038330 0.02899 0.1946 0.0349 0.19771.55 �0:139080 �0:020580 0.043030 5.0 �0:11940 �0:073090 0.041580 0.02972 0.1972 0.0381 0.20081.60 �0:148060 �0:020070 0.049910 5.0 �0:12399 �0:078900 0.045540 0.03380 0.1997 0.0403 0.20371.65 �0:170620 �0:018270 0.058830 5.0 �0:12822 �0:086390 0.055370 0.04343 0.2012 0.0446 0.20611.70 �0:174700 �0:018580 0.063650 5.0 �0:12768 �0:089240 0.056480 0.04948 0.2012 0.0484 0.20691.75 �0:180080 �0:017810 0.065370 5.0 �0:12801 �0:092530 0.056840 0.05499 0.2007 0.0518 0.20731.80 �0:182010 �0:016820 0.063930 5.0 �0:12778 �0:094840 0.057700 0.06706 0.1997 0.0543 0.20701.85 �0:165220 �0:019090 0.064050 5.0 �0:12972 �0:093750 0.057180 0.06941 0.1979 0.0588 0.20651.90 �0:174020 �0:017670 0.065270 5.0 �0:13040 �0:094030 0.060770 0.07396 0.1976 0.0612 0.20691.95 �0:174950 �0:017440 0.065280 5.0 �0:12925 �0:092840 0.061450 0.07768 0.1958 0.0624 0.20552.00 �0:164020 �0:019200 0.063130 5.0 �0:12645 �0:090330 0.063890 0.08354 0.1942 0.0619 0.20382.05 �0:155500 �0:021280 0.062620 5.0 �0:12040 �0:084890 0.067070 0.09018 0.1926 0.0631 0.20272.10 �0:151600 �0:022160 0.062000 5.0 �0:11798 �0:080970 0.068580 0.09122 0.1907 0.0625 0.20072.15 �0:154570 �0:022190 0.062990 5.0 �0:11662 �0:077820 0.071440 0.09316 0.1903 0.0612 0.19992.20 �0:145040 �0:022280 0.057680 5.0 �0:11753 �0:072670 0.068970 0.09413 0.1897 0.0582 0.19842.25 �0:146260 �0:020640 0.053050 5.0 �0:11920 �0:074350 0.069250 0.09749 0.1902 0.0566 0.19842.30 �0:159100 �0:017430 0.049370 5.0 �0:11896 �0:073070 0.070840 0.10148 0.1917 0.0527 0.19882.35 �0:177910 �0:013600 0.046130 5.0 �0:11843 �0:067850 0.073370 0.09828 0.1929 0.0531 0.20012.40 �0:186050 �0:012040 0.043980 5.0 �0:11735 �0:063600 0.075850 0.09863 0.1946 0.0529 0.20172.45 �0:182910 �0:013680 0.048380 5.0 �0:11914 �0:062260 0.076620 0.10071 0.1953 0.0543 0.20272.50 �0:193310 �0:012690 0.052930 5.0 �0:12100 �0:061320 0.076820 0.10252 0.1954 0.0556 0.20322.55 �0:197020 �0:012620 0.056990 5.0 �0:12233 �0:062420 0.076340 0.10285 0.1956 0.0576 0.20392.60 �0:198960 �0:012860 0.060750 5.0 �0:12584 �0:063790 0.077800 0.10269 0.1968 0.0579 0.20512.65 �0:193450 �0:013880 0.065370 5.0 �0:13307 �0:071880 0.076390 0.11339 0.1971 0.0610 0.20632.70 �0:201220 �0:011720 0.066030 5.0 �0:13770 �0:076130 0.075540 0.11532 0.1984 0.0590 0.20702.75 �0:204400 �0:011130 0.068520 5.0 �0:14122 �0:077520 0.074810 0.11397 0.1991 0.0573 0.20722.80 �0:200780 �0:011490 0.069340 5.0 �0:14548 �0:078790 0.075270 0.11195 0.1997 0.0556 0.20732.85 �0:195310 �0:012460 0.070210 5.0 �0:14806 �0:078830 0.075690 0.11258 0.1995 0.0574 0.2076
(continued)
A Model for Vertical-to-Horizontal Response Spectral Ratios for Europe and the Middle East 1805

2010; Bommer et al., 2007; ITACA [Luzi et al., 2008];Akkar et al., 2010), number of accelerograms used fromeach event, and their distance ranges are given in Table A1.Table A2 presents the regression coefficients of the proposedV/H model.
Department of Civil and Environmental EngineeringImperial College LondonSouth Kensington campusLondonSW7 2AZUnited [email protected]
(J.J.B.)
Earthquake Engineering Research CenterDepartment of Civil EngineeringMiddle East Technical University06531 Ankara, [email protected]
(S.A.)
Department of Civil EngineeringMiddle East Technical University06531 Ankara, [email protected]
(Ö.K.)
Manuscript received 12 October 2010
Table A2 (Continued)c b1 b2 b4 b6 b7 b8 b9 b10 σintra σinter σtotal
2.90 �0:197850 �0:012400 0.073310 5.0 �0:15137 �0:079400 0.075840 0.11443 0.1994 0.0561 0.20712.95 �0:197960 �0:012540 0.075530 5.0 �0:15549 �0:080210 0.077000 0.11556 0.1994 0.0548 0.20683.00 �0:194310 �0:013020 0.075850 5.0 �0:15830 �0:081210 0.078830 0.11624 0.1993 0.0548 0.2067
1806 J. J. Bommer, S. Akkar, and Ö. Kale