a model for establishing upper levels of intake for nutrients and
TRANSCRIPT

A Model for Establishing Upper Levels of Intake
for Nutrients and Related Substances
Report of a Joint FAO/WHO Technical Workshop on Nutrient Risk Assessment
WHO Headquarters, Geneva, Switzerland 2-6 May 2005
2006
Food and Agriculture Organization of the United Nations

WHO Library Cataloguing-in-Publication Data: Joint FAO/WHO Technical Workshop on Food Nutrient Risk Assessment (2005 : Geneva,
Switzerland) A model for establishing upper levels of intake for nutrients and related substances : report of a
Joint FAO/WHO Technical Workshop on Food Nutrient Risk Assessment, WHO Headquarters, Geneva, Switzerland, 2-6 May 2005.
1.Nutrition. 2.Vitamins. 3.Risk assessment. I.World Health Organization. II.Food and Agriculture Organization of the United Nations. III.Title.
ISBN 92 4 159418 7 (NLM classification: QU 145) ISBN 978 92 4 159418 9 Available on the Internet http://www.who.int/ipcs/methods/en/
© World Health Organization 2006
All rights reserved. Publications of the World Health Organization can be obtained from WHO Press, World Health Organization, 20 Avenue Appia, 1211 Geneva 27, Switzerland (tel.: +41 22 791 3264; fax: +41 22 791 4857; e-mail: [email protected]). Requests for permission to reproduce or translate WHO publications – whether for sale or for noncommercial distribution – should be addressed to WHO Press, at the above address (fax: +41 22 791 4806; e-mail: [email protected]).
The designations employed and the presentation of the material in this publication do not imply the expression of any opinion whatsoever on the part of the World Health Organization concerning the legal status of any country, territory, city or area or of its authorities, or concerning the delimitation of its frontiers or boundaries. Dotted lines on maps represent approximate border lines for which there may not yet be full agreement. The mention of specific companies or of certain manufacturers’ products does not imply that they are endorsed or recommended by the World Health Organization in preference to others of a similar nature that are not mentioned. Errors and omissions excepted, the names of proprietary products are distinguished by initial capital letters. All reasonable precautions have been taken by the World Health Organization to verify the information contained in this publication. However, the published material is being distributed without warranty of any kind, either expressed or implied. The responsibility for the interpretation and use of the material lies with the reader. In no event shall the World Health Organization be liable for damages arising from its use. Printed in Switzerland.

iii
Contents Acronyms and abbreviations ix Key terms x Acknowledgements xi Preface xi Executive summary xii 1. INTRODUCTION 1 1.1 Reasons for the Workshop 1 1.2 Organization of the Workshop 3 1.2.1 Preparation 3 1.2.2 Identification of scientific experts 3 1.2.3 Conduct of the Workshop 4 1.3 Charge to the Workshop 4 2. BACKGROUND 5 2.1 Classic non-nutrient risk assessment 5 2.2 National/regional reports on nutrient risk assessment 8
2.2.1 Terms of reference (problem statements) for the three national/regional reports 9
2.2.2 Nutrient hazard identification and characterization 9 2.2.3 Nutrient exposure/intake assessment 10 2.2.4 Nutrient risk characterization 11 2.3 Application of nutrient risk assessment outcomes 11 2.3.1 Nutrient risk management decisions about the need to take action 11
2.3.2 Nutrient risk management decisions about interventions or regulatory options 12
2.3.3 Other applications 14 2.3.4 Role of problem formulation 14 2.4 Summary 14 3. CONSIDERATIONS FOR NUTRIENT RISK ASSESSMENT 15 3.1 An international approach 15 3.1.1 Global application 15 3.1.2 Inadequately nourished and ‘diseased’ populations 16 3.2 Terminology 16 3.2.1 Adverse health effects 17 3.2.2 Hazard 17 3.2.3 Habitual intake 18 3.2.4 Upper level of intake 19 3.2.5 Other terminology 19 3.3 Homeostatic mechanisms for nutrient substances 20 3.4 Adverse health effects and biomarkers of effect 21 3.4.1 Adverse health effects 21 3.4.2 Biomarkers of effect 23 3.5 Summary 25

A Model for Establishing Upper Levels of Intake for Nutrients and Related Substances
iv
4. NUTRIENT HAZARD IDENTIFICATION AND CHARACTERIZATION 26 4.1 Data search and evaluation for hazard identification and characterization: an iterative process 26 4.1.1 Nature of approach 26 4.1.2 Evidence-based systematic review 27 4.1.3 Summary of approach to data search and evaluation 29 4.2 Step 1: identifying adverse health effects associated with intake 29 4.2.1 Combining data to link intakes and adverse health effects 29 4.2.2 Identification and selection of data 32 4.2.3 Initial review of data 33 4.2.4 Summarizing and presenting results 36 4.3 Step 2: selecting the critical adverse health effect 37 4.4 Step 3: quantifying the upper level 39 4.4.1 Intake–response assessment 40 4.4.2 Specification of the NOAEL, LOAEL, or BI 41 4.4.3 Dealing with uncertainties and setting the upper level 43
4.4.4 Adjustment of upper level of intake for unstudied age/sex/lifestage subpopulations 46
4.4.5 Summary: setting an upper level of intake 47 4.5 Step 4: characterizing the hazard and identifying vulnerable subgroups 47 4.6 Summary 48 5. DIETARY INTAKE ASSESSMENT 49 5.1 Overview: definitions, principles, and harmonization 49 5.1.1 Definitions 49 5.1.2 Objectives and key principles for dietary intake assessment 49 5.1.3 Harmonization of methods for dietary intake assessment 50 5.2 Step 1: specifying the type of dietary intake assessment 52 5.2.1 Specification of intake of interest 52 5.2.2 Specification of time frame of interest 52 5.3 Step 2: use of composition data 53 5.3.1 Sources of data 53 5.3.2 Modifying and adjusting composition data 55 5.4 Step 3: use of consumption data 56 5.4.1 Data on individuals 57 5.4.2 Aggregated availability data and marketing/sales data 57 5.4.3 Combining consumption data to estimate intake from all sources 59 5.4.4 Strategies to obtain additional consumption data 62 5.5 Step 4: methods for estimation of intake 63 5.5.1 Intake estimation using data on individuals 63 5.5.2 Intake estimation using other types of data 65 5.6 Uncertainties associated with assessments 68 5.6.1 Composition data 69 5.6.2 Consumption data 69 5.6.3 Analytical methods and corrections 70 5.7 Reporting the dietary intake assessment 70 5.8 Summary 71
v
6. NUTRIENT RISK CHARACTERIZATION 72 6.1 Overview 72 6.2 Examples of nutrient risk assessment 72 6.3 Components of nutrient risk characterization 73 6.3.1 Basic components 73
6.3.2 Considerations to foster an improved interface between assessor and manager 75
6.4 Summary 76 7. THE MODEL FOR NUTRIENT RISK ASSESSMENT 77 7.1 The general model 77 7.2 Key questions and activities associated with the model 78 7.3 Implications of a data-driven model 80 7.4 Summary 82 8. APPLICABILITY OF THE MODEL TO THE RANGE OF NUTRIENT SUBSTANCES 83 8.1 General applicability and ‘test nutrients’ 83 8.2 Special applications 84
8.2.1 Nutrient substances with no identified adverse health effects: highest observed intake values 84 8.2.2 Inherent macronutrient substances with no known intake levels without risk 85 8.2.3 Apparent overlap between level of intake associated with risk and ‘health benefit’ 85
8.3 Summary 86 9. APPLICABILITY OF THE MODEL TO INADEQUATELY NOURISHED (SUB)POPULATIONS 87 9.1 Overview 87 9.2 Homeostatic considerations 88 9.3 Establishing upper levels for inadequately nourished (sub)populations 89 9.4 Impact of infectious disease 89 9.5 Summary 90 10. IDENTIFIED RESEARCH/DATA GAPS, NEEDED DISCUSSIONS, AND NEXT STEPS 91 10.1 Nutrient hazard identification and characterization 91 10.1.1 General metabolism of nutrient substances 91 10.1.2 Nature of adverse health effects, including biomarkers of effect 92 10.1.3 Data evaluation and uncertainties 92 10.2 Dietary intake assessment 93 10.3 Risk characterization 94 10.4 Applicability of the model 94 10.5 Next steps 95 11. REFERENCES 96 ANNEXES 101

A Model for Establishing Upper Levels of Intake for Nutrients and Related Substances
vi
List of annexes Annex 1 List of Workshop participants 101 Annex 2 Discussion paper 1: An evidence-based approach to nutrient hazard identification 102 Annex 3 Discussion paper 2: Uncertainty and adjustment 123 Annex 4 Discussion paper 3: Estimating the distribution of usual nutrient exposures in populations 157 Annex 5 Discussion paper 4: Nutrient risk characterization: key considerations 177 Annex 6 Key elements of hazard identification/hazard characterization for vitamin A, summarized from reports by three national/regional authorities 192 Annex 7 Comparison of approaches to considering adverse health effects in setting upper levels, summarized from reports by three national/regional authorities 198 Annex 8 Comparison of scientific review of data on vitamin A and bone density, summarized from reports by three national/regional authorities 204 Annex 9 Comparison of national/regional nutrient intake assessments, summarized from reports by three national/regional authorities 214 Annex 10 Comparison of selected risk characterization information, summarized from reports by three national/regional authorities 236 List of tables Table 3-1 Examples of homeostatic mechanisms for nutrient substances 20 Table 4-1 Model summary table: Nutrient substance intake levels associated with candidate adverse health effects, by study type and reference 37 Table 4-2 Model summary table: Evidence characteristics for effect X 38 Table 4-3 Sample format for organizing data used for deriving a composite uncertainty factor 46 Table 4-4 Comparison of three ratios that could be used for the scaling of the adult UL to obtain the UL for a child, by weight of child 47 Table 5-1 Strengths and limitations of different types of consumption data 57 Table 5-2 Estimated percentiles of the habitual nutrient intake distribution of zinc for women aged 19–30 years, assuming different levels of zinc consumption from supplements 61 Table 5-3 Estimated percentiles of the habitual nutrient intake distribution of vitamin B12 for women aged 19–30 years, assuming different levels of B12 consumption from supplements 61 Table 5-4 Estimated percentiles of the habitual nutrient intake distribution of vitamin C for women aged 19–30 years, assuming different levels of vitamin C consumption from supplements 61 Table 5-5 Summary of qualities of different types of dietary consumption data, approaches to estimating intakes, and the reliability of the estimates 64 Table 6-1 Elements of risk characterization to inform key decisions made by risk managers 75 Table 7-1 Key questions and activities for problem formulation 78 Table 7-2 Key questions and activities for nutrient hazard identification and characterization 78 Table 7-3 Key questions and activities for dietary intake assessment 80 Table 7-4 Key questions and activities for nutrient risk characterization 81

vii
List of figures Figure ES-1 Model for nutrient risk assessment xiv Figure 2-1 Interrelationships in risk analysis 5 Figure 2-2 Steps in risk assessment 6 Figure 3-1 Steps in risk assessment categorized by global and population relevance 16 Figure 3-2 Dual curves for risk relationship: Percentage of (sub)population at risk of ‘deficiency’ and then ‘adverse health effects’ as intake levels move from low to high 21 Figure 3-3 Identifying adverse health effects: Sequence of ‘effects’ in increasing order of severity 22 Figure 4-1 Generic model linking adverse health effect to nutrient substance 30 Figure 4-2 Combining data to establish a link between nutrient substance and adverse health effect 30 Figure 4-3 Steps in quantifying the upper level of intake 40 Figure 4-4 Lower part of intake–response curve for an adverse health effect: NOAEL, LOAEL and BI 42 Figure 7-1 Model for nutrient risk assessment 77 List of boxes Box 2-1 Terms of reference for three national/regional reports 10
Box 2-2 Information used by nutrient risk managers relative to the need to take action, by source 12 Box 2-3 Information used by nutrient risk managers relative to reducing the level of a nutrient substance in the food supply, by source 13 Box 2-4 Information used by nutrient risk managers relative to product labelling, by source 13 Box 2-5 Information used by nutrient risk managers relative to education, by source 13 Box 4-1 Recommendations for practice: Useful characteristics to identify high- quality observational studies 34 Box 4-2 Recommendations for practice: Useful categories for specifying a single summary rating of study quality 34 Box 4-3 Recommendations for practice: Identifying sources of uncertainty with potential to affect hazard identification 36 Box 4-4 Information important to the review of individual studies 36 Box 4-5 Recommendations for practice: Key considerations for the assessment of intake–response 41 Box 4-6 Nature of uncertainty factors associated with the derivation of an upper level for a nutrient substance 44 Box 4-7 Recommendations for practice: Steps to derive a composite uncertainty factor 45 Box 5-1 Recommendations for practice: Six principles for dietary intake assessment 50 Box 5-2 Six steps of a harmonized approach to dietary intake assessment 52 Box 5-3 Characteristics of desirable composition data 55 Box 5-4 Characteristics of desirable consumption data 56 Box 5-5 Recommendations for practice: Acceptable approaches to combining consumption data to estimate nutrient substance intake 62 Box 5-6 Recommendations for practice: Disaggregating household-level data into individual-level data 66

A Model for Establishing Upper Levels of Intake for Nutrients and Related Substances
viii
Box 5-7 Recommendations for practice: Using national or regional availability data to estimate upper percentiles of the intake distribution 67 Box 5-8 Recommendations for practice: Reporting on the dietary intake assessment 70 Box 6-1 Recommendations for practice: Key scientific components to include in nutrient risk characterization 74 Box 8-1 Situations for which the nutrient risk assessment model has limited applicability 84

ix
Acronyms and abbreviations BI benchmark intake BIL benchmark intake lower confidence interval BMD benchmark dose CV coefficient of variation EBSR evidence-based systematic review EFSA European Food Safety Authority (European Union) EU European Union EVM Expert Group on Vitamins and Minerals (United Kingdom) FAO Food and Agriculture Organization of the United Nations FFQ food frequency questionnaire GEMS Global Environment Monitoring System IOM Institute of Medicine, National Academies of Science (United States of
America and Canada) IPCS International Programme on Chemical Safety (World Health Organization) ISU Iowa State University (ISU method of adjusting variance for day-to-day
intake of nutrients by individuals) LOAEL lowest observed adverse effect level NOAEL no observed adverse effect level NR- national/regional, as in NR-report SCF Scientific Committee on Food (former) (European Commission (European
Union)) SD standard deviation UF uncertainty factor UK United Kingdom UL upper level of intake US United States of America WHO World Health Organization

A Model for Establishing Upper Levels of Intake for Nutrients and Related Substances
x
Key terms The following terms are used frequently in this report. Although it was anticipated that most existing terms for risk assessment would be compatible with nutrient risk assessment, it was acknowledged that several terms might require modification. Terms highlighted in bold italics were specifically discussed by the Workshop participants.
• adverse health effect: a change in morphology, physiology, growth, development, repro-duction or life span of an organism, system, or (sub)population that results in an impairment of functional capacity, an impairment of the capacity to compensate for additional stress, or an increase in susceptibility to other influences [same as IPCS, 2004a: ‘adverse effect’].
• the Group: participants in the Joint FAO/WHO Nutrient Risk Assessment Workshop: A Model for Establishing Upper Levels of Intake for Nutrients and Related Substances.
• habitual intake: the long-term average daily intake of the nutrient substance [defined by Workshop participants].
• hazard: inherent property of a nutrient or related substance to cause adverse health effects depending upon the level of intake [modification of IPCS, 2004a: ‘hazard’].
• lifestage: generally refers to pregnancy or lactation.
• nutrients and related substances (abbreviated to nutrient substances): Not specifically defined for this report, but regarded as inherent constituents of food that either are biologically essential or have a demonstrated favourable impact on health. They do not encompass food additives or substances such as food contaminants, pesticides, microbiological pathogens, or other food-borne hazards. National/regional regulatory authorities vary in their definitions for nutrient substances; however, scientific evidence to assess risk from such substances should in principle be equally relevant for all countries.
• risk: the probability of an adverse effect in an organism, system or (sub)population caused under specified circumstances by exposure to an agent [IPCS, 2004a: ‘risk’].
• (sub)population: the collective inhabitants of a country or region and/or a subgroup thereof—used when the sentence may be applicable to the population as a whole and to subgroups of the population (e.g., as used in the definition of ‘adverse health effect’ above).
• subpopulation: a specified subgroup of a population—examples include children in a speci-fied age range, pregnant women.
• upper level of intake (UL): the maximum level of habitual intake from all sources of a nutrient or related substance judged to be unlikely to lead to adverse health effects in humans [defined by Workshop participants].
• the Workshop: Joint FAO/WHO Nutrient Risk Assessment Workshop: A Model for Establish-ing Upper Levels of Intake for Nutrients and Related Substances.

xi
Acknowledgements Financial support for this scientific workshop was provided by:
• Australia, Food Standards Australia New Zealand and Australian Department of Agriculture, Fisheries and Forestry (Canberra)
• Canada, Health Canada (Ottawa)
• European Commission (Brussels)
• Republic of Korea, Korea Food and Drug Administration (Seoul)
• United States of America, National Institutes of Health: National Institute of Environmental Health Sciences (Research Triangle Park) and Office of Dietary Supplements (Bethesda)
* * * * *
Preface The report from the workshop ‘A Model for Establishing Upper Levels of Intake for Nutrients and Related Substances’ is an important step in addressing international issues concerning nutrient risk assessment as it pertains to high levels of intake. The increased consumption of fortified foods, dietary/food supplements and so-called ‘functional foods’ has made a harmonized approach for nutrient risk assessment relevant to protecting public health and to the practice of setting science-based international standards for food.
The Workshop brought together a diverse group of experts who considered—for nutrient substances—the scientific approaches for hazard identification, hazard characterization, dietary intake assessment, and risk characterization. Its successful outcome is due in large part to the willingness of the Workshop participants to bring about a ‘meeting of the minds’ among the relevant scientific disciplines, most notably nutritionists and toxicologists. The participants found ways to communicate and understand each others’ perspectives and scientific approaches. This, in turn, allowed a model to be outlined that is responsive to the special considerations germane to nutrient substances, but also built on current risk assessment methodologies common to all substances in foods.
Beyond the valuable contributions offered by existing national/regional nutrient risk assess-ment models as well as classic non-nutrient risk assessment, participants benefited from input from other sources. Prior to the activities to convene the Workshop, all interested parties were invited to comment on key issues related to the development of an international approach for nutrient risk assessment. The information received was available as part of the Workshop. Additionally, when the final report was completed, comments were invited as to whether the Workshop had fulfilled its charges. As a result, no issues were raised about fulfilment of the charges, and the report was deemed scientifically sound.
FAO and WHO appreciate the Workshop participants’ significant contribution in advancing this topic area. Further, their report’s final chapter on current gaps in knowledge and future research needs points the way towards the critical next steps.
Geneva, Switzerland March 2006

A Model for Establishing Upper Levels of Intake for Nutrients and Related Substances
xii
Executive summary The subject of this report is an international approach or ‘model’ for nutrient risk assessment developed by a scientific technical Workshop held 2-6 May 2005 in Geneva, Switzerland. Specifically, the model outlines the key considerations relevant to establishing upper levels of intake for nutrient substances and to characterizing such risk. The Workshop was convened jointly by the Food and Agriculture Organization of the United Nations (FAO) and the World Health Organization (WHO).
The increased use of fortified foods, dietary/food supplements, specially formulated foods, and so-called ‘functional foods’ has increased the intake of nutrient substances around the world. In turn, there has been growing interest in an international basis for determining the levels of intake that may pose risk. This report and the model for nutrient risk assessment that it presents provide a starting point for work to identify international science-based upper levels of intake for nutrient substances. Although the model is internationally focused, it can also be useful to those at national or regional levels who must take into account the levels of nutrient substances within the overall diet in order to ensure a safe food supply. Additionally, the model may assist in harmonizing efforts to conduct nutrient risk assessment and in facilitating trade.
The purpose of this technical Workshop was to address the question of determining risk posed by high levels of intake of nutrients and related substances. The Workshop did not address the risk presented by diets containing inadequate amounts of nutrient substances. Activities by FAO and WHO to convene this Workshop are not intended to detract from or replace concerns for risk resulting from nutrient deficiency states.
Setting the stage Through their deliberations, the Workshop participants (the Group) examined the extent to which existing approaches to assess risk associated with non-nutrients could be relevant to the development of a model for nutrient risk assessment. Classic (i.e. non-nutrient) assessment consists of four general tasks or steps: (i) hazard identification, (ii) hazard characterization, (iii) exposure assessment, and (iv) risk characterization. ‘Problem formulation’ precedes these steps and includes a dialogue among all interested parties, including risk assessors and risk managers. As such, it provides the context and expectations for the assessment. Overall, the Group found many aspects of classic risk assessment to be relevant to nutrient risk assessment.
However, modifications to the classic non-nutrient risk assessment approach are needed for nutrient substances because, unlike non-nutrients, nutrient substances are biologically essential or have a demonstrated favourable impact on health at specified levels of intake. This consideration influences approaches used to adjust for uncertainty associated with the data used to estimate an upper level of intake and also necessitates that the homeostatic mechanisms specific to essential nutrient substances be taken into account.
Reports on nutrient risk assessment from three authoritative national/regional bodies helped to inform the decisions the Group made in developing an international nutrient risk assessment model. Several annexes to this report contain examples of useful comparisons among the national/regional reports and show a number of areas in which the approaches to nutrient risk assessment converge—and a number in which they differ. Additionally, because the goal of nutrient risk assessment is to meet certain scientific information needs of the nutrient risk manager, the Group considered the nature of those needs and highlighted the important role that risk characterization serves in effectively communicating the conclusions of the nutrient risk assessor to the nutrient risk manager.
During its discussions, the Group concluded that a clear separation between hazard identification and hazard characterization as portrayed in the classic risk assessment model is not meaningful in the case of nutrient risk assessment because these processes are so closely inter-linked and iterative in nature. Further, in setting the stage for a nutrient risk assessment model, the Group

xiii
noted that hazard identification and characterization are globally relevant steps: that is, the outcomes of these two steps are derived from data applicable to all (sub)populations. Since data specific to the (sub)population of interest are used for dietary intake assessment and, in turn, for risk characterization, these latter two steps in the process are population specific. That is, they cannot be generalized to other (sub)populations that have a different food supply and different dietary patterns. However, the methodologies used to conduct dietary intake assessments and to some extent risk characterization can be the same in principle. Thus, the Group’s interest for dietary intake assessment and risk characterization was in specifying methods to foster harmonization of the process.
The Group used the following definitions for four key terms for the purposes of nutrient risk assessment:
• An adverse health effect is a change in morphology, physiology, growth, development, reproduction or life span of an organism, system, or (sub)population that results in an impair-ment of functional capacity, an impairment of the capacity to compensate for additional stress, or an increase in susceptibility to other influences.
• Hazard is the inherent property of a nutrient or related substance to cause adverse health effects depending upon the level of intake.
• Habitual intake is the long-term average daily intake of the nutrient substance.
• The upper level of intake (UL) is the maximum level of habitual intake from all sources of a nutrient or related substance judged to be unlikely to lead to adverse health effects in humans.
Workshop participants indicated a preference for the term ‘intake’ rather than ‘exposure’ to refer to the ingestion of nutrient substances.
The dual-curve relationship for risk for nutrient substances was highlighted as a hallmark of the nature of the substance the model is intended to address. In this respect, the Group considered the homeostatic mechanisms uniquely associated with nutrient substances and which operate at both low and high levels of intake to maintain the amount of nutrient substance in the body within an acceptable range. Due to the differences in homeostatic mechanisms among age/sex/lifestage sub-populations, the Group emphasized the value of specifying ULs on the basis of age, sex, and lifestage (e.g. pregnancy).
Further, the Group addressed the nature of adverse health effects and biomarkers of effect associated with nutrient substances. The increased use of valid causally associated biomarkers as surrogates for adverse health effects is highlighted as desirable for the purposes of nutrient risk assess-ment. After identifying the sequence of observable effects in the causal pathway for adverse health effects—from initial non-specific biochemical changes to clear clinical outcomes—the Group con-cluded that, assuming the biomarker meets other relevant criteria including causal association, biochemical changes outside the homeostatic range can be relevant surrogates for adverse health effects associated with nutrient substances.
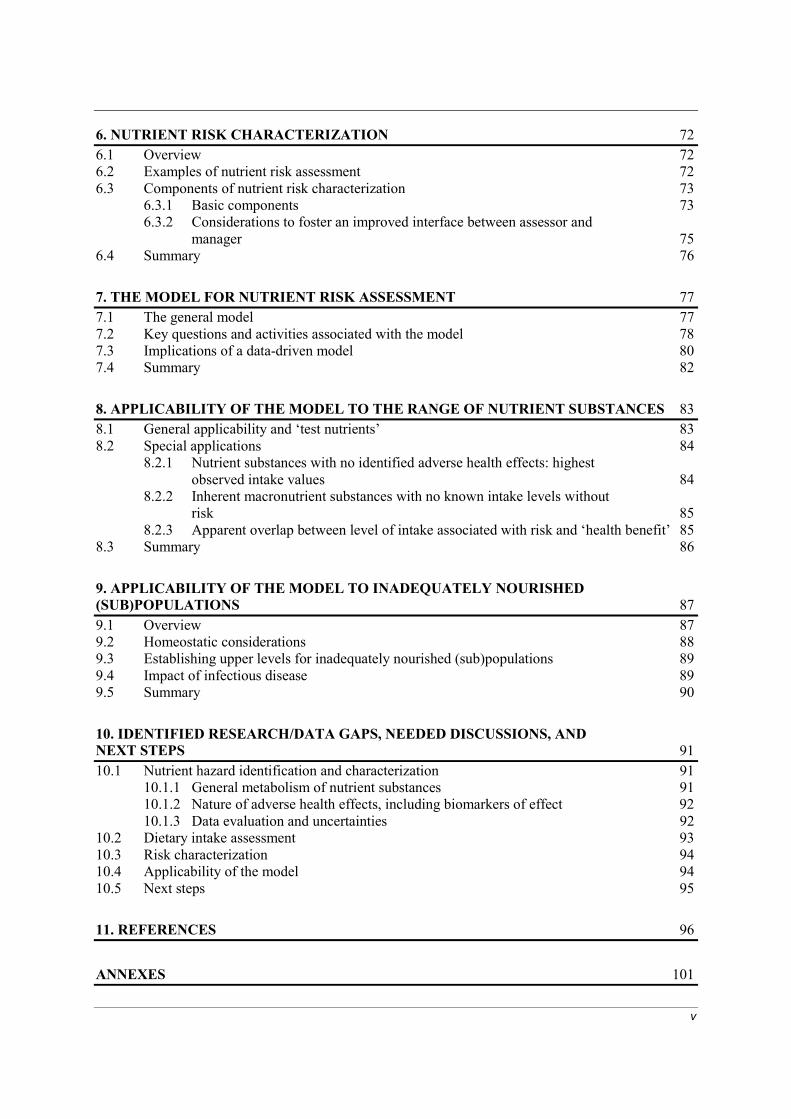
The model Description Based on their Workshop discussions, the Group identified the model for nutrient risk assessment that is illustrated schematically in Figure ES-1. The model links hazard identification and characterization, and it highlights the iterative aspects of the process by the use of a double-headed arrow. Information from the dietary intake assessment is combined with the information from hazard identification and characterization to carry out risk characterization. The entire process is preceded by a problem formu-lation step. Key activities for each component are on the right side of the figure.
A Model for Establishing Upper Levels of Intake for Nutrients and Related Substances
xiv
Note: BI = benchmark intake; NOAEL = no observed adverse effect level; LOAEL = lowest observed adverse effect level; UL = upper level of intake.
Figure ES-1. Model for Nutrient Risk Assessment (equivalent to Figure 7-1)
Nutrient hazard identification/characterization The linked hexagon symbols in Figure ES-1 represent hazard identification and characterization. The data evaluation relevant to hazard identification and characterization is iterative: it requires dialogue and refinement activities among the assessment participants. The process begins with the identifica-tion of adverse health effects associated with the nutrient substance and makes use of human, animal, and in-vitro data.
The rating of study quality and the use of tables to summarize the data and the ratings were deemed highly useful and relevant to transparency. For these purposes, certain aspects of evidence-based systematic reviews were viewed as providing valuable techniques that enhance documentation and thereby transparency. Such techniques include a priori definitions for data searches, the use of summary tables, and ratings for individual studies. However, as currently practised, other aspects of evidence-based systematic review, notably the kinds of questions it works to address, were generally viewed as not appropriately suited to nutrient risk assessment.
A pivotal point in the assessment process is the selection of the critical adverse health effect. This is the effect upon which the UL is based—or, more specifically, the effects upon which a set of ULs for the various age/sex/lifestage subpopulations is based. Notably, the UL is one of the key out-comes of hazard identification and characterization. The process for selecting the critical adverse health effect focuses on identifying the effect associated with a level of intake most likely to provide public health protection. In practice, this usually is the adverse health effect that occurs at the lowest level of intake within the (sub)population of interest—or at the lowest experimental dose if only animal data are available. For a given nutrient substance, different critical adverse health effects may be selected for the different age/sex/lifestage subpopulations because metabolic and physiological differences among these subpopulations mean that adverse health effects may manifest differently.

xv
Issues related to the physiological severity of the adverse health effect are considered separately rather than as a component of selecting the critical adverse health effect.
Derivation of the UL then moves to assessing the intake–response relationship for the critical adverse health effect. Depending on the type of intake–response data available, the nutrient risk assessor determines a no observed adverse effect level or, alternatively, a lowest observed adverse effect level. In rare circumstances the data may be sufficient to derive a benchmark intake, which is the preferred estimate. Following this, the important step of accounting for uncertainties must occur; this step requires careful and detailed scientific judgement on the part of the nutrient risk assessor. If available data allow, a quantitative adjustment for uncertainties may be applied to the value derived from the intake–response assessment. Generally, however, adjustments for uncertainty must make use of uncertainty factors. It is preferable to develop a single composite uncertainty factor rather than to apply numerous separate uncertainty factors. In any case, these uncertainty considerations must be checked against the level of recommended intake relative to biological essentiality or the levels of intake associated with the demonstrated impact on health.
After uncertainties are taken into account, the resulting value is the UL for the specified subpopulation. When data are insufficient for setting a UL for one or more age/sex/lifestage sub-populations (as often is the case), the risk assessor fills the gap by adjusting a UL that has been estab-lished for another subpopulation. It is desirable to make these adjustments based on understandings of the physiological differences between the groups. Lacking such information, however, an alternative is the use of scaling based on [body weight]0.75. This type of scaling adjusts the UL on the basis of energy requirements. Dietary intake assessment The triangle symbol in Figure ES-1 represents the dietary intake assessment step. In the interests of providing useful and globally applicable methodologies for dietary intake assessment, this report first discusses techniques for updating, augmenting, or adjusting existing composition data. The applica-tion of these techniques can improve the quality and relevance of the data and help harmonize the approach to dietary intake assessment.
If available, intake data obtained from individuals are the most useful type of data for dietary intake assessment because they allow the estimation of an intake distribution. The Group recognized, however, that such data are rare in most regions of the world. Thus, the report outlines approaches that allow the use of aggregated data. The derivation of an intake distribution may be accomplished even with limited aggregated data by using special statistical methods to estimate and refine a distribution curve for the (sub)population of interest. Special considerations were given to strategies for combining data from different sources in order to estimate intakes. Nutrient risk characterization The cylinder symbol in Figure ES-1 represents risk characterization. During this final stage of nutrient risk assessment, the outcomes of hazard characterization are combined with the dietary intake assessment in order to describe the overall nature of the risk and its magnitude. Nutrient risk charac-terization is described as a critical ‘hand off’ to risk managers. As such, it should be designed to meet the needs of risk managers and facilitate their decision-making processes. Reviewing the problem formulation, which should have preceded the nutrient risk assessment, can be very useful in deter-mining how nutrient risk characterization can meet the risk manager’s specific needs. Overarching aspects of the model Because the nutrient risk assessment process is based on the available data (which typically are limited and do not include the results of well-designed studies intended to determine the risk of nutrient substance intake), the Group noted certain overarching aspects of the model and its use:

A Model for Establishing Upper Levels of Intake for Nutrients and Related Substances
xvi
1. Scientific judgement is a key aspect of nutrient risk assessment, but the basis for decisions should be well documented to enhance the transparency of the decision-making process.
2. Because of the reality that available data are limited, the model is designed to carefully take into account data uncertainties. As a result, it is unlikely that users of ULs need to devise additional corrections.
3. Because the nutrient risk manager typically needs a UL even in the face of limited data, efforts should be made to establish ULs if at all possible. Of course, the nutrient risk assessor clarifies the degree of uncertainty surrounding the value of the UL, which in turn enables the nutrient risk manager to take this factor into account in his or her decision-making.
4. The absence of evidence of an adverse health effect is not equivalent to evidence of the absence of an adverse health effect. This means that it is inappropriate to make conclusions about the risk or lack of risk associated with nutrient substances based solely on studies designed for purposes other than studying risk.
Applicability of the model The Group determined that the model is generally applicable to the range of nutrient substances—that is, to substances that are inherent constituents of food and are biologically essential or have a demonstrated health impact. Substances that are essential have been reasonably well identified, and they are associated with established recommended intakes. Substances that have a favourable impact on health reflect an emerging area of interest; much work is needed in order to clarify their role and metabolic functions as well as to determine the levels of intake associated with a favourable impact on health.
The Group identified situations in which the applicability of the model may be limited. Because the model is based on the identification of the point along the continuum of increasing intake at which risk may occur, the model is of limited value for nutrient substances with no known adverse health effects. In these cases, the Group recommended the use of a highest observed intake level as a strategy. Also, specific investigations are needed regarding the use of the model for substances identified as having no known intake level below which risk does not occur. A related challenge is presented by nutrient substances for which a recommended level of intake appears to overlap the level associated with risk. Several useful strategies are discussed, but the Group acknowledged the need for further study to address these concerns.
The model was considered applicable to (sub)populations in the world that are inadequately nourished and/or likely to be experiencing infectious diseases that change their metabolic states. Given their special metabolic states, it was considered likely that separate ULs are needed for such (sub)populations. However, the lack of data about the nature of these metabolic states currently limits the ability to use the model to develop these types of ULs. When more data become available, the model can be applied to address the nutrient risk assessment needs associated with these (sub)pop-ulations.
Future needs The process of developing the model and recognition of the nature of data concerning nutrient risks alerted the Group to various data gaps and to the need for additional targeted discussions in the future. Next steps also were discussed. The Group compiled a list of such gaps and needs to guide future work. The listing is not comprehensive but was viewed by the Group to include relevant tasks that will result in improved estimates of risk associated with high levels of intake of nutrient substances.
1
1 Introduction
he subject of this report is the development of a science-based international approach to nutrient risk assessment. It was developed as part of a workshop of scientific experts assembled by the World Health Organization (WHO) and the Food and Agriculture Organization (FAO).
In particular, the experts addressed nutrient risk assessment as it relates to establishing upper levels of intake for nutrients and related substances. In this report the substances of interest—nutrients and related substances—generally are referred to as ‘nutrient substances’ or occasionally as ‘nutrient(s)’ (as in ‘nutrient risk assessment’). Others may refer to such substances as ‘nutrients and other sub-stances with a nutritional or physiological effect’ or as ‘nutrients or substances with demonstrated public health relevance.’ For this report, they are regarded as inherent constituents of food that either are biologically essential or have a demonstrated favourable impact on health. They do not encompass food additives or substances such as food contaminants, pesticides, microbiological pathogens, or other food-borne hazards. However, no effort was made to delineate specific substances as nutrient substances.
The compelling interest for addressing nutrient risk assessment at this time is that nutrient substances are notably different from substances that have neither biological essentiality nor the ability to impact health favourably. In classic risk assessment for non-nutrients, it is assumed that (i) exposures occur to substances with no desirable or essential physiological roles, (ii) homeostatic mechanisms for the specific substance do not exist or detoxification pathways are not likely to be chemical-specific, and (iii) risk does not occur when levels of intake decrease. A model that takes into account these differences was the focus of this workshop.
Section 1 of the report covers the importance and uses of nutrient risk assessment and the growth of interest in this topic, a description of the workshop conducted to develop the harmonized approach, and the charge to the workshop. Section 2 provides background information, and Section 3 covers terminology and other special considerations of nutrient risk assessment. Sections 4 through 6 take the reader through the steps of the nutrient risk assessment process developed by the workshop participants, and Section 7 presents the model for nutrient risk assessment that was developed by the experts. Section 8 discusses the model’s applicability to the range of nutrient substances, Section 9 considers special populations that are inadequately nourished, and Section 10 highlights data gaps and future needs.
The scientists included nutrition and toxicology experts as well as those from related fields such as statistics and food science. The target audience for the report includes those tasked with establishing internationally applicable upper levels of intake; the model as developed addresses the key considerations related to such work. However, the report may be useful to others as well, as described below, and over time it may assist with harmonizing efforts to conduct nutrient risk assess-ment and with facilitating trade.
1.1 Reasons for the Workshop There is growing international interest in the use of nutrient risk assessment to identify upper levels of intake for nutrients and related substances. Some nutrient substances can produce adverse health effects if intake exceeds a certain amount. In turn, the increased consumption of fortified foods, dietary/food supplements, specially formulated foods, and so-called ‘functional foods’ has spurred concerns about excessive intake.
T
A Model for Establishing Upper Levels of Intake for Nutrients and Related Substances
2
Nutrient risk assessment is relevant to these concerns. It offers a science-based approach to identify and characterize the potential for a nutrient substance to cause an adverse health effect in a (sub)population. Therefore, nutrient risk assessment is germane to the protection of public health and to the practice of setting science-based international standards for foods, supplements, and other related products. Although risk assessment models for additives, contaminants, and other non-nutrient substances in foods have been well established (see Section 2.2), the nutrient risk assessment process is still evolving. Its development can draw on the existing approach for non-nutrients, but the model cannot be applied directly to nutrient substances without modification. Moreover, while several national/regional bodies have carried out work on nutrient risk assessment, an internationally applic-able model has not been identified.
Beyond the general need for an international model to address nutrient risk assessment, other interests compel this work. These interests stem from activities related to the Codex Alimentarius Commission and the WHO International Programme on Chemical Safety (IPCS).
First, the draft document entitled Codex Requests to FAO and WHO on Scientific Advice1 includes a request for FAO/WHO to provide scientific advice concerning upper levels of intake for vitamins and minerals. Furthermore, an FAO report2 to the 24th Session of Codex Committee on Nutrition and Foods for Special Dietary Uses specified FAO progress towards a risk-based approach for establishing upper ‘limits’ for nutrients and the intent to outline general principles related to upper levels and the safety of vitamins and minerals. While the nature of the FAO/WHO request for scientific advice is a set of specific upper levels of intake for nutrient substances, the task cannot be undertaken without first identifying an internationally applicable science-based model for nutrient risk assessment.
Second, the development of such a model needs to be responsive to the interests of the international harmonization of methods for risk assessment. WHO/IPCS and other organizations have recognized the importance of the harmonization of risk assessment procedures to (i) enhance the quality of risk assessments, (ii) achieve greater consistency when evaluating the risks from different sources of exposure, (iii) improve the transparency of the risk assessment process, and (iv) facilitate risk communication. In response to the Intergovernmental Forum on Chemical Safety Priorities for Action Resolution (IFCS, 1994) adopted at Forum I in 1994, IPCS undertook a project to harmonize approaches to the assessment of risk from exposure to chemicals. The goal of that IPCS project was to globally harmonize approaches to risk assessment through increased understanding—focusing on specific issues and striving for agreement on basic principles. Successful harmonization efforts will result in the efficient use of resources and in consistency among assessments. In addition, an international nutrient risk assessment model could benefit member countries that lack resources to carry out their own analyses.
In response to these interests, FAO/WHO convened a technical workshop in May 2005. This report reflects the deliberations of the workshop—formally called the Joint FAO/WHO Technical Workshop on Nutrient Risk Assessment: A Model for Establishing Upper Levels of Intake for Nutrients and Related Substances (hereafter called the Workshop). The conduct of the Workshop is described in Section 1.2 below. The Workshop was not intended to establish upper levels of intake for nutrient substances. Instead, within the context of existing approaches for risk assessment, the Workshop was to specify the nature of an international model for that purpose and to provide clarification of the specified nutrient risk assessment process. The discussions focused on key considerations for decision-making, the specification of factors that are especially important for nutrient substances, and the identification of data and research gaps at the international level.
The Workshop participants (usually called the Group in this report) were asked to develop a model that would be applicable across the range of nutrient substances. Much of the available data on
1 Codex Alimentarius Commission, Codex Requests to FAO and WHO on Scientific Advice (draft) (2004), unpublished; see ALINORM 04/27/4 (http://www.codexalimentarius.net, accessed 1 May 2005). 2 FAO report to the 24th session of Codex Committee on Nutrition and Foods for Special Dietary Uses CX/NFSDU 02/9, unpublished; see ALINORM 3/26A at para 119 (http://www.codexalimentarius.net, accessed 1 May 2005).
1. Introduction
3
nutrient risk assessment relates to vitamins and minerals. However, there are nutrient substances beyond vitamins and minerals for which risk assessment needs have been identified. Certain types of dietary fibers, amino acids, fatty acids, and dietary antioxidants all have been suggested as subjects for nutrient risk assessment. Principles related to risk assessment for vitamins and minerals should have applicability to risk assessment of other nutrient substances.
The Workshop report can assist FAO and WHO in developing scientific advice about upper levels of intake of nutrient substances, and it could have application in a variety of other venues. The report may assist nutrient risk assessors overall by describing a process for identifying upper levels of intake and characterizing risk. Likewise, this report can benefit nutrient risk managers and those with related responsibilities and interests who need science-based information from nutrient risk assess-ment for public health decision-making. By providing a set of principles and criteria useful in guiding national/regional risk assessors in conducting nutrient risk assessment, international harmonization can be encouraged. Moreover, the availability of such guiding principles could provide a scientific basis for discussing disagreements, if and when they occur, as to conclusions reached about the risk of particular nutrient substances.
The decision by FAO and WHO to undertake this work in no way detracts from or replaces concerns for risk resulting from nutrient deficiency states.
1.2 Organization of the Workshop 1.2.1 Preparation The FAO and WHO decision to begin work to address nutrient risk assessment was announced via the organizations’ websites in September 2004. The notice specified the plan to develop a background document and to solicit public input on key issues. FAO/WHO provided a background paper in November 2004 that outlined key issues and the scientific challenges related to nutrient risk assess-ment. The paper requested comment on a series of questions. The paper was posted on the organiza-tions’ websites, and relevant electronic listservs and newsletters available to the organizations were used to make its availability known. All interested parties and members of the public were invited to submit responses electronically. The comments received were posted on the website so that all inter-ested parties could view the submissions. In addition, a Call for Information was conducted.
These preparation activities closed in January 2005. The background paper and the comments received can be found on the website: http://www.who.int/ipcs/en/. 1.2.2 Identification of scientific experts Requests were made for nominations, including self-nominations, of qualified scientists for participa-tion in the Workshop. The qualifications for experts were outlined in the Call for Experts issued by FAO and WHO via their websites and relevant listservs and newsletters. These qualifications included training as well as professional experience at the national and/or international level in the areas of nutrition, toxicology, dietary exposure, statistics, food technology, biochemistry, pharmacology, and/or other closely related disciplines. The selection of Workshop participants was conducted collectively by FAO/WHO. The process took into account appropriate interdisciplinary balance of expertise, equitable geographical representation, and a reasonable balance of males and females. All experts completed a Declaration of Interests statement. Persons who made applications in response to the Call for Experts were notified of their selection/non-selection in February 2005. The Call for Experts can be found on the website: http://www.who.int/ipcs/en/.
In total, 18 scientific experts were identified to take part in the Workshop scheduled for 2–6 May 2005 at WHO headquarters in Geneva, Switzerland. The names and affiliations of participants are in Annex 1.

A Model for Establishing Upper Levels of Intake for Nutrients and Related Substances
4
1.2.3 Conduct of the Workshop At the time the identified experts agreed to serve as workshop participants, they were provided with the background paper, the comments from interested parties and other information received by FAO/WHO, and the specific FAO/WHO charge to the Workshop. Two telephone conference calls were held with participants, during which they identified the need for four discussion papers. Four Workshop participants were tasked with the development of the discussion papers. These papers are included in Annexes 2–5 of this report. The discussion papers were completed and distributed four weeks prior to the meeting of the Workshop. Two more telephone conference calls were held prior to the Workshop to identify key issues and topics for discussion during the Workshop.
Concurrent to the writing of the discussion papers, FAO/WHO developed a context paper for the Workshop participants. The paper contained relevant background information and specific ques-tions germane to the general charge (see Section 1.3 below). The context paper can be found on the website: http://www.who.int/ipcs/en/. Four weeks before the Workshop took place, the context paper was posted on the website and available for public viewing along with a draft Workshop agenda.
Plenary as well as small working group discussions took place during the five days of the meeting. Participants worked collaboratively to develop the Workshop report.
1.3 Charge to the Workshop The charge to the Workshop was given as follows:
• Workshop participants will specify a scientifically valid international model to establish upper levels of intake and conduct nutrient risk assessment. As part of this process participants will:
• As a starting point consider the existing national models for nutrient risk assessment developed at the national and regional level (note: other models or frameworks that are available in the public domain also may be taken into account);
• Develop the essential components/characteristics of hazard identification and hazard char-acterization to provide for a uniform approach to these activities internationally;
• Identify general principles for harmonizing the process (rather than the outcome) of exposure assessment and risk characterization which by their nature vary from region to region because the relevant data vary from region to region;
• Check the model (and its application of the principles) by testing it using several repre-sentative nutrients or substances, specifically vitamin A, iron and vitamin C/antioxidant;
• Work within the initial context of a model relevant to adequately nourished populations, and then identify the special considerations needed to apply the model to inadequately nourished populations (FAO/WHO, 2005).
5
2 Background
his section first describes the classic approach to risk assessment for non-nutrient substances in food—substances that include additives, contaminants, and pesticides. The information pro-vides a foundation for deriving a model for nutrient risk assessment, with the expectation that
modifications to the classic approach will be needed because of the unique properties of nutrient substances. Next, this section highlights nutrient risk assessment reports from three national/regional authorities; these reports informed the Workshop concerning existing approaches. To provide a context for nutrient risk assessment, the section then addresses applications of nutrient risk assessment and the role of problem formulation in focusing the assessment.
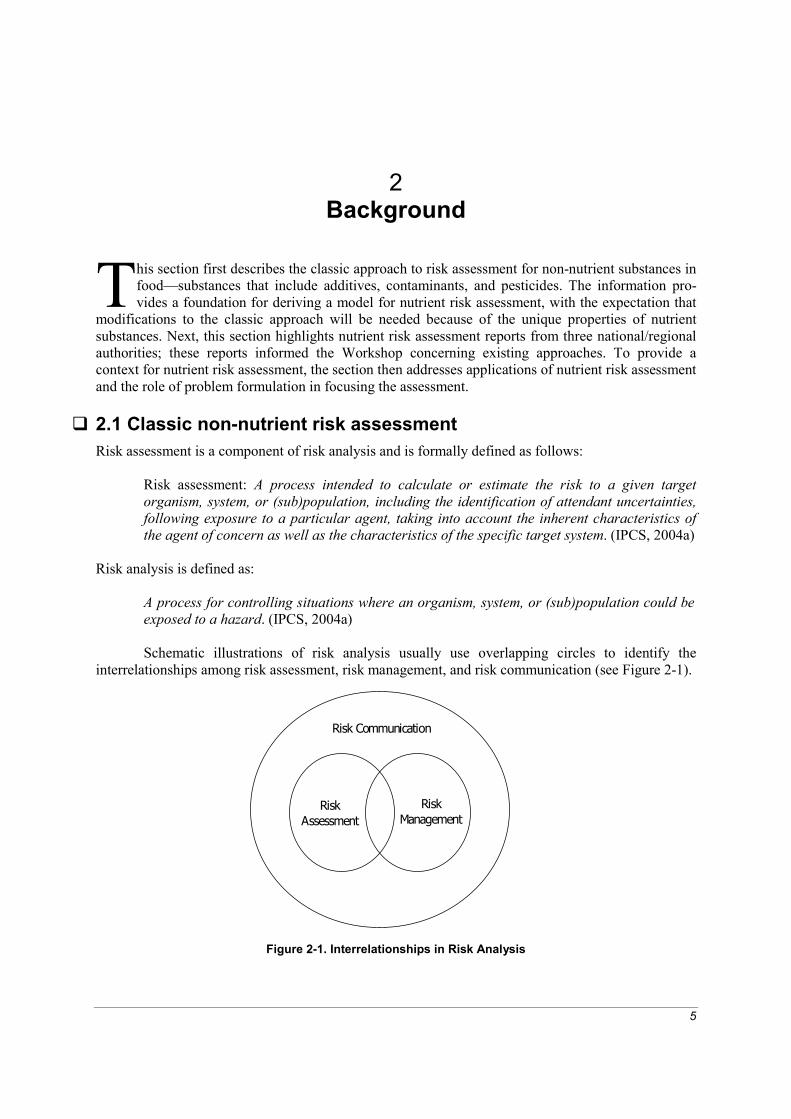
2.1 Classic non-nutrient risk assessment Risk assessment is a component of risk analysis and is formally defined as follows:
Risk assessment: A process intended to calculate or estimate the risk to a given target organism, system, or (sub)population, including the identification of attendant uncertainties, following exposure to a particular agent, taking into account the inherent characteristics of the agent of concern as well as the characteristics of the specific target system. (IPCS, 2004a)
Risk analysis is defined as:
A process for controlling situations where an organism, system, or (sub)population could be exposed to a hazard. (IPCS, 2004a)
Schematic illustrations of risk analysis usually use overlapping circles to identify the interrelationships among risk assessment, risk management, and risk communication (see Figure 2-1).
Figure 2-1. Interrelationships in Risk Analysis
T
Risk Assessment
Risk Management
Risk Communication

A Model for Establishing Upper Levels of Intake for Nutrients and Related Substances
6
Risk assessment provides the science-based information required by risk managers who, in turn, use that information along with other data in making decisions regarding actions to take to manage risk. To preserve the independence, and hence the scientific objectivity, of the assessment, the overall model for risk analysis emphasizes the separation of risk assessment activities from risk management activities. In this context, the role of a risk assessment is to serve as a basis for and provide transparent justification of a public health decision—but not to specify the decision. Although risk managers should and often do interact with risk assessors in determining the scope and problem formulation for the assessment (IPCS, 2004b), it remains important to ensure that the risk assessment presents the state of the science but does not provide conclusions or recommendations that address decisions appropriately tasked to risk managers.
In the area of food safety and non-nutrients, a number of organizations have identified models for risk analysis and, in turn, risk assessment. One of the first risk analysis frameworks for public health was put forward by the US National Academy of Sciences (NRC, 1983) to assess the risk of cancer from chemicals in food. Internationally, FAO and WHO have played roles in the development of food safety risk analysis. Many of the key principles associated with non-nutrient risk assessment are highlighted in a recent draft report on modeling dose–response (IPCS, 2004b). Moreover, the Procedural Manual of the Codex Alimentarius Commission includes “Working Principles for Risk Analysis for Application in the Framework of the Codex Alimentarius” (Codex Alimentarius Commission, 2004, pp 42-48).
At its most basic, risk assessment estimates risk. It addresses the relationships between expo-sure to a substance and the likelihood that an adverse health effect will occur in the exposed population. With regard to food safety, exposure refers to the ingestion of the substance. The conclu-sions of the risk assessment rest on an objective data review followed by scientific judgement, with decisions made during an established four-step process that is documented clearly. Uncertainties and variability in the data are identified and highlighted as part of the risk assessment. The uncertainties may be due to limitations of the available data, questions about the appropriateness of inferences made in the absence of sufficient data, or other factors.
Figure 2-2 shows the four steps of classic risk assessment. It is assumed that these steps are preceded by the formulation of the problem(s) to be addressed.
Figure 2-2. Steps in Risk Assessment
Risk characterization- Estimate proportion of population, if any, who may exceed upper level- Indicate severity- Identify special at-risk subpopulations
Hazard identificationCollection, organization and evaluation of
information about adverse effects
Hazard characterization- Evaluation of adverse effects- Dose-response/effect assessment- Development of uncertainty factors- Derivation of upper level, guidance level,‘starting point’ or explanation ofwhy upper level cannot be derived
Exposure assessmentCompilation and analysis of data
on intake
2. Background
7
Each step of classic risk assessment is described briefly below:
• Hazard identification: The identification of the type and nature of adverse effects that an agent has an inherent capacity to cause in an organism, system, or (sub)population (IPCS, 2004a)
Classic hazard identification involves the collection, organization, and review of all informa-tion pertaining to the adverse effects associated with a given substance. This step provides an overview of the ability of the substance to cause one or more types of toxicity in humans. While the selection of the critical adverse health effect upon which to base the assessment is generally carried out as the first step of hazard characterization, sometimes hazard identi-fication may encompass this activity.
• Hazard characterization: The qualitative and, wherever possible, quantitative description of
the inherent property of an agent or situation having the potential to cause adverse effects. This should, where possible, include a dose–response assessment and its attendant uncertainties1 (IPCS, 2004a)
Classic hazard characterization focuses on the detailed evaluation of the nature of the adverse health effects associated with the substance, or it may be limited to evaluation of the critical adverse health effect. It largely involves the assessment of a dose–response. In fact, some groups refer to hazard characterization as ‘dose–response assessment.’ A dose–response assessment is a process whereby scientific evidence common to all human physiology is used to specify the relationship between dose and response over an appropriate range of exposure. Based on the evaluation, an estimate of an upper level of exposure or intake (usually referred to as the upper level) is derived taking into account uncertainties such as those related to the database, those associated with differences between species and/or the variability of humans, and those resulting from any needed extrapolation among age/sex/lifestage subpopulations. Overall, the hazard is characterized and vulnerable (sub)populations are identified, if applic-able.
• Exposure assessment: Evaluation of the exposure of an organism, system, or (sub)population
to an agent (and its derivatives) (IPCS, 2004a) Classic exposure assessment is the process of compiling and analyzing data about the expo-sure to (intake of) the substance for the (sub)population of interest. Typically, the analysis includes the application of statistical adjustment factors and other data adjustments that allow conclusions about the amount of a substance being consumed on a ‘usual’ basis or over a lifetime.
• Risk characterization: The qualitative and, wherever possible, quantitative determination,
including attendant uncertainties, of the probability of occurrence of known and potential adverse effects of an agent in a given organism, system, or (sub)population, under defined exposure conditions (IPCS, 2004a) Classic risk characterization, the final step of the process, pulls together relevant information obtained during the previous steps of the assessment in order to characterize and describe the risk. Sometimes risk characterization is called ‘advice for decision-making.’ The tasks focus
1 Definition also indicates the following: Hazard assessment has also been identified⎯ i.e, a process designed to determine the possible adverse effects of an agent or situation to which an organism, system, or (sub)population could be exposed⎯ and focuses on the hazard in contrast to risk assessment where exposure assessment is a distinct additional step.
A Model for Establishing Upper Levels of Intake for Nutrients and Related Substances
8
on integrating the hazard characterization and its resulting upper level of intake with the intake/exposure assessments for the general population of interest and for vulnerable sub-populations (e.g. children). Risk characterization includes identification of the proportion of the population who may have intakes that exceed the upper level , the degree to which their intakes exceed the upper level, and information about the impact of the hazard. Usually there is a discussion of the severity of the adverse effect and the likely reversibility of the effect. Some risk characterizations include indications as to the overall public health significance of the risk. Any other scientific information is included if it could be useful in managing the problem.
In brief, hazard identification is followed by and integrated with hazard characterization. The
result produces an upper level along with an overall characterization of the hazard. An exposure assessment is also conducted, during which information about the overall exposure of the (sub)pop-ulation to the substance is compiled and analyzed. The information obtained is compared to the upper level and combined with other hazard characterization information to produce a risk characterization. Risk characterization identifies the proportion of the (sub)population likely to exceed the upper level and highlights important considerations, including the severity and nature of the adverse effect, a description of uncertainties, and the identification of any special subpopulations at risk.
In non-nutrient risk assessment, the upper level of intake has been expressed on a body mass basis or other appropriate basis. It may reflect a point below or at which no adverse effect is expected to occur or, conversely, above which there is potential for an adverse effect. Because non-nutrient risk assessments often provide an upper level on a body mass basis, such upper levels usually are not provided for separate age/sex subpopulations; but upper levels of intake may be specified for certain lifestages (e.g. pregnancy). Strictly speaking, the risk assessor does not specify the upper level as being tolerable or safe in terms of its application to food standards or related activities. This is a definitional task that generally falls within the domain of the risk manager. In practice, however, risk assessors have used a variety of terms (not all synonymous) including tolerable upper levels, tolerable daily intake, safe upper levels, and upper range of safe intake.
2.2 National/regional reports on nutrient risk assessment At the time of the Workshop, it was recognized that nutrient risk assessment outcomes produced by different bodies have varied in their approaches—suggesting that work was needed to identify an international approach. The nutrient risk assessment activities conducted by several national author-ities and related bodies and certain private groups and industry organizations have been informative and in many ways ground-breaking. Clearly, consideration of existing reports would be informative to the development of an international model for nutrient risk assessment. At the start of its work, the Group specifically reviewed reports (EC/SCF, 2000a, 2000b, 2002; EFSA, 2004; EVM, 2003; IOM, 1997, 1998a, 1998b, 2000, 2001) prepared for three national/ regional (NR) authoritative bodies (hereafter referred to as NR-reports):
• EFSA-SCF: European Food Safety Authority, European Union and (the former) Scientific Committee on Food, European Commission;
• EVM: Expert Group on Vitamins and Minerals, Food Standards Agency, United Kingdom; and
• IOM: Institute of Medicine of the National Academies, United States of America and Canada.
2. Background
9
These NR-reports provide meaningful comparisons for the purposes of this Workshop because they are quantitative in outcome and relatively comprehensive in scope. Both EFSA-SCF and IOM have prepared a series of reports to address different nutrient substances. EVM has issued a single report covering many nutrients; the report was accompanied by separate comprehensive reviews of each of the nutrients.
Comparison summary tables based on all the reports assisted the Group with its review. An example of a summary table, which addresses the risk assessment approaches for vitamin A, is provided in Annex 6. Furthermore, a detailed comparison of systematic nutrient risk assessments is included as an appendix in Discussion Paper 2 “Uncertainty and Adjustment” (see Annex 3 of this report).
Based on its review, the Group made the following general observations: • Transparency and documentation are desirable at all steps in nutrient risk assessment. In some
cases, the NR-reports provided insufficient documentation to allow an understanding of the nature of the scientific judgements. Whenever possible, principles or guidelines should be established for making scientific judgements.
• Although uncertainties in dietary intake assessments can be substantial, they have received less consideration than other types of uncertainties. Given the difficulties that arise with the use of conservative (large) correction factors for nutrient risk assessment, uncertainties in dietary intake assessment take on greater meaning and should be better incorporated into nutrient risk assessment outcomes.
• The unique aspects of nutrient substances as compared to non-nutrient substances underscore the value of bringing together nutrition expertise and toxicological expertise to provide an integrated approach for determining upper levels of intake for nutrient substances.
Also based on its review, the Group made specific observations related to a model for nutrient risk assessment; these observations appear in following subsections. 2.2.1 Terms of reference (problem statements) for the three national/ regional reports The terms of reference specified for each NR-report are given in Box 2-1 below. They reflect the ‘problem statements’ or general questions asked of the nutrient risk assessor by the nutrient risk manager or by those responsible for deliberations about addressing public health issues. The terms of reference are similar in many ways. They each call for reviewing levels of intake for nutrient sub-stances, primarily vitamins and minerals, in relation to the risk of adverse effects. All three also refer to establishing or recommending an upper level with a low or unlikely risk of adverse effects.
For EFSA-SCF, the request was to provide the basis for the establishment of safety factors for ensuring the safety of fortified foods and food supplements. For EVM, the interest was in establishing principles on which to set controls for ensuring the safety of vitamin and mineral supplements (and fortified foods when appropriate). The IOM terms of reference specify only the development of a model and the establishment of an upper level for nutrient substances.
2.2.2 Nutrient hazard identification and characterization To compare the nutrient risk assessment approaches used in preparing the NR-reports, the Group selected the work conducted for vitamin A. Report comparison summary tables were developed for the adverse health effects considered for setting upper levels (see Annex 7, “Comparison of approaches to considering adverse health effects in setting upper levels, summarized from reports by three national/regional authorities”) and for the scientific review of data concerning vitamin A and bone density (see Annex 8, “Comparison of scientific review of data on vitamin A and bone density, summarized from reports by three national/regional authorities”). The NR-reports (EC/SCF, 2002;

A Model for Establishing Upper Levels of Intake for Nutrients and Related Substances
10
Box 2-1. Terms of Reference for Three National/Regional Reportsa
EFSA-SCFa EVMb IOMc
Review upper levels of daily intakes of individual vitamins and minerals that are unlikely to pose a risk of adverse health effects;
Provide a basis for the establishment of safety factors, where necessary, for individual vitamins and minerals to ensure the safety of fortified foods and food supplements containing these nutrients.
Establish principles on which to base controls for ensuring the safety of vitamin and mineral supplements sold under food law;
Review the levels of individual vitamins and minerals associated with adverse effects;
Recommend maximum levels of intake of vitamins and minerals from supplements if appropriate; report to the Food Advisory Committee;
Advise on the levels of vitamins and minerals in fortified foods, when appropriate.
Note: EVM framed advice in terms of additional intake, covering both supplements and fortified foods, rather than as separate categories.
Develop a model to establish the maximum level of a nutrient intake that would pose a low risk of adverse effects. Apply the model to [the substances in question] to develop Tolerable Upper Intake Levels.
a EC, 2003. b EVM, 2003 c IOM, 1998a
EVM, 2003; IOM, 2001) used essentially the same references regarding vitamin A; but because the timing of the reports differed somewhat, some references were not available when the IOM review (IOM, 2001) was conducted. However, the hazards identified and the weight given to particular hazards differed across the NR-reports to a degree greater than could be attributed to differences in the available data.
Differences in various conclusions—beyond those attributable to information from newer data—probably are due to the necessary reliance on relatively limited data. Reliance on limited data, in turn, requires considerable use of scientific judgement. Even when faced with the identical set of limited data, it is possible for risk assessors to come to different conclusions. When conclusions in the NR-reports lacked clear or sufficient documentation—as often was the case—the Group could not determine the reasons for differences.
Furthermore, the Group noticed differences in approaches relating to toxicological and nutritional perspectives. In some cases, approaches taken seemed to be entirely toxicological in their thrust, with little or no reported discussion about nutritional aspects of the issue. In other cases, the approach was almost entirely nutritional in its considerations, and the application of relevant princi-ples from toxicology appeared to be minimal. This difference was associated with the national/ regional source of the NR-report rather than with the nutrient. This finding suggests that it may have been challenging to form workgroups/expert panels that have individuals who are knowledgeable in both areas. In addition, the history of collaboration by these two disciplines may be limited because nutrient risk assessment is an emerging concern. 2.2.3 Nutrient exposure/intake assessment Comparisons were made of exposure/intake assessments as part of NR-reports. A summary of findings is shown in Annex 9, “Comparison of national/regional nutrient intake assessments, summar-ized from reports by three national/regional authorities.” Not unexpectedly, the approaches differed somewhat. Each report compared estimates of the upper ‘tail’ (the extreme upper end) of intake distributions to an upper level of intake. In each case, data from different sources were combined to provide a total picture of intake from foods, supplements, and, when applicable, water. No national/

2. Background
11
regional body had access to a single database developed explicitly for the purposes of risk assessment. Some differences in the assessments were due to differences in the types of data available for the population of interest. These differences called for different strategies for assessment. In addition, different statistical methodologies were used by the national/regional bodies.
The EFSA-SCF reported intake data generally for households, men, and women. The EVM reported a single population intake on the basis of food, supplement, and water consumption; they also reported a maximum intake by summing these. The IOM reported total intakes by age/sex/ lifestage subpopulations, but at times the intakes were broken down by foods and supplements. The IOM provided the entire distribution of intake, while the others provided less information (e.g. only the mean and 97.5th percentile intakes). 2.2.4 Nutrient risk characterization The Group also examined the NR-reports with regard to the presentation of risk characterization. The presentations differed in both content and format. Since the terms of reference differed somewhat (see Box 2-1 above), some differences in presentation would be expected. Nonetheless, some of the differ-ences result from the different approaches to risk assessment taken in the steps that precede risk char-acterization.
As described in more detail in Section 6, the NR-reports varied in their generic descriptions of the information to be provided in the risk characterization. The EFSA-SCF and the IOM reports describe different approaches to the content and format of the risk characterization. The EVM does not describe a risk characterization section per se but indicates that elements of risk characterization will be present in the concluding risk assessment summation section for each nutrient.
2.3 Application of nutrient risk assessment outcomes Because the goal of nutrient risk assessment is to meet certain scientific information needs of the nutrient risk manager, the general nature of these needs should be understood when developing a model for international nutrient risk assessment. For an internationally applicable model, the output needs to address the likely range of risk management decisions or policy options that may be needed in the international setting. Moreover, understanding the information needs also helps to differentiate the types of decisions that reside with risk assessors from those that reside with risk managers. The types of decisions made by risk assessors were introduced in Section 2.1 above. Types of decisions made by risk managers follow. Boxes 2-2 through 2-5 below specify the types of information needed for different types of decisions.
Risk managers are likely to make two types of decisions in sequence: those concerning (i) the need to take action; and, (ii) if action is needed, the nature of that action. The examples below demon-strate how policy options may define the questions asked of risk assessors, and they highlight the defining role that the policy options may have in setting the stage for risk assessment. It is possible that the risk manager may identify information needs outside the scope of these examples and ask different questions of the risk assessor. This could occur when there is interest in a relatively specific nutrient risk analysis or under other circumstances appropriate at a national or regional level. 2.3.1 Nutrient risk management decisions about the need to take action Presumably a risk manager will request a nutrient risk assessment because there is reason to believe that risk is associated with intakes of one or more nutrient substances. The risk assessor must establish the risk and provide certain information to equip the manager to determine if the risk warrants immediate action, close monitoring, or no action at the current time.
Examples of information relevant to the need-to-take-action decision are given in Box 2-2 below. As shown, the nutrient risk assessor develops certain scientific information and the nutrient risk manager uses that information in conjunction with other data and considerations.

A Model for Establishing Upper Levels of Intake for Nutrients and Related Substances
12
Box 2-2. Information Used by Nutrient Risk Managers Relative to the Need to Take Action, by Source
Source of information: risk assessor Source of information: risk manager • Nature of adverse health effects:
o Severity o Vulnerable age/sex/lifestage
subpopulations o Specification if risk is for all forms of
nutrient/substance (i.e. total intake) or if for certain forms (e.g. folic acid supple-ments or food folate; pre-formed vitamin A or beta-carotene)
• Specification of upper level of intake (UL) for age/sex/lifestage subpopulations and basis for UL (e.g. total intakes or particular nutrient form)
• Identification of vulnerable subpopulations and their status relative to UL: o intake distributions of appropriate nutrient
form relative to the UL ▪ percentage exceeding the UL ▪ distribution approaching UL and at risk of
exceeding UL with relatively small changes in intake
o magnitude of intakes exceeding UL (level of intake compared with the UL; narrow-ness between intake and UL)
• Other at-risk subpopulations (e.g. malnour-ished, persons using certain drugs or with certain diseases) and nature of their risk
• If applicable, reasons why UL could not be established (e.g. insufficient data quality and/or quantity; risk present but not able to identify a threshold level)
• Description of uncertainties involved in each of the above findings
• Additional data (e.g. manufacturing data, feasibility of change, existing regulatory authorities and limitations, cost) needed to clarify the immediacy of the need for action
• As appropriate, risk managers ask risk assessors for a scientific evaluation of impact
• For other subpopulations at risk (e.g.
subpopulations with relevant diseases):a o percentage exceeding UL or the appropriate
risk intake level if different from the UL for the general population
o magnitude of intakes exceeding UL (how close to or far away from UL)
o numbers of people in these subpopulations exceeding UL
• If no UL because there is no threshold dose, identification of intake level at which adequacy is metb
• Determination of implementation terminology as needed or as appropriate, vis-à-vis ‘tolerable upper level’ or ‘safe upper level’
a Because this information initially would have been outside the scope of that considered by risk assessors, the task may fall to risk managers. However, risk managers may consider options for engaging risk assessors in relevant scientific evaluations pertaining to such information. b Because such data needs could not necessarily be anticipated prior to the risk assessment, the evaluation of the topic likely will take on an iterative aspect between nutrient risk managers and risk assessors.
2.3.2 Nutrient risk management decisions about interventions or regulatory options Assuming that the nutrient risk manager needs to take some type of public health action, he or she has several general options available. Each option requires different information from the nutrient risk assessor. The nutrient risk manager must combine that information with additional information and considerations from other sources. The options that the risk manager may pursue depend upon the nature of the risk as well as the nature of the nutrient substance, the food supply, existing regulatory frameworks, and other factors. These options generally include the following:
• Reduce the nutrient level in the food supply (if regulatory capacities and nature of substance/food products allow) through - specifying provisions and standards for product formulation, quality control, etc.;

2. Background
13
- limiting certain uses and additions to foods, including foods targeted to vulnerable subpopulations.
• Specify label information so that consumers can be informed and take action as appropriate. (Specific labelling may be done if reducing entry of the substance into the food supply is not feasible or it may be in addition to reducing entry.) Labelling mechanisms include - the use of a warning label; and - providing directions for ‘safe use.’
• Educate relevant ‘players’ to foster overall risk reduction through - educational campaigns for consumers to limit or reduce consumption; - advice to health professionals to monitor and educate the subpopulation at risk; - increased dialogue with industry to promote strategies that foster risk reduction.
Examples of information needed to select the appropriate intervention(s) to reduce risk appear
in Boxes 2-3 to 2-5 below. As shown, the nutrient risk assessor provides certain scientific information and the nutrient risk manager uses that information in conjunction with other data and considerations.
Box 2-3. Information Used by Nutrient Risk Managers Relative to Reducing the Level of a Nutrient Substance in the Food Supply, by Source
Source of information: risk assessor Source of information: risk manager • Form of nutrient substance
associated with risk: all forms (total intake) or specific forms
• Role of bioavailability in risk and factors affecting bioavailability (e.g. nutrient substance form; interactions with other meal or food components)
• Description of any nutrient–nutrient adverse interactions
• Description of uncertainties involved in information provided
• Data needed to clarify outcomes of policy decisions such as the relative contribution of particular product types or classes to total daily intakes, or—if a staple product is the source of exposure—exploration of whether a substitute staple product that contains a smaller amount of the substance can be made availablea
• Development of ‘what-if scenarios’ such as (i) the likely impact if amounts or types of nutrients were changed in specific types of foods, or (ii) the impact of using nutrient requirements (or some level thereof) as a starting point for setting limits on amounts in food so as to limit exposure to the degree possible. As appropriate or possible, request evaluation of scientific issues by risk assessor
a As appropriate, risk managers may engage risk assessors for scientific evaluation of such data.
Box 2-4. Information Used by Nutrient Risk Managers Relative to Product Labelling, by Source
Source of information: risk assessor Source of information: risk manager • Ability of individuals within subpopulations at
risk to self-identify their risk • Use conditions likely to increase or decrease
risk (e.g. consumption with or without meals, bolus or continual exposures)
• Description of uncertainties involved in the information provided
• Evaluate likelihood that vulnerable subpopulations use food products containing the substance
• Evaluation of the likelihood that vulnerable sub-populations are able to control conditions of use to decrease risk
• Evaluation of the utility and understandability of label information by high-risk subpopulations
Box 2-5. Information Used by Nutrient Risk Managers Relative to Education, by Source
Source of information: risk assessor Source of information: risk manager • Ability of individuals within subpopulations at
risk to identify their risk • Description of uncertainties involved in each of
the information needs above
• Consumer studies on components and effective-ness of educational programs
• Consultation with health professional and industry groups

A Model for Establishing Upper Levels of Intake for Nutrients and Related Substances
14
2.3.3 Other applications Nutrient risk assessment outcomes and the establishment of upper levels of intake likely would be useful in a variety of ways related broadly to nutrition and health. For example, the IOM considered upper levels of intake when proposing revisions of the amounts and kinds of foods to be provided though the US Special Supplemental Nutrition Program for Women, Infants and Children (IOM, 2005). Moreover, since food fortification programs must take into account the possibility of excessive intake of fortified products, nutrient risk assessment is very germane to addressing these possibilities. 2.3.4 Role of problem formulation Problem formulation is a preliminary activity to risk assessment that considers whether an assessment is needed, who should be involved in the process and the further risk management, and how the information will provide the necessary support for risk management (Renwick et al., 2003). It some-times is referred to as the initial step in the process of risk assessment. However, since it consists of a dialogue among relevant stakeholders including risk assessors and risk managers as well as appro-priate food industry representatives, consumers, and health professionals, it generally is considered to set the stage for risk assessment rather than to be a step in risk assessment.
In a general sense, problem formulation may lead to a variety of tasks, depending upon the issue at hand and the environment surrounding the needed assessment. Considerations for problem formu-lation may include:
• whether a risk assessment is needed; • who should be involved in the risk assessment and risk management processes; • how the assessment will provide the information necessary to support the risk management
decision; • whether data are available to embark on an evaluation of risks; • what level of resources is available; and • the timeline for completing the assessment.
Specific information to be gathered for problem formulation may include:
• a detailed inventory of prior knowledge; • identification of the (sub)populations to be the focus for the risk assessment, geographical
areas or consumer settings to be covered; • relevant route(s) of exposure; • (in some cases) the health endpoints to be considered.
In terms of issues associated with the application of the outcomes of nutrient risk assessment,
problem formulation activities should not be overlooked. That is, the risk characterization needs to be in a form relevant to the problem that was identified initially. Part of the process of ensuring that nutrient risk characterization meets the needs of the nutrient risk manager is ensuring that the needs are specified, understood, and then clarified as needed.
2.4 Summary This section covered two major topics that the Group considered as it began its work: 1) the classic approach to risk assessment for non-nutrient substances in food and 2) differences among nutrient risk assessment reports prepared by three national/regional authoritative bodies. Because the goal of nutri-ent risk assessment is to meet certain scientific information needs of the nutrient risk manager, the Group also carefully considered the nature of those information needs. Section 3 which follows presents additional information about factors important to developing a model and carrying out nutri-ent risk assessment.
15
3 Considerations for nutrient risk assessment
his section provides an overview of the Group’s discussions pertaining to setting the stage for a nutrient risk assessment model. It presents information about the relevance of an international approach to nutrient risk assessment and key terms used in the report. It also describes the
important role homeostatic mechanisms play for nutrient substances and discusses the nature of adverse health effects including biomarkers of effect.
3.1 An international approach 3.1.1 Global application One of the goals of an international model is to foster harmonization to the extent possible. In the case of a model for nutrient risk assessment, an important consideration is whether the outcomes of risk assessment can be harmonized. That is, can all the components of risk assessment be addressed globally; or are there some components that may be amenable to internationally consistent approaches and principles, but that produce different outcomes because they must take regional considerations into account? The nature of the data to be used for risk assessment makes it clear that there are globally relevant steps and population-specific steps, as described below:
• Globally-relevant steps. Some steps in the nutrient risk assessment process are based on the available scientific/medical literature. These steps identify and interpret the biological, physiological and chemical evidence for relationships between intake and the potential for harm to humans. By their nature, these data are relevant across wide and diverse (sub)popu-lations. That is, they reflect science pertaining to humans regardless of their region of origin; they have global relevance and application. This global relevance does not, of course, preclude the possibility of subpopulation-specific hazard.
• Population-specific steps. Other steps use information about the (sub)population being tar-geted for risk assessment. This information includes data about the consumption of foods and supplements and about the composition of the food and supplements consumed—data used in the exposure/intake assessment step. The exposure/intake assessment is population relevant. That is, it is dependent on the types of foods and supplements consumed and on dietary pat-terns within a region or nation-state. Since risk characterization includes considerations of the globally relevant hazard characterization within the context of the exposure/intake assess-ment, risk characterization also is population relevant.
These differences are illustrated in Figure 3-1. Figure 3-1 depicts that the use of the principles
for hazard identification and characterization results in an outcome, notably the upper level of intake, which is globally relevant. The figure also shows that exposure/intake assessment and risk charac-terization produce outcomes that are population relevant. This means that risk characterizations can be inherently different depending upon the target population. This difference holds true even when the assessments are conducted in a consistent manner using internationally applicable guiding principles.
T

A Model for Establishing Upper Levels of Intake for Nutrients and Related Substances
16
Note: UL = upper level of intake.
Figure 3-1. Steps in Risk Assessment Categorized by Global and Population Relevance 3.1.2 Inadequately nourished and ‘diseased’ populations The health and nutritional status of the (sub)population generally has received little attention related to the broad application of scientific principles for determining and characterizing risk for nutrient substances. In fact, however, estimates of upper levels of intake derived for adequately nourished and ‘generally healthy’ populations may not be appropriate for—or may need adjustments to be useful to—(sub)populations that are nutrient deficient and/or are generally subject to disease conditions such as malaria. If a model is to be applicable internationally, it must include considerations regarding high levels of intake for specific nutrient substances as may occur among (sub)populations experiencing general conditions of nutritional inadequacy. Information in this regard is useful in making decisions about the use of public health measures to provide special nutrient interventions or supplementation for such groups. A discussion of applications of the nutrient assessment model to inadequately nour-ished (sub)populations appears in Section 9.
3.2 Terminology Current definitions and terminology as developed by IPCS/WHO and Codex Alimentarius were used to provide a starting point for the Workshop. The Group was aware of the overall importance of terminology as it relates to nutrient risk assessment because existing terms have been developed for the assessment of risks posed by non-nutrients. Although it was anticipated that most available terms would be entirely compatible with nutrient risk assessment, it was acknowledged that several terms and/or their definitions might require modification. The Group selected terms and definitions to review and modified them when appropriate to enhance their applicability to nutrient substances.
The definition of risk is
Risk is the probability of an adverse effect in an organism, system or (sub)population caused under specified circumstances by exposure to an agent. (IPCS, 2004a)
The Group initially noted that risk is assessed in part by the process of characterizing hazards that are reflected by the occurrence of adverse effects. That is, ‘risk’ is the likelihood of an adverse effect

3. Considerations for nutrient risk assessment
17
occurring; and it is determined by combining the output of the process of characterizing ‘hazards’ (e.g. upper level of intake) with estimates of intake in exposed (sub)populations. Within this context, the Group concluded that the definition of risk1 needed no modifications. However, the Group modi-fied the definition for hazard and modified the term adverse effect to adverse health effect. Also, the Group specified a definition for upper level of intake. These efforts are described below. 3.2.1 Adverse health effects The Group considered the term adverse effects and determined that it was useful to insert the word health—thus modifying the term to adverse health effects. This modification better describes the nature of the effects described: that is, ‘effects’ could include non-health effects (such as changes in product sales, which clearly were not implied in the definition). No definition for ‘adverse health effects’ was found, but the Group agreed that it would be appropriate to use the existing definition from IPCS (IPCS, 2004a) for ‘adverse effects’ to define ‘adverse health effects,’ as follows:
An adverse health effect is a change in morphology, physiology, growth, development, reproduction or life span of an organism, system, or (sub)population that results in an impairment of functional capacity, an impairment of the capacity to compensate for additional stress, or an increase in susceptibility to other influences.
3.2.2 Hazard The Group noted that the term ‘hazard’ and its application to nutrient substances was highlighted as important for consideration in the comments received by FAO and WHO prior to the Workshop (see Section 1.2.1). Based on its review of definitions from IPCS2, Codex Alimentarius3, and IUPAC4 and on the unique characteristics of nutrient risk assessment, the Group defined hazard for the purposes of nutrient risk assessment as follows:
Hazard is the inherent property of a nutrient or related substance to cause adverse health effects depending upon the level of intake.
Many hazards depend upon the level of intake/exposure, and the Group specifically noted that
the IUPAC definition of hazard includes the phrase “depending on the degree of exposure” (IUPAC, 2005). They further noted that the IPCS/WHO and Codex definitions do not include this phrase. The Group then discussed the special challenge presented by nutrient substances: at one level of intake they are biologically essential or have a favourable impact on health, but at a different level of intake they may present risk.
The discussion focused on whether the term inherent property, as used in other definitions of hazard, was applicable to nutrient substances. It was decided that the inherent property of the sub-stance is responsible for the risk associated with high levels of intake. Further, it was noted that the inherent property is also responsible for the effects associated with biological essentiality or the favourable health impact. However, the inherent property of the nutrient substance is not responsible for risk associated with deficiency states. Rather, this type of risk is caused by the absence or insuffi-cient amounts of a nutrient substance.
1 The probability of an adverse effect in an organism, system or (sub)population caused under specified circumstances by exposure to an agent (IPCS, 2004a). 2 An inherent property of an agent or situation having the potential to cause adverse effects when an organism, system or (sub)population is exposed to that agent (IPCS, 2004a). 3 A biological, chemical or physical agent in, or condition of, food with the potential to cause an adverse health effect (Codex Alimentarius Commission, 2004). 4 Set of inherent properties of a substance, mixture of substances, or a process involving substances that, under production, usage, or disposal conditions, make it capable of causing adverse effects to organisms or the environment, depending on the degree of exposure; in other words, it is a source of danger (IUPAC, 2005).

A Model for Establishing Upper Levels of Intake for Nutrients and Related Substances
18
In short, nutrient substances present the unique situation that their inherent property is respon-sible for risk at high levels of intake and for the ‘health benefits’ that occur at a different level of intake, but they are not responsible for risk at low levels of intake.
The Group decided that it was important to include the concept of inherent property in the definition for the purposes of this Workshop intended to address upper levels of intake. But partici-pants also wished to highlight the difference between the inherent property of a nutrient substance to cause adverse health effects at high intakes and the inherent property of a nutrient substance to meet biological essentiality or to have a favourable impact on health at a different level of intake. Thus a reference to intake level was incorporated into the definition. Its inclusion was intended to clarify that the manifestation of the inherent property of nutrient substances to cause adverse health effects depends on the amount of nutrient substance consumed.
Then, noting that the inherent property of a nutrient substance is not responsible for the risk associated with inadequate intakes, the Group concluded that a different definition would be needed for this type of risk (which is not the subject of this Workshop). The definition presumably would focus on the lack of the nutrient substance rather than on its inherent property. Therefore, for this report, the term hazard as specified above is applicable only to the adverse health effects of a nutrient substance at high intakes, not to deficiency states associated with inadequate intakes. 3.2.3 Habitual intake The Group reviewed the time frame for dietary risk assessment and considered ways to express it. Since nutrient risk assessment generally addresses long-term or chronic intake, most of the discussion focused on the specification of such a time period. Specification of time period also was addressed during discussions of dietary intake assessment (see Section 5.2.2).
Specifically, the Group noted that the concept of a ‘lifetime’ intake (or ‘lifetime’ exposure) is less relevant to nutrient risk assessment than to other types of risk assessment that use the concept. As a rule, nutrient substances are subject to complicated homeostatic mechanisms (see Section 3.3 below) that may control or alter absorption, utilization, storage, and transport of the substance. These mech-anisms vary with age, sex, and lifestage. Therefore, these mechanisms preclude the possibility that all persons who ingest a specific amount of nutrient substance are ‘exposed’ to that substance at a similar rate and in a similar manner during a lifetime. In light of evidence that there are differences in the response to excessive nutrient substance intake by different age/sex/lifestage subpopulations (see Section 3.4.3.2 below), upper levels of intake would be more useful if determined as a long-term or chronic intake for the particular subpopulation.
Although the Group recognized that the term ‘usual intake’ commonly appears in the nutrition literature and often is used to suggest long-term intake of perhaps a year or more, the Group chose to use the term habitual intake. The rationale was based on the awareness that long-term intake patterns for nutrient substances are characterized by considerable day-to-day and seasonal variation both among and within (sub)populations. The term ‘usual intake’ suggested to the Group that such varia-tion is an aberration rather than the norm. The Group preferred the use of the term ‘habitual intake’ because it better matches the reality of the diverse patterns of intake that exist and because it gives a sense of the larger dietary context. For the purposes of this report, habitual intake is synonymous with usual intake and defined as follows:
Habitual intake is the long-term average daily intake of the nutrient substance.
3. Considerations for nutrient risk assessment
19
3.2.4 Upper level of intake 3.2.4.1 Definition After a review of several established definitions for the term upper level of intake, as well as the working definition from the Context Paper (FAO/WHO, 2005)1, the Group agreed upon the following definition:
For the purposes of nutrient risk assessment, the upper level of intake (UL) is the maximum level of habitual intake from all sources of a nutrient or related substance judged to be unlikely to lead to adverse health effects in humans.
The Group considered the use of the word ‘quantitative’ before ‘level’ to be unnecessary. However, the term ‘maximum’ was inserted to clearly indicate that the interest was in the effect of high levels of intake as opposed to inadequate levels of intake and related deficiency concerns. The Group made it clear that the term ‘maximum’ is not intended to connote any regulatory or policy action levels and emphasized that a UL is not a recommended intake.
Upon occasion, a UL may be established for a short-term or acute effect. In such cases, the term habitual intake would be replaced with acute intake in the definition for the UL and the process of risk assessment would proceed as dictated by those special considerations. 3.2.4.2 Upper levels for age/sex/lifestage subpopulations Although a number of risk assessment approaches—including some nutrient risk assessments (EVM, 2003)—express ULs in terms of lifetime exposures, the Group concluded that, to establish ULs for nutrient risk assessment, the most appropriate general approach is to develop separate ULs for age/sex/lifestage subpopulations. As the data allow, the ULs can be based on different endpoints as applicable to the sensitivity of the subpopulations.
Physiological differences among age and sex groups and during certain stages of the lifecycle (such as pregnancy or lactation) result in different intake–response relationships for the nutrient substance—sometimes including the manifestation of different adverse health effects. Recent dis-cussions pertaining to risk assessment for essential trace elements point out age-related factors associated with variable responses to levels of intake (IPCS, 2002). For example, encephalopathy has been identified as an adverse health effect in an infant ingesting large amounts of vitamin B6 (de Zegher et al., 1985), whereas sensory neuropathy has been identified as an adverse health effect among adults (Schaumburg et al., 1983). Annex 7 indicates some differences in adverse health effects that may result from high intakes of vitamin A by different subpopulations.
Furthermore, consideration of age/sex/lifestage is a hallmark of the approach for developing nutrient recommendations. For example, recommended intakes for iron for women of child-bearing age differ from those both for men and for postmenopausal women.
Given these considerations, there is a compelling reason to develop nutrient substance ULs for subpopulations (that is, on the basis of sex/age/lifestage). Under these circumstances, ‘deriving the UL’ refers to the process of deriving a set of ULs (as the data allow) for different sex/age/lifestage subpopulations. Of course, other subgroups that have special physiological characteristics would need to be addressed as well. 3.2.5 Other terminology Two additional terms have broad application to nutrient risk assessment and thus are highlighted here: specifically, the terms dose and exposure. The Group agreed that the term intake should be used in place of those two terms, as explained below.
1 A science-based quantitative level of total intake at which, or below, no risk is expected to occur assuming nutrient adequacy is met (FAO/WHO, 2005).

A Model for Establishing Upper Levels of Intake for Nutrients and Related Substances
20
The term dose suggests a discrete and controlled amount, such as would occur when a single source (e.g. a drug) provided a specified amount. In contrast, multiple food and food product sources provide nutrient substances; and total intakes vary within a given individual from day to day, and they vary across individuals as well. Thus, the Group decided that, for nutrient risk assessment purposes, the term intake (which suggests a continuous distribution on average) is preferable to the term dose (which implies a finite number of discrete and well-defined quantities).
The Group recognized that exposure generally refers to total body burden and represents the cumulative systemic amount of the substance from all sources, including both food and non-food sources. Although this definition is applicable to nutrient risk assessment, it has a drawback. The English language meaning of the term exposure as related to nutrient substances does not translate fully into all languages. Moreover, intake is the more familiar and commonly used term relating to nutrient substances. Therefore, the Group concluded that the term intake is preferable to exposure.
The term intake is used in this report from this point forward in order to be more consistent with the field of nutrition, but its use is not meant to suggest scientific differences from ‘exposure’ or ‘dose’ or differences in the application of the associated principles.
3.3 Homeostatic mechanisms for nutrient substances An important component of the Workshop discussions was the recognition of the role of homeostatic mechanisms uniquely associated with those nutrient substances that are biologically essential. Homeostasis is defined as “a tendency to stability in the normal body states (internal environment) of the organism. It is achieved by a system of control mechanisms activated by negative feedback” (Dorland, 2003). For essential nutrient substances, the body has evolved specific homeostatic mech-anisms to regulate the acquisition, retention, storage, and excretion of the substance. For instance, the blood concentrations of many essential nutrient substances (e.g. zinc, calcium) are controlled such that they do not change significantly with changes in intake.
Nutrient-related homeostatic mechanisms include a host of responses and changes involving organ systems such as the liver, the gastrointestinal tract, and kidneys as well as enzyme systems, for example by down-regulation of metabolic responses. Examples of homeostatic mechanisms associ-ated with nutrient substances are given in Table 3-1.
Table 3-1. Examples of Homeostatic Mechanisms for Nutrient Substances
Nutrient substance Homeostatic mechanism Iron Absorption increases or decreases with changes in iron stores Vitamin D Renal conversion of the nutrient substance to the active hormone is regulated by the
blood calcium level Calcium Intestinal absorption, deposition and release from bone, and urinary excretion of
calcium are under complex physiologic control, in which active vitamin D hormone plays a key role
Vitamin C Renal excretion of the vitamin occurs when the blood level exceeds a threshold value Vitamin A Storage of excess vitamin A increases in the liver until the storage capacity is exceeded
In short, homeostatic mechanisms allow the maintenance of normal body functions in the
presence of a variable ‘nutrition environment.’ No doubt both the need for and nature of these nutrient-related homeostatic mechanisms are
related to the unique dual risks that are posed by inadequate intake of an essential nutrient substance in one case and by excessive intake of the substance in the other case, as shown in Figure 3-2. In contrast, the relationship for risk associated with non-nutrients (e.g. food additives, contaminants, and pesticides) is notably different. The risk for non-nutrient substances reflects only an increase in risk with an increase in intake, i.e. it is characterized by one curve.

3. Considerations for nutrient risk assessment
21
Note: Modified from Environmental Health Criteria 228 (IPCS, 2002).
Figure 3-2. Dual Curves for Risk Relationship: Percentage of (sub)population at risk of ‘deficiency’ and
then ‘adverse health effects’ as intake levels move from low to high Figure 3-2 illustrates that the dual nature of the risk for nutrient substances results in an
intake–response curve associated with deficiency states (left curve) and a second intake–response curve associated with high levels of intake (right curve). These two separate intake–response curves are almost certainly associated with different mechanisms and pathways and are not (as perhaps mistakenly understood by some) a single ‘U-shaped’ curve. Moreover, these curves often are shown as symmetrical; but, in fact, they may have quite different shapes and degrees of steepness depending upon the nutrient substance and the subpopulation. The area between these two curves has been referred to variously as ‘range of safe intake’ or ‘acceptable range of intake,’ but such terms are not meant to imply recommended intakes.
For essential nutrients, homeostatic mechanisms are associated with both low and high levels of intake to maintain the amount of nutrient substance in the body within an acceptable range. Should intakes increase or decrease, it is assumed that homeostatic responses of some type occur, and that the responses may vary by age/sex/lifestage. However, homeostatic adaptations have a limited capacity and can be overwhelmed by excessive intake. At the extremes, as the capacity of the homeostatic mechanisms is exceeded, the incidence and/or impact of specific adverse health effects increase(s). Nutrient substances that are not established as essential but that have a demonstrated favourable impact on health are not known to be associated with homeostatic mechanisms. It is possible, how-ever, that their risk could be reflected by dual curves. In these cases, the concern associated with the left curve would presumably be the failure to optimize health. The distinctions between essentiality and a demonstrated favourable health impact require further elucidation and clarification, and such issues would benefit from discussions in the future as data evolve.
3.4 Adverse health effects and biomarkers of effect 3.4.1 Adverse health effects The identification of adverse health effects underpins nutrient risk assessment, including the estab-lishment of a UL. According to the definition in Section 3.2.1, a change can be considered adverse if it results in an impairment of functional capacity, an impairment of the capacity to compensate for additional stress, or an increase in susceptibility to other influences. Thus, if high levels of intake of a nutrient substance result in any of these changes, the change can be considered as ‘adverse.’ As such, adverse health effects can range from mild and reversible effects, such as osmotic diarrhoea, to life-threatening effects such as neuropathy or liver damage.

A Model for Establishing Upper Levels of Intake for Nutrients and Related Substances
22
A nutrient substance may trigger an adverse health effect locally in the gastrointestinal tract and/or systemically after absorption. For example, a large amount of non-absorbed nutrient substance may produce an adverse health effect by interfering with the absorption of other nutrients and/or, in some cases, producing undesirable fermentation products. Excessive amounts of non-absorbed nutri-ent substances also may produce osmotic or mucosal effects that, over time, could result in an adverse health outcome. If the intestines absorb excessive amounts of the nutrient substance, the excess may cause adverse changes in the liver or other tissues or organs. Such changes may arise through the uptake and deposition of harmful amounts of the nutrient substance in a storage organ; or the excess nutrient substance may interfere with normal cellular function, for example by interacting with enzymes or producing metabolites with the potential to cause harm. For some nutrients that are pres-ent in high concentration in the blood, the kidneys act to reduce the concentration by excretion into the urine. A high urinary concentration of the substance or one of its metabolites may result. This has been observed for vitamin C, for example; and high urinary oxalate concentration (from excessive vitamin C intake) may increase the risk of developing kidney stones.
Annex 7 lists adverse health effects identified by the NR-reports for three selected nutrients (vitamin A, iron, and vitamin C). The nature of the adverse health effects is diverse and includes gastrointestinal changes, systemic conditioning, excessive uptake from the gut, genotoxicity, carcino-genicity, increased serum cholesterol, and cancer.
The measurable effects of high nutrient substance intake within the causal pathway of an adverse health effect can range from biochemical effects without functional significance (e.g. certain changes in enzyme activity) to clinical effects that signify irreversible impairment of organ function. Figure 3-3 shows the sequence of the observable effects—from initial non-specific biochemical changes to clear irreversible clinical outcomes (Renwick et al., 2004).
Note: Adapted from Renwick et al., 2004; ‘features’ includes signs and symptoms.
Figure 3-3. Identifying Adverse Health Effects: Sequence of ‘effects’ in increasing order of severity
This flow diagram is generic in nature. In practice, the process of specifying the sequential measurement of the development of an adverse health effect would need to be developed for each type of adverse health effect. That is, the sequence would have to be fully characterized for each endpoint. For example, the sequential series of effects would need to be mapped separately for bone health effects, for liver damage, or for disorders of substrate metabolism.
Clearly, steps 4 through 7 represent adverse health effects manifesting specific clinical fea-tures such as signs and symptoms, and for this reason they can be used readily for risk assessment in the usually accepted manner. However, the Group went on to consider whether some of the effects that occur prior to step 4 could constitute appropriate ‘biomarkers.’ That is, it was acknowledged that
1. Biochemical changes within the homeostatic range and without indication of adversesequelae
?2. Biochemical changes outside the homeostatic range without known sequelae
?3. Biochemical changes outside the homeostatic range that represent a biomarker of
potential adverse effects due to excess?
4. Clinical features indicative of a minor but reversible change?
5. Clinical features of significant but reversible effects?
6. Clinical features indicative of significant but reversible organ damage?
7. Clinical features indicative of irreversible organ damage.
3. Considerations for nutrient risk assessment
23
because such effects reflect ‘critical events,’ they could serve as surrogates for adverse health effects. There was therefore a need to specify the desirable characteristics of such effects for this purpose, noting that biochemical effects without functional significance should not be regarded as adverse health effects (IPCS, 2002). Based on its discussions related to Figure 3-3 and noting the effects that occur at steps 1 through 3, the Group concluded that:
When data are available, the optimal endpoint for use in setting a UL would be an effect at step 3 and possibly step 2, with steps 4 to 7 reflective of clinical features such as signs or symptoms. Step 2 may be applicable in some cases in which sufficient information is avail-able to suggest that changes outside a homeostatic range that occur without known sequelae would be relevant as a surrogate for an adverse health effect.
Considerations related to the use of steps 2 and 3 for the purposes of nutrient risk assessment
required further discussion of the desirable characteristics of such effects—or ‘biomarkers’—as surrogates of adverse health effects. This discussion is outlined in Section 3.4.2 below. 3.4.2 Biomarkers of effect The task of specifying the nature of an appropriate biomarker was an important component of building a nutrient risk assessment model for two reasons. First, the use of biomarkers in setting the UL may offer a margin of safety relative to protecting public health because biomarkers identify a situation in which metabolic dysfunction or abnormal gross features may not yet be present but, if left uncorrected, could result. In a way, the use of biomarkers to predict increased risk of nutrient excess is analogous to the use of biomarkers to predict increased risk of nutrient insufficiencies (e.g. plasma or red blood cell folate as a predictor of increased risk of inadequacies).
Second, it is impractical to rely on data related to the clinical manifestation of adverse health effects for nutrient substances given the state of existing data (especially for humans), and expec-tations for data likely to be available in the near future. In carrying out its discussions, the Group was aware of the classically established preference for using ‘hard endpoints’ as part of risk assessments conducted for other substances. That is, while classic risk assessment does use a range of markers for adverse effects, such as changes in serum enzymes, the ability to specify clinical features of an adverse health effect (i.e. steps 4 through 7 in Figure 3-3) has been a central guiding tenet. While the Group recognized that an adverse health effect at a step of 4 through 7 brings considerable value to the risk assessment process, it concluded that, in general, nutrient risk assessment must make routine use of biomarkers for adverse health effects. That is, an approach that can readily incorporate bio-markers as surrogates for ‘hard endpoints’ was a key aspect of the model.
The Group first considered the general definition of a biomarker. Generically, biomarkers are regarded as substances, structures, or processes that can be measured in the body or its products. The specific interest was, of course, biomarkers ‘of effect’ rather than biomarkers of exposure or suscep-tibility (but the Group noted that biomarkers of exposure and susceptibility are relevant for other aspects of nutrient risk assessment). The following discussion pertains only to biomarkers of effect.
In terms of biomarkers of effect, the 1993 Environmental Health Criteria 155 (IPCS, 1993) defines a biomarker as a measurable biochemical, physiological, behavioral or other alteration within an organism that, depending upon the magnitude, can be recognized as associated with an established or possible health impairment or disease [emphasis added]. The 2001 Environmental Health Criteria (IPCS, 2001) defines a biomarker as any substance, structure or process that can be measured in the body or its products and influences or predicts the incidence of outcome or disease [emphasis added]. It further specifies that useful biomarkers are relevant and valid. In this case, relevance refers to the appropriateness of biomarkers to provide information on questions of interest and importance to the risk assessment. Validity of biomarkers refers to a range of characteristics and is a matter of degree rather than an all-or-none state.
A Model for Establishing Upper Levels of Intake for Nutrients and Related Substances
24
There is an array of measurable biomarkers that may be associated with adverse health effects. However, although measures of association may be of general clinical interest, an association alone does not allow the biomarker to serve as an appropriate surrogate for an adverse health effect for the purposes of nutrient risk assessment. Correlation does not necessarily reflect causality. A valid and useful biomarker is involved in the causal pathway.
Therefore, biomarkers were sub-divided into two classes:
1. factors: biomarkers that represent an event and are directly involved in the process of interest—that is, they are causally associated with the adverse health effect;
2. indicators: biomarkers that represent correlated or associated events and that have not been shown to be in the causal pathway.
In addition, the Group clarified some terms to facilitate meaningful discussions:
• A ‘causal’ biomarker is always ‘predictive’ of an adverse health effect, but all ‘predictive’ biomarkers are not necessarily ‘causal.’
• Biomarkers that ‘influence’ an event are ‘causal.’
• ‘Diagnostic’ biomarkers, such as certain enzymes that are diagnostic of liver damage, also exist and were considered by the Group to be useful for the purposes of nutrient risk assess-ment.
Overall, the recommended approach for nutrient risk assessment is to seek out and use bio-
markers that are causally associated with the adverse health effect—that is, those biomarkers regarded as factors. The Group concluded that the appropriate biomarkers for nutrient risk assessment are those that reflect a measurable biochemical, physiological, behavioral or other alteration within an organism that, depending upon the magnitude, can be recognized as causally associated with an established or possible health impairment or disease. Further, diagnostic biomarkers are useful. And finally, under some circumstances, biomarkers that are predictive (but not causally associated) also are appropriate for nutrient risk assessment.
In short, biomarkers that serve as surrogates for adverse health effects related to nutrient substances can be:
• causally associated with the adverse health effect; • diagnostic of the adverse health effect; or • if deemed appropriate for use, predictive of (but not causally associated with) the adverse
health effect.
The guiding principle for selecting biomarkers for nutrient risk assessment is that they are feasible, valid, reproducible, sensitive, and specific. They must, however, also be ‘used intelligently and appropriately’ by the risk assessor. In addition to causal association, general characteristics of biomarkers include:
• changes in the biomarker have a plausible relationship with changes in the risk of an adverse
health outcome; • change is usually outside the homeostatic range; • change is generally associated with adverse sequelae; and • measurement of the biomarker can be accomplished accurately and is reproducible between
laboratories.
3. Considerations for nutrient risk assessment
25
The Group considered both conceptual and analytical factors to be key aspects of the validity of biomarkers for nutrient risk assessment. That is, conceptual validity is associated with the bio-marker’s ability to truly serve as a surrogate for an adverse health effect. Analytical validity reflects robust and accurate measurement methods that are reproducible between laboratories. Overall, the Group underscored the importance of relevance when it came to selecting and studying biomarkers. They noted the adage: “Do not be seduced by increasingly precise but physiologically and nutrition-ally meaningless results.” Finally, the Group noted that although intakes that exceed homeostatic capacity should be regarded as potentially leading to an adverse health effect, currently we lack information needed to clarify what is a normal homeostatic range of biochemical values for many nutrient substances. More-over, it is possible that under certain circumstances changes within the homeostatic range could also be causally associated with adverse health effects. Thus, the ability to specify certain measured values as indicative of adverse health effects is limited.
As additional knowledge is accumulated, homeostatic ranges and deviations from these ranges undoubtedly will play an increasing role in nutrient risk assessment if they are predictive of adverse health effects caused by excessive intakes. That is, an increase in the number of identified valid biomarkers of effect could be used to enhance public health protection by identifying conse-quences of excessive intake before they progress to clinically evident adverse health effects.
Two specific needs were highlighted relative to biomarkers for adverse health effects associ-ated with nutrient substances:
1. Need: work to characterize the patho-physiological pathways associated with nutrient substances, and identify early changes. - Many currently recognized biomarkers are remote both mechanistically and temporally
from the outcome of interest. - The nature of the biomarker’s link to the event of interest is not always clear; there is the
danger of measuring a change just because “it is there.”
2. Need: establishment of collaborative networks and fostering of knowledge transfer. - Biomarkers are not standardized and not subject to benchmark quality control.
3.5 Summary This section describes the relevance of an international approach to nutrient risk assessment, defines a number of key terms used in the report, and addresses roles of homeostatic mechanisms for nutrient substances. Importantly, it characterizes the sequential nature of different effects of high intake rela-tive to development of adverse health effects and addresses the key role that biomarkers of effect play in determining risk from nutrient substances.

26
4 Nutrient hazard identification and characterization
he goals of nutrient hazard identification and characterization are to identify hazards and evaluate available data in order to establish ULs and to describe the nature of the hazard. In particular, these tasks are carried out as follows:
1. identify adverse health effects associated with intake; 2. select the critical adverse health effect; 3. establish ULs after taking into account uncertainties; and 4. characterize the hazard and identify vulnerable subgroups.
Hazard identification and characterization classically are portrayed as two separate sequential steps for the risk assessment process. However, after considering the nature of data evaluation for nutrient risk assessment, the Group concluded that hazard identification and characterization are better reflected as a closely linked, integrated activity performed for the most part as a single step—one that is characterized by iterations and refinements in data gathering and evaluation.
This section describes the nutrient hazard identification/hazard characterization process, beginning with a discussion of data evaluation and how the evaluation strategies integrate and combine the activities of hazard identification and characterization. The section then covers the four steps listed above. The Group identified clear, comprehensive documentation as an integral part of these activities. Such documentation helps ensure that the nutrient risk assessment process is trans-parent and clarifies the nature of the scientific judgements that are made.
4.1 Data search and evaluation for hazard identification and characterization: an iterative process Hazard identification and characterization, as well as risk assessment in general, are most useful when (i) the approach to and results of an objective data review are clearly and adequately described and (ii) a detailed documentation is provided regarding the decisions made throughout the process. 4.1.1 Nature of approach Compared to the science base for the risk assessment of chemicals approved for food use, the science base for nutrient risk assessment is more limited. In general, studies have not been undertaken either specifically or systematically to assess the safety of nutrient substances and to characterize the hazards they present. Thus, most of the evidence for nutrient risk assessment comes from research designed to study potential benefits of a nutrient substance and related mechanisms. Existing studies frequently lack key information needed for risk assessments, and they rarely contain data pertinent to the identi-fication of susceptible subgroups. Importantly for nutrient risk assessment, the need for the data relates to substances and food products already available and marketed to consumers. Since decisions generally cannot wait until the evidence becomes robust, scientific judgement must occur within the context of public health protection. This type of scientific judgement is a defining characteristic of nutrient risk assessment.
Because of the limited nature of the available data for nutrient risk assessment, the evidence that is gathered initially may not answer all the questions directly. As the process unfolds, the original questions may need to be modified and the review criteria may be changed. Therefore, as described in following subsections, the hazard identification and characterization process usually involves refining
T
4. Nutrient hazard identification and characterization
27
data sets and combining data in order to gain a more complete picture of the risks associated with high levels of intake.
Standardized approaches may be used for the literature search and for the collation and summarization of data relative to specific questions. Under certain circumstances, these activities may be conducted by those who are not risk assessors. However, the data integration and judgements concerning the meaning of the data require evaluation by qualified risk assessors. These scientists often find it necessary to request additional or revised data searches to obtain a full complement of evidence, help clarify the nature of the evidence, and draw conclusions. The overall process, then, is best characterized as iterative.
In comparing the results of recent nutrient risk assessments for vitamins and minerals con-ducted by national/regional bodies (see discussion in Section 2.2), it became apparent to the Group that the reports differed in the studies that were selected and used for making decisions during the hazard identification and characterization steps—despite generally similar access to the same scientific evidence. Because the reports relied upon narrative rather than systematic reviews to evalu-ate the selected studies, they lacked a consistent or sufficient basis for the user to ascertain why different studies were selected for review or used as the basis for various decisions. The Group thus considered whether the scientific quality and transparency of the scientific review process could be improved by using a more systematic process for conducting and documenting the selection and review of the scientific literature. The ‘evidence-based systematic review’ (EBSR) is one type of systematic scientific review process that has been widely used in generating clinical practice guide-lines and in identifying research gaps and needs for specific topic areas. EBSR is the subject of a Workshop discussion paper (see Annex 2). 4.1.2 Evidence-based systematic review 4.1.2.1 Brief overview of evidence-based systematic review An EBSR is done prior to, and conducted separately from, work by the expert group that will sub-sequently use the review results to develop clinical practice guidelines or to identify research needs. The EBSR process is characterized by a focused study question that narrows the review to a specified relationship between a specified intervention and (a) hypothesized outcome(s) within a specified population group. The entity that requests the review develops the focused study question. The question forms the basis of the systematic review, which often is done independently of the requestor.
Once the focused study question is articulated, the systematic review that follows includes a detailed description of the search strategy (including inclusion and exclusion criteria), the types of data to be abstracted from each article, and the methods to be used for synthesizing and presenting the data. Results of these reviews frequently include summary data tables and ratings of the method-ological quality of each of the reviewed studies. Results also describe the strength of the evidence (consistency across studies within and among diverse approaches) for the hypothesized relationship and the magnitude (strength) of the relationship between the intake and the effect. 4.1.2.2 Applicability of evidence-based systematic review in nutrient risk assessment After considering the merits of the EBSR, the Group noted that some aspects of this type of review process would enhance nutrient risk assessment. In particular, Group members identified two very useful components of an EBSR for the purposes of nutrient risk assessment: 1) the a priori definition of the search strategy criteria, and 2) the summarization of study results into table formats. In addi-tion, the Group found the inclusion of ratings of the methodological quality of reviewed studies to be useful additions to their reviews.
On the other hand, the Group noted that other aspects of EBSR—primarily the nature of the questions addressed, as currently outlined and practised—appeared to be inconsistent with the kind of scientific judgement that characterizes the nutrient risk assessment and therefore not appropriately suited to the process.

A Model for Establishing Upper Levels of Intake for Nutrients and Related Substances
28
A report from the US Agency for Healthcare Research and Quality, Systems to Rate the Strength of Scientific Evidence (West et al., 2002), specifies the nature of the questions relevant to EBSR (which the report calls ‘technology assessments’). The report indicates that the strength of the effect and the consistency of the relationship are highly relevant to EBSR. However, according to the report, criteria such as ‘coherence’ (i.e. biological plausibility)—an important cornerstone of nutrient risk assessment—are not relevant to EBSR. Furthermore, EBSR is characterized as not applicable to questions of specificity and temporality. Rather, the report indicates that specificity and temporality are ‘more appropriate for measuring risk’ than for evidence-based reviews. This suggests that, at pres-ent, there are important differences between EBSR and the type of questions relevant to nutrient risk assessment.
The questions key to nutrient risk assessment are different from those for developing clinical practice guidelines or for identifying research needs as commonly associated with the use of EBSR. For example, the starting question for nutrient risk assessment is likely to be, “What adverse health effects are associated with the intake of the nutrient substance, and at what levels of intake do they occur?” This is in contrast to EBSR questions focused on the validity and effect size of a specified hypothesized relationship limited to a particular population group, such as whether a thyroid function test using dried-blood spot specimens obtained from newborns during the first week of life adequately screens for congenital hypothyroidism.
In turn, the nature of the data needs critical to nutrient risk assessment differs from the ques-tions that initiate EBSR as usually practised. For instance, to address the question about adverse health effects stated above, the Group considered it necessary to conduct a comprehensive literature review to identify the full range of adverse health effects and their associated intake levels across population groups. This is a very broad approach that contrasts to the use of the more narrowly defined hypothesized relationships that generally form the basis for EBSR.
The Group identified that the full range of both human and animal data was useful. Even if good human studies are available, the inclusion of animal studies could provide valuable data on the nature of the intake–response relationship or aid in identifying particularly sensitive biomarkers of effect. The nutrient risk assessor considers not only the intake–response relationship but also data related to mechanisms of toxicity, kinetics, and metabolic response. Examining a broad range of data allows the assessor to combine and evaluate effects between species and population groups. These activities presently are not an integral or established characteristic of EBSR.
Additionally, the initial literature review for nutrient risk assessment should reveal any unanticipated adverse health effects mentioned in the studies selected for review. If unanticipated adverse health effects are identified in this way, the review scope would need to be expanded to retrieve all studies relevant to those unanticipated effects. That is, the identification of unanticipated adverse health effects triggers a new focused search related to that effect. As currently structured, EBSR does not anticipate this type of refinement and iterative needs.
Other differences between the approach needed for nutrient risk assessment and the current practice of EBSR were noted. In particular, the search strategy often used during the formulation stage limits population groups and/or intake levels. If such limited search strategy were used for nutrient risk assessment, it would miss important information needed by the nutrient risk assessor to under-stand the intake–response relationship fully and to identify vulnerable population groups. Also, the Group indicated that risk assessors should pose questions for the literature review and evaluation as part of an iterative process; however, the nature of EBSR associated with clinical practice guidelines is generally predicated on a set research question. Further, EBSR focuses on the size of the effect in addition to the validity of the relationship. Nutrient risk assessors must focus on the extremes of the intake–response distribution; the magnitude (effect size) of the relationship is of less relevance to their conclusions. Finally, the Group also noted the need to expand the types of quality ratings assigned to each reviewed study beyond the methodological study quality ratings that generally are associated with EBSR. These additional quality ratings would be identified by the risk assessor on a case-by-case basis and are likely to address, for example, relevance to the risk assessment of the intake and response measures used.

4. Nutrient hazard identification and characterization
29
The Group provided three main reasons for its conclusion that, if EBSR is to be relevant to nutrient risk assessment, the usual approach outlined for such reviews must be adapted. These reasons are 1) the open-ended nature of the starting questions, 2) the dependence on the integration of many types of information in order to obtain an adequate understanding of intake–response relationships and to develop uncertainty factors, and 3) the potential need for refinements of the data search and evaluation process as the decision-making process evolved. The Group acknowledged the opinion of some that the EBSR approach may be more flexible and less rigid than currently practised and that it also may be modified to include expert input through iteration during an early phrase of the question formulation. They recognized the possibility that the only immutable component of EBSR is the clear delineation and documentation of the literature search process and criteria, the critical assessment of evidence, and a strategy to grade evidence—all of which would benefit nutrient risk assessment. 4.1.3 Summary of approach to data search and evaluation Overall, considering the nature of available data and the type of data evaluation needed, the Group concluded that there is an iterative path from nutrient hazard identification through nutrient hazard characterization. This iterative path requires input and refinement on the part of risk assessor as well as the ‘fine tuning’ of data searches, summaries and analyses. The process starts very broadly and becomes more refined as the risk assessor collates and summarizes the information needed for each of the decision-making steps. Pragmatically, a clear dividing line between nutrient hazard identification and characterization is not consistent with this real-world process.
4.2 Step 1: identifying adverse health effects associated with intake As noted earlier, an important starting question is: “What are the adverse health effects associated with the intake of the nutrient substance, and at what levels of intake do they occur?” The basis for identifying which effects are adverse is ideally determined a priori and should include use of biomarkers of effect (see discussion in Section 3.4). This first part of the hazard identification and characterization process centers on producing an objective rating of the studies and compiling a clear summary of the findings regarding adverse health affects associated with intake. It also includes the grading of evidence. It does not include overall data integration and data interpretation. 4.2.1 Combining data to link intakes and adverse health effects The initial review of the available data and the development of a data set suitable for the hazard characterization pose challenges. One major challenge is the need to combine available data in order to establish the link between intake and a response. Although human data are preferable to animal data for establishing this link, in reality human data for nutrient substances are limited. Human studies often fail to provide complete information on causal linkages, yet the risk assessment will need to rely upon a causally associated link.
Figure 4-1 illustrates the general nature of links between a nutrient substance and an adverse health effect. The evidence that intake of the nutrient substance is linked to the adverse health effect may be direct (arrow C), or the evidence may be based on a biomarker of effect (arrows A and B).
When the nutrient risk assessor faces significant data gaps in the effort to make the needed link—which often is the case—it is desirable to combine data from available human studies and make use of animal and in-vitro studies to complement human data. Animal data are particularly useful if they have been designed specifically to address questions of nutrient substances and a related adverse health effect.
Figure 4-2 illustrates how combining information from different kinds of studies can provide a more complete picture of the relationship between intake and the adverse health effect. In the figure, a human data set lacking evidence to link an adverse health effect with a biological effect (that is, lacking evidence that the biological effect is a biomarker of effect) is combined with animal and in-vitro data that demonstrate relationships between (i) the intake and the adverse health effect, (ii) the intake and the biological effect, and (iii) the biological effect and the adverse health effect. In-vitro

A Model for Establishing Upper Levels of Intake for Nutrients and Related Substances
30
Nutrientsubstance
Biomarker(s)of effect
Adversehealth
effect(s)
C
BA
Note: Adapted from Discussion Paper 1, “An Evidence-based Approach to Nutrient Hazard Identification,” Figure A2-1, Annex 2.
Figure 4-1. Generic Model Linking Adverse Health Effect to Nutrient Substance
Note: Adapted from Discussion Paper 1, “An Evidence-based Approach to Nutrient Hazard Identification,”
Figure A2-2, Annex 2.
Figure 4-2. Combining Data to Establish a Link Between Nutrient Substance and Adverse Health Effect
data provide further support for a causative relationship between the intake and the biological effect, and presumably the biological effect is determined to be a valid biomarker of effect. Even though the evidence from each data set may be insufficient, taken together the consistency of the findings streng-thens the body of evidence.
As a companion activity to combining data, the risk assessor needs to gather information that is relevant to interpreting the findings from the studies. In the likely event that this need for infor-mation could not be specified a priori, the risk assessor would call for additional data searches as the process proceeds—again, underscoring the iterative nature of the data searches. There are numerous

4. Nutrient hazard identification and characterization
31
types of information useful for interpreting findings, including (i) variability of the efficiency of intestinal uptake and transfer of the nutrient substance arising from the composition of the diet and of the food matrix containing the substance; (ii) variability in intake and in metabolic states arising from age, sex, physiological conditions, and nutritional status; (iii) person-to-person variability of unknown origin; (iv) known genetic differences in the absorption and metabolism of the nutrient substance; and (v) short-term exposures during critical periods that greatly alter the risk and nature of adverse health effects (e.g. developmental effects in fetuses, infants, and young children) (IPCS, 2002). 4.2.1.1 Use of human data Human data provide highly relevant evidence for nutrient risk assessment, but it is well recognized that relatively few human studies are conducted to study hazards. There is no authoritative body responsible for conducting such research, and data are not sought systematically. Just as importantly, classically definitive research may not be ethical since it likely would involve carrying out studies in humans based on evidence that the substance causes adverse health effects in animals.
To the extent that human data are available, acceptable studies include those with experimen-tal designs (randomized controlled trials, crossover studies, and clinical interventions), observational data such as cohort studies (prospective, retrospective), case–control studies, and case series. How-ever, different types of human studies have different advantages and disadvantages for nutrient risk assessment. An experimental design such as a double-blind placebo-controlled trial is generally regarded as the ‘gold standard’ among study types. If such data meet the quality criteria (e.g. sufficient power and duration of study), they provide the most reliable form of evidence. However, the availability of experimental data is likely to be limited for reasons cited above. In any case, experimental studies have the advantage of using defined intake levels. However, the design and conduct of randomized controlled trials may still present challenges to the risk assessor. For example, the form of the nutrient substance and method of administration (e.g. a series of bolus doses) might reduce the study’s rele-vance to normal dietary intakes. The results of the study may be limited to the subpopulation used. Other challenges may occur. These challenges include the testing of only one intake level, no data reported about the additional intake from the diet, and nonsystematic reporting of adverse health effects.
In the absence of experimental studies, observational reports are used to provide information about adverse health effects in humans. In observational epidemiology and case–control studies, the intakes are not controlled, and the levels of intake may be studied as ranges rather than specified amounts. Lack of specific intake data introduces a considerable level of uncertainty into the assess-ment. Also, the possibility of bias in reporting must be considered for case–control studies. The use of observational studies is known to result in challenges to attributing causality based on associations between diet and outcome. Other limitations associated with epidemiological data for risk assessment purposes have been reviewed recently (van den Brandt et al., 2002). 4.2.1.2 Use of animal and in-vitro data Animal and in-vitro studies have long provided an important basis for hazard identification and characterization, especially for chemicals that undergo an approval process prior to human use. When properly conducted, such studies can offer key pieces of information for risk assessment purposes. Relevant internationally accepted guidelines such as those produced by the Organisation for Economic Co-operation and Development (OECD, 1998, 2000) are useful in designing these studies.
Nonetheless, nutrient risk assessors need to exercise caution in their use of data from animal and in-vitro studies. For instance, if very high amounts of the nutrient substance are fed to animals to increase the potential to produce adverse health effects, extrapolating to lower levels of intake poses a challenge. Feeding very high amounts also introduces the possibility that the high intake of one nutrient would interfere with the gastrointestinal absorption of another nutrient, thus producing a nutritional imbalance that would be irrelevant to lower levels of intake. Nonphysiological concen-trations of a nutrient substance can also be used in-vitro, which would pose similar problems of

A Model for Establishing Upper Levels of Intake for Nutrients and Related Substances
32
extrapolation and interpretation. Notably, although such study designs may present complications, they also may offer useful information. For example, when animals are given high intakes of nutrient substances to prevent the adverse health effects of another experimental intervention, a comparison of the normal controls and the controls with a high intake of the nutrient substance may reveal unex-pected toxicity in the latter.
However, as is the case with human studies, most nutrient-related animal and in-vitro studies have been designed primarily for other purposes, such as investigating possible benefits. When available, however, data from animal studies can be very helpful and may be used to complement and clarify information gleaned from human studies—especially for identifying mechanisms, deriving biomarkers of effect, determining biological plausibility, and evaluating the intake–response relation-ship. Data from in-vitro studies may further support the available evidence for humans and animals. 4.2.2 Identification and selection of data For nutrient risk assessment, the nature of the initial data search may vary; but the search charac-teristically starts broad and becomes narrower and more focused as the likely adverse health effects are identified. Thus, the search criteria should be documented not only at the beginning but each time the search is revised.
Although comprehensive searches help ensure that candidate adverse health effects are not missed, broad unfocused reviews can be very labor intensive. Therefore, consideration must be given to focusing the initial ‘sweep’ for data so that the process of hazard identification does not become unwieldy. The data search can be focused in at least two ways, depending on the conditions:
1. If the adverse health effects of interest are well documented and clearly specified in available recognized authoritative reports, the search strategy may focus on identifying more recent studies and on obtaining clarifying information to improve characterization of the hazard and to reduce uncertainties.
2. If new understandings about biochemical pathways or other factors raise a concern about the potential for previously unidentified adverse health effects, then a search for the outcomes/ biomarkers of effect/measures of interest would be used to supplement the information.
Both search strategies depend on the use of recently published reviews by recognized expert
groups as a starting point—assuming that the quality and scope of the reviews are acceptable as judged by the documentation of their search strategies. Examples of such reviews may include the NR-reports mentioned earlier (EC/SCF, 2000a, 2000b, 2002; EFSA, 2004; EVM, 2003; IOM, 1997, 1998b, 2000, 2001) and any updates. The information in such reports would be augmented by searches for more recent data or clarifying information as appropriate.
Broad-based searches of the medical literature and other relevant sources of data are needed if there is no existing review or established data set relevant to hazards associated with the nutrient sub-stance. Broad searches are also justified if 1) there is interest in identifying previously unrecognized adverse health effects (e.g. interactions with drugs or other nutrients, adverse health effects revealed as part of studies conducted for other purposes), and/or 2) there is interest in adverse health effects that appear to occur at intakes below an established UL. In these cases, broad-based searches also can help clarify the biological plausibility and likely validity of these potential hazards.
With regard to nutrient risk assessment, inclusion criteria have not been established for studies, and approaches to weighting studies have not been clearly specified. An examination of the three NR-reports relative to bone density and vitamin A (Annex 8) suggests that different inclusion criteria were used for studies and that the weighting of studies differed. The documentation for the inclusion and weighting decisions is generally insufficient in the three reports to allow identification of the nature of the scientific judgement used and the reasons for the differences.
Guidance regarding study inclusion/exclusion criteria requires more in-depth consideration than was possible during the Workshop. However, the Group suggested that, at this point in time,

4. Nutrient hazard identification and characterization
33
nutrient risk assessors attempt to use an established or at least a documented approach to the selection of data for nutrient risk assessment. One such approach is the PICO method described by Counsell (1997). The acronym PICO stands for: Participants, Intervention, Comparator, and Outcomes. Such an approach can be useful in developing criteria to define the rules of admissible evidence to address the assessment questions. For example, factors to specify in human studies include the age and sex of the participants, the spectrum of participants with co-morbidities, and vulnerable subgroups. For animal or in-vitro studies, the types of acceptable animals or cell or organ cultures should be defined. Further work is needed to identify appropriate inclusion/exclusion criteria for nutrient hazard identification. 4.2.3 Initial review of data 4.2.3.1 Rating data quality Rating and specifying data quality are key aspects of hazard identification. The ability to rate the quality of studies underpins data interpretation as well as decisions about the extent and nature of the uncertainties in the data. Furthermore, an established and documented approach to rating the evidence is a hallmark of a transparent and well supported review.
A system of rating data quality evaluates and assigns a rating to the studies within each type of study design strata, but it does not attempt to assess the comparative validity of studies across different designs. If the database is suitable for meta-analysis, a quantitative factor that reflects the quality should be assigned to the relevant groups of evidence.
Rating the quality of studies is desirable, but it is difficult. Quality scales can be problematic in that they may lead to contradictory conclusions when different scales are used (Juni et al., 1999). Nonetheless, checklists and quality scales are helpful and often are used for the assessment of adverse effects for other areas of study such as drug safety. Such scales generally consist of several to many factors believed to be associated with study quality. Weights, usually arbitrarily determined, are assigned to each of the quality factors assessed.
Potentially relevant data should be assessed against criteria specific to the study design (e.g. randomized controlled trials, prospective cohort study, case–control study). If data from experimental or intervention studies in humans are available, the rating associated with such data usually focuses on the accurate reporting of the number of study drop-outs, blinding for treatment and outcome assess-ments, ability to accurately assess intake and subsequent effects, and the appropriateness of the statistical analysis. Because of the paucity of experimental human data for nutrient substance hazards, however, most of the available data will be observational in nature. Since observational data are scarce as well, any study that meets the minimal inclusion criteria will likely be accepted as evidence for hazard identification and characterization. The Group noted that the number of study participants may serve as a key inclusion/exclusion criterion in such circumstances.
For each included study, it is important to critically evaluate the methodological quality and the thoroughness of monitoring for adverse health effects. The rating criteria for observational studies used should be criteria developed specifically for such studies—criteria that consider the characteris-tics listed in Box 4-1. Because the quality of evidence is multidimensional, a single metric is unlikely to fully cap-ture the information needed to interpret hazard data about nutrient substances. In fact, information on individual components of a study may be more useful than a single summary score. Although it might be of interest to rank the quality of all studies on the same scale regardless of study design, experience with this approach is limited and has never been validated. In fact, using a single rating scale for all studies creates potential problems. For example, a hierarchy of study design places randomized controlled trials above cohort studies in terms of methodological rigor; but, if a randomized trial is seriously flawed, the results may be more biased than those from a well-done cohort study. In addition to extracting specific information as described above, one can assign a single overall quality grade to each study: e.g. either A, B, or C. Box 4-2 lists useful categories for a single summary rating of study quality. This approach provides a generic rating system for study quality that is applicable to each type of study design but does not replace the multi-component rating suggested

A Model for Establishing Upper Levels of Intake for Nutrients and Related Substances
34
above. Variations of this approach are widely used by many healthcare technology assessment organi-zations.
Box 4-1. Recommendations for Practice: Useful characteristics to identify high-quality observational studies
• Unbiased selection of the cohort (prospective recruitment of subjects) • Adequate description of the cohort • Use of a validated dietary assessment method • Quantification of the type and amount of nutrient intake • Use of a validated method for ascertaining the endpoints/clinical outcomes • Documentation of drugs prescribed/used • Low number and random distribution of drop-outs • Adequate follow-up period • Complete follow-up • Appropriate analysis (e.g. multivariate adjustments) and reporting of results • No known pre-existing illness
Box 4-2. Recommendations for Practice:
Useful categories for specifying a single summary rating of study quality
A: Least bias, results are valid. A study that mostly adheres to the commonly held concepts of high quality for the particular level of study design; clear description of the (sub)population or study subjects, setting, intakes, and comparison groups; appropriate measurement of outcomes; appropriate statistical and analytic methods and reporting; no reporting errors; clear reporting of dropouts; and no obvious bias. B: Susceptible to some bias, but not sufficient to invalidate the results. A study that does not meet all the criteria in category A. It has some deficiencies but none likely to cause major bias. Study may lack information—thus making assessment of the limitations and potential problems difficult. C: Significant bias that may invalidate the results. A study with serious errors in design, analysis, or reporting. These studies may have large amounts of missing information or discrepancies in reporting.
The rating of animal and in-vitro studies should not be overlooked. In principle, the same general approach used for human data could be applied to the results from studies in animals and from in-vitro studies even though certain special and different factors come into play (IOM, 1998a). Information from an animal species whose biological responses are most like those of humans should be sought. However, it is important not to overlook data from species whose similarity to humans is unknown for the effects of concern. Other important factors include the route of intake (preferably the one that most resembles human intake) and consideration of the digestive state (for example, fed or fasted). If such information is not available, this lack should be reflected in the rating because its lack constitutes an important source of uncertainty. 4.2.3.2 Use of meta-analysis to synthesize data The Group considered the use of meta-analysis—a method that is increasingly used to synthesize results of scientific studies and that has utility for hazard identification and characterization. Meta-analysis can be a powerful tool to discover otherwise unapparent information. Some hazards cannot be identified until the data are ‘taken together as a whole.’ Meta-analysis thus can be helpful as part of hazard identification when several studies of the same design have addressed similar research questions. By combining data from several studies, meta-analysis also may identify candidate adverse health effects. With regard to hazard characterization, it may provide a more complete understanding of intake–response relationships than could be obtained from individual studies. If conducted on the basis of subpopulations, meta-analysis may provide particularly useful information.

4. Nutrient hazard identification and characterization
35
Specific discussions of meta-analysis methods for nutrient risk assessment are beyond the scope of this report but can be found in a number of publications (Cooper and Hedges, 1994; Laird and Mosteller, 1990; Lau et al., 1997, 1998; Stroup et al., 2000). The key consideration is that the analysis must be executed appropriately, and its limitations must be understood by the risk assessor prior to the decision to conduct meta-analysis. 4.2.3.3 Addressing uncertainty Hazard identification should serve to collect and summarize data in a manner that allows for ready specification of uncertainties in the data set. Even if performed according to stated guidelines, the process is influenced by uncertainties that are due primarily to the lack of data from systematic studies with the desirable characteristics—namely, a range of well-defined intakes, sufficient duration, and a design that assesses the occurrence of adverse health effects that can be used a priori for the process.
Uncertainty as a risk assessment concern can be regarded as “imperfect knowledge concern-ing the present or future state of an organism, system or (sub)population under consideration” (IPCS, 2004b). As described by others (NRC, 1994), uncertainty may encompass variability; but variability is not synonymous with uncertainty. Uncertainty may arise because of (i) necessary adjustment steps, as to account for differences in body size between species; (ii) inadequate data; (iii) weighting of data; and (iv) judgements about the impact of the observed effect. Variability, on the other hand, is a consequence of the distribution of exposure and/or of susceptibility to toxic effects in the (sub)popu-lation due to age, developmental stage, sex, disease, or genetic heterogeneity in homeostatic or meta-bolic pathways. If not taken into account through some type of adjustment, variability can contribute substantially to the overall uncertainty of the risk assessment process. The risk assessment must address both the uncertainty that is due to data deficiencies and the uncertainty due to variability.
Notably, data uncertainties may be greater for nutrient substances than for chemicals or con-taminants, which, as a group, have undergone more systematic review. Nonetheless, while standard approaches to correcting for non-nutrient uncertainties use conservative (that is, ‘large’) uncertainty factors (IPCS, 2002; SSC, 2000), the use of highly conservative correction factors is precluded for many nutrient substances because the method of addressing uncertainty must not result in ULs that fall below the recommended intakes associated with ‘health benefits.’ Nutrient hazard identification, therefore, is a critical point for obtaining information that leads to carefully refined judgements about uncertainty and strategies to account for it.
Section 4.4.3 provides a discussion of how the uncertainties associated with hazard identifica-tion/characterization are taken into account at several points in the process of deriving the UL and of how to specify these uncertainties so as to qualify conclusions. There are, of course, uncertainties associated with other steps in the nutrient risk assessment process, specifically with dietary intake assessment (see Section 5).
Uncertainty surrounding hazard identification can be reduced by the a priori application of a strictly structured approach to identifying hazards, one characterized as:
• based on a comprehensive search of data from human, animal, and in-vitro studies; • containing evidence ranked according to strength and statistical significance; and • including a detailed explanation of the judgements made in identifying hazards.
In practice, however, such an approach is likely to be limited by the overall paucity of available data. Common sources of uncertainty associated with hazard identification are listed in Box 4-3.

A Model for Establishing Upper Levels of Intake for Nutrients and Related Substances
36
Box 4-3. Recommendations for Practice: Identifying sources of uncertainty with potential to affect hazard identification
Potential sources of uncertainty include the following:
• Problems in estimating the study subjects’ total intake of a nutrient substance from all sources. This applies especially to human epidemiological studies but also to intervention studies, which sometimes lack data quantifying the intake from the background diet and from other non-intervention sources of the nutrient;
• Problems of reliability of data. These may be due to study design, study conduct, and statistical evaluation; sample size and study duration; the selection of a particularly sensitive or insensitive study subgroup; and insufficient assessment of compliance and of adverse health effects (as opposed to beneficial effects that the study was designed to address);
• Clinical significance of observed/measured effects and the reversibility of effects; • Biological mechanisms causing the observed adverse health effect;
• Differences in the bioavailability of different forms of the nutrient substance and the influence of food matrices on bioavailability;
• Differences in the nature of hazards following bolus intakes versus intakes from food sources; • Influence of age, sex, genetic polymorphisms, or medications;
• Relevance for humans of data derived from animal studies;
• Gaps in knowledge of the variability in kinetics and dynamics of a nutrient substance between species; • Limited data that are of high quality, e.g. in-vitro data only and/or data from a study (in animals or
humans) that used only one intake level.
4.2.4 Summarizing and presenting results The identification of candidate adverse health effects sets the stage for the selection of the critical adverse health effect, which, in turn, serves as the basis for deriving a UL and allows characterization of the hazard. The risk assessor provides data concerning adverse health effects in a coherent sum-mary, evaluates and rates studies, and presents meaningful information in summary form.
Overall, the summary from the nutrient substance hazard identification process contains all relevant information and documentation on the approaches used. At a minimum, the presentation of findings should include a summary description that includes the information listed in Box 4-4.
Box 4-4. Information Important to the Review of Individual Studies
• Subjects’ age, sex, health, race/ethnic background (or, in the case of animal studies, species and strain) • Size of study
• Nature of nutrient substance studied
• Range of intakes • Duration of intakes
• Background diet and intakes from (as applicable) food, supplements, and water • Intake assessment method(s)
• Characteristics of the nutrient substance studied
• Endpoints investigated • Relationship between intake and response (i.e. adverse health effect)
• Nature of critical adverse health effect (validation and quality criteria for the selected endpoint, i.e. biomarker of effect or clinically observable effect) and why selected
• Effect size (relationship with intake, subgroups, other factors) • Confounders (e.g. susceptibility, use of medications) and effect modifiers

4. Nutrient hazard identification and characterization
37
The Group underscored the usefulness of summary tables for organizing and presenting the evidence. In particular, they supported the development of an initial table of findings from the avail-able studies to present the levels of intake associated with adverse health effects arrayed by study type, as illustrated by Table 4-1. When completed, such a table would help the risk assessor to take the starting step for specifying the critical adverse health effect. That is, he or she could quickly scan the available data set and identify the lower levels of intake from among the candidate adverse health effects.
Table 4-1. Model Summary Table: Nutrient substance intake levels associated with candidate adverse
health effects, by study type and reference
Study Type and Reference Effect X Effect Y Effect Z Effect etc.
Intake level (value and unit of measurement) Randomized-controlled trial
Study A, etc. Cohort
Study B Study C Study D, etc.
Case–control Study E Study F, etc.
Case series Study G Study H Study I, etc.
Animal or in-vitro studies Study J Study K, etc.
Another useful table would be one that focuses on the quality and objective ratings of the
studies in the available data set for each identified adverse health effect. The data could be arranged in several ways. Table 4-2 provides an example of a format for such a summary. Its column headings cover factors that need to be considered in making an objective assessment of the data. A separate table would be needed for each adverse health effect that may become the focus for hazard charac-terization and derivation of the UL. Note that only some of the studies cited in Table 4-1 may provide data for effects “X . . .Z” in Table 4-2.
4.3 Step 2: selecting the critical adverse health effect After compiling and summarizing data pertaining to candidate adverse health effects, the process generally moves to the derivation of the UL and finally to the characterization of the hazard. In order to establish a UL, a critical adverse health effect must be selected to serve as the basis of the UL. By definition, the ‘critical effect’ is the adverse health effect(s) judged to be most appropriate for deriving the UL (IPCS, 1994).
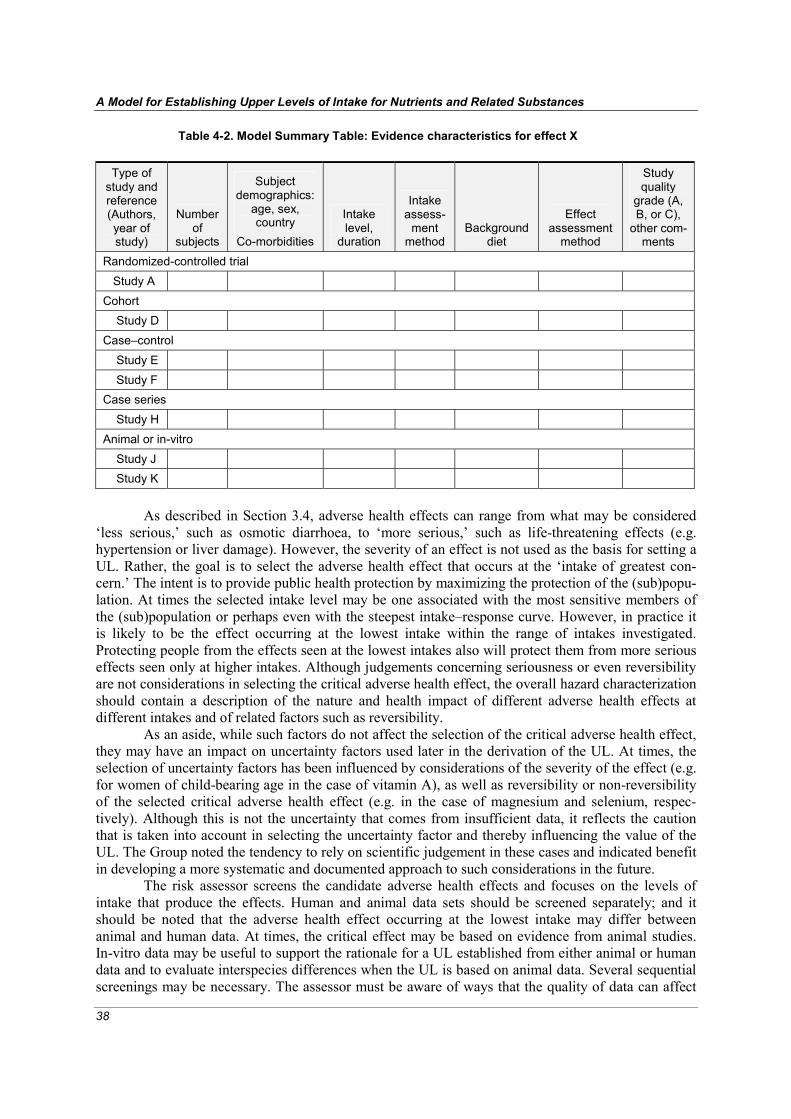
A Model for Establishing Upper Levels of Intake for Nutrients and Related Substances
38
Table 4-2. Model Summary Table: Evidence characteristics for effect X
Type of study and reference (Authors, year of study)
Number of
subjects
Subject demographics:
age, sex, country
Co-morbidities
Intake level,
duration
Intake assess-
ment method
Background diet
Effect assessment
method
Study quality
grade (A, B, or C),
other com-ments
Randomized-controlled trial Study A Cohort Study D Case–control Study E Study F Case series Study H Animal or in-vitro Study J Study K
As described in Section 3.4, adverse health effects can range from what may be considered
‘less serious,’ such as osmotic diarrhoea, to ‘more serious,’ such as life-threatening effects (e.g. hypertension or liver damage). However, the severity of an effect is not used as the basis for setting a UL. Rather, the goal is to select the adverse health effect that occurs at the ‘intake of greatest con-cern.’ The intent is to provide public health protection by maximizing the protection of the (sub)popu-lation. At times the selected intake level may be one associated with the most sensitive members of the (sub)population or perhaps even with the steepest intake–response curve. However, in practice it is likely to be the effect occurring at the lowest intake within the range of intakes investigated. Protecting people from the effects seen at the lowest intakes also will protect them from more serious effects seen only at higher intakes. Although judgements concerning seriousness or even reversibility are not considerations in selecting the critical adverse health effect, the overall hazard characterization should contain a description of the nature and health impact of different adverse health effects at different intakes and of related factors such as reversibility.
As an aside, while such factors do not affect the selection of the critical adverse health effect, they may have an impact on uncertainty factors used later in the derivation of the UL. At times, the selection of uncertainty factors has been influenced by considerations of the severity of the effect (e.g. for women of child-bearing age in the case of vitamin A), as well as reversibility or non-reversibility of the selected critical adverse health effect (e.g. in the case of magnesium and selenium, respec-tively). Although this is not the uncertainty that comes from insufficient data, it reflects the caution that is taken into account in selecting the uncertainty factor and thereby influencing the value of the UL. The Group noted the tendency to rely on scientific judgement in these cases and indicated benefit in developing a more systematic and documented approach to such considerations in the future.
The risk assessor screens the candidate adverse health effects and focuses on the levels of intake that produce the effects. Human and animal data sets should be screened separately; and it should be noted that the adverse health effect occurring at the lowest intake may differ between animal and human data. At times, the critical effect may be based on evidence from animal studies. In-vitro data may be useful to support the rationale for a UL established from either animal or human data and to evaluate interspecies differences when the UL is based on animal data. Several sequential screenings may be necessary. The assessor must be aware of ways that the quality of data can affect
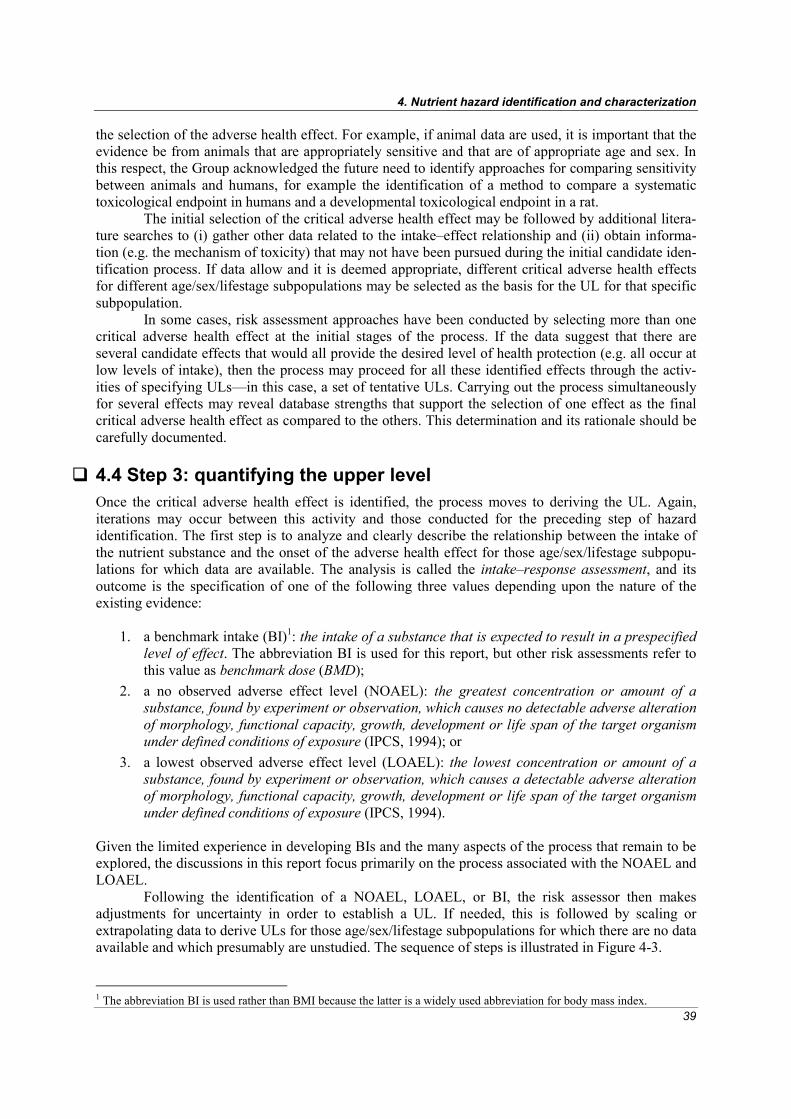
4. Nutrient hazard identification and characterization
39
the selection of the adverse health effect. For example, if animal data are used, it is important that the evidence be from animals that are appropriately sensitive and that are of appropriate age and sex. In this respect, the Group acknowledged the future need to identify approaches for comparing sensitivity between animals and humans, for example the identification of a method to compare a systematic toxicological endpoint in humans and a developmental toxicological endpoint in a rat.
The initial selection of the critical adverse health effect may be followed by additional litera-ture searches to (i) gather other data related to the intake–effect relationship and (ii) obtain informa-tion (e.g. the mechanism of toxicity) that may not have been pursued during the initial candidate iden-tification process. If data allow and it is deemed appropriate, different critical adverse health effects for different age/sex/lifestage subpopulations may be selected as the basis for the UL for that specific subpopulation.
In some cases, risk assessment approaches have been conducted by selecting more than one critical adverse health effect at the initial stages of the process. If the data suggest that there are several candidate effects that would all provide the desired level of health protection (e.g. all occur at low levels of intake), then the process may proceed for all these identified effects through the activ-ities of specifying ULs—in this case, a set of tentative ULs. Carrying out the process simultaneously for several effects may reveal database strengths that support the selection of one effect as the final critical adverse health effect as compared to the others. This determination and its rationale should be carefully documented.
4.4 Step 3: quantifying the upper level Once the critical adverse health effect is identified, the process moves to deriving the UL. Again, iterations may occur between this activity and those conducted for the preceding step of hazard identification. The first step is to analyze and clearly describe the relationship between the intake of the nutrient substance and the onset of the adverse health effect for those age/sex/lifestage subpopu-lations for which data are available. The analysis is called the intake–response assessment, and its outcome is the specification of one of the following three values depending upon the nature of the existing evidence:
1. a benchmark intake (BI)1: the intake of a substance that is expected to result in a prespecified level of effect. The abbreviation BI is used for this report, but other risk assessments refer to this value as benchmark dose (BMD);
2. a no observed adverse effect level (NOAEL): the greatest concentration or amount of a substance, found by experiment or observation, which causes no detectable adverse alteration of morphology, functional capacity, growth, development or life span of the target organism under defined conditions of exposure (IPCS, 1994); or
3. a lowest observed adverse effect level (LOAEL): the lowest concentration or amount of a substance, found by experiment or observation, which causes a detectable adverse alteration of morphology, functional capacity, growth, development or life span of the target organism under defined conditions of exposure (IPCS, 1994).
Given the limited experience in developing BIs and the many aspects of the process that remain to be explored, the discussions in this report focus primarily on the process associated with the NOAEL and LOAEL.
Following the identification of a NOAEL, LOAEL, or BI, the risk assessor then makes adjustments for uncertainty in order to establish a UL. If needed, this is followed by scaling or extrapolating data to derive ULs for those age/sex/lifestage subpopulations for which there are no data available and which presumably are unstudied. The sequence of steps is illustrated in Figure 4-3. 1 The abbreviation BI is used rather than BMI because the latter is a widely used abbreviation for body mass index.

A Model for Establishing Upper Levels of Intake for Nutrients and Related Substances
40
Note: BI = benchmark intake (called benchmark dose in other risk assessment reports);
LOAEL = lowest observed adverse effect level; NOAEL = no observed adverse effect level; UL = upper level of intake.
Figure 4-3. Steps in Quantifying the Upper Level of Intake 4.4.1 Intake–response assessment The aim of an intake–response assessment for hazard identification/characterization is to use the available evidence to characterize the relationship between different levels of intake, the occurrence of an adverse health effect, and the changing impact of that effect (such as an increasing loss of renal tubular function as the intake increases). The intake–response relationship is a hallmark of risk assess-ment, but its purpose and methods of assessing intake as a part of intake–response assessment are different from those of the dietary intake assessment process. (That process is described in Section 5 and is a separate component of nutrient risk assessment.) Moreover, for certain nutrient substances an intake–response curve cannot be specified. This situation is discussed further in Section 8.
An array of types of data can be used in the intake–response assessment; these include human, animal, and in-vitro evidence from experimental and observational studies. Animal studies are particularly useful if the critical effect demonstrated in animals has not been studied in humans or if human data are not adequate for the purpose. As noted earlier, in most circumstances it is important to use data from the most sensitive animal species, strain, and sex.
Measurements related to intake or ‘exposure’ are of two types: (i) quantitative intake data for the nutrient substance, and (ii) biomarkers of the internal amount of the nutrient substance after absorption. Usually quantitative dietary intake is the only type of data available and therefore is used as a proxy for the ‘systemic exposure’ or true amount of the nutrient substance ‘taken in’ by the body. This amount will depend on intake and the chemical form of the substance, but it can be influenced by the intestinal uptake and transfer of the nutrient into the body. Uptake and transfer, in turn, can be subject to dietary and homeostatic influences and to metabolic states. Since these factors usually are not well understood, they seldom can be taken into account. A biomarker of the intake of the nutrient substance could be a helpful measurement for examining systemic effects, but at present few such

4. Nutrient hazard identification and characterization
41
biomarkers have been identified for nutrient substances. When identified, these biomarkers—the nature of which would vary for different nutrient substances—would have to be validated in relation to nutrient substance intake. They also would need to reflect the intake for the period during which the adverse health effect was generated.
Key elements of the assessment of intake–response appear in Box 4-5.
Box 4-5. Recommendations for Practice: Key considerations for the assessment of intake–response
• Obtain qualitative and quantitative descriptions of the levels and duration of the intake causing the adverse health effect;
• Consider the nature and size of the human populations studied; the routes, magnitude, frequency, and duration of intake; relevant information on the diet history of the subjects; and blood values and urinary excretion data;
• Consider the method of estimating the nutrient substance intake;
• If possible, incorporate data on the total intake of the nutrient substance rather than relying solely on data about the test ‘doses’ of the same nutrient substances administered in experimental studies. Since in human studies the variability and distribution of the background dietary intake of the tested nutrient substance can introduce considerable uncertainty, knowledge of total intake can improve the intake–response assessment;
• As appropriate, consider conducting a meta-analysis for the purpose of enhancing the intake–response assessment.
The Group noted that meta-analysis, when correctly conducted, can be a very useful tool for
determining intake–response relationships. Good examples of its application can be found in the literature (e.g. see the meta-analysis for sodium and potassium intake in relation to blood pressure described in Geleijnse et al. (2003)).
In all cases, information about the precision associated with the intake–response should be recorded. For example, in observational studies with a range of intakes, individuals who respond with adverse health effects may be those at the extreme upper end of the intake range, where typically the intake values are associated with considerable error. If a food frequency questionnaire has been used for the study, there can be gross errors in the resulting intake estimates (see Section 5.4). When it is possible to estimate differences in the fractional absorption of the nutrient in the study population, the differences should be taken into account. Since many uncertainties have an impact on the intake–response assessment, they need to be documented carefully, and information must be provided on the decision process used to take them into account. 4.4.2 Specification of the NOAEL, LOAEL, or BI The NOAEL is the highest intake of a nutrient at which the critical adverse health effect has not been observed. If the data are not adequate to demonstrate a NOAEL, then a LOAEL (the lowest intake at which an adverse effect has been demonstrated) may be used (Renwick et al., 2004). The NOAEL and LOAEL are based on observed intake levels that are set as part of the study design. Neither takes into account the shape of the intake–response relationship that would be seen at other levels of intake. If data allow, the specification of a BI would be preferred over specifying a NOAEL or LOAEL because the BI allows the derivation of the ULs to be carried out with greater certainty. In any case, any of the three values can serve as the starting point for deriving the UL.
There is a long history of the use of NOAELs and LOAELs for risk assessments purposes (IPCS, 1987, 1994). The rationale for the identification and use of a NOAEL is that it approximates the biological threshold, which is an intake below which the adverse health effect is not produced. However, since the levels administered often are widely spaced, in some cases the observed value of the NOAEL can be considerably lower than the true biological threshold (IPCS, 1994). By definition, the LOAEL is an intake that produces a measurable level of response, but it may be less ‘true’ as an actual threshold compared to the NOAEL.

A Model for Establishing Upper Levels of Intake for Nutrients and Related Substances
42
The ability to derive a BI as part of nutrient risk assessment currently is quite limited due to the lack of suitable data. Future research efforts should include studies that would provide data to allow the calculation of a BI. In particular, the mathematical modeling used to estimate a BI requires high-quality studies with multiple intakes showing graded responses at different levels of intake. The BI would take into account the entire intake–response curve and the variation in response within the studied population. A regression function would be fitted on the response data to estimate the intake at which the adverse health effect starts to occur or, alternatively, the intake at which one can detect a specified percentage increase (over the background level) in the occurrence of the adverse health effect. The intake giving this level of response would be called the BI. A statistical lower bound, often the 95% lower bound on the intake, would be used to account for statistical uncertainties in the intake–response data. This lower bound would be the benchmark intake lower confidence limit or BIL. Figure 4-4 illustrates relationships among the BI, NOAEL, and LOAEL for nutrient risk assess-ment.
Note: NOAEL = no observed adverse effect level; LOAEL = lowest observed adverse effect level; BI = benchmark intake.
Dotted line represents the 95% upper confidence level. BI2.5 represents the level at which 2.5% of the individuals experience an adverse health effect over the background level. BIL2.5 represents the lower confidence interval of the BI2.5, i.e. the level at
which no more than 2.5% of the individuals experience the adverse health effect estimated with 95% confidence. Adapted from IPCS, 2002.
Figure 4-4. Lower Part of Intake–Response Curve for an Adverse Health Effect: NOAEL, LOAEL and BI
The Group noted that the BI approach would be particularly useful when the adverse health effect is seen within the range of the current levels of human intake and a NOAEL cannot be identi-fied. This would apply to sodium, for example. Under such circumstances, the BI or BIL is useful because it defines a point on the intake–response relationship that is reliable and relevant to the mini-mization of the risk of adverse health effects that result from high intake.
Discussion Paper 2 (see Annex 3) describes the use of the BI approach to explore the relationship between drinking water fluoride, urine fluoride, and serum fluoride and the occurrence of dental fluorosis in children from cities or villages with different concentrations of fluoride in the drinking water. Theoretically, other types of analysis can be used to estimate the BI. For example, meta-regression analysis allows assessors to extend the range of intakes by combining data from studies that are similar with respect to parameter, population, design, form of nutrient, duration, and

4. Nutrient hazard identification and characterization
43
study design. However, there appear to be no examples in which meta-regression has been applied in the identification of a BI with the intention of establishing a UL.
Overall, the data sets available for nutrient substances usually are not designed to assess intake–response for adverse health effects. Therefore, not only is the estimation of a BI problematic, there are challenges associated with establishing the NOAEL or LOAEL. In particular, study quality and design for both human and animal data are notable issues for the NOAEL (or LOAEL), and they should be carefully considered. Several ‘study-dependent’ factors that influence the magnitude of the value observed include the group size; the sensitivity of the methods used to measure the response; the duration of intake, and the selection of intake levels. For animal studies, important factors include species, strain, sex, age, and developmental status. 4.4.3 Dealing with uncertainties and setting the upper level The NOAEL or LOAEL cannot be used as the final value for the UL—except in the unlikely situation that the value was derived from a large study that is truly representative of the exposed population and contains no uncertainties and negligible errors. Given that available data will contain uncertainties, risk assessment principles stipulate that the risk assessor must take these into account. Therefore, the NOAEL or LOAEL value is adjusted for uncertainties in order to establish a UL. The BI, if established, would also be adjusted for uncertainty, but as it is not clear as to how the considerations for uncertainty associated with the NOAEL and LOAEL would apply to the BI, only the NOAEL and LOAEL are discussed. 4.4.3.1 Quantitative adjustment In dealing with uncertainty for setting the UL, the first consideration is whether there are sufficient data to make a quantitative adjustment to the NOAEL or LOAEL: that is, do the data allow the magnitude of uncertainty or variability to be defined? Quantitative adjustments are data-derived factors that provide a basis for adjusting the NOAEL or LOAEL either upward or downward based on information relevant to the target population but not addressed in the data used to derive the values. These adjustments are objective and based on specific data, and they can relate to either kinetic or dynamic aspects of the nutrient substance in different species (IPCS, 1994).
While quantitative adjustments are theoretically possible for all uncertainties, in practice available data usually allow relatively few quantitative adjustments to be made when setting the ULs for nutrient substances. One example of the use of quantitative adjustment is the process used to address differences in body size between test animals and humans. Bioavailability is another uncer-tainty for which quantitative adjustments may be used, particularly when data are available for both the kinetics and dynamics of different forms of the same nutrient substance. This adjustment could, in principle, lead to setting different ULs for different forms of the nutrient substance, for example the nicotinic acid and nicotinamide forms of niacin. 4.4.3.2 Using uncertainty factors Uncertainty factors1 are needed because (i) quantitative adjustments such as those described above are not available for all known uncertainties and (ii) for some assessments quantitative adjustments may not be possible at all. Uncertainty factors are commonly used to address the interspecies adjustments, inter-individual variability in humans, inadequacy of the overall database or of certain pivotal studies, and the nature of the adverse health effects. Like quantitative adjustments, uncertainty factors provide assurance that intake levels below the UL are unlikely to pose a risk. Moreover, uncertainty factors may be used concomitantly with a quantitative adjustment to best account for the full range of uncertainties.
In the case of non-nutrient substances, uncertainty factors have relied on conservative default values such as 10-fold corrections for species differences and 10-fold corrections for human 1 The term ‘uncertainty factor’ is a more appropriate expression than the term ‘safety factor’ since it avoids the notion of absolute safety and because the size of this factor is proportional to the magnitude of uncertainty rather than to safety.

A Model for Establishing Upper Levels of Intake for Nutrients and Related Substances
44
variability. As a result, the product of the two values—namely a 100-fold uncertainty factor—would be applied (for example, to a NOAEL expressed in milligrams per kilogram of body weight from an animal study). The use of precautionary defaults that are appropriate for non-nutrient substances poses a potential problem for nutrient substances: the resulting UL could be a value that is below the intake required to ensure nutritional adequacy. The concerns focus primarily on those nutrient substances that have recommended intakes that are relatively close to intake levels that demonstrate risk; the examples given commonly include iron, zinc, copper, and sometimes calcium. Now it is widely recognized that the use of such large defaults, which have the advantage of providing considerable assurances about the ‘safety’ associated with an estimation of the upper level of intake, are not usually applicable to nutrient risk assessment. Rather, uncertainty factors used in nutrient risk assessment require consideration on a case-by-case basis and must be placed within the context of established intake requirements.
Box 4-6 highlights the nature of uncertainty factors that have been derived when the uncer-tainty in question cannot be quantitatively adjusted as described in Section 4.4.3.1. The listing is not inclusive; other important uncertainties may be identified during a specific nutrient risk assessment. Moreover, not all uncertainties apply equally to all nutrient substances because the available data sets for each substance differ in quality and completeness.
Box 4-6. Nature of Uncertainty Factors Associated with the Derivation of an Upper Level for a Nutrient Substance
• Uncertainty: Human variability Description: Predicted but uncharacterized human variability not covered by study group or by quantitative adjustments for species differences Nature of uncertainty factor: If the NOAEL or LOAEL is based on a less sensitive subpopulation, an uncertainty factor usually is applied to the value to cover more sensitive subpopulations. This might be done, for example, to cover inadequately nourished populations if decisions are not taken to develop a separate UL for such groups. For non-nutrient substances, traditionally a factor of 10 has been used for a NOAEL or LOAEL that is based on a small study in healthy volunteers; this uncertainty factor is intended to allow for common polymorphisms and all the life stages. A factor of 10, however, may be too high in the case of specific nutrients (examples include vitamin A in fertile women, vitamin D in adults and young children, vitamin E). Clearly, appropriate modifications include considerations of requirements for the nutrient substance.
• Uncertainty: Interspecies differences Description: Kinetic and/or dynamic aspects not covered by any quantitative adjustment and typically associated with absorption, metabolism, and/or excretion Nature of uncertainty factor: Scaling according to metabolic body weight (BW0.75) is more suitable for nutrient substances than is the 10-fold default uncertainty factor associated with non-nutrients. A degree of uncertainty will remain, however, in relation to possible species differences in tissue or target organ sensitivity.
• Uncertainty: Use of a LOAEL rather than a NOAEL Description: The LOAEL is a clear effect intake and is not equivalent to the biological threshold; additional uncertainty relates to the relationship between the LOAEL and the possible position of the undefined NOAEL Nature of uncertainty factor: An uncertainty factor may be necessary to account for the differences introduced by the use of a LOAEL rather than a NOAEL. The magnitude of the factor should take into account the available intake–response data at intakes above the LOAEL; usually, a value between 1 and 10 would be used. In cases where the intake–response data included a sufficient number of intake levels producing the critical adverse health effect, an alternative and more scientific approach would be the estimation of the BI or BIL if data allow.
• Uncertainty: Short duration of study Description: Duration of the studies used as the basis for the NOAEL or LOAEL insufficient for full expression of the adverse health effect
continued on next page

4. Nutrient hazard identification and characterization
45
Box 4-6. Continued Nature of uncertainty factor: An uncertainty factor has been used for non-nutrient substances when data were unavailable from long-term studies. For nutrient substances, it is possible that the study duration used to derive the UL is too short for the adverse health effect to be expressed. Under such circum-stances, an uncertainty factor may be introduced to take the short duration into account. Using an uncertainty factor for this purpose may be particularly important for nutrient substances with storage mechanisms. However, using an uncertainty factor also might be useful if an effect on homeostasis were used to set the UL—for example, for the nutrients copper or vitamin E. A case-by-case approach is needed.
• Uncertainty: Inferior quality of the study(ies) Description: Quality of the studies used to define the UL is limited with regard to the sensitivity of the methods used, number of individuals studied, etc. Nature of Uncertainty Factor: Studies of lesser quality, especially in terms of identifying adverse health effects and of defining adequately the NOAEL or LOAEL, require an uncertainty factor related to the quality of the data. The magnitude of the factor should reflect the extent to which the study data may have overestimated the true threshold.
• Uncertainty: Specific population groups Description: Circumstances in which a UL may be inappropriate for a subgroup within the age/sex/life-stage subpopulation Nature of uncertainty factor: Some identified ‘at risk’ groups—for example subgroups with phenyl-ketonuria or those with different nutritional status than the studied subpopulation—may require separate consideration and separate values. This would require case-by-case determinations and would be elaborated upon in the risk characterization. An example would be setting the UL for iron intake for individuals with hereditary haemochromatosis.
Note: NOAEL = no observed adverse effect level; LOAEL = lowest observed adverse effect level; UL = upper level of intake
Uncertainty factors are not likely to be independent of each other (Calabrese and Gilbert,
1993), and adjusting the NOAEL or LOAEL using a variety of individual uncertainty factors may not be the best approach. Consideration should be given to the use of a composite uncertainty factor as described below. 4.4.3.3 Deriving a composite uncertainty factor Rather than applying individual uncertainty factors to the NOAEL or LOAEL, it is preferable to derive a composite uncertainty factor. This single composite factor adjusts the NOAEL or LOAEL for uncertainty after any available quantitative adjustments have been made. Because the risk assessment of nutrient substances has to consider both toxicity and essentiality, the use of a composite factor increases the likelihood that the completed adjustment will not be so large as to result in a UL that is lower than the required intake of the nutrient substance.
The steps for deriving a composite uncertainty factor are listed in Box 4-7. The choice of the magnitude of individual uncertainty factors and of the composite uncertainty factor requires careful judgement as to the quality of the available evidence (Dourson et al., 1996).
Box 4-7. Recommendations for Practice: Steps to derive a composite uncertainty factor
• Identify all uncertainties not addressed by a quantitative adjustment.
• Grade or rank uncertainties by their expected impact level (e.g. high, medium, low, none) on the total amount of uncertainty for each of the different population groups.
• Develop a listing or table of the rankings, including a description of the rationale for the assigned level of impact.
• Ensure that the choice of the uncertainties that are incorporated into the composite uncertainty factor is consistent with the ranking of their expected impacts.
• Clearly and explicitly describe the basis for the composite uncertainty factor. This helps focus on the scientific and objective nature of the activity.

A Model for Establishing Upper Levels of Intake for Nutrients and Related Substances
46
Presenting the information in a manner similar to that shown in Table 4-3 will provide a record of the identified concerns relative to uncertainties and of the weights given to each as part of the establishment of the UL.
Table 4-3. Sample Format for Organizing Data Used for Deriving a Composite Uncertainty Factor
Type of uncertainty Specific concerns for
data set Level of impact1 Rationale for level of
impact
1 Specified as: high = major source of uncertainty and determinant of the composite uncertainty factor; medium = a moderate source of same; low = a slight source of same; none = no impact but should be recorded.
As shown in Figure 4-3 presented earlier, the UL is established as the value resulting from the
various adjustments (i.e. a quantitative adjustment(s) and/or a composite uncertainty factor) that were made because of uncertainty surrounding the NOAEL or LOAEL. 4.4.4 Adjustment of upper level of intake for unstudied age/sex/lifestage subpopulations Data are scarce for many age/sex/lifestage subpopulations other than ‘normal’ adults. Therefore, although it is desirable to establish ULs based on data and endpoints relevant to the specific subpopu-lation, it may be necessary to establish a UL by adjusting the adult UL. To adjust or ‘scale’ adult ULs in order to estimate ULs relevant to children, three possibilities exist: adjustment based on (i) the quantified reference body weight established for the age group; (ii) body surface area, which is calculated using the reference body weight taken to the power of 0.66 (i.e. BW0.66); or (iii) energy requirement, which is sometimes referred to as metabolic body weight and is calculated using the reference body weight taken to the power of 0.75 (i.e. BW0.75). Although an approach based more directly on knowledge of differences in the metabolism, homeostatic mechanisms, and toxicokinetics between children and adults would be preferable, in the absence of such data, appropriate scaling is needed.
Scaling according to reference body weight uses the formula:
(ULchild) = (ULadult) (weightchild / weightadult). This method of scaling does not take into account intermediary metabolic rates, energy intake, and basal metabolic rate. The ULs for children that are extrapolated in this manner are consistently lower than ULs scaled by body surface area or metabolic body weight. In fact, ULs for children that are derived from scaling based on body weight may be lower than the established requirements for the children. Therefore, reference body weight scaling may be an inappropriate approach to scaling.
Because nutrient substances usually are components of normal intermediary metabolism, scaling on the basis of either surface area (i.e. BW0.66) or energy requirement (i.e. BW0.75) is likely to be more appropriate. Scaling according to surface area uses the formula:
(ULchild) = (ULadult) (weightchild / weightadult)0.66 and scaling on the basis of energy requirement uses the formula:
(ULchild) = (ULadult) (weightchild / weightadult)0.75.
4. Nutrient hazard identification and characterization
47
Scaling using either approach results in higher UL values than scaling on the basis of reference body weight. Table 4-4 illustrates how the ratios that form the basis for the scaling differ depending on the method used and on the age group of the child. For example, if scaling the UL for an adult on the basis of energy requirement to obtain the UL for a 1-year-old child, one could divide the adult UL by 4.4. Notably, the difference in ratios among the scaling methods becomes smaller with increasing age. Table 4-4. Comparison of Three Ratios That Could be Used for the Scaling of the Adult UL to Obtain the
UL for a Child, by Weight of Child
Ratio, a by type of scaling factor
Age, yr Child’s reference
weight, kg Reference body
weightb Surface areac Energy requirementd
0 (birth) 3.5 21.2 7.7 10.0 0.5 7.7 9.7 4.4 5.5 1 10.3 7.3 3.8 4.4
10 34.0 2.2 1.7 1.8 a 75 kg is the reference weight for the adult that is used to compute the ratio. b ratio = (weightadult / weightchild) c ratio = (weightadult / weightchild)0.66 d ratio = (weightadult / weightchild)0.75
Note: UL = upper level of intake
Scaling according to basal metabolic rate, which is a function of metabolically active body mass, appears to be a more logical approach than scaling according to body weight. The assumption is that energy turnover and nutrient turnover change in a parallel manner. (With the notable exceptions of thiamine and niacin, however, data that show a relationship between energy intake and nutrient requirement admittedly are scarce.) Such an assumption supports adjustment of the UL on the basis of body weight to the 0.75 power (i.e. BW0.75) for humans of different size. However, such an adjustment does not take into account differences in adaptive and homeostatic mechanisms among the nutrient substances with regard to absorption and elimination, and it does not take into account differences in metabolism and in the synthesis of body tissue during growth. Moreover, BW0.75 should not be used for pregnancy and possibly not for the elderly. Elderly persons may have a lower body mass than do younger adults; but, unlike children, their metabolic activities are lower than those of younger adults. In any case, an explanation based on scientific evidence should be provided as to the choice of the scaling method for a particular nutrient substance. 4.4.5 Summary: setting an upper level of intake In summary, the available data provide the basis for deriving a UL. The risk assessor follows the steps shown in Figure 4-3 to evaluate and incorporate the available evidence. Uncertainties surrounding the values derived must be addressed as appropriate through quantitative adjustment and/or the applica-tion of a composite uncertainty factor. Other adjustments must be considered for unstudied age/sex/ lifestage subpopulations.
4.5 Step 4: characterizing the hazard and identifying vulnerable subgroups At the final stages of nutrient hazard identification and characterization, the risk assessor characterizes the hazard by preparing a concise narrative that summarizes the conclusions reached and the basis for those conclusions, identifies vulnerable subgroups, and indicates other pertinent information about the hazards associated with the intake of the nutrient substance. The purpose of the narrative is to present scientific information in an organized way so that it can be used in the next steps of nutrient risk assessment.

A Model for Establishing Upper Levels of Intake for Nutrients and Related Substances
48
Hazard characterization can be done in tabular form, narrative form, or a combination of both. A narrative would include an overview of available data and the uncertainties encountered. Particular attention should be given to the nature and limitations of the intake–response relationship. Important information should be highlighted. Although severity and reversibility are not to be considered for selecting the critical adverse health effect, these factors need to be specified as part of the descriptive summary of hazard characterization. Matters of genetic diversity (for example, the presence of traits for haemolytic anaemia) should also be highlighted. Overall, facts about vulnerable subgroups and the nature of their vulnerabilities should be made clear as part of the hazard characterization. Relevance of the UL to vulnerable subgroups can be included as appropriate.
4.6 Summary This section of the report presents guidance for conducting hazard identification and hazard character-ization for nutrient risk assessment. The approach is based on a combined iterative process. Key elements include identifying adverse health effects associated with nutrient substance intake, selecting the critical adverse health effect, quantifying the UL giving careful consideration to uncertainties in the data, identifying vulnerable subgroups, and characterizing the hazard in a summary form. Given current limitations in the data needed for hazard identification and characterization, the Group identi-fied a number of data gaps and future needs to guide research. These appear in Section 10.

49
5 Dietary intake assessment
ietary intake assessment is akin to the ‘exposure assessment’ conducted as part of risk assessment for non-nutrients. As described in this section, the Workshop participants first considered definitions relevant to dietary intake assessment and then moved to the task of
identifying principles universally applicable in determining the process (rather than the outcome) of dietary intake assessment. These principles should foster harmonization and are specified in the sub-sections that cover the six major steps of dietary intake assessment.
5.1 Overview: definitions, principles, and harmonization 5.1.1 Definitions During discussions of dietary intake assessment, the Group acknowledged that different regions may vary in their definition of what constitutes a dietary source of a nutrient substance depending upon existing regulatory frameworks or other related considerations. For clarity within this report, the Group defined dietary intake as follows:
Dietary intake is the quantitative amount of the nutrient substance ingested from sources that generally include foods (and beverages), fortified foods, specially formulated foods (some-times called functional foods), dietary/food supplements, water, and other non-drug products such as botanicals and plant extracts.
The definition underscores the possibility that the focus of nutrient risk assessment can be wide-ranging. For clarity, the Group distinguished between the terms dietary consumption and dietary intake as follows:
Dietary consumption refers to the amounts of products (e.g. food, supplements, water) con-sumed that provide nutrient substances. Dietary intake refers to the ingested amounts of the nutrient substance obtained through dietary consumption.
As described earlier, the Group defined the term ‘habitual intake’:
Habitual intake refers to the long-term average daily intake of the nutrient substance. As used in this report, habitual intake is synonymous with ‘usual intake’—the term that appears in much of the scientific literature on this topic. See Section 5.2.2.1 for more information. 5.1.2 Objectives and key principles for dietary intake assessment By providing a quantitative estimate of the intake of a nutrient substance by the (sub)population of interest, dietary intake assessment provides the information needed to estimate the proportion of the (sub)population that is likely to exceed the UL. When combined with the UL and other information gleaned from hazard identification/characterization, the dietary intake assessment is essential to describing the risk associated with excessive intake.
D

A Model for Establishing Upper Levels of Intake for Nutrients and Related Substances
50
A major task of dietary intake assessment is to use data about the composition and the amounts of the dietary items consumed to estimate the total nutrient substance intake for the (sub)pop-ulation of interest. The risk assessor compiles data, conducts analyses, makes the appropriate statis-tical adjustments, and then compares intakes to the UL.
Box 5-1 lists six principles for dietary intake assessment that are applicable for all regions/ countries.
Box 5-1. Recommendations for Practice: Six principles for dietary intake assessment
The assessment should: 1. be conducted and presented in a manner that answers the questions posed by the risk manager; 2. be based on a distribution of habitual intakes when possible; 3. be developed to reflect the age/sex/lifestage groupings for which the upper level of intake has been
established; 4. take into account the uncertainties associated with estimating intakes of nutrient substances; 5. use reasonable strategies to produce needed estimates when data are not available; and 6. contain full documentation for all aspects of the intake assessment.
The use of distributions of intake (principle #2 above) for the (sub)population is more infor-
mative than the use of one or several fixed values (such as a mean and a 90th percentile) because distributions offer an overall picture of the intake pattern and can be of greater utility when policy options are assessed by risk managers. Moreover, distributions based on individual dietary intakes provide a more accurate estimation of intake for persons in the population than do data derived from ‘availability information’ such as food balance sheets, food disappearance records, or sales data. Since information on consumption by individuals is not available in many parts of the world, however, other strategies must be employed to estimate intake (principle #5 above).
In any case, consistent with the interest in improved transparency and documentation, essential information includes specification of the data sources used for analysis (including, for example, sample sizes, instruments used to collect dietary consumption data, and year(s) of data collection) and a description of the methods for analysis, dealing with uncertainties, and addressing incomplete data sets.
No matter how dietary intakes are determined, they are estimations of intake. As such, dietary intake assessment can introduce considerable uncertainty into the risk assessment process. Uncertain-ties may be due to analytic strategies for estimating intake, the quality of the composition and con-sumption data, and methods used to combine data from different sources. Moreover, true intake or ‘exposure’ cannot be known precisely because it is affected by the absorption, assimilation, and trans-port of nutrients. Even under ideal circumstances, these post-ingestion factors cannot usually be taken into account adequately during the dietary intake assessment process. 5.1.3 Harmonization of methods for dietary intake assessment Dietary consumption, which determines dietary intake of a nutrient substance, varies in different parts of the world for a wide range of environmental and cultural reasons. Thus, as discussed in Section 3.1, dietary intake assessment is population relevant rather than globally relevant, and the Group worked toward identifying a harmonized process for conducting dietary intake assessment. That is, the Group worked to identify methods and practices that can assist with harmonizing and improving the process for deriving the estimate. The intent is to describe a dietary intake assessment process that will provide the most accurate estimate of intake possible for the (sub)population of interest. Using such a process would result in comparisons to the UL that are as accurate and relevant as possible.
As a starting point in developing a proposal for the harmonization of methods, the Group considered the dietary intake assessments described in the reports of three national/regional bodies discussed in Section 2.2. A table showing the results of this effort appears in Annex 9. Examination of

5. Dietary intake assessment
51
those data shows wide variation in data types used for dietary intake assessment. It also shows wide variation in the methods of analysis and presentation of the findings. Distinctive aspects of the approaches used by each national/regional authoritative body follow. 5.1.3.1 European Food Safety Authority–Scientific Committee on Food The EFSA-SCF draws on the array of available consumption data: 2-day, 7-day, and 8-day dietary records; 24-hr dietary intake recalls; and household surveys. The reports state mean/median intake estimates and estimates of the 97.5th percentile of intake from the combined intakes from food and supplements, typically for males and females. For some nutrients, the EFSA-SCF also presents per-capita household-level estimates. 5.1.3.2 Expert Group on Vitamins and Minerals To derive estimates of intakes from food sources, the EVM draws primarily on data from weighed 4-day or 7-day records from a 1986–1987 national nutrition survey. To obtain estimates of nutrient intakes from supplements, the EVM uses manufacturers’ information on the nutrient content of supplements available in the United Kingdom (as labeled on the products) and information from an over-the-counter registry on supplement sales. The report presents population estimates of the mean and 97.5th percentile of nutrient intakes from food sources and identifies population subgroups with the potential to have high intakes. To provide further indication of risk, the EVM provides estimates of maximal intake using the sum of the estimated 97.5th percentile of nutrient intake from food sources for the population as a whole, the highest nutrient dose available per unit of supplements, and, where relevant, an amount from drinking water based on maximal concentration allowed in the water and an assumed quantity of water consumed per day. 5.1.3.3 Institute of Medicine The IOM relies on dietary intakes that are based on 24-hour recalls and quantitative assessments of water and supplement intakes from nationally representative U.S. surveys. It also uses data for Canada drawn from a few provincial surveys. The Canadian data include 24-hour recalls and assessments of supplement intake. The IOM used the data to estimate the distributions of habitual intake for different age, sex and lifestage (pregnancy or lactation) subpopulations, adjusted for day-to-day variation in intake. For nutrients (e.g. iodine) not captured in the surveys, the IOM derived intake estimates from a market basket survey and made no adjustment for day-to-day variation in individuals’ intakes. To present a judgement of the magnitude of the risk of adverse effects in the population, the IOM reports compare the estimated distributions of habitual nutrient intakes from food and supplements for specific age, sex, and lifestage subpopulations to the ULs for those subpopulations.
Based on review of the reports from the three national/regional bodies, as well as their own experience, the Group identified methodological needs including the following four special areas of concern:
1. identification of a unified statistical approach for estimating intakes, recognizing that more than one methodology is needed because not all regions have the same type of data available;
2. a process for combining data from two or more sources when necessary. Currently, informa-tion regarding the composition and consumption of supplements, certain fortified foods, functional foods, and non-drug dietary items usually is not available from the same source as standard information about ‘food’ composition and consumption;
3. methods of handling uncertainties in the intake estimates and the potential impact of the uncertainties on risk characterization; and
4. appropriate simulation or modeling approaches to use in situations in which data are limited or virtually non-existent.

A Model for Establishing Upper Levels of Intake for Nutrients and Related Substances
52
The Group developed a six-step approach to dietary intake assessment that can foster har-monization in the face of different types of data. The six steps are identified in Box 5-2 and described in detail in Sections 5.2 through 5.7.
Box 5-2. Six Steps of a Harmonized Approach to Dietary Intake Assessment
Step 1: specifying the type of dietary intake assessment Step 2: use of composition data Step 3: use of consumption data Step 4: methods for estimation of intake Step 5: uncertainties associated with assessments Step 6: reporting the dietary intake assessment
5.2 Step 1: specifying the type of dietary intake assessment Specification of the type of dietary intake (total or targeted) and the time frame of concern will drive the overall characteristics of the dietary intake assessment that is needed. In many—perhaps most—cases, nutrient risk assessment requires estimation of total intake of the nutrient substance from all sources over a long period of time. Important exceptions are covered below. As a general principle, dietary intake assessments should be conducted to produce intake estimations for the same age/sex/ lifestage subpopulations as specified for the ULs. 5.2.1 Specification of intake of interest 5.2.1.1 Total dietary intake Once ULs are established for a nutrient substance as a part of hazard characterization, risk assessment usually proceeds to consider how much of the substance is being ingested overall by the population. Dietary intake assessment therefore characteristically focuses on total intake of the substance from all sources. These sources may include foods (and beverages), fortified foods and functional foods, supplements, water, and other ingested non-drug products such as botanicals and plant extracts. The challenge arises in obtaining enough consumption and composition information on all the sources of the nutrient substance to be able to estimate total intake with a reasonable degree of accuracy. 5.2.1.2 Targeted dietary intake At times, the focus of the nutrient risk assessment may be exclusively a particular source of the nutrient substance, such as nutrient supplements or a limited number of fortified foods. Similarly, the interest may be only one chemical form of the nutrient substance, such as synthetic folic acid. In these situations, the assessment of dietary intake is appropriately limited to the estimation of intake from those specified sources or to intake of the particular form of the nutrient substance.
Nonetheless, certain considerations may call for a more comprehensive analysis of intake despite the interest in targeted dietary intake. These considerations include a need for information on the background intake of the nutrient substance from the overall diet or the presence in the diet of other nutrient substances and dietary components that interact with the nutrient substance in question and alter its bioavailability. 5.2.2 Specification of time frame of interest 5.2.2.1 Habitual intake The Group devoted considerable discussion early in the Workshop to the nature of the time frame for nutrient risk assessment. This topic was carried forward to discussions concerning dietary intake

5. Dietary intake assessment
53
assessment. Since nutrient risk assessment is generally conducted within the framework of a long-term or chronic intake, the Group’s discussions focused on the specification of such a time period.
As highlighted in Section 3.3.3, the concept of a ‘lifetime intake’ or ‘lifetime exposure’—a concept used in some other types of risk assessment—generally lacks relevance to nutrient risk assessment. Nutrient substances as a rule are subject to complicated homeostatic mechanisms that may control or alter absorption, utilization, storage, and/or transport of the substance. The nature of these mechanisms varies with age, sex, and lifestage. This variation precludes the possibility of a meaningful interpretation of a measure for total lifetime intake. Moreover, in light of different adverse health effects for different age/sex/lifestage subpopulations, dietary intake estimations presented on the basis of age/sex/lifestage are likely to be more informative for nutrient risk assessment.
Although the term ‘usual intake’ commonly appears in the nutrition literature and frequently is used to suggest long-term intake of perhaps a year or more, the Group selected the term ‘habitual intake’ to convey this meaning. The rationale for selecting the term ‘habitual intake’ was based on the awareness that long-term intake patterns for nutrient substances are characterized by considerable day-to-day and seasonal variation both among and within (sub)populations. The term ‘usual intake’ suggests to some people that such variation is an aberration rather than the norm. Thus, the use of ‘habitual intake’ was preferred: it better matches the reality of the diverse pattern of intake that exists, and it gives a sense of the larger dietary context. For the purposes of this report, ‘habitual intake’ is synonymous with ‘usual intake.’
Habitual intake is defined as the long-term average daily intake of the nutrient substance. Ideally, if daily intake of nutrient substances could be observed over a large number of days at differ-ent times of the year for each individual, the long-term intake would be estimated as the mean intake over those days for each individual. Many days of data are needed to accurately estimate intakes for individuals because day-to-day variation in nutrient substance intakes can be quite large. In practice, however, it is not feasible to collect so much information. Rather, intake estimations are made by collecting data for shorter periods of time from a representative sample of individuals and then generalizing from these data to the particular population. 5.2.2.2 Acute intake In some cases, an adverse health effect may occur as a result of short-term or acute intake of a nutrient substance. In such a case, data are not needed on the habitual or long-term average intake. Instead, the estimates of intake should be based on the amounts of the nutrient substance that are consumed during the length of time known to be associated with the development of the adverse health effect: perhaps one day or less, five to seven days, or some other period of time. The approach to estimating such intakes must be developed case by case. Clearly, the intake analysis and the overall risk assessment should be adjusted considerably in relation to the usual model in order to provide the information needed for the risk assessment of an acute effect of a nutrient substance.
5.3 Step 2: use of composition data 5.3.1 Sources of data The starting point for dietary intake assessment is obtaining information about the amount of the nutrient substance contained in specified amounts of the dietary items consumed by the population. The science of developing and compiling such composition data has been well described elsewhere (Greenfield and Southgate, 2003; Ireland et al., 2002; Leclercq et al., 2001; Rand et al., 1991; Schakel et al., 1997). However, the ability to acquire and maintain useful and up-to-date composition data-bases is a growing challenge because of the changing food supply and the increased use of supple-ments, fortified foods, and less common sources of nutrient substances. Some dietary sources of a nutrient substance are formulated products for which current manufacturing practices result in fre-quent changes in composition. If the addition of nutrient substances to food products is a discretionary practice under the responsibility of the manufacturer and is used to stimulate sales of a product line, formulation changes can be substantial as well as rapid. Manufacturers may frequently introduce new

A Model for Establishing Upper Levels of Intake for Nutrients and Related Substances
54
versions of the same dietary item with a different content of one or more nutrient substances. Thus, food composition databases can easily become out of date. Moreover, national or regional changes in fortification policies or regulations (e.g. the mandatory fortification of enriched grain products with folic acid in some countries) also affect the accuracy of available composition data.
Chemical analysis of dietary items can provide the most accurate food composition data. However, the accuracy of the composition values is only as good as the ability to analyze a sufficient number of samples to account for the relevant variability in the product. Since analytic methods are resource intensive, expensive, and time-consuming, the ability to analyze large numbers of samples often is limited. Obtaining composition values from the analysis of a small number of samples introduces some uncertainty, but less than that from data obtained indirectly. As described below, other strategies are employed to estimate composition when valid laboratory data are unavailable.
The composition of multi-ingredient dietary items can be obtained through calculations based on the known composition of the ingredients used to make such items. The recipe approach to estimate composition is used frequently. However, commonly-consumed mixed dishes can be pre-pared using different recipes. Even a reasonably comprehensive database cannot possibly include all versions of the dishes. For home-prepared items, detailed ingredient information for mixed dishes may be obtainable from the respondent, but the resource implications of this additional data collection often mean it is not done.
Composition data obtained directly from manufacturers or declared on the label may be valuable for filling in gaps, but the use of this type of data can introduce two notable sources of uncertainties:
1. Manufacturers must label in accordance with existing regulations for the country or region in which the product will be distributed, and different control authorities in different countries allow different margins of tolerance between labeled and analyzed values. In the United States, for example, manufacturers are in violation if their product declares more of a certain nutrient substance than is contained in the product. For this reason, U.S. manufacturers tend to label at the low end of the distribution of content. Any randomly-chosen product, such as a box of cereal, likely will contain a higher content than that listed on the label (Rader et al., 2000). In the United Kingdom, on the other hand, manufacturers list the expected (or average) content of the nutrient in the product.
2. In anticipation of the decay of some nutrients over time, manufacturers may add overages—amounts that exceed the labeled amount—of those nutrients to food products (EVM, 2003). Thus, the content of a specific nutrient substance may depend partly on the date of con-sumption relative to the date of manufacture.
Although information about the nutrient substance composition of dietary items around the
world is increasing, numerous instances occur in which little or no information is available about specific dietary items. In principle, it is reasonable to share food composition data or databases among nations or regions; in many cases this is the only approach available and must be used. However, mismatches can arise due to differences in the dietary items between the regions. Moreover, different growing conditions (such as soil and weather characteristics) may introduce variability in compo-sition.
Differences in fortification policies and practices among the regions introduce another vari-able. The absence of accurate data for the local food can seriously distort exposure estimates, especially when a region relies heavily on local food for its diet. Characteristics of desirable compo-sition data can be identified and represent a goal to work towards. Box 5-3 contains a listing of these characteristics.

5. Dietary intake assessment
55
Box 5-3. Characteristics of Desirable Composition Data
In principle, composition data should be:
• complete, comprehensive, and detailed (i.e. data include all dietary items consumed and reflect a wide range of nutrient substances, provide information on variations of the same dietary items, include brand-names, contain specification of nutrient substances by chemical form and physiochemical nature, and specify the date of the analysis or update);
• accurate (i.e. composition corresponds to actual average nutrient substance content);
• current (i.e. contains recent changes in formulations and reflects fortification practices); • in accordance with standard international nomenclature;
• well documented, including applicable dates; and • available in electronic form.
Data available today often do not reach these goals, but the characteristics listed in the box
serve to remind risk assessors of the need to take into account existing limitations in data and the uncertainties those data limitations introduce into nutrient risk assessment. The characteristics reflect the interest in providing accurate and relevant data and in making available flexible data sets that are well documented. If composition data can be provided in a manner that allows the data to be easily adjusted, modified, or rearranged in ways that are relevant to the nutrient risk assessment at hand, their utility is greatly enhanced. 5.3.2 Modifying and adjusting composition data It often is useful to modify existing composition data sets to make them more current or to add information needed to complete the assessment at hand (e.g. Holden et al., 1999). The tailoring of a set of data to enhance its usefulness is an often-ignored approach to obtaining more accurate estimates of dietary intake. Appropriate strategies relate to adding missing information, updating, and making certain adjustments (e.g. to account for the bioavailability of the substance). Specific consideration should be given as to the amount and type of detail provided by the composition database for the nutrient substance(s) of interest. If insufficient, additional data should be obtained to augment avail-able data as needed or to create new databases for the assessment. Modifying and adjusting compo-sition data can be accomplished as described below. 5.3.2.1 Adding missing data If composition data are incomplete or do not exist for the region of interest, it is best to begin with the existing data set that most faithfully corresponds to local characteristics. One works to insert the composition information for each missing dietary item into the most relevant existing data sets. Obtaining the information may require some special initiatives. In all cases the additions must be completely documented, including the rationale used and assumptions made. While the missing infor-mation ideally is obtained by direct laboratory analysis of the dietary items, information more commonly is obtained by:
• gathering data from other sources; • contacting manufacturers or reading labels; • substituting data on the nutrient content of similar foods; • estimating content from data on the ingredients used to prepare the food (recipe calculations).
An example from the literature that outlines a modification to an existing database for Malaysia can be found in Siong et al. (1997). A description of a database developed primarily using nutritional data calculated from recipes is provided by Dehne et al. (1999).

A Model for Establishing Upper Levels of Intake for Nutrients and Related Substances
56
5.3.2.2 Updating information As needed, a data set can be updated on an item-by-item basis to facilitate accurate estimates of intake. This is a particularly useful method following a major change in the food supply, such as that resulting from a change in required fortification. Updating a database to respond to a change in the fortification of commonly used ingredients requires de-aggregating items that contain the fortified ingredient, calculating the changed content of the nutrient substance for each of the fortified ingredients, and then re-aggregating items and calculating the updated composition. Examples of such an approach can be found in the IOM report Dietary Reference Intakes: Applications in Dietary Planning (IOM, 2003). The publication by Lewis et al. (1999) also demonstrates the updating of folate composition information for the United States. The updating occurred when the mandatory folate fortification of enriched cereal-grains was expected to increase the contribution that foods containing these ingredients made to the total intake of folate. 5.3.2.3 Adjusting for bioavailability In some cases, it may be possible to make adjustments for bioavailability in order to obtain a better estimate of the amount of the nutrient likely to be absorbed. The needed information would include (i) the correction factor for the nutrient substance or a specific form of the substance, (ii) as appropriate, the proportion of the total nutrient substance per dietary item that represents the form of interest, and (iii) if relevant, the amount of potentially competing substances (e.g. information on phytates when the interest is intake of a mineral such as copper or zinc). This type of data set modification has been carried out to correct folate intakes for the apparently higher bioavailability of synthetic folic acid present in fortified foods and supplements, as compared to naturally-occurring folate (Lewis et al., 1999).
5.4 Step 3: use of consumption data Data to identify and quantify the amounts of the dietary items consumed (when combined with infor-mation about composition) are an important cornerstone of dietary intake assessment. For the pur-poses of this report, consumption data are grouped depending upon whether they are based on (i) consumption reported by or for individuals or (ii) other types of data including aggregated availability data or marketing/sales information. It is preferable to estimate intakes using information collected from individuals, assuming data exist and are representative of the population of interest. Clearly, other data must be used when individual intake data are not available, but they have limitations and introduce additional uncertainties into the estimations. Box 5-4 lists characteristics of desirable consumption data—a listing that represents a goal rather than a reality.
Box 5-4. Characteristics of Desirable Consumption Data
In principle, consumption data should provide:
• unbiased estimates of daily consumption by individuals based on a sample size and study design that allow generalization;
• sufficiently comprehensive consumption reports so as to include all dietary items of interest;
• data for age/sex/lifestage subpopulations of interest;
• current estimates of consumption; • full documentation; and
• data in electronic format and based on accepted terminology and units of measurement.
Representative consumption data with the characteristics listed in Box 5-4 are not widely
available around the world. While other types of data certainly can be used in many nutrient risk assessments, the limitations of such data must be understood and their impact on the uncertainties associated with assessments acknowledged. In all cases, regardless of the quality of the data, it is

5. Dietary intake assessment
57
highly desirable to develop data sets that provide sufficient documentation and to format data in a way that allows the data to be adjusted and rearranged to suit the nutrient risk assessor’s needs or to allow the assessor to carry out post-analysis ‘what-if’ scenarios. 5.4.1 Data on individuals Data on daily food consumption by individuals are collected routinely in nationwide surveys in some countries and can provide reasonably accurate, up-to-date information for a large sample. Instruments for collecting consumption data at the individual level are 24-hour recalls obtained in face-to-face or telephone interviews, multiple-day records of weighed food consumption, multiple-day food diaries, and food frequency questionnaires. Available publications (Biro et al., 2002; Ferro-Luzzi, 2003; Gibson, 2005; van Staveren and Ocke, 2001) can provide useful reviews of dietary assessment methods. Additional information also is included in Discussion Paper 3, “Estimating the Distribution of Usual Nutrient Exposures in Populations” (see Annex 4). Table 5-1 lists the strengths and limita-tions of these methods for collecting consumption data.
Individual recalls and records are best suited for estimating habitual intake distributions, but they can tend toward underestimation of energy and protein intake. Furthermore, depending upon the number of days of records for each individual and the sample size, they may miss information on intermittent consumption—for example, the consumption of a supplement or highly fortified food only once every week or two. Food frequency data, on the other hand, may either overestimate or underestimate consumption. The estimate depends upon the foods in the food list and the assumptions for questionnaire items that represent more than one dietary item (e.g. citrus fruit). However, food frequency questionnaires may capture intermittent use of dietary items of interest. 5.4.2 Aggregated availability data and marketing/sales data Aggregated consumption data can be categorized as (i) household-level data, (ii) national- or regional-level data, (iii) regional diets, and (iv) marketing and sales information. 5.4.2.1 Aggregated data at the household level Household-level data may include household purchasing or budget surveys, food inventories, or food disappearance. This type of information does not differentiate food consumption by different house-hold members, and it may not reflect waste or foods obtained away from home. In the absence of information on individual consumption, data about dietary items available to the household combined with information on the household demographics can be adjusted and modeled to provide estimates of the consumption of foodstuffs and, in turn, of the individuals’ intake of nutrient substances. 5.4.2.2 Aggregated data at the national or regional level Data have been developed to reflect the overall pattern of availability (or disappearance) of foodstuffs at national or regional levels. A notable example is the FAO Food Balance Sheets (FAOSTAT, 2005). A Food Balance Sheet provides a comprehensive picture of the pattern of a country’s food supply during a specified period of time. For each primary commodity and for a number of processed com-modities potentially available for human consumption, the Food Balance Sheet shows the sources of supply and their use. The Balance Sheet addresses production within the country, quantities imported and exported, changes in stocks, amounts used for agricultural and other purposes, losses during stor-age and transportation, and food supplies available for human consumption. Related data on the popu-lation consuming the food are used to estimate per-capita food supplies. Then appropriate food com-position factors can be applied to estimate the energy and nutrient substance content provided by those dietary items.

A Model for Establishing Upper Levels of Intake for Nutrients and Related Substances
58
Table 5-1. Strengths and Limitations of Different Types of Consumption Data
Type of data Strengths Limitations Individual-level consumption (24-hour recalls or multiple-day records)
Capture individual daily consumption
Best suited for estimating habitual intake distributions (Lee and Nieman, 2003; Subar et al., 2003)
Subject to measurement error: In some but not all countries, underreporting of energy and protein intake estimates obtained from 24-hour recalls has been demonstrated for adults (Goris and Westerterp, 1999; Goris et al., 2000; Harrison et al., 2000; Johansson et al., 1998; Subar et al., 2003) and overreporting has been demonstrated for children younger than 2 years (Devaney et al., 2004); in the case of multiple-day records, modification of food consumption patterns by subjects has been documented (Gibson, 2005)
Costly and time-consuming Individual food frequency questionnaires (Bingham, 1987; Dwyer, 1994; Medlin and Skinner, 1988; Subar et al., 2003)
Relatively easy to design and administer
May be well suited to collect consumption information about a few foods or supplements
May capture consumption of foods and/or supplements consumed on an irregular basis
Tend to be inaccurate. Not well suited to collect total dietary consumption because, by construction, questionnaires can include a limited number of foods
Must be redesigned and validated for each country/region and particular uses
Can be used for quantitative intake estimation, but results, especially at the lower and upper tails of the habitual intake distribution, may be unreliable
Household surveys Available in many countries Level of aggregation less than that of national data
Permit estimation of individual nutrient intake
Capture food purchased at the household level, not consumed
Do not capture food consumed away from home—potentially a significant source of nutrients, especially for school-aged children and persons who work outside the home
May lack information on the consumption of fortified foods, water, or supplements
Provide no direct information on individual consumption; individual consumption can be estimated from household-level data under some assumptions, but disaggregation might produce acceptable individual-level intake estimates for macronutrients but not micronutrients
National food balance sheets
Available for most countries Uniform design: their construction is well documented
Overestimate per-capita intake Unlikely to provide (directly) a per-capita consumption for different sex/age/ethnic groups
Require many assumptions Global Environment Monitoring System / food regional diets
Same as national food balance sheets above
May be more appropriate when regional-level intake assessment is sought or when a country does not have a food balance sheet
Same as national food balance sheets above By construction, regional diets are common to all countries within the same region but do not allow for country-specific differences in diet
5.4.2.3 Regional representative diets ‘Typical’ or representative diets have been created for certain regions using information about dietary patterns and food availability. These representative diets can be helpful in making estimates about nutrient substance intake when more specific consumption data are not available, or they can be used

5. Dietary intake assessment
59
as a check on other data. Regional diets have been developed as part of the Global Environment Monitoring System (GEMS/Food, 2005). GEMS/Food has created five regional diets—African, European, Far Eastern, Latin American, and Middle Eastern—and more regional diets are under development. The European Regional Diet represents Europe, Australia, Canada, New Zealand and the United States of America. Each regional diet is composed of raw and semi-processed food commodities—a total of about 250 individual food items. The diets are based on selected FAO Food Balance Sheets and represent average per-capita food consumption. These regional diets have been used at the international level by organizations such as the Joint Expert Committee on Food Additives and the Joint Meeting on Pesticide Residues, primarily to assess the long-term dietary intake of contaminants and other agents in food. 5.4.2.4 Marketing and sales data In some regions, it may be possible to obtain information on the sales and/or production data of certain dietary items—ranging from supplements to fortified foods and functional foods. Such infor-mation can be useful in filling data gaps and may provide rough estimates of the availability of nutrient substances. Because these data are highly aggregated, however, they require the use of many assumptions in order to make them relevant to estimating dietary intake. In some instances, manu-facturers may voluntarily provide sales data and may even offer details on consumption possibilities based on their marketing studies and knowledge about sales patterns.
As indicated by the listing of the strengths and limitations of these methods in Table 5-1, aggregated availability data and marketing data likely result in overestimation of intake. At best they reflect only a population mean and are unlikely to provide meaningful data for vulnerable subgroups. 5.4.3 Combining consumption data to estimate intake from all sources The nature of available consumption databases frequently results in the need to combine different types of consumption data or data obtained from different surveys using different samples to create a complete picture of intake. This process may involve using a database reflective of the consumption of foods and fortified foods and adding to it information from a separate data set on dietary supple-ment intake. Lewis and colleagues (1999) report an example of the process.
When supplement intake data are not available, it is difficult to estimate the distribution of habitual total nutrient substance intake in a group. In many parts of the world, the use of supplements is increasing and high levels of total intake—perhaps exceeding the UL for a nutrient—may occur when supplements are included in diets that also contain a range of foods and fortified foods. To account for supplement intake when data are lacking, observed intakes from food sources sometimes are augmented by adding, either to individual consumptions or to selected percentiles of the estimated habitual nutrient intake distribution, an amount meant to represent the consumption of supplements by individuals in the group. 5.4.3.1 Analysis to examine selected methods of combining data on food and supplement consumption The effect of various choices of estimated supplement consumption on the distribution of total nutrient intake is demonstrated by an analysis based on consumption data from the third US National Health and Nutrition Examination Survey (NHANES III) (NCHS, 2005). In this survey, food intake was measured using 24-hour diet recall interviews, and supplement intake was measured using a frequency-type questionnaire. Information about product formulation for all supplements available in the US market also is included in the survey. For example, for vitamins B12 and C and for zinc, the maximum available doses are 2,000 μg, 4,000 mg and 100 mg, respectively. Method based on combining individual data on nutrient intake from food and from supple-ments. A subgroup of Workshop participants estimated the habitual intake distributions of zinc, vitamin B12, and vitamin C for women aged 19 to 30 years using NHANES III information. The subgroup also estimated the distribution of total nutrient intake for the same group of women as

A Model for Establishing Upper Levels of Intake for Nutrients and Related Substances
60
described in Carriquiry (2003). To do so, the subgroup added the self-reported habitual supplement intake to the estimated habitual nutrient intake from food sources for each woman in the group. Method based on combining individual data on nutrient intakes and aggregated data regarding supplement intake. The effect of estimating total nutrient intake if no information on actual supplement intake is available at the individual level was assessed as follows:
• For each of the three nutrients, the subgroup first estimated the distribution of available doses in commercially available products. For example, for vitamin C, the median available dose is 90 mg, the 75th percentile of the dose distribution is 300 mg, and only 5% of all supplements containing vitamin C provide more than 1,000 mg of the nutrient.
• The subgroup then shifted the estimated habitual nutrient intake distribution (based on food consumption only) by various amounts corresponding to selected percentiles of the dose distribution.
The subgroup compared the results of method 1 (actual total nutrient intake distribution) to the results of method 2 (distributions that result from assuming certain levels of supplement consump-tion). The results from this limited simulation study (see Tables 5-2 through 5-4 below) provide some insight on the effect of estimating nutrient substance intake when no supplement consumption information is available. Various percentiles of the estimated total nutrient intake distribution are shown in the columns of the table; each row represents a different estimate of the intake distribution. The habitual intake distribution obtained using only observed nutrient consumption from food is given in the first row for each nutrient.
In most cases, shifting the habitual nutrient intake distribution by some fixed amount assumed to represent supplement consumption in the subpopulation results in an overestimation of the actual total US nutrient substance intake for this age and sex group. The overestimation occurs because shifting the nutrient intake distribution is equivalent to assuming that everyone in the subpopulation consumes an amount of the nutrient from supplements that is equal to the amount used to shift the distribution. Analyses of dietary intake surveys suggest that not everyone in a subpopulation con-sumes supplements. For example, in the case of NHANES III, only about 30% of the women who responded to the survey reported consuming supplements at all (Arab et al., 2003).
Another limitation occurs because supplement consumers also tend to be individuals with relatively high nutrient intake from food sources. As a consequence, the habitual nutrient intake distribution based on total nutrient consumption tends to have a left tail (extreme end) and median that are similar to those of the habitual nutrient intake distribution that is based only on food consumption. Changes are observed only on the right tail of the distribution. This effect is not taken into account when the entire distribution of nutrient intake based on food consumption is shifted to the right by a fixed amount intended to mimic additional nutrient consumption from supplements.
5.4.3.2 Acceptable approaches to combining consumption data For women aged 19 to 30 years in the United States, it appears that a reasonable approach for obtaining total intake from food and supplements would be to add the median (50th percentile) supplement dose to each individual intake from food sources. Further simulations would be needed to determine whether this approach would be reasonable in other countries and for other subpopulations. Regardless, it is clear that using the maximum supplement dose or even the 95th percentile of supple-ment doses substantially overestimates intakes. To improve the accuracy of inferences based on the combined data, it also would be useful to collect information on the proportion of persons who con-sume supplements in the subpopulation and on the individual characteristics that are likely to be associated with supplement consumption. In the meantime, Box 5-5 presents acceptable approaches to combining consumption data to estimate intake.
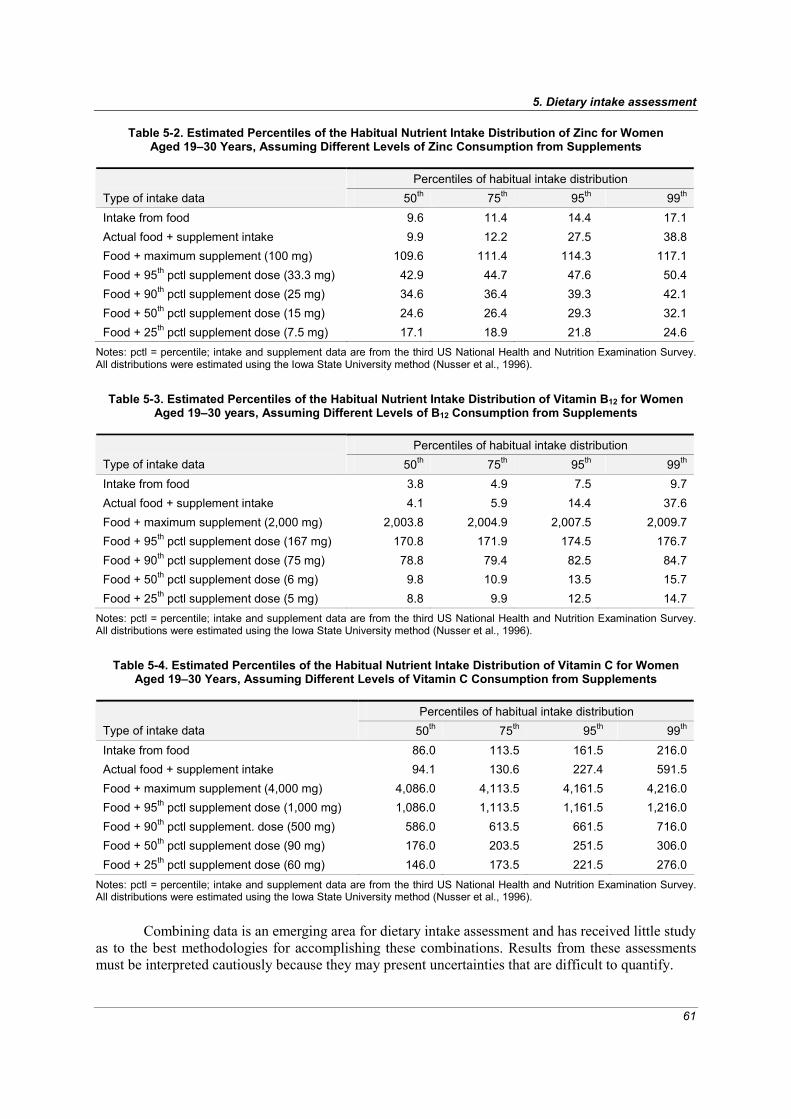
5. Dietary intake assessment
61
Table 5-2. Estimated Percentiles of the Habitual Nutrient Intake Distribution of Zinc for Women Aged 19–30 Years, Assuming Different Levels of Zinc Consumption from Supplements
Percentiles of habitual intake distribution
Type of intake data 50th 75th 95th 99th Intake from food 9.6 11.4 14.4 17.1 Actual food + supplement intake 9.9 12.2 27.5 38.8 Food + maximum supplement (100 mg) 109.6 111.4 114.3 117.1 Food + 95th pctl supplement dose (33.3 mg) 42.9 44.7 47.6 50.4 Food + 90th pctl supplement dose (25 mg) 34.6 36.4 39.3 42.1 Food + 50th pctl supplement dose (15 mg) 24.6 26.4 29.3 32.1 Food + 25th pctl supplement dose (7.5 mg) 17.1 18.9 21.8 24.6
Notes: pctl = percentile; intake and supplement data are from the third US National Health and Nutrition Examination Survey. All distributions were estimated using the Iowa State University method (Nusser et al., 1996).
Table 5-3. Estimated Percentiles of the Habitual Nutrient Intake Distribution of Vitamin B12 for Women Aged 19–30 years, Assuming Different Levels of B12 Consumption from Supplements
Percentiles of habitual intake distribution
Type of intake data 50th 75th 95th 99th Intake from food 3.8 4.9 7.5 9.7 Actual food + supplement intake 4.1 5.9 14.4 37.6 Food + maximum supplement (2,000 mg) 2,003.8 2,004.9 2,007.5 2,009.7 Food + 95th pctl supplement dose (167 mg) 170.8 171.9 174.5 176.7 Food + 90th pctl supplement dose (75 mg) 78.8 79.4 82.5 84.7 Food + 50th pctl supplement dose (6 mg) 9.8 10.9 13.5 15.7 Food + 25th pctl supplement dose (5 mg) 8.8 9.9 12.5 14.7
Notes: pctl = percentile; intake and supplement data are from the third US National Health and Nutrition Examination Survey. All distributions were estimated using the Iowa State University method (Nusser et al., 1996).
Table 5-4. Estimated Percentiles of the Habitual Nutrient Intake Distribution of Vitamin C for Women Aged 19–30 Years, Assuming Different Levels of Vitamin C Consumption from Supplements
Percentiles of habitual intake distribution
Type of intake data 50th 75th 95th 99th Intake from food 86.0 113.5 161.5 216.0 Actual food + supplement intake 94.1 130.6 227.4 591.5 Food + maximum supplement (4,000 mg) 4,086.0 4,113.5 4,161.5 4,216.0 Food + 95th pctl supplement dose (1,000 mg) 1,086.0 1,113.5 1,161.5 1,216.0 Food + 90th pctl supplement. dose (500 mg) 586.0 613.5 661.5 716.0 Food + 50th pctl supplement dose (90 mg) 176.0 203.5 251.5 306.0 Food + 25th pctl supplement dose (60 mg) 146.0 173.5 221.5 276.0
Notes: pctl = percentile; intake and supplement data are from the third US National Health and Nutrition Examination Survey. All distributions were estimated using the Iowa State University method (Nusser et al., 1996).
Combining data is an emerging area for dietary intake assessment and has received little study
as to the best methodologies for accomplishing these combinations. Results from these assessments must be interpreted cautiously because they may present uncertainties that are difficult to quantify.
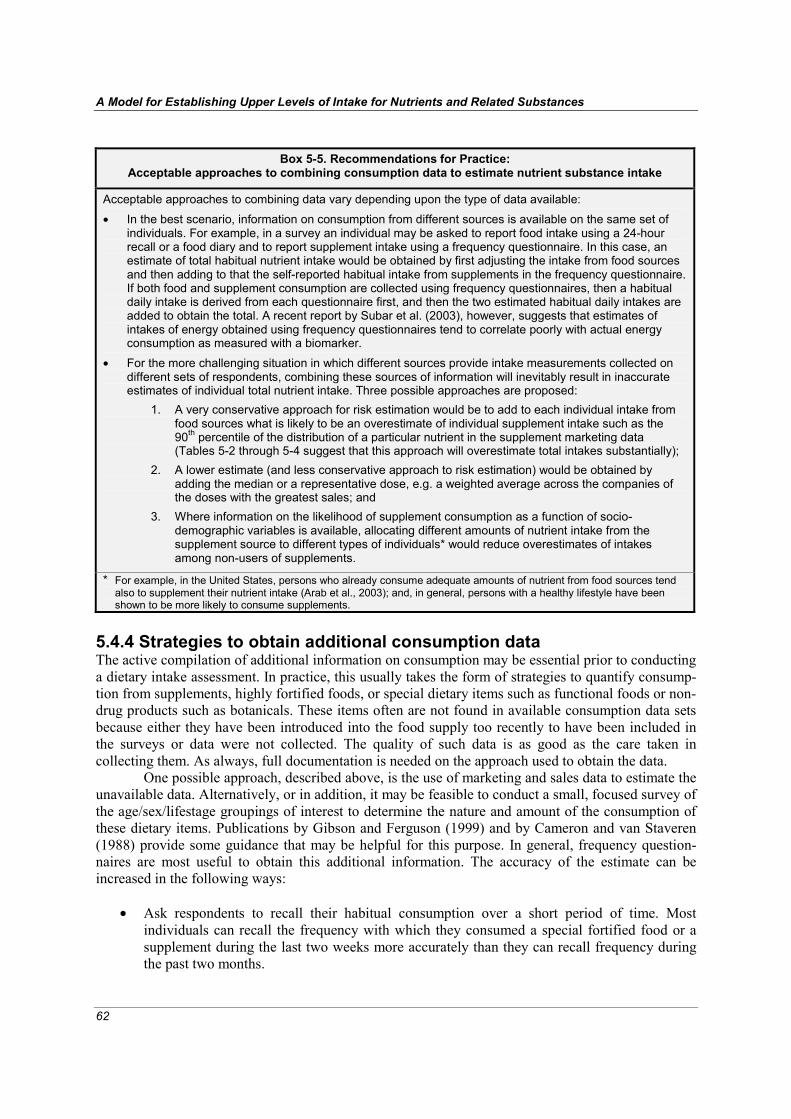
A Model for Establishing Upper Levels of Intake for Nutrients and Related Substances
62
Box 5-5. Recommendations for Practice:
Acceptable approaches to combining consumption data to estimate nutrient substance intake
Acceptable approaches to combining data vary depending upon the type of data available:
• In the best scenario, information on consumption from different sources is available on the same set of individuals. For example, in a survey an individual may be asked to report food intake using a 24-hour recall or a food diary and to report supplement intake using a frequency questionnaire. In this case, an estimate of total habitual nutrient intake would be obtained by first adjusting the intake from food sources and then adding to that the self-reported habitual intake from supplements in the frequency questionnaire. If both food and supplement consumption are collected using frequency questionnaires, then a habitual daily intake is derived from each questionnaire first, and then the two estimated habitual daily intakes are added to obtain the total. A recent report by Subar et al. (2003), however, suggests that estimates of intakes of energy obtained using frequency questionnaires tend to correlate poorly with actual energy consumption as measured with a biomarker.
• For the more challenging situation in which different sources provide intake measurements collected on different sets of respondents, combining these sources of information will inevitably result in inaccurate estimates of individual total nutrient intake. Three possible approaches are proposed:
1. A very conservative approach for risk estimation would be to add to each individual intake from food sources what is likely to be an overestimate of individual supplement intake such as the 90th percentile of the distribution of a particular nutrient in the supplement marketing data (Tables 5-2 through 5-4 suggest that this approach will overestimate total intakes substantially);
2. A lower estimate (and less conservative approach to risk estimation) would be obtained by adding the median or a representative dose, e.g. a weighted average across the companies of the doses with the greatest sales; and
3. Where information on the likelihood of supplement consumption as a function of socio-demographic variables is available, allocating different amounts of nutrient intake from the supplement source to different types of individuals* would reduce overestimates of intakes among non-users of supplements.
* For example, in the United States, persons who already consume adequate amounts of nutrient from food sources tend also to supplement their nutrient intake (Arab et al., 2003); and, in general, persons with a healthy lifestyle have been shown to be more likely to consume supplements.
5.4.4 Strategies to obtain additional consumption data The active compilation of additional information on consumption may be essential prior to conducting a dietary intake assessment. In practice, this usually takes the form of strategies to quantify consump-tion from supplements, highly fortified foods, or special dietary items such as functional foods or non-drug products such as botanicals. These items often are not found in available consumption data sets because either they have been introduced into the food supply too recently to have been included in the surveys or data were not collected. The quality of such data is as good as the care taken in collecting them. As always, full documentation is needed on the approach used to obtain the data.
One possible approach, described above, is the use of marketing and sales data to estimate the unavailable data. Alternatively, or in addition, it may be feasible to conduct a small, focused survey of the age/sex/lifestage groupings of interest to determine the nature and amount of the consumption of these dietary items. Publications by Gibson and Ferguson (1999) and by Cameron and van Staveren (1988) provide some guidance that may be helpful for this purpose. In general, frequency question-naires are most useful to obtain this additional information. The accuracy of the estimate can be increased in the following ways:
• Ask respondents to recall their habitual consumption over a short period of time. Most
individuals can recall the frequency with which they consumed a special fortified food or a supplement during the last two weeks more accurately than they can recall frequency during the past two months.

5. Dietary intake assessment
63
• Ensure that the information requested covers a sufficient period of time to identify any pos-sible seasonal effects on intake (this may call for several interviews during a one-year period). If feasible, a preliminary survey may be useful to ascertain the possibility of seasonal varia-tion in intake of the items of interest. Because items such as supplements and fortified foods may be consumed consistently throughout the year, they might not require seasonal inter-views.
• Ask about a minimum number of items, focusing on the fortified foods and/or supplements that are of interest. Respondents tend to remember the frequency of consumption of a short list of specific items more accurately than that of a longer list. Further, a focused and shorter list of items allows for the collection of more detailed information on specific nutrient intakes.
These additional data can be combined with other consumption data (see Section 5.4.3
above). Alternatively, if they are intended for a targeted intake assessment, they can be used to create an intake distribution—with the caveat that they would underestimate total intake because other dietary sources have not been taken into consideration. Even though frequency questionnaires have been shown to be imprecise instruments when attempting to capture total nutrient substance intake, the estimates derived from these instruments for specific nutrient substances are expected to be more reliable than those derived from national or regional food availability data.
5.5 Step 4: methods for estimation of intake Table 5-5 summarizes qualities of different types of dietary consumption data, approaches to estimating intakes that are discussed in this subsection, and the reliability of the estimates. 5.5.1 Intake estimation using data on individuals Individual-level consumption data combined with high-quality composition data and the application of appropriate statistical methods provide the best starting point for the reliable estimate of a habitual intake distribution for the (sub)population of interest. Estimations that rely on data from 24-hour recalls or food records are among the most reliable. Food frequency data are generally less appropriate unless that assessment is a targeted intake. Although habitual intake distributions can in principle be estimated from aggregated household data, the uncertainty around these estimates is considerable. The goal is to estimate the proportion of individuals with intakes above (or below) the UL and compute standard errors for those estimates taking into account the survey design.
Even in the best designed studies or surveys, it is impossible to completely avoid the effects on intake measurement of factors such as the day of the week, interview method, interview sequence, or season. Thus, it is recommended that observed intake data be statistically adjusted to remove the potential confounding effect of these factors. Many approaches can be used for this purpose. For example, Nusser et al. (1996) offer a simple ratio adjustment based on a regression model for factors such as day of week and survey method. A similar approach can be used to adjust for the effect of factors other than those considered in their work.
An important statistical adjustment to address is the need to lessen day-to-day variability of intake within individuals. Discussions found in Hoffman et al. (2002) and information highlighted in Discussion Paper 3 (Annex 4) provide useful guidance. Discussion Paper 3 also includes a table to illustrate the importance of removing the day-to-day variance in daily intakes within individuals. Removing day-to-day variance in intake is highly germane to nutrient risk assessment because such adjustment has a large impact on the estimated upper percentiles of the intake distribution. Moreover, removing day-to-day variance is highly relevant to assessing intakes for nutrient substances that are consumed in very different amounts from day to day.
In brief, adjusting distributions for day-to-day variance in intake can be addressed by at least two methods, given data obtained from 24-hour recalls or multiple-day records. These methods are the approach proposed by the National Research Council (NRC, 1986) and the approach known as the
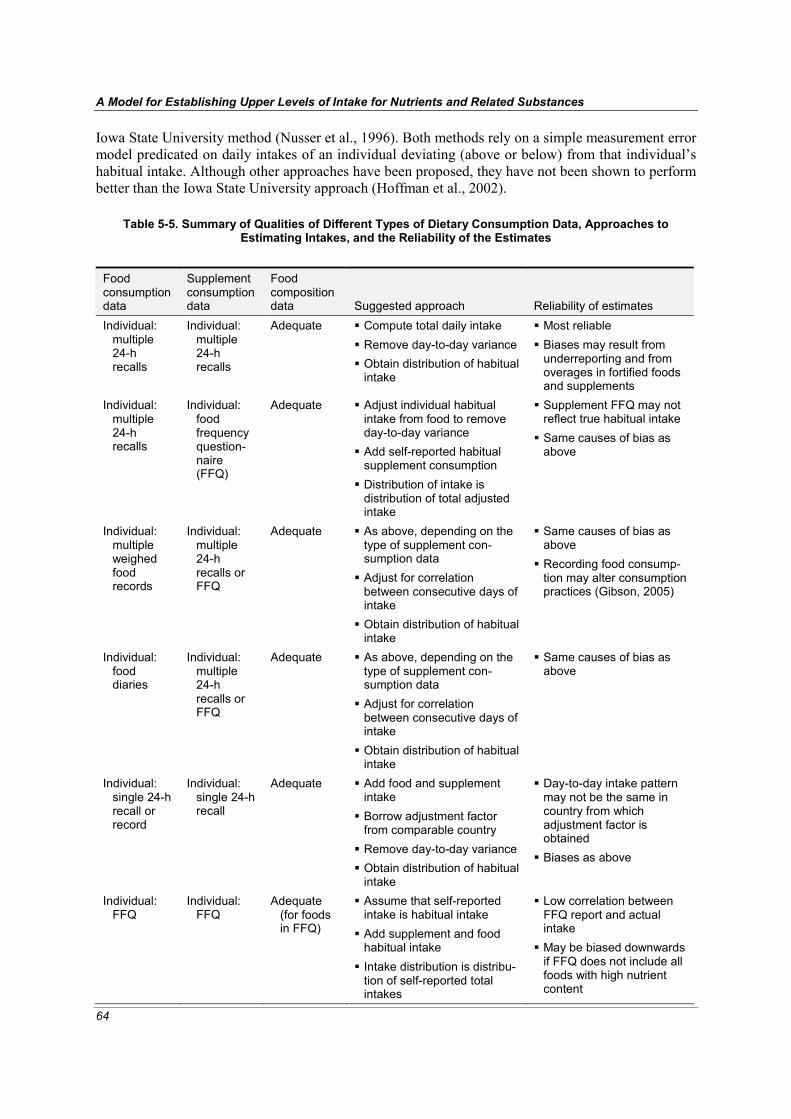
A Model for Establishing Upper Levels of Intake for Nutrients and Related Substances
64
Iowa State University method (Nusser et al., 1996). Both methods rely on a simple measurement error model predicated on daily intakes of an individual deviating (above or below) from that individual’s habitual intake. Although other approaches have been proposed, they have not been shown to perform better than the Iowa State University approach (Hoffman et al., 2002).
Table 5-5. Summary of Qualities of Different Types of Dietary Consumption Data, Approaches to Estimating Intakes, and the Reliability of the Estimates
Food consumption data
Supplement consumption data
Food composition data Suggested approach Reliability of estimates
Individual: multiple 24-h recalls
Individual: multiple 24-h recalls
Adequate Compute total daily intake Remove day-to-day variance Obtain distribution of habitual intake
Most reliable Biases may result from underreporting and from overages in fortified foods and supplements
Individual: multiple 24-h recalls
Individual: food frequency question-naire (FFQ)
Adequate Adjust individual habitual intake from food to remove day-to-day variance
Add self-reported habitual supplement consumption
Distribution of intake is distribution of total adjusted intake
Supplement FFQ may not reflect true habitual intake
Same causes of bias as above
Individual: multiple weighed food records
Individual: multiple 24-h recalls or FFQ
Adequate As above, depending on the type of supplement con-sumption data
Adjust for correlation between consecutive days of intake
Obtain distribution of habitual intake
Same causes of bias as above
Recording food consump-tion may alter consumption practices (Gibson, 2005)
Individual: food diaries
Individual: multiple 24-h recalls or FFQ
Adequate As above, depending on the type of supplement con-sumption data
Adjust for correlation between consecutive days of intake
Obtain distribution of habitual intake
Same causes of bias as above
Individual: single 24-h recall or record
Individual: single 24-h recall
Adequate Add food and supplement intake
Borrow adjustment factor from comparable country
Remove day-to-day variance Obtain distribution of habitual intake
Day-to-day intake pattern may not be the same in country from which adjustment factor is obtained
Biases as above
Individual: FFQ
Individual: FFQ
Adequate (for foods in FFQ)
Assume that self-reported intake is habitual intake
Add supplement and food habitual intake
Intake distribution is distribu-tion of self-reported total intakes
Low correlation between FFQ report and actual intake
May be biased downwards if FFQ does not include all foods with high nutrient content

5. Dietary intake assessment
65
Table 5-5. Continued Food consumption data
Supplement consumption data
Food composition data Suggested approach Reliability of estimates
Household: disappear-ance data or food accounts
Household: purchasing data
Adequate Adjust household disappear-ance data for spoilage and waste
Disaggregate household-level data using information on household composition, relative energy requirements
Use supplement information to allocate intake to house-hold members
Compute an approximate total daily intake per individ-ual
Actual food and supple-ment intake may not correspond to needs by body weight and sex
Biases at individual level may depend on socio-economic status of house-hold
Household: disappear-ance data
None Adequate Disaggregate food intake data as above
Infer a per-capita supplement consumption from sales and label information
Compute approximate total daily intake per individual
If intake from supplement is main determinant of upper tail of intake distribution, serious biases may occur due to lack of individual consumption data
Other biases as above may occur
National: mean consump-tion of commod-ities per capita
None Composition of commod-ities avail-able
Estimate upper-tail quantities such as 95th and 99th percen-tiles as the corresponding percentiles in other countries shifted by the difference between the two countries’ mean intakes
Inaccuracies and biases as above
In addition, strong assumption about similar intake patterns in two countries
Small difference may result in significant biases at the upper tail
National: food balance sheet
None Composition of commod-ities avail-able
Disaggregate national data into individual data using information on demographics and food requirements by age, sex, and lifestage
Proceed as above
Same as above
If not properly adjusted to remove within-individual variance, distributions of total daily
intake distributions will have tails for the distribution that are too long. Estimates of upper-tail (and lower-tail) percentiles will be biased. Adjusting the data increases the precision of the estimates of intake levels at the tails of the distribution. When daily intakes are collected over consecutive days (as is the case with multiple-day food records), the estimation of the habitual intake distribution must take into account the correlation among nutrient intakes over consecutive days.
5.5.2 Intake estimation using other types of data 5.5.2.1 Household data Information on food availability at the household level may be available when consumption reports for individuals within the household are not. There are several approaches for collecting household-level food consumption or food availability data, including food accounts, list-recalls inventories (or disappearance), and household food records data. While the level of detail of the data that are

A Model for Establishing Upper Levels of Intake for Nutrients and Related Substances
66
collected and the respondent burden vary across the methods, the general aim is to estimate the per-capita food consumption of household members during the survey period.
The food accounts and the inventory methods account first for all food that is in the house at the beginning of the recording period. The methods then add to that accounting all food purchased and otherwise obtained for the household—as through gardens, hunting and gifts—during the survey period. The food remaining in the house at the end of the period is subtracted. Often, food eaten away from home, given to pets, or thrown away is not accounted for (Gibson, 2005; Lee and Nieman, 2003). Box 5-6 provides a method for disaggregating household-level data into individual-level data.
Box 5-6. Recommendations for Practice: Disaggregating household-level data into individual-level data
The following steps may be taken to disaggregate household-level data into individual-level intake data (see also Table 5-5): • Household member: records the eating occasions and the number of meal participants (including visitors)
at each occasion during the survey period.
• Risk assessor: - calculates the consumption per person and per meal of each item during the survey period by
dividing the total amount of the food consumed during the survey period by the number of person-meals (the number of persons at each eating occasion summed over the eating occasions);
- calculates the average intake of the nutrient substance at each meal using food composition data and the food consumption data from the step above—that is, calculating the total amount of the nutrient consumed during the survey period divided by the number of person-meals;
- calculates the daily intake for each person as the sum (over the meals in which they participated) of the average intake of the nutrient substance at each meal by each person;
- if information on age, sex, and weight of each household member is available, prorates the overall per-capita intake according to the average caloric requirements of each person;
- obtains the distribution of per-capita intake of a nutrient substance (perhaps even by age, sex, and lifestage groupings) as the distribution of mean per-capita intakes over households in the survey.
The household-level data method has two potential limitations: first, it requires literacy of at
least one household member; and second, it is almost impossible to account for the differential alloca-tion of foods within the household. It may be possible to estimate the mean daily intake of each person within the household more accurately by making adjustments for differences in the age, sex, and weight of household members and, if possible, for social and cultural context. Then one could obtain a rather approximate estimate of the daily nutrient intake distribution of persons in a sex/age/ lifestage group from the mean daily intakes computed from each household. Thus, household-level data can provide some idea about the upper percentile of intake of a nutrient in a given subpopulation. 5.5.2.2 National or regional availability data When national balance sheets or regional diets are the best source of consumption data available, the upper percentiles of the habitual intake distribution might be estimable from information on mean per-capita intake. It is important to note, however, that these estimates are likely to be very inaccurate and must be based on strong assumptions that are difficult to test in practice (Dowler and Ok Seo, 1985; Gibson, 2005; Lee and Nieman, 2003).
For example, if it is assumed that per-capita intakes are normally distributed, and if a coeffi-cient of variation (CV) can be determined by “borrowing” information from other countries, then a standard deviation (SD) of intake could be computed. The 97.5th percentile of the intake distribution could then be obtained by multiplying the SD by two and adding the product to the mean per-capita intake. A second, slightly more sophisticated, approach would rely on the well-known fact that, for most nutrient substances, intake distributions are skewed rather than symmetric. This second approach would assume a log-normal or other such distributional form to estimate an upper-tail percentile. In

5. Dietary intake assessment
67
any case, an estimate of the CV (or of the SD) of the intake distribution would need to be available or would have to be assumed.
Either approach given above is likely to result in extremely inaccurate estimates of the upper intake levels of a nutrient substance in a group. Such estimates should be relied upon only when there are no other alternatives, as is the case in many regions of the world where individual- or even household-level intake data are not available. Box 5-7 provides a more detailed description of how to use national or regional availability data to estimate upper percentiles of the habitual intake distribu-tion.
Box 5-7. Recommendations for Practice: Using national or regional availability data to estimate upper percentiles of the intake distribution
First, link each food in the food balance sheet or regional diet with the best available composition data. (Note: In most instances, intake from water and supplements will not be included in national or regional data. Further, in many countries, adjustments for spoilage and waste or for losses that may occur during processing, marketing, storage, and cooking are not conducted. This may result in an overestimate of the per-capita consumption of the nutrient substance.)
Second, estimate a per-capita nutrient substance intake for each age/sex/lifestage group, using average energy requirements to derive a factor to allow quantification of the nutrient substance intake in each demographic group. One assumes that intakes are distributed among the age/sex/lifestage groups in the same proportion as are energy intakes. For example, if the energy requirement of a child is estimated to be one third of the energy required by an adult male, then one assumes that vitamin and mineral intake for the child also will be one third of the vitamin and mineral intake of the adult male. (Note: Such assumptions are not testable with these limited data and may result in inaccurate estimates, thereby introducing biases.)
Third, using the estimated mean nutrient substance intake in each population of interest, derive one or more upper-tail percentiles of the habitual intake distribution by relying on some type of distribution (e.g. normal, log normal) and an assumed CV or SD of intake.
Finally, try to estimate the distribution of the total nutrient substance distribution—that is, the distribution that includes nutrients from supplements or major sources other than those included in the food balance sheet or regional diet. This could be done by shifting the percentile obtained from the food balance sheets by an amount derived from marketing or sales data of supplements (or other major sources) in the country. That is, if marketing or sales data are available and suggest that a substantial proportion of the popula-tion consumes supplements, then the risk assessor could adjust the percentile distribution by the amount in a representative dose, e.g. a weighted average across the companies of the doses with the greatest sales. A worst-case scenario would be obtained by adding to the percentile obtained from the food balance an intake from supplements equivalent to an upper percentile obtained from sales data. This implicitly assumes that individuals with large nutrient consumption from food sources also are the ones who tend to consume more supplements. In countries in which persons receive supplements via food aid packages, the opposite assumption may hold.
With the resulting data, the proportion of individuals in each age/sex/lifestage grouping with
habitual intakes at or above the UL can be identified, albeit in a very approximate manner. Such an approach to dietary intake assessment is likely to result in an overestimate of the proportion of the population at risk for the following reasons: (i) per-capita estimates of food consumption are based on national or regional food availability data, which do not include important sources of food waste, spoilage, and other losses; and (ii) the estimates of intake from supplement sources and possibly from highly fortified foods attribute intake of such dietary items to all persons rather than just to the prod-uct users.
The size of the overestimation is not known. In the short term, it would be useful to calibrate this type of assessment—at least in some regions. Calibration could be done using data from small, focused food intake surveys designed to provide the information needed to test some of the sweeping assumptions that are necessary when only a national per-capita intake can be derived from food balance sheets.

A Model for Establishing Upper Levels of Intake for Nutrients and Related Substances
68
5.5.2.3 Marketing and sales data Because marketing and sales data are highly aggregated and generally reflective of specific products rather than widely available commodities (which usually are the foods included in food balance sheets), their primary use in estimating intakes occurs in the making of total intake estimates: that is, marketing/sales data are added to other data to provide a more complete estimate of overall intake. Marketing and sales data may be used directly to estimate intake, but generally only if these products are the specified target of the intake estimate and marketing and if these data are the major or only source of information about consumption of the products. Unless the products are very widely con-sumed, data about average per-capita intake flattens the distribution curve. Some adjustments could be made to attribute their intake to the proportion of users in the population, but such adjustments may not adequately reflect the nature of upper levels of intake. 5.5.2.4 Other Even when data are very limited, it may be possible to roughly estimate the intake of nutrient sub-stances by modeling diets based on dietary guidelines for the country or region.1 The assumption is that the guidelines would reflect some information about the foods available and about a possible con-sumption pattern. Clearly, intakes estimated using diets modeled on dietary guidelines will be less accurate than those using food consumption data, but such estimates may be of some assistance when consumption data are unavailable and questions of safety need to be addressed.
Finally, in the face of no data, it may be possible to model dietary scenarios using observa-tions, information on the types of food sold, or other assumptions. In essence, the risk assessor creates a diet for the subpopulations of interest and proceeds to estimate the intake of the nutrient substance from this scenario. This truly is a last-resort approach.
5.6 Step 5: uncertainties associated with assessments A critical component of any type of risk assessment is the specification of the uncertainties involved in generating the outcome. Building on earlier work by WHO (WHO, 1997), the Group reviewed factors that may introduce uncertainty into the intake estimates and their potential impact on risk characterization. Uncertainties and biases in the estimation of habitual nutrient substance intake dis-tributions can be due to inaccuracies in the composition and consumption data and to shortcomings in the analytical or statistical methods used. Uncertainties associated with dietary intake assessment can be substantial.
Risk assessment uncertainties related to estimates of intake have not been well explored, and often they have not been taken into account. One reason for this may be that non-nutrient risk assess-ment can take advantage of conservative (i.e. large) uncertainty factors for the data associated with hazard identification and characterization (see Section 4.4.3). In classic assessment, the relatively conservative adjustments for the uncertainties associated with hazard identification and characteriza-tion often have been viewed as obviating the need to adjust for the uncertainties associated with the dietary exposure assessment step.
However, the emerging area of nutrient risk assessment is different in that nutrient substances are associated with risk as well as the ability to meet biological essentiality or provide a demonstrated impact on health. Therefore, in the case of nutrient risk assessment, the uncertainty factors used for hazard identification and characterization do not have the ‘luxury’ of being overly large and thereby highly conservative. Rather, they must be fine-tuned enough to preclude the setting of a UL that is lower than the level of intake needed to achieve the ‘health benefit’ of the nutrient substance. Because uncertainty factors used in nutrient hazard identification and characterization cannot be overly large, they are less likely to overwhelm or make inconsequential the uncertainties associated with dietary
1 Use of estimated levels of intake based on diets modeled from available dietary guidelines may also be used generally for nutrient risk assessment as a check on the estimated intakes obtained by other means and to clarify whether current public health recommendations are non-problematic relative to issues of nutrient substance risk.

5. Dietary intake assessment
69
intake assessment. Thus, in turn, the uncertainties associated with dietary intake assessment take on importance. Ideally, the nutrient risk assessment process would work to incorporate both types of uncertainties. 5.6.1 Composition data Even the highest-quality composition databases introduce some unquantifiable error into the estimate of intake for a number of reasons:
• The average content of a dietary item may be inaccurate because the number of samples for chemical analysis was not large enough to reflect true content. It is unknown to what extent overestimates and underestimates of the amount of a specific nutrient substance cancel out across dietary items.
• Dietary items for which there are composition data may not be sufficiently similar to those for which intake is reported. In this case, the nutrient substance content would be misrepresented when the item is entered into the record. For example, one brand of corn flakes cereal may be considerably different in composition from the composition specified in the database for ‘cereal, corn flakes.’
• Nutrient substance composition may be out of date and thus inaccurate, or it may be incom-plete. The speed with which reformulation occurs for certain key products such as fortified foods and supplements and the difficulty of tracking and identifying these changes add to the tendency for databases to be quickly out of date.
• Bioavailability of the nutrient substance may vary depending upon the matrix of the dietary item, other contents of the diet, and physiological characteristics of the consumer. Moreover, not all forms of a nutrient are equally bioavailable.
• Reliance on labeled content information may result in underestimation of composition if labeling requirements focus on minimum declarations or if manufacturing practices involve the addition of overages.
5.6.2 Consumption data Uncertainties arise when the data have not captured the true consumption of the dietary items. Factors that influence this include the following:
• Sample size is too small or not inclusive of all age/sex/lifestage groupings.
• Replicate interviews or observations on same individual were not conducted.
• A decrease in accuracy of estimates occurs at the upper tails of distribution (usually the key aspect of the distribution for nutrient risk assessment): the tails always are less accurate than estimates derived from the center of the distribution.
• Systematic errors in measurements of food consumption are introduced by self-reports. When dietary intake assessments of adults have been compared to intake measured using biomarkers of energy and nutrient, there is evidence of underreporting of food consumption, particularly as it relates to energy intakes, at least in North America. Although the magnitude and struc-ture of the error differ depending on the assessment method (Kipnis et al., 2003), no method of assessment that relies on self-reporting appears immune from this problem. Systematic overreporting of consumption may occur among some individuals as well, but errors of this type appear to be less common (Black and Cole, 2001) and have been the focus of much less study to date.
A Model for Establishing Upper Levels of Intake for Nutrients and Related Substances
70
5.6.3 Analytical methods and corrections Even the most accurate consumption data may lead to erroneous estimates of upper-tail intakes if inappropriate statistical methods are used for analysis. In the ideal scenario, where total intake infor-mation is available for individuals who are representative of the subpopulations, it is important to apply methods that permit reducing the effect of measurement error (such as errors arising from survey-related factors and day-to-day variability) on intakes. Failure to reduce the measurement error results in estimated habitual nutrient intake distributions with inflated variance (IOM, 2001). That is, the estimated number of individuals with intakes greater than the UL is likely to be too high.
When only data at the household level or at the national level are available for estimation, and when these data must be combined with highly unspecific data such as sales of supplements, it is necessary to rely on strong hypotheses (which may not be testable) to arrive at individual-level esti-mates of upper-tail consumption. Inevitably, the grossly simplified analytical methods that can be implemented in these cases will lead to estimators with very large errors.
5.7 Step 6: reporting the dietary intake assessment In order to provide for transparency and increased utility, the report for the dietary intake assessment should contain complete documentation. Documentation is an essential aspect of dietary intake assessment—and nutrient risk assessment in general—but at times it has been noticeably absent from reports. Just as importantly, the report of the dietary intake assessment should be responsive to the information needs for the nutrient risk assessment. A general framework for reporting the dietary intake assessment appears in Box 5-8.
Box 5-8. Recommendations for Practice: Reporting on the dietary intake assessment
• Provide intake distributions as percentiles - for subpopulations - for appropriate nutrient substance form, for example:
o total intake from all sources o specific chemical forms only (e.g. preformed vitamin A, retinyl esters) o synthetic form (e.g. folic acid) o amount adjusted for bioavailability (e.g. folate equivalents) o categories of dietary items
- with standard errors for estimated percentiles. • Specify adjustment factors or other calculations, for example adjustments and calculations used to
estimate the upper tail of the distribution when imputed from national data.
• If not possible to estimate distribution, provide reasons.
• Identify the database(s) and analytical method(s) used, and the rationale for the selection.
• Specify uncertainties, particularly for the following: - composition data
o timeliness, inclusion of fortified foods/supplements/other o nature of data: analyzed values, recipe calculations, based on label declarations
- consumption data o nature of data collection instruments (individual recalls, frequency data, availability data,
scenarios, etc.) and sample o nature of mix of information (if needed) to simulate total intake
- estimation of intake distributions. • Guidance on how results should be interpreted relative to ULs.

5. Dietary intake assessment
71
5.8 Summary Dietary intake assessment provides quantitative estimates of the intake of a nutrient substance by the (sub)population(s) of interest—that is, the information needed to estimate the proportion of the (sub)population that is likely to exceed the UL. The discussions above lay the groundwork for harmonizing the approach to dietary risk assessment—an approach that uses the best available data and methods to generate intake estimates and document findings to aid the risk manager. When possible, the aim should be to obtain individual-level consumption data and up-to-date food composi-tion data and then to use appropriate statistical approaches to estimate the distribution of intake. In the absence of such high-quality data, dietary intake assessments can and should continue with the recognition that caution is needed in analyzing and interpreting the data. The Group stressed the importance in all cases of clear, transparent, and detailed documentation of the approach used.
72
6 Nutrient risk characterization
his section discusses the functions of nutrient risk characterization and notes the approaches used by the three national/regional authoritative bodies (see Section 2.2). It then addresses basic components of nutrient risk characterization and identifies elements of nutrient risk
characterization that provide information relevant to key types of decision-making by nutrient risk managers. Emphasis is placed on the importance of ensuring that risk characterization communicates information to address the needs of the risk manager.
6.1 Overview Nutrient risk characterization focuses on risk estimation and is the final step of nutrient risk assess-ment. In essence, it is a process that integrates the outcomes of the preceding steps to provide an estimation of risk for the specified (sub)population. It also provides descriptions of strengths and weaknesses of the estimates and other characterizing information about the risk (IPCS, 2004b). The quality of a nutrient risk characterization is highly dependent upon the scientific rigor and appropri-ateness of the steps that precede it.
In other words, the nutrient risk characterization functions to integrate the outcomes of the earlier steps into a set of conclusions that address the nutrient risk managers’ need for scientific information to make risk management decisions. The information provided to the risk manager is both quantitative and qualitative (Renwick et al., 2003). Like hazard identification/characterization, risk characterization often is an iterative and evolving process. Quantitative information includes upper levels of intake (ULs) and estimates of risk at different levels of intake, while qualitative information includes specification of (sub)populations believed to be at highest risk, reasons for the risk, and descriptions of the nature and severity of the risk. Furthermore, risk characterization outlines all key assumptions and gives a clear explanation of the uncertainties involved in the assessment. For example, when the risk assessment is based on animal data, the validity of such data needs to be specified and supported. Also, uncertainties associated with the extrapolation of data from studies in animals to predict human risk should be presented. Finally, scientific information should be specified on susceptible subpopulations, including those with greater potential exposure and/or specific physio-logical conditions or genetic factors. To facilitate improved communication, the information for risk managers can be in the form of a comparison of the relative risks among risk management options.
The nutrient risk characterization that is produced is followed by either a risk management decision or a request for further analysis. In principle, the risk assessment process may never end (IPCS, 2004b). However, from a risk management standpoint, there usually is some imperative and timeline that concludes the process. Therefore, in practice, the risk assessment ends when the risk management decision is made. The record produced by a risk assessment stands as a justification for a decision at the time the decision was made. However, with additional information—such as a new study that demonstrates an adverse health effect not previously identified or data that can reduce the uncertainties identified in the existing risk assessment—the risk assessment may be reopened (IPCS, 2004b).
6.2 Examples of nutrient risk assessment The principles associated with risk characterization for non-nutrients can be very informative for the development of nutrient risk characterization. Additionally, since risk characterization is the risk assessor ‘talking’ to the risk manager, the Group considered it useful to review the approaches for
T
6. Nutrient risk characterization
73
nutrient risk characterization described in the NR-reports issued by the three national/regional authori-tative bodies identified in Section 2.2. Group members looked for commonalities in the approaches and reasons for differences. Since the risk characterization step is population-relevant (see Section 3.1.1), the identification of differences in the approaches could be informative. A comparison listing can be found in Annex 10.
While the above-mentioned NR-reports included basic scientific information useful to risk managers (see Annex 10), the risk characterizations provided by each of the NR-reports differ in both content and format. In particular, the reports varied in their generic descriptions of the information to be provided in the risk characterization. The approach to content and format used by the European Food Safety Authority and by the Scientific Committee on Food (EFSA-SCF) differed from that of the IOM. The Expert Group on Vitamins and Minerals (EVM) did not specify a risk characterization section per se but indicated that elements of risk characterization would be present in the concluding risk assessment summation section for each nutrient.
To some extent, the content and format of the risk characterizations would be expected to differ among the NR-reports since the terms of reference (see Section 2.1) indicate that the goals differ somewhat for the three national/regional authorities. In many cases, however, the NR-reports specify different ULs for the same nutrient, which no doubt contributed to different risk charac-terizations and advice for decision-making. It was difficult to make meaningful comparisons as to the nature of the content. Moreover, no identifiable commonalities for format and organization of presen-tation emerged.
However, in terms of the roles of risk assessors and risk managers, one issue in particular was noted. Notably, the NR-reports include some risk characterization components that appear to contain prescriptive risk reduction recommendations. Examples include advice to provide warnings that women planning to become pregnant should not consume cooked animal liver and advice that men and postmenopausal women avoid iron supplements and foods highly fortified with iron. These prescriptive recommendations could be argued to have been the result of the risk assessor taking on the role of the risk manager. In considering the prescriptive recommendations found in NR-reports, however, the Group noted that at times the requests from risk managers may have influenced the nature of the risk characterization: a priori the risk managers may either inadvertently or for specific reasons have identified questions for risk assessors that (i) generally have been considered to belong in the domain of risk management or (ii) appear to invite the risk assessor to give advice in risk management terms. For example, the terms of reference for the EVM make reference to “controls for ensuring the safety of vitamin and mineral supplements,” and risk assessors are to “advise on levels of vitamins and minerals in fortified foods.”
The Group agreed that there is some latitude for where to draw the line between risk assess-ment and risk management, and that this line may move depending upon the issue at hand and the needs of national/regional authorities. For an international model for nutrient risk assessment, how-ever, the specification of some general guidance could help achieve the desirable outcome that risk assessment does not overextend its conclusions into risk management. The Group noted that the risk characterization step is most susceptible to overextending of conclusions, but other steps in nutrient risk assessment may be vulnerable to the same problem.
6.3 Components of nutrient risk characterization 6.3.1 Basic components The Group saw value in developing either (i) a standard approach to nutrient risk characterization and format for presentation of information, or (ii) at least an identified process to ensure that the risk characterization contains the needed components. Such an approach or process could help ensure that basic scientific components of nutrient risk characterization are addressed consistently, and it could help differentiate between risk assessment and risk management. In both cases, consideration should be given to the format and organization of the characterization. Key components of the scientific information needed to provide a nutrient risk characterization appear in Box 6-1.

A Model for Establishing Upper Levels of Intake for Nutrients and Related Substances
74
Box 6-1. Recommendations for Practice: Key scientific components to include in nutrient risk characterization
• Nature of adverse health effects, particularly the critical adverse health effect;
• Indication of the severity and reversibility of adverse health effects;
• Nature of dose–response relationship; indication of threshold levels for response when they exist; • Use of uncertainty and quantitative factors and degree of uncertainty surrounding key considerations
including intake, data extrapolation to general population or between species, data insufficiency, and significant gaps in data (including dose–response data);
• Derivation of the UL;
• Description of approach to intake assessment;
• Estimation of proportion of (sub)population exceeding UL; consideration given to individuals with average intakes and those with high intakes;
• Identification of special subpopulations at risk; • If known, specification of the magnitude of the risk above the UL (for example, through the use of intake–
response models);
• Indication of exceptions for which exceeding UL may be warranted;
• Mechanisms and conditions of effect.
Undoubtedly the importance of ensuring that the key elements of the science are present in
the characterization is paramount, but it is also essential to make the characterization relevant to the decisions that the risk manager must make. The consideration of relevance to the risk manager would benefit from much more time and resources than were available to the Group. As a starting point, however, the Group developed Table 6-1 to identify elements of risk characterization that provide information relevant to key types of decision-making by risk managers (see Section 2.3 for information regarding risk managers and the types of decisions they make).
If the questions asked by the risk manager at the national or regional level focus the assessment on a limited task, some of the elements may be relatively unimportant. However, for an overall international model for nutrient risk assessment intended to serve a range of uses, the specification of the elements listed in Table 6-1 is useful. Importantly, risk characterization for a generic model is most likely to have maximum utility for a range of purposes if it addresses risk by age and sex subpopulations to the extent the available data make possible.
On the other hand, the elements identified for a general model in Table 6-1 cannot be expected to serve every nutrient risk characterization need. In some instances, the option for the risk manager may not have been clear a priori, or the options may need to be amended in response to a change in circumstances or to increased understanding of the issue. Especially at the national or regional level, the risk manager may need to request that the risk assessor address additional science issues that relate to an adjustment to, or to a specific aspect of, a particular policy option or risk management decision to be made. In short, there could be value in further iterations between the risk assessor and risk manager. Some examples of the questions that could be posed to the nutrient assessor in such an iterative dialogue are:
• What would happen to the distribution of intake of a nutrient substance by different sub-
populations if the fortification level of a food were increased by specified amounts to address problems of inadequacy? (This could involve iterations with different fortification levels and different foods.)
• If limits were placed on the content of nutrient X in certain fortified foods or supplements in an attempt to reduce the population’s exposure to the nutrient, what would happen to the distribution of nutrient intakes of subpopulations or vulnerable subgroups with lower intakes?

6. Nutrient risk characterization
75
Table 6-1. Elements of Risk Characterization to Inform Key Decisions Made by Risk Managers
Decisiona Element ▪ Adverse health effect Need to take action - severity
- vulnerable subpopulations ▪ UL, by age and sex ▪ Total intake distributions - for all subpopulations with UL - for specific food product categoriesb
For both, include i. magnitude of intakes exceeding UL ii. numbers of people exceeding UL iii. reasons intakes are above UL ▪ Special subgroups potentially at risk ▪ If no UL established, explanation as to why ▪ Uncertainties related to each of the above, for example underreporting biases ▪ Products high in the substance, when intake exceeds UL ▪ Systemic biases in intake data, when intake is close to UL
▪ All forms or specific sources and identification by food product category if data allowc Reducing level in food supply ▪ Bioavailability, interactions with other food components or other nutrients ▪ Relative contribution to daily intake of particular product types or classes if data
allow ▪ Uncertainties related to each of the above ▪ Data gaps in respect of a food or product category ▪ High-level intake interventions to address inadequate nutrition Product labelling ▪ Ability of individuals at risk to self-identify ▪ Practices, behaviours, or use conditions likely to increase or decrease risk ▪ Uncertainties related to each of the above Education ▪ Ability of individuals at risk to self-identify and related uncertainties
a See Section 2.3, Boxes 2-2 through 2-5. b Additionally, risk managers at the national or regional level may specify food product categories of interest. c Although the identification and development of ‘what-if’ scenarios are outside the scope of the role of the risk assessor
relative to a generic international model for nutrient risk assessment, national and regional risk managers may specify questions for risk assessors that relate to the scientific evaluation and impact of particular scenarios related to changes in product formulation or changes in intakes from certain sources.
6.3.2 Considerations to foster an improved interface between assessor and manager The Group noted that relatively little attention has been given to the characteristics of risk character-ization that allow meaningful communication between the nutrient risk assessor and the nutrient risk manager. For instance, certain kinds of information have the potential to be overlooked but may be especially valuable to the risk manager. While these kinds of information are clearly specified as needed components of the risk characterization, the review of the available NR-reports suggests that they may be overlooked. Examples of kinds of points to be sure to include follow:
• reporting that data for dose–response are extremely limited, as appropriate; • clear indication of data gaps, such as: “The effect of taking nutrient substance X at doses
between A mg and B mg is unclear”;

A Model for Establishing Upper Levels of Intake for Nutrients and Related Substances
76
• calling attention to the fact that specific behaviours may change risk, such as: - “Intake from supplements by [subpopulation Y] and the consumption of highly fortified
foods may increase the proportion of the [subpopulation] with [particular adverse health effect],” and
- “Some users of high dose supplements may exceed the UL.” The Group concluded that improved understanding of nutrient risk managers’ needs would reduce the chance that relevant information might be overlooked.
The Group also noted that insufficient attention has been given to the problem formulation step for the purposes of assisting risk characterization. Others (IPCS, 2004b; Renwick et al., 2003) suggest that problem formulation can be a useful step to enhancing the usefulness of the risk charac-terization to the risk manager. As described in Section 2.3.4, problem formulation for risk assessment consists of a dialogue among relevant stakeholders and includes discussion of how the information will provide the necessary support for risk management. This specific activity can be critical to ensur-ing the utility and appropriateness of the risk characterization for the risk manager. Problem formu-lation needs more attention in future nutrient risk assessments. Other useful topics to address are covered in Section 10, “Identified research/data gaps, needed discussions, and next steps.”
6.4 Summary Nutrient risk characterization is the final step in nutrient risk assessment. Its roles are to integrate the outcomes of the preceding steps in risk assessment and also to serve as an important interface between risk assessors and risk managers. This section discusses risk characterization from the perspective of its key components, and it identifies the need to give further consideration to planning for the transfer of information from assessor to manager and to formulating the risk characterization so that it is max-imally useful to the manager.

77
7 The model for nutrient risk assessment
fter the Group considered the steps of hazard identification/characterization, dietary intake assessment, and risk characterization, a general model emerged. This section presents the model, outlines key questions and activities associated with the model, and addresses implica-
tions for the use of a ‘data-driven’ model.
7.1 The general model The model is illustrated schematically in Figure 7-1. As shown, the model links hazard identification and characterization, and it highlights the iterative aspects of the process by the use of a double-headed arrow. Information from the dietary intake assessment is combined with the information from hazard identification/characterization in order to carry out risk characterization. The entire process is preceded by a problem formulation step. Key considerations for each component are included on the right side of the figure.
Note: BI = benchmark intake; NOAEL = no observed adverse effect level; LOAEL = lowest observed adverse effect level; UL = upper level of intake.
Figure 7-1. Model for Nutrient Risk Assessment
A

A Model for Establishing Upper Levels of Intake for Nutrients and Related Substances
78
7.2 Key questions and activities associated with the model The process of nutrient risk assessment is underpinned by a series of questions that are addressed by the various decision-making steps described in earlier sections of this report. The four tables that follow list key questions for nutrient risk assessment and related activities for addressing them. The applicability of the model to the range of nutrient substances is discussed in Section 8.
Nutrient risk assessment is preceded by the important step of problem formulation, which involves stakeholders including the risk manager (Table 7-1). This activity is critical in setting the stage for the assessment, and it also helps to ensure that the information provided to risk managers meets the needs for risk management.
Table 7-1. Key Questions and Activities for Problem Formulation
Key questions Activities ► What are the goals and reasons for the nutrient risk assessment?
Conduct dialogues among stakeholders, particularly between nutrient risk assessors and nutrient risk managers, to ensure common understanding of the problem and the purpose of the assessment. Refine problem formulation as needed, based on these interactions.
Nutrient problem formulation
► What is the nature of available prior knowledge?
Collect and evaluate key elements of prior knowledge to determine whether risk assessment is necessary.
The process of hazard identification and characterization is carried out by the risk assessor
(Table 7-2). The process reflects combined and iterative efforts that result in the derivation of a UL and a characterization of the hazard associated with high levels of intake of the nutrient substance.
Table 7-2. Key Questions and Activities for Nutrient Hazard Identification and Characterization
Key questions Activities Nutrient hazard identification and characterization
► What are the adverse health effects and the intake levels associated with the effect?
►How will the search for adverse health effects be conducted and summarized?
Consider whether there is sufficient a priori knowledge to narrow the review or, alternatively, how broad the review should be. Define and document data search strategy a priori. Design table formats appropriate for summarizing results of each study type. Identify information to be collated and summarized for individual studies; document this information a priori. Consider both the quality of methodology and the relevance to nutrient substance–adverse health effect relationship. Identify quality ratings to be used when reviewing each study.

7. The model for nutrient risk assessment
79
Table 7-2. Continued Key questions Activities Nutrient hazard identification and characterization
►What background information about the nutrient substance and adverse health effect is needed?
Obtain and summarize relevant information regarding: ▪ chemistry, nomenclature, and function; ▪ sources and forms of nutrient; ▪ bioavailability and bioconversion; ▪ absorption, transport, tissue distribution, body stores,
metabolism, and excretion; ▪ interactions; ▪ homeostatic mechanisms; ▪ assessment of intakes and outcomes; ▪ mechanisms of toxicity; ▪ comparative metabolism and kinetic data.
► [Are the observed health effects adverse, and are biomarkers of effect (if used) valid/reliable predictors of observable clinical outcomes?]
[Consider Figure 3-3 ranking, the nature of the homeostatic mechanisms, and data on the validity of biomarkers of effect. NOTE 1: If possible, this is done a priori—that is, before the search—but data findings and the nature of data may require this activity as part of this step.]
► How is the upper level (UL) established?
► What criteria are used to select the relevant data set?
Specify criteria for selecting or excluding specific studies from the search results and for weighing this evidence in the decisions to be made.
►What is the critical adverse health effect to be used as the basis for the UL?
Select the effect most likely to provide public health pro-tection. In practice, it is the effect that occurs at lowest level of intake; or, as appropriate, the effect likely to pro-tect the most sensitive members of the (sub)population; or, as appropriate, the effect with the steepest intake–response. [NOTE 2: As appropriate, different critical adverse health effects may be selected for different subpopulations.] [NOTE 3: The approach may also be carried out so that several ‘candidate’ critical adverse health effects, all providing public health protection, are explored through the derivation of a set of tentative ULs prior to selection of the ‘final’ critical adverse health effect.]
► For what subpopulations are there sufficient data to establish a UL?
Examine data for groups such as children of different ages, pregnant women, young adults.
►What is the NOAEL (or LOAEL) or BI for the critical adverse health effect?
Examine intake–response data and estimate curve for the relationship for each of the subpopulations with sufficient data.
►Can quantitative adjust-ments for uncertainty be carried out for the NOAEL (or LOAEL) or BI value? What is nature of uncer-tainties unaccounted for by quantitative adjustments?
Consider the nature of uncertainties as well as the quality and strength of evidence. Identify data available to make quantitative adjustments to the observed values. Identify composite uncertainty factor—a single value that reflects the uncertainties that were not addressed by quantitative adjustment factor.

A Model for Establishing Upper Levels of Intake for Nutrients and Related Substances
80
Table 7-2. Continued Key questions Activities Nutrient hazard identification and characterization
►What is the quantitative value for the UL?
Apply the quantitative adjustment and/or composite uncertainty factor to the NOAEL (or LOAEL) and as appropriate to the BI to derive a UL for each of the subpopulations with sufficient data.
►Are there unstudied age/sex/ lifestage subpopulations?
Adjust derived ULs by appropriate methods to provide ULs for unstudied subpopulations.
The dietary intake assessment (Table 7-3) provides important information about the current
levels of intake for a (sub)population. When combined with information about the levels of intake that cause risk, the nutrient risk assessment can move to characterizing the risk.
Table 7-3. Key Questions and Activities for Dietary Intake Assessment
Key questions Activities Dietary intake assessment
► What type of dietary intake estimate is needed?
Determine whether the estimate should reflect total dietary intake or a targeted dietary intake. Determine whether the need is for an estimate of habitual intake or of acute intake.
► What are the possible approaches to estimating dietary intake of a nutrient substance?
Make or request any needed modifications to improve utility of composition data. Choose source of consumption data considering strengths and limitations of available data sets—including suitability of the data for estimating intake distributions. As needed, combine estimates of intake from different sources to ensure that the data set reflects intake from all sources. Make statistical and/or other adjustments to estimated intakes based on validated and documented approaches.
► Is there additional information that would assist in nutrient risk assessment?
Identify caveats pertaining to uncertainties in data, and describe impact of uncertainties.
Finally, nutrient risk assessment concludes with risk characterization (Table 7-4), which acts
as an important interface between the outcomes of the risk assessment and the information needed by risk managers for decision-making.
7.3 Implications of a data-driven model The nutrient risk assessment model is designed to make use of the available data. It does not rest on the assumption that it is preceded by an organized and appropriately designed set of research activities that are specifically tasked with creating a complete database for nutrient risk assessment. Rather, the model works to acknowledge and account for the uncertainties inherent in the data sets so as to provide the best estimates of ULs and associated risk under the circumstances. While it is, of course, preferable to have a high-quality data set that provides more than adequate information, application of the model is expected to proceed using the data available.

7. The model for nutrient risk assessment
81
Table 7-4. Key Questions and Activities for Nutrient Risk Characterization Key questions Activities Nutrient risk characterization
► What is the nature of the risk?
Characterize the nature of the threshold levels and the intake–response relationship. Integrate data and develop descriptions of the nature of the critical adverse health effect, including seriousness, reversibility, and rarity. Identify vulnerable or sensitive subgroups, and describe the risk and its impact for each.
► What is the magnitude of the risk?
Determine what proportion of each subpopulation of interest has a (habitual or acute) intake that exceeds the upper level (UL); information about distributions above the UL may be included.
► What information is most useful to the risk manager?
Identify types of information needed by risk managers; this should be informed by the problem formulation step. Identify and use the presentation format most informative for meeting the risk manager’s needs. Consider interacting with risk managers to enhance the utility and appropriateness of risk characterization. Ensure that uncertainties are highlighted and described as appropriate for the risk manager’s purposes.
This ‘data-driven’ nature of the model and its design for taking data uncertainties into account
have several implications that were discussed during the Workshop:
1. Documentation of scientific judgement is necessary. Available data are limited. Furthermore, the decision-making that occurs for nutrient risk assessment relates to substances and food products already available and marketed to consumers. Timely decisions about appropriate level of intake are almost always needed in the absence of a robust database. For this reason, the use and interpretation of data for the purposes of nutrient risk assessment often require scientific judgement. In fact, scientific judgement within the context of public health protec-tion is a hallmark of the nutrient risk assessment process. Importantly, the utility and trans-parency of the outcomes of the assessment are greatly enhanced when the decision-making process is clearly described—including documentation of the assumptions made and the rationale underpinning the decisions. This often is overlooked in reports on nutrient risk assessment.
2. ULs are adequately adjusted for uncertainty. Because much of the available data concerning
nutrient substance risks is less than ideal, the process for setting the UL deliberately and systematically takes into account uncertainties associated with the data. As a result, the process sets a UL that meets its definition: the highest level of habitual intake likely to pose no risks of adverse health effects for almost all individuals in the target (sub)population, including the most sensitive individuals. Thus, ULs can be applied by the user with confi-dence that they provide public health protection. It is unlikely that users of ULs need to devise additional corrections.
Specifically, by taking into account all the uncertainties, a UL value is established that is quantitatively lower than the lowest point on the distribution for the observed intakes associated with the adverse health effect. In turn, the nature of the uncertainties determines the size of the difference between the lower end of the observed intake/adverse health effect relationship and the derived UL. Greater uncertainties result in lower ULs so as to allow maximum public health protection. Intakes maintained below the UL (but at or above the

A Model for Establishing Upper Levels of Intake for Nutrients and Related Substances
82
requirement, if applicable) thus can be consumed without appreciable risk to health through-out the age range or lifestage for which the UL is intended.
In this sense, the basis for establishing ULs is somewhat similar to the basis for establishing recommended intake levels for nutrient substances. Both reflect values at the extreme ends of their respective intake distributions so that virtually all members of the target subpopulation are protected. However, a recommended intake is a value consistent with the high end of the intake/requirement distribution, while the UL is a value consistent with the low end of the intake/adverse health effect distribution.
3. Limited data do not mitigate need for ULs. The need to establish ULs for nutrient substances
often arises in the absence of an ample database. Since the purpose of a UL is to assist risk managers who must make decisions relative to public health, the absence of a UL, particularly if risk is known to exist, is problematic for the risk manager. If a UL is not set, the risk manager has no scientific basis for decisions that he or she must make in any case. Therefore, assuming some data are available, it is preferable to establish a UL if at all possible and, in turn, work to describe the limitations and unknowns regarding the value of the UL. This approach is not intended to restrict the quantitative options available to the risk manager; he or she has the option of seeking alternative approaches to providing public health protection.
Sufficient detail must be provided so that the risk manager understands the uncer-tainties and can take them into account in making his or her decisions. Moreover, the degree of uncertainty surrounding the value of the UL is best conveyed solely through the risk characterization description provided to risk managers. Using different names for ULs based upon their degree of uncertainty can be confusing to end users and is likely to be unnecessary when the only difference is level of certainty. Even in situations in which no adverse health effects have been associated with the consumption of the nutrient substance, the risk assessor often is called upon to provide assistance to risk managers. As described in Section 8.2.1, a process for providing risk managers with a highest observed intake (HOI) can be used in these situations.
4. Absence of evidence does not mean evidence of absence. The Group emphasized that the absence of evidence of an adverse health effect is not equivalent to evidence of the absence of an adverse health effect. Considerable caution must be exercised when the available data reflect studies designed for purposes other than determining the safety of the nutrient sub-stance. For example, if studies designed to study the health benefit of a substance consumed at different levels of intake report no adverse health effects, this lack of evidence cannot be considered adequate to demonstrate the absence of adverse health effects. The absence of adverse health effects should be determined through the use of a priori protocols that pre-scribe and apply appropriate methods for identifying adverse health effects.
7.4 Summary The model for nutrient risk assessment is a process based on using the available data and, for this rea-son, ensuring that its limitations are taken into account. The model outlines activities central to estab-lishing ULs, determining and characterizing the risk, and providing scientific information useful to risk managers in a manner that makes the uncertainties clear. The model anticipates that risk managers will need guidance even in the face of data limitations. Therefore, it incorporates methods of relaying information about the nature of the database so that the risk manager is fully informed. Because the model specifies that considerable correction for uncertainty be incorporated in the ULs, it is unlikely that users of ULs will need to devise additional corrections, assuming the value is used for the intended (sub)population. Finally, the model is based on the understanding that the absence of evi-dence of an adverse health effect is not equivalent to evidence of the absence of an adverse health effect.

83
8 Applicability of the model to the range
of nutrient substances
his section considers the extent to which the nutrient risk assessment model is applicable to the wide range of nutrient substances. In particular, it addresses the general applicability of the model and three types of nutrient substances for which the model has limited application: (i)
nutrient substances with no identified adverse health effects, (ii) nutrient substances for which no intake level without risk has been identified, and (iii) nutrient substances for which available data suggest that the levels of intake that pose risk overlap the levels of intake that pertain to biological essentiality or favourable impact on health. Strategies relevant to these situations are provided.
8.1 General applicability and ‘test nutrients’ At the start of its discussions, the Group recognized that nutrient substances are not well defined as a class and that regulatory provisions around the world vary as to the specific substances that may be regarded as nutritional. Some national/regional authorities may limit nutrient substances to only those demonstrated to be essential. Others may define nutrient substances more broadly—including sub-stances with a demonstrated favourable impact on health in addition to including essential nutrients. The Group, without disputing such national/regional considerations, developed a model relevant both to substances that are biologically essential and to substances with a demonstrated health impact.
Substances that are essential have been reasonably well identified, and they are associated with established recommended intakes. Substances that have a favourable impact on health reflect an emerging area of interest. Various substances have been suggested as candidates for this category of nutrient substances, ranging from dietary fiber to so-called ‘bioactive’ constituents of food. Also, the concept of nutrient substances may include macronutrient substances that are inherent constituents of foods but not regarded as uniquely essential—for example, certain carbohydrates or fatty acids—but for which recommended intakes have been specified as either increased or decreased levels of intake so as to have a favourable impact on health. Those associated with recommendations to lower intake may present special considerations relative to the model, as described below.
In any case, the model is applicable to substances that—because they are associated with specified levels of intake known to provide a ‘health benefit’ and distinct from the levels of intake intended to protect against risk from high levels of intake—are consistent with the dual-curve relationship for risk as discussed in Section 3.3. Based on the nutrient risk assessment model, such substances should be addressed using an approach that incorporates special considerations related to the uncertainty adjustments made to the NOAEL, LOAEL or BI so that such adjustments do not result in the nonsensical outcome that the UL is a lower value than the recommended intake associated with the ‘health benefit.’ Moreover, the approach used must carefully incorporate considerations related to the specific homeostatic mechanisms known to exist for essential nutrient substances.
Regarding other aspects of the model’s general applicability, the Group noted that a very wide range of adverse health effects can be taken into account by the model—that is, effects as diverse as cancer, heart disease, reduced kidney function, and liver toxicity can all be addressed. In short, the nature of the endpoint does not change the applicability of the model. The ability to determine valid biomarkers for the endpoints of interest (e.g. cancer) may be challenging; but once they are deter-mined, the model can be applied.
T

A Model for Establishing Upper Levels of Intake for Nutrients and Related Substances
84
Finally, as part of discussions about the applicability of the model, the Group paid particular attention to three ‘test nutrients’: vitamin A, iron, and vitamin C (and its antioxidant functions). The participants considered the decision points/questions as organized by the model within the context of addressing nutrient risk assessment for these three nutrients. They concurred, in the absence of in-depth analysis, that the approach in general would be likely to address the key aspects important for determining and assessing adverse health effects associated with these nutrient substances.
8.2 Special applications The model’s apparent flexibility cannot, however, be relied upon to readily address nutrient sub-stances that do not demonstrate a threshold level for an adverse health effect or nutrient substances for which the levels of intake associated with risk appear to overlap with levels associated with biological essentiality or favourable impact on health. These situations, listed in Box 8-1, reflect deviations from the dual-curve relationship for risk associated with nutrient substances. The Group viewed these situations as separate from situations involving inadequately nourished (sub)populations and/or (sub)populations experiencing disease states such as malaria (see Section 9) for which the focus is on obtaining more data to be used with the model. In the situations listed in Box 8-1, the model may have limitations.
Box 8-1. Situations for Which the Nutrient Risk Assessment Model Has Limited Applicability
• Nutrient substances for which no adverse health effects have been identified but for which risk manage-ment authorities require that a UL be specified. These tend to be nutrients for which there is insufficient evidence to identify an adverse health effect but for which the usual conceptual model of risk associated with both inadequate and excessive intakes would be expected to apply.
• Macronutrient substances that are not essential, that are inherent constituents of food, and that pose a risk at usual levels of consumption (and thereby are associated with authoritative recommendations to lower intake). Such substances are contained in many foods that are important sources of essential nutrient substances, and avoiding those foods could be detrimental.
• Nutrient substances for which available evidence suggests that there is little if any separation between the intake–response curve for risk and the curve for biological essentiality or favourable impact on health. In such cases, the curve for risk appears to overlap the curve for the ‘health benefit.’ (Note: probably this situation is caused by limited and conflicting data rather than actual physiological mechanisms.)
For non-nutrients, approaches outlined for the risk assessment include special discussions for
substances that are demonstrated to have similar non-threshold effects (IPCS, 1994). However, there is no clear consensus on appropriate methodology when the non-nutrient critical effect may not have a threshold, as is the case, for example, for genotoxic carcinogens and germ cell mutagens. Moreover, in setting values such as upper levels for non-nutrients without thresholds, attempts to base approaches on characterizing a dose–response relationship are not considered to be helpful. Under these circumstances, the values are said to require “socio-political judgements of acceptable health risk” (IPCS, 1994). To what extent these considerations apply to the risk assessment of nutrient substances is unclear.
Each of the situations specified in Box 8-1 requires further exploration and development in order to be fully addressed by a nutrient risk assessment approach. The subsections below provide possible interim approaches to handling nutrient substances that demonstrate the characteristics specified in Box 8-1. Given the need for considerable future work in this area, relevant issues are covered in Section 10, “Identified research/data gaps, needed discussions, and next steps.” 8.2.1 Nutrient substances with no identified adverse health effects: highest observed intake values For some nutrient substances, no credible evidence has demonstrated adverse health effects even at the highest intake used or observed. Vitamin B12 is an example of such a nutrient substance (IOM,

8. Applicability of the model to the range of nutrient substances
85
1998b). In such cases, the biological threshold for an adverse health effect, if it exists, may be many times higher than the highest intake studied. Lacking data, however, this amount is not known. If no studies have revealed adverse health effects for a nutrient substance but the risk manager needs scientific advice concerning an upper intake, the highest observed intake (HOI) can be used to give guidance to risk managers. The Group specified the following regarding the HOI:
The highest observed intake (HOI) is derived only when no adverse health effects have been identified. It is the highest level of intake observed or administered as reported within (a) study(ies) of acceptable quality.
To the extent judged appropriate by the risk assessor, other aspects of the nutrient risk assess-
ment process could be addressed by applying principles associated with the model, including consid-erations of uncertainty and scaling of the HOI to subpopulations for which no data are available. However, given the lack of data about risk, relatively few of the components of the model would be relevant. A descriptive narrative could accompany the HOI to explain that it represents a value that is based on a different kind of data than a UL and may overestimate risk by a wide margin. Moreover, given the substantial differences between the methods for setting HOIs and ULs, it is preferable to specify HOIs as HOIs and not to refer to them as ULs. 8.2.2 Inherent macronutrient substances with no known intake levels without risk Certain macronutrient substances inherent in foods are not essential but are widely distributed in or otherwise included in the food supply. Some of these substances are consumed at levels known to cause risk, but there is no identifiable level of consumption that can be considered to present no risk. Since some risk is associated with each level of intake, there is no apparent threshold level of risk.
This is an emerging area of nutrient risk assessment. The Institute of Medicine (IOM, 2002–2005) addressed this situation in its effort to set a UL for saturated fatty acids, nutrient substances for which adverse health effects are well documented. The data demonstrated that any increment in saturated fatty acid intake is associated with increased risk for coronary heart disease. The IOM found no threshold level—that is, no level of intake below which no risk could be established. Moreover, specifying zero as the UL was not an option: eliminating saturated fat from the diet would mean eliminating an extremely large number of foods, including major sources of essential nutrients. Thus, setting the UL at zero would not be practical from a public health perspective. In particular, it would prevent individuals from obtaining sufficient levels of other nutrient substances (e.g. protein, essential fatty acids, micronutrients) carried by the foods that contain saturated fatty acids.
One possible approach in this case could be to ‘model’ or simulate dietary patterns to determine the lowest amounts of the foods that would provide needed amounts of essential nutrients while minimizing the intake of the ‘risky’ nutrient substances (e.g. saturated fat and dietary choles-terol). Then it might be possible to establish a quantitative level of intake that could be useful to risk managers. The Group contemplated whether ‘UL’ is an appropriate label for such a level of intake and to what extent other principles in the nutrient risk assessment model would apply, but it came to no conclusion. 8.2.3 Apparent overlap between level of intake associated with risk and ‘health benefit’ For at least one nutrient substance—vitamin A—evidence suggests there may be overlap between the current recommendations for intake related to the accepted ‘health benefits’ and the emerging understanding about levels associated with risk as reflected by decreased bone density and increased risk of hip fracture. Information on this issue can be gleaned from the three NR-reports (EC/SCF, 2002; EVM, 2003; IOM, 2001) described in Section 2. One report (EC/SCF, 2002) concluded that causality had not been demonstrated, but a likely mechanism of action for the adverse health effect

A Model for Establishing Upper Levels of Intake for Nutrients and Related Substances
86
may be explained by studies in laboratory animals (EVM, 2003). In any case, the data can be used to specify a graded response curve for the risk. This response curve shows that levels of intake that are associated with risk are very close to the recommended intake for vitamin A. None of the three national/regional authorities set a UL based on this adverse health effect, which occurs at a low level of intake. One report’s assessment (IOM, 2001) was concluded prior to publication of most of the relevant evidence. Of the two other NR-reports, one (EC/SCF, 2002) cited conflicting data about bone density and used other effects such as hepatotoxicity as the basis for the UL. The other report (EVM, 2003) cited insufficient evidence for each of the adverse health effects and opted to set a guidance level rather than a UL.
Addressing nutrient risk assessment needs in situations such as that for vitamin A relies heavily on scientific judgement. Although such judgement understandably may conclude that the available data are quite premature and thus questionable as a basis for providing advice, consideration also should be given to the need to protect public health. Some options may be possible assuming that (i) the seriousness and concern for the adverse health effect can be established (with or without a known mechanism); (ii) the data are limited regarding intake–response, and there seems to be an overlap between recommended intake and risk; and (iii) delay in considering the adverse health effect seems inappropriate.
Given that it may be desirable to set a UL under these conditions for the purposes of assisting risk managers, it would be prudent first to specify that the UL should be at or higher than the recom-mended intake (even if not very much higher). The hazard characterization would need to inform risk managers about the approach used by the assessor to address the possibility of overlapping risks. Any scientific information that would help to inform risk managers about decisions related to managing the risk above the UL should be included in the risk characterization step. In any case, even if a different adverse health effect is used as the critical effect on which to base the UL, hazard charac-terization should include the scientific information related to such a potentially serious adverse health effect.
8.3 Summary The nutrient risk assessment model as developed is flexible and can respond to assessments needed for a broad range of nutrient substances. The nature of the endpoint used does not affect the model’s applicability. However, there are certain nutrient substances that either do not demonstrate a threshold level of intake for the adverse health effect or appear to have levels of intake associated with risk that overlap levels associated with benefit. In these cases, the model has limited applicability. Alternative strategies need to be considered and developed further.

87
9 Applicability of the model to inadequately nourished
(sub)populations
utrient risk assessment has well-recognized applications for (sub)populations that are both adequately nourished and ‘generally healthy’ and that consume an array of fortified foods, formulated foods, ‘functional foods,’ and supplements. Existing models for nutrient risk
assessment at the national/regional level were developed consistent with the characteristics of such (sub)populations. However, not all (sub)populations that may receive such foods and supplements are adequately nourished and ‘generally healthy.’
This section of the report provides an overview of the applicability of the model to inade-quately nourished (sub)populations. It then reviews concerns related to homeostatic considerations and the development of ULs within the context of inadequately nourished (sub)populations. While outside the scope of the report, the impact of infectious disease is briefly discussed as well.
9.1 Overview Certain populations in the world and many subpopulations within adequately nourished populations may not be receiving adequate levels of nutrients, may be experiencing nutritional deficiencies, and may be in environments in which disease or other adverse conditions affect their metabolic states. An important question is, “Are these inadequately nourished (sub)populations at special or different risk when exposed to high intakes of a nutrient substance?” The Group readily acknowledged that there are many successful nutrition intervention and supplementation programs that have benefited inade-quately nourished (sub)populations substantially. However, the Group’s interest here was to achieve a better understanding of the factors that should enter into the decision-making for assessing nutrient risk within such (sub)populations. The interest is grounded in, but distinct from, the study of the effects of xenobiotic metabolism and pharmacokinetics in undernourished individuals.
Initially, the Group discussed the meaning of the term ‘inadequately nourished’ and con-cluded that it is characterized primarily by undernutrition. Depending on the type, undernutrition that persists may result in single nutrient deficiencies or multiple nutrient deficiencies. Group members recognized that the broader term ‘malnourished,’ which encompasses both overnutrition and under-nutrition, also has meaning for the application of the nutrient risk assessment model. In overnutrition, interactions between nutrients become important if they enhance or impair physiological mechanisms such as absorption. However, undernutrition (inadequate nourishment) remained the focus of the Group’s discussion regarding ‘inadequately nourished.’ In addition, the Group recognized that inade-quate nutriture usually is associated with living in adverse circumstances—including environments prone to high prevalence of infectious disease. For this reason, the Group also briefly addressed the question of the impact of infectious disease on nutrient risk assessment.
Overall, the Group acknowledged that the major concern was insufficient scientific knowl-edge to allow the study of the impact of these conditions on nutrient risk assessment. It was agreed that the general process established for setting a UL was appropriate regardless of nutriture. In order to provide appropriate ULs for the inadequately nourished, however, the process is dependent upon better scientific information about the metabolic states of these (sub)populations.
N

A Model for Establishing Upper Levels of Intake for Nutrients and Related Substances
88
9.2 Homeostatic considerations The literature contains a number of studies documenting important metabolic changes associated with inadequate nutriture that have relevance for nutrient risk assessment. In short, homeostatic mech-anisms that help protect against nutrient deficiency may be overwhelmed among inadequately nourished (sub)populations. Indications of the limits of homeostatic mechanisms range from depleted plasma pools of nutrient transport proteins during protein-energy deficiencies (Morlese et al., 1997) to reduced liver function (Elia and Lunn, 1997). Given earlier discussions concerning the role of homeo-static mechanisms in nutrient risk assessment (see Section 3.3), the metabolic impact of inadequate nutriture can affect a range of outcomes including, for example, intake–response determinations and uncertainty factors.
Clinical reports regarding the results of high levels of intake of nutrient substances under conditions of undernutrition are limited—with the exception of the concern about the presence of free iron resulting from reduced transport protein production under conditions of protein-energy mal-nutrition (Dempster et al., 1995; Golden, 1985).
The Group noted the serious limitations in much of the available scientific literature and high-lighted the need for further research. Not only are studies lacking that are relevant to nutrient risk assessment for inadequately nourished (sub)populations, there are few data to characterize the changes in metabolic states associated with undernutrition. The study conducted by Dunipace et al. (1998) was noted as an example of a valuable type of study for this area of nutrient risk assessment. Using inadequately nourished rats, the authors studied the effect of different fluoride doses in animals that were protein-energy deficient or calcium deficient, or both.
Most of the small body of existing literature has focused on single nutrient deficiencies and their impact on metabolism. Considerably less is known about multiple nutrient deficiencies, despite their being more common than single deficiencies on a worldwide basis. The early work of Grande et al. (1958) suggests that individuals without enough food slow down metabolically. Slowed metabo-lism is reflected by changes in various physiologic functions (e.g. reduced activity of the kidney). If slowing of physiologic functions interferes with homeostatic mechanisms that are normally protec-tive, such a result might impair the body’s ability to adjust to high habitual or acute intakes of a nutrient substance. Moreover, little is known about how differences in age affect the body’s ability to adjust to conditions of inadequate nutriture—for example, the metabolic differences that may occur in children and the elderly as compared to young adults when subject to undernutrition.
The following topics were discussed by the Group: • Protein deficiency requires special consideration regarding the determination of a UL. Vita-
min A provides an example of a nutrient affected by protein deficiency. Decreased formation of both transport and binding protein may impair the normal mechanism for handling large intakes of vitamin A. Thus, free retinol/retinoic acid could enter the circulation. As a result, a UL specified for a well-nourished (sub)population could be too high for an undernourished (sub)population.
• Decreased ability to absorb a nutrient substance may affect the risk posed by certain intakes of the nutrient. With conditions of undernutrition and/or chronic infection, iron absorption may decrease. Average or upper levels of iron intake may exert adverse health effects, including infection, because more iron will remain unabsorbed in the gut. In turn, infection decreases iron absorption. Information such as this is important for nutrient risk assessment relative to the inadequately nourished.
• Certain inadequately nourished (sub)populations ingest large amounts of phytates from the diet. Phytates may interfere with the absorption of certain minerals. Establishing ULs for those minerals may require that phytate intake be considered when the concern is inade-quately nourished (sub)populations.

9. Applicability of the model to inadequately nourished (sub)populations
89
9.3 Establishing upper levels for inadequately nourished (sub)populations The Group considered the potential differences between a UL established for an adequately nourished (sub)population as compared to a UL for an inadequately nourished (sub)population. The differences are not necessarily consistent. At times the value of the UL may need to be lower and at times it may need to be higher for undernourished (sub)populations than for adequately nourished (sub)popu-lations. A study by Majumdar et al. (2003) suggests that a UL for iron for iron-depleted children may be higher than the UL for iron-replete children. This study, conducted in India, demonstrated adverse effects from iron therapy in subjects who were iron-replete as compared to iron-depleted children. The converse may be the case for persons with infectious disease conditions such as malaria or human immunodeficiency virus (HIV) (see below); such persons may require ULs that are lower.
The Group came to the conclusion that the appropriateness of a UL established for adequately nourished (sub)populations cannot be assumed to transfer to inadequately nourished (sub)populations. Although the basic process of nutrient risk assessment decision-making would remain the same regardless of the nutritional status of the (sub)population of interest, the Group considered it likely that inadequately nourished (sub)populations would need a different set of ULs because of important differences in metabolism and the vulnerability that can result from these differences. However, the Group also concluded that too little is known about the effects of inadequate nutrition on the absorp-tion, distribution, metabolism, and elimination of nutrient substances to allow specification of consid-erations relevant to adjusting ULs to make them appropriate for inadequately nourished (sub)pop-ulations.
9.4 Impact of infectious disease Emerging data suggest that high intake of at least one nutrient may exacerbate infectious responses. Although this topic was outside the scope of the Workshop, it provides an example of the multi-faceted issues that face nutrient risk managers. Iron deficiency is widespread, and many countries have national policies that address the problem. In some cases, programs have been implemented to improve the iron status of pregnant women and young children. While the benefits of such programs are well established, there is a body of evidence to suggest that among children with malaria and/or undernutrition, supplementation with oral iron may be associated with some risk of increased severity of infectious diseases (Oppenheimer, 2001). In short, there appears to be a complex set of interactions of iron deficiency and iron supplementation with infectious susceptibility.
The Group was aware of recent reports that at the time of the Workshop were in press (Sazawal et al., 2006; Tielsch et al., 2006) concerning nutrient supplementation programs. In partic-ular, these investigators compared the impact of iron and zinc supplementation on morbidity and mortality in young children in certain areas where malarial transmission is intense and occurs year-round, and in other areas where exposure to malaria is low. The evaluation indicated that the supple-mentation was effective for its purposes. However, information from the trial in the malarious area also revealed the possibility of an adverse impact of iron supplementation. Specifically, both hospital-ization for severe illness and mortality were increased for the subjects who received iron supple-mentation when compared to those who received placebo. Oppenheimer (2002), using a pre-existing database of 11 controlled studies of iron intervention (therapeutic doses), found increased risk for clinical malaria with oral iron supplementation (> 2 mg/kg/day) in malarious regions at times of malaria transmission. Oral iron supplementation was not shown to cause an increased risk for infec-tion in nonmalarious counties.
The Group noted the caveats associated with such findings including the need for further doc-umentation. They also noted that the outcomes were not related to fortification or foods that are naturally rich in iron, but only to supplements containing iron. However, these observations under-score the need both to examine other venues in which iron supplementation may impact infectious disorders (e.g. HIV or tuberculosis) and to foster a sensitivity for the factors that should be taken into

A Model for Establishing Upper Levels of Intake for Nutrients and Related Substances
90
account when supplementation occurs in certain (sub)populations. Clearly, more data are needed to address this important topic more fully.
9.5 Summary The Group determined that ULs set for adequately nourished (sub)populations may not be appropriate to use for inadequately nourished (sub)populations that are comparable in age/sex/lifestage. Because of a lack of suitable data, the Group could not clarify the nature of the metabolic differences that would impact the nutrient risk assessment and in turn the values of the ULs, but recognized that in some cases they may be considerable. As these issues are addressed in the future, the risk assessment process—and notably the risk characterization—must provide clear documentation of the factors considered and the uncertainties encountered.

91
10 Identified research/data gaps, needed discussions,
and next steps
utrient risk assessment relies on the available data to develop upper levels of intake (ULs) and characterize risk. These outcomes would be enhanced if more relevant data were available. Moreover, nutrient risk assessment could be carried out more readily, as well as harmonized
more easily, if work is undertaken to specify internationally applicable guidelines for the analysis, interpretation, and presentation of data.
The Workshop participants identified a number of data gaps and areas of need that require future consideration. They caution, however, that their listing is not comprehensive. The identified gaps and needs are organized under general topic areas discussed during the Workshop.
10.1 Nutrient hazard identification and characterization The Group determined that the needs for this topic area encompassed research to elucidate nutrient substance metabolism and to identify/describe adverse health effects. Methodologies and guidelines for data evaluation and for addressing uncertainties also require attention. 10.1.1 General metabolism of nutrient substances The critical need to clarify homeostatic mechanisms and obtain more information about nutrient substance metabolism was a major concern. The Group acknowledged that a certain amount of research relevant to nutrient metabolism is currently being conducted but that the outcomes often go unpublished or are not included in study reports. The Group encourages researchers to make these results available.
The following needs were specified:
• conduct of studies especially designed to characterize the metabolism of nutrients and related substances, and release of all relevant data including those reflective of ‘no effect’;
• investigation of the effects on metabolism when subjects switch from ‘normal’ to ‘high’ intakes of a nutrient substance, or vice versa;
• exploration of the use of biomarkers of adaptation to high intake so as to enhance under-standing and utility of metabolic studies; identify such biomarkers through use of the new and emerging ‘nomics’ techniques;
• specification of nutrient–nutrient interactions and of interactions of nutrient substances with non-nutrient substances;
• clarification of the nature of the bioavailability of nutrient substances found in ‘normal’ diets versus bioavailability associated with isolated pure substances;
• determination of bioavailability equivalence among chemical forms of the same nutrient substance;
• development of study designs and animal/in-vitro models to study nutrient substance metab-olism when needed research cannot be conducted in humans;
• identification of approaches for comparing sensitivity between animals and humans.
N

A Model for Establishing Upper Levels of Intake for Nutrients and Related Substances
92
The Group discussions concerning (sub)populations that could not be considered to be ade-quately nourished or ‘generally healthy’ concluded that there were insufficient data about metabolic mechanisms under these conditions. Therefore, there are urgent needs to:
• study the impact of inadequate nutriture on the absorption, metabolism, and elimination of
nutrient substances ingested in relatively large amounts; • clarify the nature of interactions among infectious disease, chronic inadequate nutriture, and
the ingestion of relatively large amounts of a nutrient substance. 10.1.2 Nature of adverse health effects, including biomarkers of effect The Group noted the paucity of clinical data concerning the risk associated with nutrient substances at high levels of intake. While they acknowledged clinical trials in humans could provide valuable infor-mation, they recognized the difficulties that are due to resource limitations, confounding in study protocols, and—most probably—ethical concerns. In short, creative methodologies are needed to address the data gap. For this reason, the Group specified the following need:
• develop methodologies for identifying and studying adverse health effects for nutrient sub-stances that use animals, in-vitro techniques, computer simulations, and/or other combined or innovative strategies to increase the understanding of the adverse health effects associated with high levels of intake in humans.
Also, the Group’s discussion focused on the need for research to:
• clarify the homeostatic range for measures of nutrient substances in the human system in
order to increase the availability of biomarkers of effect; • identify, validate, and elucidate mechanisms of action for causally associated biomarkers of
clinically evident adverse health effects; • specify the length of time required for specific adverse health effects, including the time-
course for changes in biomarkers of effect; • develop approaches to better describe the relationship between the distribution of intake and
the sensitivity of the biomarker or adverse health effect for the purposes of hazard charac-terization.
Further, the Group noted that compilation of adverse health effects associated with high levels
of nutrient substance intake—sometimes called indexing of endpoints—needs further attention. The lack of an organized effort to catalogue adverse health effects hampers efforts to conduct and har-monize the nutrient risk assessment process.
Therefore, the group identified a need to:
• create a specific international database, or expand and combine existing databases, to cata-logue agreed-upon adverse health effects associated with nutrient substances. If possible, it would be helpful to include a prioritized listing of nutrient substances for which risk assess-ment is especially needed as well as a listing of needed research efforts to improve the nutrient risk assessment of each substance.
10.1.3 Data evaluation and uncertainties The Group emphasized that work should be undertaken to articulate guidelines relative to the selection and interpretation of available data. Topics to be addressed include:

10. Identified research/data gaps, needed discussions, and next steps
93
• specification of inclusion/exclusion criteria for and weighting of individual studies, particu-larly for observational data;
• identification of strategies and guiding principles for the use of meta-analysis to appropriately combine available data to enhance, for example, the estimation of intake–response;
• exploration of ways to adapt the current practice of evidence-based systematic review to make it more relevant to nutrient risk assessment.
It was acknowledged that increased attention should be given to increasing the database
needed to establish a BI. In the absence of full biological understanding, the Group indicated that attention should be directed to uncertainties and the adjustments made for uncertainties. The relevant research and discussions would cover a range of topics including adequacy of the database, nature of the toxicity, extrapolation from LOAEL to NOAEL, interspecies extrapolation, scaling ULs for unstudied subpopulations, and ways to address interindividual variability in humans. Overall, there is a need to develop valid criteria to determine the magnitude of uncertainty factors in different situations. The Group highlighted the following gaps:
• identification and validation of methods to extrapolate evidence obtained from animals, in-
vitro systems, or related subpopulations to a subpopulation of interest for which data are lacking;
• exploration of the kinetics and dynamics of nutrient substances so as to enable the enhanced use of quantitative adjustment for uncertainties;
• exploration of kinetics and dynamics specific for a nutrient substance to enable the scaling or estimation of intake–response;
• identification and validation of physiologically appropriate methods for adjusting a UL established for a studied subpopulation (e.g. adults) to a UL for an unstudied subpopulation, such as children.
10.2 Dietary intake assessment Research and related activities are needed to enhance methodologies that are applicable worldwide for the purposes of estimating dietary intake. Dietary intake assessment would benefit if the following were addressed:
• in general, improve and validate the methods for obtaining data on nutrient substance intake with the accompanying goal of simplifying and reducing the need for statistical corrections;
• enhance and develop relevant statistical approaches for estimating habitual intake, including an approach for estimating the ‘joint habitual intake distribution’ (to estimate the proportion of individuals in a group whose habitual intakes of two or more nutrients exceed the ULs);
• determine the most accurate options for using mean per-capita intake data to estimate upper percentiles of habitual intake distributions;
• develop and validate dietary assessment tools to improve their utility under regional/local conditions;
• continue to develop, enhance, and update food composition databases generally; and work more actively to include data on fortified foods, supplements, formulated foods, ‘functional foods,’ and bioactive constituents and related substances (e.g. lignins, flavonoids, phyto-sterols, and polyphenols);
• continue to develop composition databases for regional conditions.
In addition, estimation of nutrient substance intake would be greatly improved if biological measures could accompany and perhaps partially replace the use of current measures of intake such as
A Model for Establishing Upper Levels of Intake for Nutrients and Related Substances
94
self-report. Biological measures also could be useful in the absence of reports on intake. To this end, it would be advantageous to:
• identify and validate biomarkers of nutrient substance intake as well as biomarkers of
nutritional status.
10.3 Risk characterization Risk characterization is an important interface between the risk assessor and the risk manager. Further discussions are needed to define and clarify this interface. Needs include:
• identification of key elements of the problem formulation process in order to better specify the needs and expectations of the risk manager;
• investigation of the value of strategic tiering for in-depth review of data obtained from earlier steps of the risk assessment. For example,
- if the quantitative difference between the UL and the estimated current intake level is small, should the risk characterization ensure that intake data are examined for systemic biases that could result in under- or overreporting and for a need to weigh the different methods used in collection of intake data?
- if the quantitative difference between UL and the estimated current intake level is large, should it be determined that intake data do not require further elaboration?
- if intake assessment indicates (sub)population intakes are greater than the UL, should there be investigation of products that may be contributing to the high intake?
• clarification of the types of information that would be most useful to risk managers, such as (i) uncertainties in dietary intake assessments, (ii) individuals at increased risk, (iii) high habitual intakes of more than one nutrient substance concurrently, and (iv) different duration and patterns of nutrient substance intake;
• clarification and/or guidance on the nature of interpretative risk assessment statements that address the information needs of risk managers but allow for an appropriate separation between assessment and management;
• specific studies of risk characterization outcomes to identify (i) what information was used, how it was used, and results; (ii) what aspects of the characterization were not helpful or led to confusion, and (iii) what aspects led to secondary risk assessment requests.
10.4 Applicability of the model The Group concluded that the model may not be relied upon to readily address nutrient substances that do not demonstrate a threshold level for an adverse health effect or nutrient substances for which the levels of intake associated with risk appear to overlap with levels associated with essentiality or the demonstrated favourable impact on health. Therefore, research and future consideration should be directed to exploring ways in which these types of nutrient substances can be addressed. Specific needs include approaches to:
• clarify relevant methodologies for nutrient substances intrinsic in the food supply for which there is no identifiable level of consumption that can be considered to present no risk;
• provide guidelines for the conduct of nutrient risk assessment when the evidence for a particular substance suggests that the recommended intakes related to essentiality or the demonstrated favourable impact on health overlap those associated with increased risk.
10. Identified research/data gaps, needed discussions, and next steps
95
10.5 Next steps The model developed during the workshop provides an international science-based approach for nutrient risk assessment. It can be applied on a case-by-case basis to many nutrient substances. The next step—to develop ULs, as requested of FAO/WHO by the Codex Alimentarius Commission—will require considerable resources, scientific expertise, and technical support. It may be of interest to conduct targeted activities to enhance and refine the use of the model. These can be accomplished in several ways, including small case studies to explore aspects of nutrient risk assessment for certain representative nutrient substances. These studies and associated discussions could be carried out by involving a range of scientists and stakeholders, including representatives from industry, non-govern-ment organizations, and professional associations.
Additionally, the harmonization of nutrient risk assessment would benefit from efforts to put in place ad-hoc task forces among interested international parties. The goal would be to identify opportunities for coordination and further discussions.
96
11 References
Arab L et al. (2003). Ethnic differences in the nutrient intake adequacy of premenopausal US women:
results from the Third National Health Examination Survey. Journal of the American Dietetic Association, 103:1008-1014.
Bingham SA (1987). The dietary assessment of individuals: methods, accuracy, new techniques and recommendations. Nutrition Abstracts and Reviews (Series A), 57:705-742.
Biro G et al. (2002). Selection of methodology to assess food intake. European Journal of Clinical Nutrition, 56(Suppl 2):S25-S32.
Black AE, Cole TJ (2001). Biased over- or under-reporting is characteristic of individuals whether over time or by different assessment methods. Journal of the American Dietetic Association, 101:70-80.
Calabrese EJ, Gilbert CE (1993). Lack of total independence of uncertainty factors (UFs): implications for the size of the total uncertainty factor. Regulatory Toxicology and Pharmacology, 17:44-51.
Cameron ME, van Staveren WA (1988). Manual on methodology of food consumption studies. New York, Oxford University Press.
Carriquiry AL (2003). Estimation of usual intake distributions of nutrients and foods. Journal of Nutrition, 133:601S-608S.
Codex Alimentarius Commission (2004). Procedural manual, 13th ed. Rome, Food and Agriculture Organization of the United Nations, World Health Organization.
Cooper H, Hedges LV (1994). The handbook of research synthesis. New York, Russell Sage Foundation.
Counsell C (1997). Formulating questions and locating primary studies for inclusion in systematic reviews. Annals of Internal Medicine, 127:380-387.
de Zegher F et al. (1985). Successful treatment of infantile type I primary hyperoxaluria complicated by pyridoxine toxicity. Lancet, 2:392-393.
Dehne LI et al. (1999). The German Food Code and Nutrient Data Base (BLS II.2). European Journal of Epidemiology, 15:355-359.
Dempster WS et al. (1995). Misplaced iron in kwashiorkor. European Journal of Clinical Nutrition, 49:208-210.
Devaney B et al. (2004). Nutrient intakes of infants and toddlers. Journal of the American Dietetic Association, 104(1 Suppl 1):s14-s21.
Dorland WA (2003). Dorland’s illustrated medical dictionary, 30th ed. Philadelphia, Saunders. Dourson ML, Felter SP, Robinson D (1996). Evolution of science-based uncertainty factors in
noncancer risk assessment. Regulatory Toxicology and Pharmacology, 24:108-120. Dowler EA, Ok Seo Y (1985). Assessment of energy intake: estimates of food supply v measurement
of food consumption. Food Policy, 10:278-288. Dunipace AJ et al. (1998). Chronic fluoride exposure does not cause detrimental, extraskeletal effects
in nutritionally deficient rats. Journal of Nutrition, 128:1392-1400. Dwyer JT (1994). Dietary assessment. In: Shils ME, Olson JA, Shike M, eds. Modern nutrition in
health and disease, 8th ed. Philadelphia, Lea & Febiger. Pp. 842-860. Elia M, Lunn PG (1997). Biological markers of protein-energy malnutrition. Clinical Nutrition,
16(Suppl 1):11-17.

11. References
97
EC (European Commission) (2003). Tolerable upper intake levels for vitamins and minerals (updated in April 2003). European Commission (http://europa.eu.int/comm/food/fs/sc/scf/out80_en.html, accessed 1 May 2005).
EC/SCF (European Commission/Scientific Committee on Food) (2000a). Guidelines of the Scientific Committee on Food for the development of tolerable upper intake levels for vitamins and minerals (SCF/CS/NUT/UPPLEV/11 Final) (http://europa.eu.int/comm/food/fs/sc/scf/out80a_en.pdf, accessed 1 May 2005).
EC/SCF (2000b). Opinion of the Scientific Committee on Food on the tolerable upper intake level of selenium (SCF/CS/NUT/UPPLEV/25 Final) (http://europa.eu.int/comm/food/fs/sc/scf/out80g_en.pdf, accessed 1 May 2005).
EC/SCF (2002). Opinion of the Scientific Committee on Food on the tolerable upper intake level of preformed vitamin A (retinol and retinyl esters) (SCF/CS/NUT/UPPLEV/24 Final) (http://europa.eu.int/comm/food/fs/sc/scf/out145_en.pdf, accessed 1 May 2005).
EFSA (European Food Safety Authority) (2004). Opinion of the Scientific Panel on Dietetic Products, Nutrition and Allergies on a request from the Commission Related to the Tolerable Upper Intake Level of Iron. The EFSA Journal, 125:1-34.
EVM (Expert Group on Vitamins and Minerals) (2003). Safe upper levels for vitamins and minerals. London, Food Standards Agency Publications (http://www.food.gov.uk/multimedia/pdfs/vitmin2003.pdf, accessed 1 May 2005).
FAOSTAT (FAO Statistical Databases) (2005). Food balance sheets [online database]. Food and Agriculture Organization of the United Nations (http://faostat.fao.org/).
FAO/WHO (Food and Agriculture Organization of the United Nations/World Health Organization) 2005. Context Paper (prepared by WHO staff, in cooperation with FAO staff). Charges and Questions. FAO/WHO Nutrient Risk Assessment Workshop: A Model for Establishing Upper Levels of Intake for Nutrients and Related Substances, 2-6 May 2005, WHO Headquarters, Geneva (http://www.who.int/ipcs/highlights/nutrientproject_may18/en/, accessed 1 May 2005).
Ferro-Luzzi A (2003). Individual food intake survey methods. In: Proceedings of the International Scientific Symposium on Measurement and Assessment of Food Deprivation and Undernutrition. Rome, Food and Agriculture Organization of the United Nations.
Geleijnse JM, Kok FJ, Grobbee DE (2003). Blood pressure response to changes in sodium and potas-sium intake: a metaregression analysis of randomised trials. Journal of Human Hypertension, 17:471-480.
GEMS/Food (Global Environment Monitoring System – Food Contamination Monitoring and Assess-ment Programme) (2005). Regional diets. Geneva, World Health Organization (http://www.who.int/foodsafety/chem/gems/en/index1.html, accessed 1 May 2005).
Gibson RS (2005). Principles of nutritional assessment, 2nd ed. New York, Oxford University Press. Gibson RS, Ferguson EL (1999). An interactive 24-hour recall for assessing the adequacy of iron and
zinc intakes in developing countries. Washington, DC, ILSI Press (http://hni.ilsi.org/NR/rdonlyres/7DFFBD5B-FFA7-45ED-88E0-57C3FDB05ACB/0/Recall.pdf, accessed 1 May 2005).
Golden MHN (1985). The consequences of protein deficiency in man and its relationship to the features of kwashiorkor. In: Blaxter KL, Waterlow JC, eds. Nutritional adaptation in man. London, John Libbey. Pp. 169-187.
Goris AH, Westerterp KR (1999). Underreporting of habitual food intake is explained by undereating in highly motivated lean women. Journal of Nutrition, 129:878-882.
Goris AH, Westerterp-Plantenga MS, Westerterp KR (2000). Undereating and underrecording of habitual food intake in obese men: selective underreporting of fat intake. American Journal of Clinical Nutrition, 71:130-134.
Grande F, Anderson JT, Keys A (1958). Changes of basal metabolic rate in man in semistarvation and refeeding. Journal of Applied Physiology, 12:230-238.
Greenfield H, Southgate DAT (2003). Food composition data. Production, management and use, 2nd ed. Rome, Food and Agriculture Organization of the United Nations

A Model for Establishing Upper Levels of Intake for Nutrients and Related Substances
98
(ftp://ftp.fao.org/docrep/fao/008/y4705e/y4705e00.pdf and ftp://ftp.fao.org/docrep/fao/008/y4705e/y4705e01.pdf, accessed 1 May 2005).
Harrison GG et al. (2000). Underreporting of food intake by dietary recall is not universal: a comparison of data from Egyptian and American women. Journal of Nutrition, 130:2049-2054.
Hoffmann K et al. (2002). Estimating the distribution of usual dietary intake by short-term measure-ments. European Journal of Clinical Nutrition, 56(Suppl 2):S53-S62.
Holden JM et al. (1999). Carotenoid content of U.S. foods: an update of the database. Journal of Food Composition and Analysis, 12:169-196.
IFCS (Intergovernmental Forum on Chemical Safety) (1994). Resolution on priorities for action in implementing environmentally sound management of chemicals (IPCS/IFCS/94.8Res.2). Interna-tional Conference on Chemical Safety - Forum I (http://www.who.int/ifcs/documents/forums/forum1/en/FI-res2_en.pdf, accessed, 1 May 2005).
IOM (Institute of Medicine) (1997). Dietary Reference Intakes for calcium, phosphorus, magnesium, vitamin D, and fluoride. Washington, DC, National Academy Press.
IOM (1998a). Dietary Reference Intakes: a risk assessment model for establishing upper intake levels for nutrients. Washington, DC, National Academy Press.
IOM (1998b). Dietary Reference Intakes for thiamin, riboflavin, niacin, vitamin B6, folate, vitamin B12, pantothenic acid, biotin, and choline. Washington, DC, National Academy Press.
IOM (2000). Dietary Reference Intakes for vitamin C, vitamin E, selenium, and carotenoids. Washington, DC, National Academy Press.
IOM (2001). Dietary Reference Intakes for vitamin A, vitamin K, arsenic, boron, chromium, copper, iodine, iron, manganese, molybdenum, nickel, silicon, vanadium, and zinc. Washington, DC, National Academy Press.
IOM (2002-2005). Dietary Reference Intakes for energy, carbohydrate, fiber, fat, fatty acids, cholesterol, protein, and amino acids. Washington, DC, The National Academies Press.
IOM (2003). Dietary Reference Intakes: applications in dietary planning. Washington, DC, The National Academies Press.
IOM (2005). WIC food packages: time for a change. Washington, DC, The National Academies Press.
IPCS (International Programme on Chemical Safety) (1987). Principles for the safety assessment of food additives and contaminants in food. Environmental Health Criteria 70. Geneva, World Health Organization (http://www.inchem.org/documents/ehc/ehc/ehc70.htm, accessed 1 May 2005).
IPCS (1993). Biomarkers and risk assessment: concepts and principles. Environmental Health Criteria 155. Geneva, World Health Organization (http://www.inchem.org/documents/ehc/ehc/ehc155.htm, accessed 1 May 2005).
IPCS (1994). Assessing human health risks of chemicals: derivation of guidance values for health-based exposure limits. Environmental Health Criteria 170. Geneva, World Health Organization (http://www.inchem.org/documents/ehc/ehc/ehc170.htm, accessed 1 May 2005).
IPCS (2001). Biomarkers in risk assessment: validity and validation. Environmental Health Criteria 222. Geneva, World Health Organization (http://www.inchem.org/documents/ehc/ehc/ehc222.htm, accessed 1 May 2005).
IPCS (2002). Principles and methods for the assessment of risk from essential trace elements. Environmental Health Criteria 228. Geneva, World Health Organization (http://www.inchem.org/documents/ehc/ehc/ehc228.htm, accessed 1 May 2005).
IPCS (2004a). Exposure assessment and risk assessment terminology. Geneva, World Health Organization (http://www.who.int/ipcs/methods/harmonization/areas/terminology/en/, accessed 1 May 2005).
IPCS (2004b). Principles for modeling dose-response for the risk assessment of chemicals. Draft document. Geneva, World Health Organization (http://www.who.int/ipcs/methods/harmonization/dose_response/en/, accessed 1 May 2005).

11. References
99
Ireland J et al. (2002). Selection of a food classification system and a food composition database for future food consumption surveys. European Journal of Clinical Nutrition, 56(Suppl 2):S33-S45.
IUPAC (2005). IUPAC Compendium of Chemical Terminology. The Royal Society of Chemistry (http://www.chemsoc.org/chembytes/goldbook/, accessed 1 May 2005).
Johansson L et al. (1998). Under- and overreporting of energy intake related to weight status and lifestyle in a nationwide sample. American Journal of Clinical Nutrition, 68:266-274.
Juni P et al. (1999). The hazards of scoring the quality of clinical trials for meta-analysis. Journal of the American Medical Association, 282:1054-1060.
Kipnis V et al. (2003). Structure of dietary measurement error: results of the OPEN biomarker study. American Journal of Epidemiology, 158:14-21.
Laird NM, Mosteller F (1990). Some statistical methods for combining experimental results. Inter-national Journal of Technology Assessment in Health Care, 6:5-30.
Lau J, Ioannidis JP, Schmid CH (1997). Quantitative synthesis in systematic reviews. Annals of Internal Medicine, 127:820-826.
Lau J, Ioannidis JP, Schmid CH (1998). Summing up evidence: one answer is not always enough. Lancet, 351:123-127.
Leclercq C, Valsta LM, Turrini A (2001). Food composition issues—implications for the development of food-based dietary guidelines. Public Health Nutrition, 4:677-682.
Lee RD, Nieman DC (2003). Nutritional assessment, 3rd ed. Boston, McGraw-Hill. Lewis CJ et al. (1999). Estimated folate intakes: data updated to reflect food fortification, increased
bioavailability, and dietary supplement use. American Journal of Clinical Nutrition, 70:198-207. Majumdar I et al. (2003). The effect of iron therapy on the growth of iron-replete and iron-deplete
children. Journal of Tropical Pediatrics, 49:84-88. Medlin C, Skinner JD (1988). Individual dietary intake methodology: a 50-year review of progress.
Journal of the American Dietetic Association, 88:1250-1257. Morlese JF et al. (1997). Transferrin kinetics are altered in children with severe protein-energy
malnutrition. Journal of Nutrition, 127:1469-1474. NCHS (National Center for Health Statistics) (2005). National Health and Nutrition Examination
Survey. Hyattsville, MD, National Center for Health Statistics, Centers for Disease Control and Prevention (http://www.cdc.gov/nchs/nhanes.htm, accessed 1 May 2005).
NRC (National Research Council) (1983). Risk assessment in the federal government: managing the process. Washington, DC, National Academy Press.
NRC (1986). Nutrient adequacy. Assessment using food consumption surveys. Washington, DC, National Academy Press.
NRC (1994). Science and judgement in risk assessment. Washington, DC, National Academy Press. Nusser SM et al. (1996). A semiparametric transformation approach to estimating usual daily intake
distributions. Journal of the American Statistical Association, 91:1440-1449. OECD (Organisation for Economic Co-operation and Development) (1998). Test Guideline 408.
Repeated dose 90-day oral toxicity study in rodents. In: OECD Guidelines for the Testing of Chemicals. Paris, OECD.
OECD (2000). OECD Guidelines for the Testing of Chemicals. Eleventh Addendum. Paris, OECD. Oppenheimer SJ (2001). Iron and its relation to immunity and infectious disease. Journal of Nutrition,
131:616S-635S. Oppenheimer SJ (2002). Iron and infectious disease: a public health problem? In: Black RE, Fleischer
Michaelsen K, eds. Public health issues in infant and child nutrition. Philadelphia, Lippincott Williams & Wilkins.
Rader JI, Weaver CM, Angyal G (2000). Total folate in enriched cereal-grain products in the United States following fortification. Food Chemistry, 70:275-289.
Rand WM et al. (1991). Compiling data for food composition data bases. Tokyo, United Nations University Press.
Renwick AG et al. (2003). Risk characterisation of chemicals in food and diet. Food and Chemical Toxicology, 41:1211-1271.

A Model for Establishing Upper Levels of Intake for Nutrients and Related Substances
100
Renwick AG et al. (2004). Risk-benefit analysis of micronutrients. Food and Chemical Toxicology, 42:1903-1922.
Sazawal S et al. (2006). Effect of routine prophylactic supplementation with iron and folic acid on admission to hospital and mortality in preschool children in a high malaria transmission setting: a community-based randomized, placebo-controlled trial. Lancet, 367:133-143.
Schakel SF, Buzzard IM, Gebhardt SE (1997). Procedures for estimating nutrient values for food composition databases. Journal of Food Composition and Analysis, 10:102-114.
Schaumburg H et al. (1983). Sensory neuropathy from pyridoxine abuse. A new megavitamin syndrome. New England Journal of Medicine, 309:445-448.
Siong TE et al. (1997). Nutrient composition of Malaysian foods, 4th ed. Kuala-Lumpur, Institute of Medical Research.
SSC (Scientific Steering Committee) (2000). First report on the harmonisation of risk assessment procedures, Part 1 and 2. Working Group on Harmonisation of Risk Assessment Procedures in the scientific committees advising the European Commission in the area of human and environmental health, 26-27 October 2000 (http://europa.eu.int/comm/food/fs/sc/ssc/out82_en.html, accessed 1 May 2005).
Stroup DF et al. (2000). Meta-analysis of observational studies in epidemiology: a proposal for reporting. Journal of the American Medical Association, 283:2008-2012.
Subar AF et al. (2003). Using intake biomarkers to evaluate the extent of dietary misreporting in a large sample of adults: the OPEN study. American Journal of Epidemiology, 158:1-13.
Tielsch JM et al. (2006). Effect of routine prophylactic supplementation with iron and folic acid on preschool child mortality in Southern Nepal: community-based, cluster-randomised, placebo-controlled trial. Lancet, 367:144-152.
van den Brandt P et al. (2002). The contribution of epidemiology. Food and Chemical Toxicology, 40:387-424.
van Staveren W, Ocké M (2001). Estimating dietary intakes. In: Bowman BA, Russell RM, eds. Present knowledge in nutrition, 8th ed. Washington, DC, ILSI Press.
West S et al. (2002). Systems to rate the strength of scientific evidence. Evidence Report/Technology Assessment No. 47. Rockville, MD, Agency for Healthcare Research and Quality (AHRQ Publication No. 02-E016) (http://www.ncbi.nlm.nih.gov/books/bv.fcgi?call=bv.View..ShowSection&rid=hstat1.chapter.70996, accessed 1 May 2005).
WHO (World Health Organization) (1997). Report of the Joint FAO/WHO Consultation on Food Consumption and Exposure Assessment to Chemicals in Food. Geneva, Switzerland, 10-14 February 1997 (http://www.who.int/foodsafety/publications/chem/exposure_feb1997/en/index.html, accessed 1 May 2005).

101
ANNEX 1 List of Workshop participants
Dr Peter AGGETT, University of Central Lancashire, Preston, United Kingdom Dr Alicia CARRIQUIRY, Iowa State University, Ames, Iowa, USA Dr Namsoo CHANG, Ewha Womans University, Seoul, Republic of Korea Dr Margaret CHENEY, Ottawa, Ontario, Canada Dr Silvia COZZOLINO, Universidade de São Paulo, São Paulo, Brazil Dr Omar DARY, Guatemala (Arlington, Virginia, USA) Dr Cutberto GARZA, Cornell University, New York, USA Mrs Katharine GOURLIE, Ottawa, Ontario, Canada Dr Barry HALLIWELL, National University of Singapore, Singapore Dr Lena HULTHEN, Göteborg University, Göteborg, Sweden Dr Anna LARTEY, University of Ghana, Legon, Ghana Dr Joseph LAU, Tufts - New England Medical Center, Boston, Massachusetts, USA Dr Jean-Charles LEBLANC, National Institute of Agronomical Research, French Food Safety Agency, Paris, France Dr Hildegard PRZYREMBEL, Federal Institute for Risk Assessment, Berlin, Germany Dr Andrew RENWICK, University of Southampton, Southampton, United Kingdom Dr Omid SABZEVARI, Tehran University of Medical Sciences, Tehran, Islamic Republic of Iran Dr Bhattiprolu SIVAKUMAR, National Institute of Nutrition, Hyderabad, India Dr Songsak SRIANUJATA, Mahidol University, Nakhonpathom, Thailand Secretariat Dr Barbara BURLINGAME, FAO Adviser, Food and Agriculture Organization of the United Nations, Rome, Italy Dr Bruno DE BENOIST, Nutrition and Health Development, World Health Organization, Geneva, Switzerland Dr Prakash SHETTY, Food and Agriculture Organization of the United Nations, Rome, Italy Dr Christine TAYLOR, Project Director, International Programme on Chemical Safety, World Health Organization, Geneva, Switzerland Dr Angelika TRITSCHER, WHO Adviser, International Programme on Chemical Safety, World Health Organization, Geneva, Switzerland Temporary Advisers to the Secretariat Dr Jeronimas MASKELIUNAS, Codex Secretariat, Food and Agriculture Organization of the United Nations, Rome, Italy Dr Carol SUITOR, Technical Editor, Northfield, Vermont, USA
102
ANNEX 2 Discussion Paper 1:
An Evidence-based Approach to Nutrient Hazard Identification
Prepared for the FAO/WHO Nutrient Risk Assessment Workshop 2-6 May 2005, WHO Headquarters, Geneva
Joseph Lau, MD1
Alice H. Lichtenstein, DSc2
1 Center for Clinical Evidence Synthesis, Institute for Clinical Research and Health Policy Studies,
Tufts-New England Medical Center, 750 Washington Street, Box 63, Boston, MA 02111, USA 2 Cardiovascular Nutrition Laboratory, Jean Mayer USDA Human Nutrition Research Center on
Aging, Tufts University, 711 Washington Street, Boston, MA 02111, USA 1 Background Hazard identification is part of the process of nutrient risk assessment. This step is intricately linked to and aims to provide information to hazard characterization. It does not make judgements as to whether a nutrient is hazardous at a certain level of intake, which is a task for hazard characterization; and it does not address issues related to risk–benefit if hazards are identified, which is a task outside the scope of this workshop. Hazard identification serves to answer specific questions, and it sum-marizes the evidence on clinical effects or biological endpoints associated with a specific amount of nutrient intake. In some reports, the hazard identification step also has considered effects associated with nutrient–nutrient interactions.
In some cases, different organizations performing nutrient risk assessment have proposed different upper levels (UL) for the same nutrient. While minor variations in the recommended ULs may be expected because of differences in background diets and local factors in different countries, the evidence upon which the recommendations are based should be nearly the same. Review of publications shows that different groups sometimes use different evidence in the hazard identification step of nutrient risk assessment (see Annex 8, “National model comparison: Scientific review of data on vitamin A and bone density,” of the Context Paper). This table shows that the EU-SCF, EVM, and IOM included different studies as the evidence to establish recommendations for the UL. The differences remain even after adjusting for the publication date of the reports. A more detailed anal-ysis of the vitamin A and bone effects data appears in Appendix A of this paper.
Inconsistent use of evidence by different nutrient risk assessment groups could lead to differences in the characterization of the hazards, which in turn may lead to different recom-mendations for the UL. This possibility points to a need for a standard approach to identify, evaluate, synthesize, and interpret nutrient hazard data when developing a nutrient risk assessment model with international applicability. The consistent application of a standardized approach also would facilitate the updating of future assessments.
This paper is limited to an approach to assess the evidence of health risk related to high levels of intake of nutrients in otherwise healthy populations; it does not address nutrient under-consumption or benefits.
It is acknowledged that there often is little direct evidence from human studies for the assessment of nutrient hazards. Nonetheless, decisions need to be made. To provide a foundation for
Annex 2
103
developing a standard approach to the hazard identification step of nutritional risk assessment, the objectives of this paper are:
• using published reports on nutrient risk assessments, identify key problems in the hazard
identification process; • propose a framework to identify and assess nutrient hazards—one that could be used to
synthesize diverse types of data; • discuss issues in the synthesis of nutrient hazard data, with regard both to meta-analysis and
to the presentation of the hazard identification results; • using the example of vitamin A and bone health, illustrate the application of an evidence-
based method to review scientific studies of nutrient hazards. 2 ‘Evidence-based’ approach to identify and assess nutrient hazards 2.1 Evidence-based method Methodologies initially developed for “Evidence-Based Medicine (EBM)” now are widely used in many areas of healthcare other than medicine (Oxman, 1993). The premise of “evidence-based” healthcare (or in our case, nutrition policy) is that systematic reviews of scientific data allow reliable (i.e. scientifically defensible) decisions to be made—decisions that are based on systematic and critical appraisal and on syntheses of the available evidence. Systematic reviews involve many steps, including: formulating the research question(s), establishing the eligibility criteria, searching the literature, abstracting data, critically appraising the data, synthesizing the data, and interpreting the results (Chalmers, 1995). In addition to providing answers to research questions, the review process also identifies knowledge gaps, thus pointing the way to future research needs.
Systematic review strives for transparent, comprehensive, and objective evaluation of scien-tific evidence. An evidence-based review states the method used to ensure completeness in identifying the available publications, the rationale for the selection of studies, and the method of analysis and interpretation. Systematic reviews conducted by different groups addressing the same question using the same data should come up with similar results. However, subjective judgements sometimes are unavoidable during the process of evaluating the evidence and interpreting the results. Discrepancies that occur should be readily identifiable if the protocols and decisions are well documented. Differences of results may sometimes be explained by variations in the research questions, the specification of the eligibility criteria, the literature search process, statistical methods of synthesis, outcomes assessed, or the interpretation of the evidence. 2.2 Formulating research questions Formulating the initial research question(s) is a critical first step in the systematic review process. A well-formulated question will improve the likelihood that obtaining an answer is feasible. It focuses and defines the scope of the problem and helps guide the literature evaluation and data synthesis. The EBM community commonly uses the “PICO” approach to formulating research questions to evaluate healthcare interventions. The acronym PICO stands for: Participants, Intervention, Comparator, and Outcomes (Counsell, 1997). By unambiguously specifying the parameters for each of these attributes, a research question could be created that potentially could be answered directly. An example of a focused question might be, “What is the overall 5-year mortality (Outcome) in men 50 years and older without a prior history of cardiovascular disease (Participants) treated with 1 mg of folic acid daily (Intervention) compared with those taking a placebo (Comparator)?” Minor modifications of this approach to formulating questions could be adopted to study nutrient hazards in humans, as well as in animals. Formulating a question often is an iterative process that considers tradeoffs between the desire for ideal knowledge and the reality of limited data. Notably, any research questions thus formulated would affect the interpretation of the answers directly. In particular, answers from a
A Model for Establishing Upper Levels of Intake for Nutrients and Related Substances
104
narrowly defined subgroup would have limited generalizability to the general population. However, consistent results from a broad range of subgroups likely will be generalizable.
A broad ranging question such as “What should be the UL for vitamin E?” is not answerable directly. This question would need to be decomposed into a number of smaller and more focused questions that, hopefully, some data would be available to address. By answering these well-focused questions, we then can generalize their results to a broader context. Research gaps will need extrapo-lations of indirect evidence from related populations, different animal models, or in-vitro systems. A grading system could help to interpret the evidence. Useful grading systems incorporate the directness of evidence and the methodological quality of the evidence. This information can be used in the nutrient hazard characterization process to derive uncertainty factors. Questions may need to be modified depending on the nature and availability of data. For example, the lack of data to address a specific question may require broadening of the original question or of review criteria. Such measures increase the uncertainty of the direct relevance of the findings to the target (sub) population. 2.3 Analytic framework Concurrent with formulating specific research questions, an analytic framework could be constructed to assist the synthesis and interpretation of the results from systematic reviews. Two concurrent approaches can be used to identify evidence of nutrient hazards. In most instances, the harmful effects of high intake level of nutrients are well known (e.g. very high doses of vitamin A cause bone fragility and fractures in humans and in animal models). In many cases, the biological mechanisms of the harmful effects also have been identified and studied. A nutrient may have numerous hazards. Each hazard needs to be identified. Later in the hazard characterization step, some system can be developed for determining which hazard will be used to determine the UL. For example, vitamin A hazards might include bone fractures, teratogenicity, and hepatotoxicity in high-risk subgroups.
In evaluating a diverse body of evidence, which might include different types of data and different study designs, we need an explicit framework to decide what is relevant and how each piece of information should be considered. This information could be used to construct a causal model (Figures A2-1, A2-2) in which specific linkages between the components of a model (i.e. the nutrient, biological effects, clinical outcomes, and potential effect modifiers) correspond to associations or causality.
Figure A2-1 depicts a generic causal evidence model describing the relationships of nutrient exposure with biological effect(s) and adverse health outcome(s). The association of biological effect(s) with exposure to a nutrient is depicted as arrow “A”. For example, the ingestion of a high dose of vitamin A may result in increased bone resorption and decreased bone formation. Studies providing this evidence support this link. The association of a biological effect (e.g. decreased bone mineral density) with an adverse health outcome (e.g. fracture) is depicted by arrow “B”. Since the information for “B” is generally well-established scientific knowledge, an extensive literature search usually is not required. However, if this information is not readily available, this information should be sought. Sometimes the association of a biological effect with an adverse health outcome is not specific. In this case, direct evidence is needed to establish the association (depicted by arrow “C”). Sometimes the biological effect attributable to the nutrient may not directly cause adverse health outcomes. The biological effect due to high-dose nutrient use may be indirectly linked to adverse health outcomes via other biological effects (dashed arrows “D” and “E” in Figure A2-1). In both instances, a study directly linking nutrient use with adverse health outcomes (arrow “C”) can establish the causality (if it is a controlled trial) or association (if it is an observational study)—even if the mechanism has not been established. This generic evidence model could be applied to both human and animal data (IOM, 2004).
Each link in a causal model represents a research question (analogous to a hypothesis) in which evidence would be sought from experimental or observational studies. Systematic reviews of the literature would be conducted to search for evidence addressing each of these questions (i.e. links in the causal model). Completion of the evidence reviews for these linkages could firm up or disprove

Annex 2
105
these hypotheses, thus giving guidance to the interpretation of the evidence. This process also would identify areas of research gaps and where indirect evidence might be sought, if appropriate.
Figure A2-1. A generic evidence model that links biological effects and adverse health outcomes. Arrow “A” depicts the association of a biological effect with exposure to a nutrient. Arrow “B” depicts the association of a biological effect with an adverse health outcome. Arrow “C” depicts the association (or causality) of a nutrient
exposure with an adverse health outcome. Dashed arrows “D” and “E” depict indirect linkages between high-dose nutrient use and other biological effects.
To identify hazards that may not be well known (e.g. interactions with drugs or other nutrients
or adverse effects that may occur at intakes below an established UL), the traditional method of hazard signal detection should be employed. Sometimes nutrient risks have been identified when trials were conducted to assess potential benefits (e.g. in studies of beta-carotene and lung cancer) or when meta-analyses of trials of benefit were performed (e.g. a meta-analysis that addressed benefits of vitamin E supplementation). Broad-based searches of medical literature and relevant databases should be conducted to identify these potential hazards. Once a signal is detected, it may be used to generate research questions as outlined above.
Individual systematic reviews typically focus on one or a few questions. Nutrient hazard identification and characterization need to examine the diverse manifestations of the nutrient’s hazards. Thus, as suggested by Figure A2-1, a causal model will need to be developed for each major endpoint of concern. For example, separate causal models for hepatotoxicity, teratogenic effects, and bone effects should be developed for vitamin A hazard assessments.
Figure A2-2 illustrates that some evidence from human, animal, and in-vitro studies is available to link the intake (exposure) of a nutrient with a biological effect. Even though the evidence may be weak for individual types of data, the consistency of the evidence across these data taken together strengthens the belief about the association or causality. Additionally, the belief of associ-ation is strengthened by the availability of human data that link the same biological effect with adverse health outcomes on another substance related to the chemical structure of the nutrient—and by the availability of animal data showing the same. The assessment may be repeated for each intake/ exposure level of concern or a dose–response analysis may be sought within each type of data.
Generic Evidence Model Linking BiologicalEffects and Adverse Health Outcomes
Adversehealth
outcome(s)Nutrient
D
C
A Biologicaleffect(s)
B
Additionalbiologicaleffect(s)
E

A Model for Establishing Upper Levels of Intake for Nutrients and Related Substances
106
Figure A2-2. A hypothetical scenario of types of data that might be available to assess the health effects of high intake of a nutrient. Since nutrient hazard data often are sparse and incomplete, appropriate syntheses across different types of data may allow a coherent appreciation of the hazard. The arrows in this figure represent the availability of evidence. Bold arrow indicates areas where the evidence is stronger (quantity and magnitude).
2.4 Specifying systematic review criteria For each research question, a set of study eligibility criteria is used to identify relevant studies to be included in the evidence review. The PICO method described earlier needs to be expanded to incor-porate factors specific to characterize nutrient hazards. These criteria define the rules of admissible evidence to address each question. For example, in human studies, the age and sex of the participants of interest should be specified, as well as the spectrum of participants with co-morbidities and vulnerable subgroups. For animal or in-vitro studies, the types of acceptable animals or cell or organ cultures should be defined.
For nutrient exposure, studies should report available information about the intake such as the dose, route and duration, plasma levels or urinary excretion, and the dietary history of the participants. Studies should include a description of the method of nutrient intake estimation.
The effects of high-level intake of many nutrients are generally known. These effects include clinical outcomes as well as biological endpoints. For example, the ranking scheme by Renwick (2004) is an approach that has been proposed for the classification of these effects. Each known effect could be the basis of a research question, or several questions could address the human and animal data separately.
In addition to the above, the type of acceptable study design should be specified. For human clinical endpoint studies, acceptable studies include randomized controlled trials, cohorts, case–control, and case series. It is acknowledged that few randomized controlled trials will be available to address hazard issues. If such trials are available and if they meet quality criteria (e.g. sufficient power and duration of study), they represent the most reliable form of evidence. However, data for nutrient hazard identification for some nutrients comes primarily from observational studies. Specifying a minimum number of participants in the study may be a useful inclusion criterion.
Because of the paucity of data on nutrient hazards, it is likely that any study that meets the minimal inclusion criteria will be accepted as evidence for hazard identification, regardless of the
Biologicaleffect(s)Nutrient
Biologicaleffect(s) Health effect(s)
Biological effect(s) Health effect(s)
Human Data
Animal Data
Available data
Biologicaleffect(s)
In vitro Data
Nutrient
Nutrient
Nutrient
Health effect(s)
Annex 2
107
quality of the data. Therefore, for each included study, it is important to evaluate critically with regard to methodological quality and thoroughness of monitoring for adverse events. The overall quality of each study should be indicated, and this information should be considered in the assignment of an uncertainty factor to the evidence.
An example illustrating the effect of applying study inclusion criteria on study selection is shown in Appendix B of this discussion paper. 2.5 Specific factors to considered in evaluating studies with nutrient hazard data Identified studies that provide potentially relevant nutrient hazard data should be assessed based on evaluation criteria established a priori. The scientific literature is replete with many excellent and comprehensive discussions about the merits and limitations of different types of data and study designs in the assessment of nutrient hazards (e.g. IOM, 2004). Therefore, these issues will only be highlighted here. The following list includes items that should be considered in the evaluation of each study. i. Type of data (human, animal, in vitro)
• Directness of the evidence relating to the analytical framework: direct human outcomes of interest, human intermediate outcomes
• Relevance of the data to humans: animal, tissue culture, biochemical structures, etc. • Relevance of the human data to the target (sub) population addresses the applicability or
generalizability of the data; variables that should be considered include: diet, behavior, sex, age, world region, known genetic differences (genotypes, phenotypes), etc.
ii. Methodological quality (study designs, reliability of the data)
Experimental data • Randomized controlled trials • Crossover studies • Clinical interventions (e.g. small controlled trials in metabolic units)
Observational data • Cohort (prospective, retrospective) • Case–controls • Case reports/case series (e.g. MEDWATCH)
iii. Nutrition and dietary issues
• Background diet, baseline nutrient intakes (to facilitate the interpretation of the comparability of study (sub) populations)
• Chemical form(s) of nutrient • Duration of exposure • Magnitude of exposure (acute, chronic) • Food or supplement • Source of water
iv. Other specific factors
• Age, sex, race or ethnic background, health status (e.g. protein-calorie malnutrition) • Consumption of other nutrients that might alter metabolism or bioavailability. Examples
include vitamin C with Fe, fiber with Zn, tryptophan in addition to niacin, folate and B12.

A Model for Establishing Upper Levels of Intake for Nutrients and Related Substances
108
• Consumption of non-nutrient factors that might alter metabolism or bioavailability. Examples include vitamin A and isotretinoin, pyridoxine and isoniazide.
v. Other general considerations in the evaluation of a study
• The size of the study (number of humans/animals/etc.) • Effect size (relationship with dose, subgroups, other factors) • Weighing of the evidence (individual study, aggregate) • Multiple adverse effects (may have different toxicity manifestation at different dosages) • Seriousness and severity of the hazard • Reversibility of the effect
3 Grading and synthesizing evidence 3.1 Grading the methodological quality of nutrient hazard studies Studies are designed, conducted, analyzed, and reported with various degrees of methodological rigor and completeness. Deficiencies in any of these processes may lead to biased reporting or inter-pretation of the results. A summary of poor quality studies that are likely to be unreliable or biased is of limited value. It is desirable to grade individual studies in the hazard identification step to inform hazard characterization about the degree of potential bias, but grading the quality of evidence is complex.
In the grading of the quality of randomized controlled trials used to evaluate healthcare interventions, quality has been defined as the “confidence that the trial design, conduct, and analysis has minimized or avoided biases in its treatment comparison” (Moher, 1995). Quality assessment may suggest the extent to which trial design and methodology prevented systematic error, and it may explain differences in the results of systematic reviews. However, the factors commonly used to assess the quality of randomized controlled trials often have not been related to the direction or magnitude of the reported effect size (Juni, 1999; Balk, 2002). There is still no uniform approach to grade published studies reliably based on the information reported in the literature. This problem is magnified several-fold for nutrient hazard identification for two main reasons: many different types of data and study designs are encountered, and little empirical evidence supports proposed approaches to evaluate the quality of observational studies.
Checklists and quality scales commonly are used to assess the methodological quality of individual studies in a systematic review. These generally comprise several to several dozen factors believed to be associated with study quality. Weights, usually arbitrarily determined, are assigned to each of the quality factors assessed. For the assessment of randomized controlled trials, the commonly used quality indicators are adequacy of concealment of random allocation, accurate reporting of the number of withdrawals, the degree of reporting accuracy, the appropriateness of statistical analysis, and blinding in the assessment of outcomes. The theory behind these indicators of study quality is that studies with poor ratings of these qualities are more likely to result in biased outcomes. For example, compared to double-blinded studies, non-blinded studies may be more likely to find a greater benefit of treatment (e.g. a larger odds ratio, or effect size, of cure). Quality scales, however, may be fraught with problems, including contradictory conclusions about the quality of studies when different scales are used (Juni, 1999). Limited empirical evidence indicates that only lack of concealment of random-ization and double blinding are related to exaggerated effect sizes. The studies differed, however, regarding the extent to which the quality indicators were related to effect sizes. The relevance of these factors to the assessments in nutrient hazard studies is uncertain.
In the case of non-randomized studies such as cohort and case–control studies, no empirical data support the use of elements that should comprise a core set of quality indicators. Because prospective cohort and case–control studies do not have randomization, allocation concealment, and blinding, a core set different from that used for randomized controlled trials must be defined for them. The following criteria frequently are used to assess the quality of prospective cohort studies:

Annex 2
109
• Unbiased selection of the cohort (prospective recruitment of subjects) • Adequate description of the cohort • Use of a validated dietary assessment method • Quantification of the type and amount of nutrient intake • Use of a validated method for ascertaining of endpoints/clinical outcomes • Concomitant use of drugs • Number of drop-outs • Adequate follow-up period • Completeness of follow-up • Analysis (multivariate adjustments) and reporting of results.
Despite the above caveats, it is necessary to assess and provide an indication of the quality of
a study after a critical appraisal of an article. Although a simple evidence-grading system using a single metric would be desirable, as discussed above, the quality of evidence is multidimensional: a single metric cannot fully capture the information needed to interpret a study with nutrient hazard data. When providing information for nutrient hazard identification, individual components of a study may be more useful than a single summary score. It is suggested that the hazard identification include specific items that are important to interpret the study and an overall grade: both are useful in the hazard characterization step.
Potentially relevant studies with nutrient hazard data should be assessed against criteria specific to their study design (e.g. randomized controlled trials, prospective cohort study, case–control study). In addition to extracting specific information, a three-category (A, B, C) quality grade could be assigned to each study. This approach defines a generic grading system for study quality that is applicable to each type of study design. Minor variations of this approach are widely used by many healthcare technology assessment organizations. The categories are defined as follows:
A. Least bias, results are valid. A study that mostly adheres to the commonly held concepts of
high quality for the particular level of study design; clear description of the (sub) population or study subjects, setting, interventions, and comparison groups; appropriate measurement of outcomes; appropriate statistical and analytic methods and reporting; no reporting errors; less than 20% of and clear reporting of dropouts; and no obvious bias.
B. Susceptible to some bias, but not sufficient to invalidate the results. A study that does not meet all the criteria in category A. It has some deficiencies but none likely to cause major bias. Study may be missing information—thus making assessment of the limitations and potential problems difficult.
C. Significant bias that may invalidate the results. A study with serious errors in design, analysis, or reporting. These studies may have large amounts of missing information or discrepancies in reporting.
The quality grading system evaluates and grades the studies within each of the study design
strata. By design, it does not attempt to assess the comparative validity of studies across different design strata (e.g. it does not compare randomized controlled trials to case–control studies). Thus, in interpreting the methodological quality of a study, one should note both the study design and the quality grade that it received. Although it might be desirable to rank the quality of all studies on the same scale regardless of study design, experience with this approach is limited and has never been validated. In fact, using a single rating scale for all studies creates potential problems. For example, a hierarchy of study design that places randomized controlled trials above cohort studies in terms of methodological rigor is commonly accepted. However, if a randomized trial is seriously flawed, the results may be more biased than those from a well-done cohort study.

A Model for Establishing Upper Levels of Intake for Nutrients and Related Substances
110
3.2 Meta-analysis to synthesize evidence Occasionally, several studies of the same study design may address the same or similar nutrient research questions and provide nutrient hazard information. In these instances, meta-analyses may be feasible to provide more precise estimates of the hazards and to explore dosage relationships. Meta-analyses are typically conducted toward the end of the systematic review process if there are adequate data for analysis (Lau, 1997; Lau, 1998). For example, a recently published meta-analysis that analyzed 19 clinical trials involving over 135 000 participants reported that high-dose vitamin E supplementation might increase all-cause mortality (Miller, 2005). The primary purpose of these trials was to evaluate benefits, not to detect nutrient hazards. In performing this meta-analysis, the authors suggested that vitamin E supplementation of 400 IU/d or more may increase all-cause mortality and should be avoided. The authors also conducted a meta-regression (where each study is the unit of analysis) analysis relating the study dosage to overall mortality, which suggested that increased risk begins to occur at dosages greater than 150 IU/d.
The decision as to whether to combine studies in a meta-analysis and the subsequent selection of statistical methods can be challenging and subject to criticisms. In the case of the vitamin E meta-analysis, numerous letters to the editors (http://www.annals.org/cgi/eletters/0000605-200501040-00110v1#1443) criticized the appropriateness of combining data across disparate groups, the statistical models used in the analyses, and the generalizability of the results. The U.S. National Institutes of Health held a special workshop soon after this paper was published to discuss the paper and its ramifications.
Meta-analysis is increasingly used to synthesize results of scientific studies in many health sciences areas, including nutrient studies. It can be a powerful tool to discover otherwise unapparent information. Subgroup analyses and meta-regression techniques could be used as an integral part of nutrient hazard identification to explore dose effects. However, the meta-analysis must be executed appropriately and its limitations must be understood. Detailed discussions about meta-analysis methodologies and issues are beyond the scope of this paper. This information is readily available in numerous books (Cooper, 1994) and journal articles (Laird, 1990; Stroup, 2000). 4 Conclusions Evidence-based methodologies are well suited to perform nutrient hazard identification. While there are some unique elements in the evaluation of nutrient hazards, the basic methods are the same. The following are the key guiding principles in this approach:
• Well-formulated research questions with clearly defined criteria for systematic review of evidence will greatly facilitate the tasks of nutrient hazard identification.
• A causal model (analytic framework) is useful to facilitate the framing of the issues and the reporting of evidence discovered at this stage, and to assist the integration of diverse data.
• When hazards are known for a nutrient, experts in the nutrient assessment workgroup can generate specific research questions. Additional hazards should be identified through broad-based literature search.
• Only studies that meet the inclusion criteria should be analyzed and included as evidence to address a specific question. Studies that do not directly address a research question or meet the inclusion criteria should not be considered. Studies that are peripheral to the research questions may be used as background information but should not be considered as part of the evidence review. As a corollary, if an expert believes that a certain study should be included despite the fact that the study does not meet the criteria for any of the initially established research questions, a new research question should be generated or the review criteria should be modified.
Annex 2
111
• The hazard identification step should provide detailed information and analysis of the evidence found that is related to the specific questions. This information includes: study design, type of data (human, animal, in-vitro), characteristics of the study (sub) population, methodological quality of the study, applicability of the data to the target (sub) population, the magnitude of effect, and the quantity (or uncertainty) of the evidence.
• If sufficient data are available, sensitivity analyses to examine potential effect modifiers, and analyses of dose effect should be performed (e.g. meta-analyses of subgroup data or meta-regression), as an integral part of hazard identification.
References Balk EM, Bonis P, Moskowitz H, Schmid CH, Ioannidis JPA, Wang C, Lau J. Correlation of quality
measures with estimates of treatment in meta-analyses of randomized trials. Journal of the American Medical Association 2002;287:2973-82.
Chalmers I, Atlamn DG (eds). Systematic Reviews. BMJ Publishing Group. London, 1995. Cooper H, Hedges LV. The handbook of research synthesis. New York: Russell Sage Foundation, 1994. Counsell C. Formulating questions and locating primary studies for inclusion in systematic reviews.
Annals of Internal Medicine 1997; 127:380-7. Harris RP, Helfand M, Woolf SH, Lohr KN, Mulrow CD, Teutsch SM, Atkins D. Current methods of
the U.S. Preventive Services Task Force: A review of the process. American Journal of Preventive Medicine 2001; 20:21S–35S.
Ioannidis JPA, Lau J. Can quality of clinical trials and meta-analyses be quantified? Lancet 1998;352:590-91.
IOM. Dietary supplements: a framework for evaluating safety. Committee on the Framework for Evaluating the Safety of Dietary Supplements, Food and Nutrition Board [and] Board on Life Sciences. Institute of Medicine, The National Academies. The National Academies Press, Washington DC, 2004.
Juni P, Witschi A, Bloch R, Egger M. The hazards of scoring the quality of clinical trials for meta-analysis. Journal of the American Medical Association 1999;282:1054-60.
Laird NM, Mosteller F. Some statistical methods for combining experimental results. International Journal of Technology Assessment in Health Care 1990; 6:5-30.
Lau J, Ioannidis JPA, Schmid CH. Quantitative synthesis in systematic reviews. Annals of Internal Medicine 1997;127:820-26.
Lau J, Ioannidis JPA, Schmid CH. Summing up evidence: One answer is not always enough. Lancet 1998;351:123-27.
Miller ER, 3rd, Pastor-Barriuso R, Dalal D, Riemersma RA, Appel LJ, Guallar E. Meta-analysis: High-dosage vitamin E supplementation may increase all-cause mortality. Annals of Internal Medicine 2004;142:37-46.
Moher D, Jadad AR, Nichol G, et al. Assessing the quality of randomized controlled trials: An annotated bibliography of scales and checklists. Controlled Clinical Trials 1995;16:62-73.
Oxman AD, Sackett DL, Guyatt GH. Users’ guides to the medical literature. I. How to get started. The Evidence-Based Medicine Working Group. Journal of the American Medical Association 1993;270:2093-95.
Renwick AG, Flynn A, Fletcher RJ, Muller DJG, Tuijtelaars S, Verhagen H. Risk-benefit analysis of micronutrients. Food and Chemical Toxicology 2004;42:1903-22.
Stroup DF, Berlin JA, Morton SC, Olkin I, Williamson GD, Rennie D, Moher D, Becker BJ, Sipe TA, Thacker SB for the MOOSE group. Meta-analysis of observational studies in epidemiology: A proposal for reporting. Journal of the American Medical Association 2000;283:2008-12.
A Model for Establishing Upper Levels of Intake for Nutrients and Related Substances
112
Appendix A to Annex 2: Discrepancies in the review of vitamin A data by different workgroups: An illustration of how different workgroups might have asked different questions and used different inclusion criteria in reviewing evidence The 27 studies listed in the Draft Table of Vitamin A and Bone Density that are referenced by the three nutrient risk assessment workgroups (EU-SCF, EVM, IOM) (Annex 8, “Summary of the Work-groups’ Scientific Review of Data on Vitamin A and Bone Density,” of the Context Paper) are used to illustrate the point that each workgroup might have applied different literature review criteria to select studies for its report. The lack of a common set of research questions and review criteria might have led to the selection of different studies. The lack of a predefined analytic framework of the specific outcomes to assess, the uses of different types of studies, and the weighting of the evidence might also have led to different interpretations of the evidence and characterization of the hazard.
Table A2-1 of this paper lists the studies chronologically as they appear in Annex 8 of the Context Paper. Information provided in that annex was used to derive entries under each column. Information not provided in Annex 8 was obtained by review of the abstracts of the original articles. The three rightmost columns in this table provide an indication of which workgroup report used the study. It should be noted that the full text of each of these 27 studies was not reviewed; and, therefore, the information in the table may not be completely accurate. Table A2-2 of this appendix reorders the studies according to animal, human, or in-vitro data to highlight how each workgroup selected different studies for its review.
In Table A2-2, it can readily be seen that there are 8 animal studies, 14 human studies, 4 in-vitro studies, and 1 review article. The EU report referenced 20 studies out of the entire pool of 27 studies, the EVM report referenced 13 studies, and the IOM report referenced 4 studies. Use of animal studies The EU report used five of the total eight animal studies, the EVM report used three non-overlapping animal studies, and the IOM report used only one animal study—a study that also was used by the EU report. Without having the explicit review criteria from these reports or reviewing the original full articles, it would be difficult to determine why the EU and EVM reports selected non-overlapping animal studies. Use of in-vitro studies In-vitro studies were used only in the EU report. Use of human studies It appears that the IOM report primarily used data from large human trials or cohort studies. Because the IOM report was published in 2001, studies published in 2001 and 2002 were not included. The EU report appears to have accepted any human study that reported data on vitamin A and a bone endpoint. It also referenced one review article. It is unclear whether this review article also reported on original data. The EVM report appears to have excluded case reports and small studies, but it appears to use a looser criterion in another aspect. It used three studies (numbers 11, 12, and 13) that did not have both vitamin A intake assessment and bone endpoints in the same study. Interpretation From the types of studies used in each report, one can deduce the general approaches that might have been taken by each of the workgroups. Considering that the workgroups used different studies, some overlapping with those used in another report and some not, it should not be too surprising that each workgroup came up with different decisions about an UL for vitamin A. Detailed discussion about the

Annex 2
113
process of coming up with an UL is beyond the scope of this paper. In addition to information about each hazard discovered in the hazard identification step, other factors that need to be assessed include the seriousness and severity of the hazards, concerns for vulnerable subgroups, the sizes of the sub-groups at risk, as well as the consideration of benefits. Formal decision analytic framework, such as the use of a decision tree or cost-benefit analyses, could be used to determine such an UL threshold explicitly. More commonly, as the case for the three reports analyzed here, this task is accomplished with expert judgement.
Differential selection of articles for review and their interpretation may reflect the lack of a well-delineated literature review protocol, or it may reflect the composition of the workgroup mem-bers and their respective areas of expertise. An explicit analytic framework with an a priori formulated research question could minimize the discrepancies identified in vitamin A risk assessment.

A Model for Establishing Upper Levels of Intake for Nutrients and Related Substances
114
Appendix A to Annex 2, Table A2-1. Vitamin A and bone density—References cited by three reports, listed in chronological order
Author Year Study Design Type Specifics Outcome EU EVM IOM
1 Nieman 1954 A “Animals” Bone fragility X 2 Leelaprute 1973 A Rats Bone
resorption X
3 Dhem 1984 A Rats Bone fragility, fracture
X
4 Freuden-heim
1986 Longitudinal and cross-sectional analyses
H Clinical trial of Ca++ supple-ment in 99 women
Vit A and BMD
X X X
5 Frankel 1986 A Rats Vit A and PTH
X
6 Hough 1988 A Monkey Bone resorption, formation
X
7 Biesalski 1989 Case reports H Several children
Bone changes
X
8 Sowers 1990 ? Cohort H Postmeno-pausal
Vit A intake, radial bone mass, fracture history
X X
9 Scheven 1990 I Bone culture Osteoclast effect
X
10 Hathcock 1990 A “Animals” Histopatho-logical changes
X
11 Cruz 1991 Diet intake H No bone outcome
X
12 Johnell 1992 National osteoporosis register
H MEDOS study group
No vitamin A data
X
13 Melton 1995 Book chapter ? original data
H Hip fracture rates of N. Am. vs. Scandinavia
X
14 Kindmark 1995 I Mouse calvarial bones
Osteoclast formation, bone resorption
X
15 Hout-kooper
1995 Cohort H 66 women premeno-pausal
Vitamin A intake and BMD
X X X
16 Lapadula 1995 A 12 exp rabbits 4 controls
Vitamin A induced osteo-arthritis; histopatho-logical changes
X

Annex 2
115
Appendix A to Annex 2, Table A2-1. Continued
Author Year Study Design Type Specifics Outcome EU EVM IOM
17 Theiler 1995 Case reports H 3 cases Vit A intoxication is related to osteoarthritis
X
18 Saneshige 1995 IV Gene expression
X
19 Melhus 1998 Nested case–control
H 247 cases, 873 controls; women
BMD, hip fracture
X X X
20 Cohen-Tanugi
1998 IV Cell culture Osteoclast differentia-tion
X
21 Rohde 1999 A Rats Vit A and D interaction
X X
22 Binkley 2000 Review article
A,I,H X
23 Ballew 2001 NHANES H Retinyl esters and BMD
X X ?
24 Johan-sson
2001 H 9 volunteers Vit A and D interaction
X ?
25 Kawahara 2002 RCT H 40 men 7.6 mg vit A retinyl palmitate x 6 wks and bone turnover
X ?
26 Feskanich 2002 Cohort H Nurses’ Health Study >7,200 W
Vit A intake, hip fractures
X X ?
27 Promislow 2002 Cohort H 570 W, 388 M Retinol intake, BMD
? X ?
A – animal; H – human; I – in-vitro; BMD – bone mineral density; PTH, parathyroid hormone; ? – the report probably was completed prior to this publication
Appendix A to Annex 2, Table A2-2. Vitamin A and bone density—References cited by three reports. sorted according to the type of study (animal, in-vitro, human)
Author Year Study Design Type Specifics Outcome EU EVM IOM
10 Hathcock 1990 Review article
A “Animals” Histopatho-logical changes
X
22 Binkley 2000 Review article
A,I,H X
1 Nieman 1954 A “Animals” Bone fragility X
2 Leelaprute 1973 A Rats Bone resorption
X
3 Dhem 1984 A Rats Bone fragility, fracture
X

A Model for Establishing Upper Levels of Intake for Nutrients and Related Substances
116
Appendix A to Annex 2, Table A2-2. Continued
Author Year Study Design Type Specifics Outcome EU EVM IOM
5 Frankel 1986 A Rats Vit A and PTH
X
6 Hough 1988 A Monkey Bone resorption, formation
X
16 Lapadula 1995 A 12 exp rabbit 4 controls
Vitamin A induced osteo-arthritis; histopatho-logical changes
X
21 Rohde 1999 A Rats Vit A and D interaction
X X
9 Scheven 1990 I Bone culture Osteoclast effect
X
14 Kindmark 1995 I Mouse calvarial bones
Osteoclast formation, bone resorption
X
18 Saneshige 1995 I Gene expression
X
20 Cohen-Tanugi
1998 I Cell culture Osteoclast differentia-tion
X
4 Freuden-heim
1986 Longitudinal and cross-sectional analyses
H Clinical trial of Ca++ supple-ment in 99 women
Vit A and BMD
X X X
7 Biesalski 1989 Case reports H Several children
Bone changes
X
8 Sowers 1990 ? Cohort H Postmeno-pausal
Vit A intake, radial bone mass, fracture history
X X
11 Cruz 1991 Diet intake H No bone outcome
X
12 Johnell 1992 National osteoporosis register
H MEDOS study group
No vitamin A data
X
13 Melton 1995 Book chapter ? original data
H Hip fracture rates of N. Am. vs. Scandinavia
X
15 Hout-kooper
1995 Cohort H 66 women premeno-pausal
Vitamin A intake and BMD
X X X
17 Theiler 1995 Case reports H 3 cases Vit A intox-ication is related to osteoarthritis
X

Annex 2
117
Appendix A to Annex 2, Table A2-2. Continued
Author Year
Study Design Type Specifics Outcome EU EVM IOM
19 Melhus 1998 Nested case–control
H 247 cases, 873 controls; women
BMD, hip fracture
X X X
23 Ballew 2001 NHANES H Retinyl esters and BMD
X X ?
24 Johan-sson
2001 H 9 volunteers Vit A and D interaction
X ?
25 Kawahara 2002 RCT H 40 men 7.6 mg vit A retinyl palmitate x 6 wks and bone turnover
X ?
26 Feskanich 2002 Cohort H Nurses’ Health Study >7,200 W
Vit A intake, hip fractures
X X ?
27 Promislow 2002 Cohort H 570 W, 388 M Retinol intake, BMD
? X ?
A – animal; H – human; I – in-vitro; BMD – bone mineral density; PTH – parathyroid hormone; ? – the report probably was completed prior to this publication

A Model for Establishing Upper Levels of Intake for Nutrients and Related Substances
118
Appendix B to Annex 2: Applying the analytic framework to identify and assess nutrient hazards This framework uses causal models linking various intermediate endpoints (e.g. gene expression) and/or surrogate markers (e.g. BMD changes) with clinical outcomes (e.g. osteoporosis, bone frac-tures). For each clinical outcome of concern, it is likely that there are multiple intermediate biological endpoints or surrogate markers associated with the outcomes. A transparent analytic framework developed at the beginning of the nutrient risk assessment makes it easier for a reader to recognize the hazard questions being considered, and it could minimize the problem of excluding potentially rele-vant studies or including studies that do not provide evidence that directly addresses the research question.
At the start of nutrient risk assessment, the workgroup defines a set of research questions con-cerning the hazards of a nutrient to be addressed by systematic reviews of the literature and relevant databases. These questions could be formulated based on hazard information that is already known about the nutrient being evaluated. Each one of these questions should be focused on a specific out-come. For nutrients that are known to have multiple hazards, multiple specific questions will need to be addressed. For example, vitamin A has a number of known hazards including: teratogenicity, hepatotoxicity, adverse effects on bone metabolism, bulging fontanelles in neonates and infants. Targeted reviews of evidence of known nutrient hazards may need to be supplemented by searches in literature and databases to look for potential hazards not identified by the workgroup.
Each link in a causal model is a hypothesized association or causality (depending on the types of studies available). For example, high-dose intake of vitamin A has been observed to be associated with various bone effects. The inverse relationship of high-dose vitamin A and bone density in humans was first reported in 1986. This was followed by a review of case reports in children in 1989. Relatively large-scale study of the relationship did not appear until 1995. The question formulated for this outcome would be, “What is the relationship of high-level intake of vitamin A and fracture?” This question could be formulated to search for studies in humans or animals. Evidence would be summarized according to the type of study design. For example, human studies may include random-ized controlled trials, cohorts, case–controls, or case series. Additional questions may be formulated to examine the potential relationship between vitamin A and bone density. The availability of data showing this effect could support this hypothesis. Multiple human studies across a spectrum of sub-groups could strengthen this link. Similarly, consistency across different types of studies (experi-mental and observational human studies, animal models) also could support this hypothesis.
An analytic framework defining the potential relationships of endpoints/outcomes can be used to synthesize data from a seemingly disparate body of research. The framework includes formulating specific, directly answerable research questions concerning nutrient hazards, specifying criteria for conducting systematic reviews to address each of the research questions, and developing a method to appraise the methodological quality of each study and the applicability of the results to the target (sub) population. Data from human, animal, and in-vitro studies all may contribute to the charac-terization of the nutrient risk. However, for this approach to have meaning, the study types being considered (e.g. human, animals) must share similar properties. Likewise, the similarities and differ-ences in the bioavailability and metabolism of a given nutrient must be considered when comparing human and animal data. For example, post-absorption, beta-carotene cannot be converted to a form of vitamin that can meet nutrient requirements. In contrast, rat converts absorbed beta-carotene into vitamin A in the liver, which can be used to meet nutrient requirements. Although evidence may not be available to answer some specific questions, these questions should nonetheless be posed. This allows the explicit recognition of data gaps and the development of an uncertainty factor.

Annex 2
119
Example: vitamin A nutrient hazard identification Developing a causal model A causal model for different outcomes/endpoints should be constructed and used to generate answerable research questions for systematic reviews. Part of the process of developing a causal model is to specify outcomes of interest and their relationships. The model could be a series of interconnected questions or a visual diagram depicting these connections. Specifying outcomes/endpoints to assess What are the known major toxicities (outcomes/endpoints) for high intakes of vitamin A? This ques-tion is based on the understanding that the toxicities of vitamin A are well known:
• Bone • Liver • . . . etc.
Formulating specific questions for each relevant outcome/endpoint Potential questions for the assessment of bone studies (these questions should be developed in conjunction with an expert workgroup):
• What is the effect of high-level intake of vitamin A on bone fractures? • What is the association of vitamin A intake with markers of bone metabolism (bone mineral
density (BMD), resorption/formation)? • What is the dose relationship of vitamin A with these effects?
These questions may be posed for studies in humans, in animals, and in-vitro. Evidence may be sought from experimental studies and from observational studies. Specifying criteria for review of evidence for each question Criteria for systematic review of the literature also should be developed in conjunction with the expert workgroup at the time of question formulation, including but not limited to:
Type of study design: animal model, experimental or observation, study duration, etc. (Sub) population/subjects of interest: Nutrient dose of interest: > xxx IU/day Duration of exposure: Outcomes of interest: clinical outcomes or validated markers (fractures, deaths, osteoporosis, BMD, etc.); biological endpoints
The following are examples of research questions that could be formulated by workgroup experts evaluating nutrient hazards. Questions should include at least the following basic components: participants (subjects), acceptable study design, nutrient exposure and endpoints. Additional informa-tion that should be collected includes: co-morbidities, background diet, nutrient characteristics, and other information that is relevant to the interpretation of the observed effects. Question 1a. What is the effect of vitamin A at intake level greater than xxx IU/day on bone fractures in humans? Inclusion criteria for human studies (to be filled in by workgroup)
Participants: Acceptable study design: Duration:

A Model for Establishing Upper Levels of Intake for Nutrients and Related Substances
120
Nutrient intake assessment method: Outcome assessment method: Question 1b. What is the effect of vitamin A at intake level greater than xxx IU/day on bone fractures in animals? Inclusion criteria for animal studies (to be filled in by workgroup)
Animal models: Acceptable study design: Duration:
Intake of vitamin A (form, dose, route): Method of inducing/measuring outcomes: Question 2a. What is the effect of vitamin A at intake level greater than xxx IU/day on BMD in humans? Inclusion criteria for human studies (to be filled in by workgroup)
Participants: Acceptable study design: Duration: Nutrient intake assessment method:
Outcome assessment method: Question 2b. What is the effect of vitamin A at intake level greater than xxx IU/day on BMD in animals? Inclusion criteria for animal studies (to be filled in by workgroup)
Animal models: Acceptable study design: Duration:
Intake of vitamin A (form, dose, route): Method of inducing/measuring outcomes:
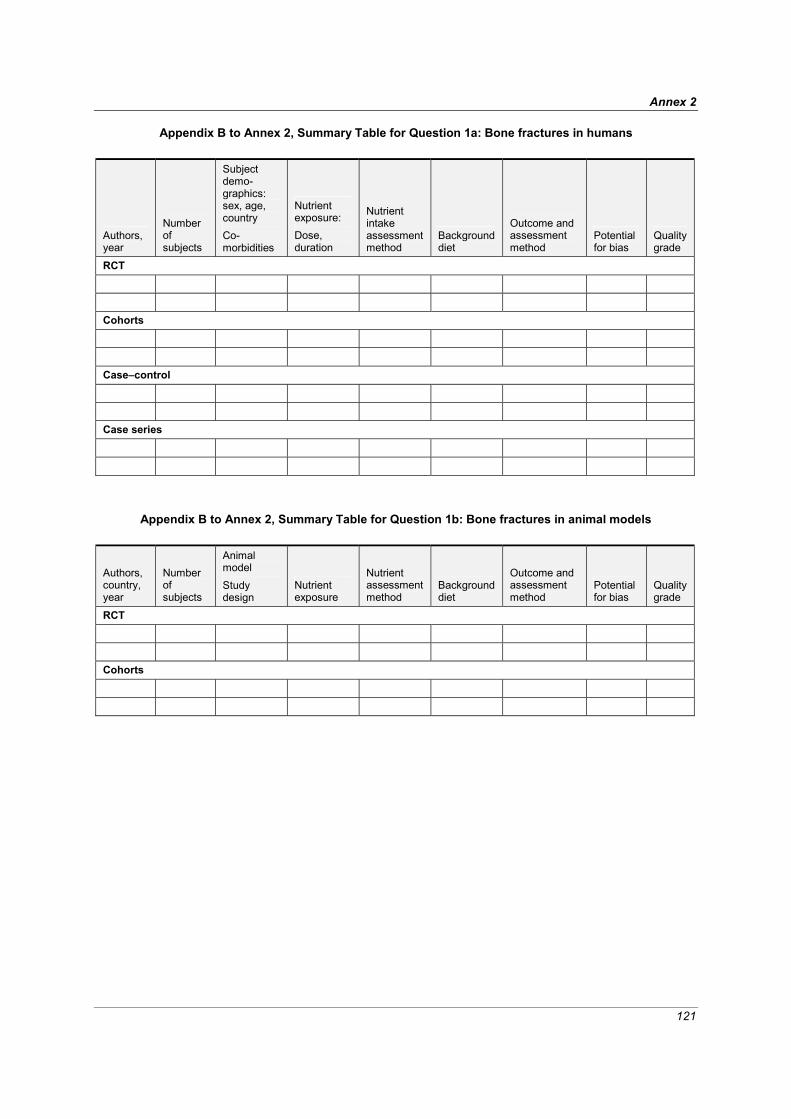
Annex 2
121
Appendix B to Annex 2, Summary Table for Question 1a: Bone fractures in humans
Authors, year
Number of subjects
Subject demo-graphics: sex, age, country Co-morbidities
Nutrient exposure: Dose, duration
Nutrient intake assessment method
Background diet
Outcome and assessment method
Potential for bias
Quality grade
RCT
Cohorts
Case–control
Case series
Appendix B to Annex 2, Summary Table for Question 1b: Bone fractures in animal models
Authors, country, year
Number of subjects
Animal model Study design
Nutrient exposure
Nutrient assessment method
Background diet
Outcome and assessment method
Potential for bias
Quality grade
RCT
Cohorts

A Model for Establishing Upper Levels of Intake for Nutrients and Related Substances
122
Appendix B to Annex 2, Summary Table for Question 2a: Bone mineral density effects in humans
Authors, year
Number of subjects
Subject demo-graphics: sex, age, country Co-morbidities
Nutrient exposure: Dose, duration
Nutrient intake assessment method
Background diet
Outcome and assessment method
Potential for bias
Quality grade
RCT
Cohorts
Case–control
Case series
Appendix B to Annex 2, Summary Table for Question 2b: Bone mineral density effects in animals
Authors, country, year
Number of subjects
Animal model Study design
Nutrient exposure
Nutrient assessment method
Background diet
Outcome and assessment method
Potential for bias
Quality grade
RCT
Cohorts

123
ANNEX 3 Discussion Paper 2:
Uncertainty and Adjustment
Prepared for the FAO/WHO Nutrient Risk Assessment Workshop 2-6 May 2005, WHO Headquarters, Geneva
Hildegard Przyrembel, MD1
1 Federal Institute for Risk Assessment, Thielallee 88-92, D-14195 Berlin, Germany
Introduction
“Many sources of uncertainty exist in the process of risk assessment and risk management of food (nutrient) related hazards to human health. The degree of uncertainty and variability in the available scientific information should be explicitly considered in the risk analysis.” —Codex Alimentarius Commission Procedural Manual, 13th edition, Working Principles for
Risk Analysis for Application in the Framework of the Codex Alimentarius Uncertainty of different kinds is an invariable companion of risk assessment. The identification of the various reasons for uncertainty and the method of dealing with it are prerequisites for increasing the credibility of the assessment result, for helping the risk manager in decisions for managing risks, and for stimulating research aimed at closing gaps of knowledge or in developing models for quantitative assessment (Edler et al., 2002).
Uncertainty should, however, be differentiated from variability (NRC, 1994). Uncertainty may arise with the necessary extrapolation steps between species and for difference in body size, with inadequate data, with selection of relevant parameters, and with the judgement of the severity of the observed effect. Variability, on the other hand, is a consequence of the distribution of exposure, of susceptibility to toxic effects in the population due to age, development, sex, disease, or genetic heterogeneity in homeostatic or metabolic pathways. This variability can contribute significantly to the overall uncertainty of the risk assessment process if not taken into account e.g. by validated mathematical modelling. Both the uncertainty due to data deficiencies and the uncertainty due to variability are covered by the application of uncertainty factors (UF) in the risk assessment. 1 Types of uncertainty Uncertainties accompany all steps of the risk assessment process: hazard identification, dose–response assessment, intake assessment, and hazard characterisation. The qualitative and quantitative descrip-tion of the uncertainties encountered at the different steps of the assessment procedure is part of the risk characterisation.
In general, the two categories of uncertainty are
a) those due to limitations of the database and b) those due to uncertainties in extrapolations—for example, the extrapolation of findings from
test animals to humans or from average humans to sensitive subgroups. These relate to the validity of judgements/decisions.

A Model for Establishing Upper Levels of Intake for Nutrients and Related Substances
124
There are established guidelines for the extent and design of toxicity studies necessary for the approval of a chemical, such as a food additive or a pesticide, onto a positive list (SSC, 2000). Moreover, some consensus exists on the use of uncertainty factors to allow for deficiencies in the database, such as the absence of a NOAEL or of chronic studies in animals (SSC, 2000). However, no such agreement exists for the assessment of risks to humans in connection with nutrients. In addition, human studies with nutrients often have limitations: generally, they are performed either in a group of healthy volunteers or in groups at risk of or afflicted with certain diseases, comprise mostly a restricted age group or one sex only, and are often of short duration. The restricted data gathered from such studies are subject to the uncertainty described under b) above with respect to extrapolation to the average human and to age groups that have not been tested.
Extrapolation from data derived from studies done in animals to humans normally is per-formed by applying an uncertainty factor (safety factor) of 100 to a No Observed Adverse-Effect Level (NOAEL) identified in the most sensitive animal species. This factor of 100 is composed of a factor of 10—to allow for differences between the animal and an average human—multiplied by a factor of 10 to allow for differences between average humans and sensitive subgroups (WHO, 1987). Although the use of these uncertainty factors has been reviewed and validated for the risk assessment of chemicals by numerous authors (SSC, 2000), their routine application in the risk assessment of nutrients is not possible. Toxicity of some nutrients has been observed in test animals at dose levels (expressed in mg/kg of body weight/day) that are close to or only slightly above the nutritional need. The acceptable range of oral intake (AROI) of an essential nutrient is represented by a trough in the U-shaped dose–response curve that spans requirements for essentiality to toxic levels (Figure A3-1).
Figure A3-1: Percentage of the population at risk of deficiency and toxic effects through oral intake of a nutrient
(modified from IPCS, 2002)
The normal physiological range of intake, in which homeostatic regulatory mechanisms are sufficient, is between the lower margin (point A in Figure A3-1), which usually is equivalent to the recommended daily allowance (RDA; defined as the intake at which 2.5% of the population under consideration are at risk of deficiency) and the higher margin (point B in Figure A3-1), which ideally is the benchmark dose (BD) at which 2.5% of the population will be at risk for minimal adverse effects. In the absence of sufficient data on dose–response relationships and on homeostasis, a UL often is used to set the higher margin of the AROI (IPCS, 2002). The breadth and location of the trough on the dose–response curve are subject to the variability in populations both for requirement

Annex 3
125
and for the susceptibility to the toxicity. The distribution of the nutrient requirement and of the risk of toxicity in a population is depicted schematically in Figure A3-1.
The routine use of the uncertainty factors employed for the setting of a tolerable upper limit for a chemical is not appropriate in the case of essential (indispensable) nutrients. It can result in a tolerable upper intake level that is less than the nutritional requirement. Therefore, keeping one’s intake less than the upper intake level could create a risk of nutrient deficiency. In the risk assessment of nutrients, the possibility of a potential adverse effect due to nutrient deficiency must, therefore, be taken into account (Renwick et al., 2004). However, the definition of both nutrient requirements and beneficial effects of nutrients is outside the scope of the task of this working group.
An uncertainty factor is “a product of several single factors by which the NOAEL or LOAEL of the critical effect is divided to derive a tolerable intake (TI or UL). These factors account for adequacy of the pivotal study, interspecies extrapolation, interindividual variability in humans, adequacy of the overall database, and nature of toxicity. The term uncertainty factor was considered to be a more appropriate expression than safety factor since it avoids the notion of absolute safety and because the size of this factor is proportional to the magnitude of uncertainty rather than safety. The choice of UF should be based on the available scientific evidence” (IPCS, 1994).
In summary, uncertainty is even greater in the case of assessment of risks for human health posed by the consumption of nutrients than it is in the risk assessment of chemicals or of contam-inants. For the latter substances, systematic toxicity data usually exist from animal and/or in-vitro experiments, and standard approaches have been developed to address uncertainty (SSC, 2000; IPCS, 2002). 1.1 Hazard identification Crucial in the hazard identification process is the recognition of one or more potential adverse effects, of relevance to human health, that may be associated with exposure to a nutrient. If a nutrient presents more than one hazard to human health, a risk assessment for each hazard may be required. An adverse effect is: “a change in morphology, physiology, growth, development or life span of an organism which results in impairment of functional capacity or impairment of capacity to compensate for additional stress or increase in susceptibility to the harmful effects of other environmental influences. Decisions on whether or not any effect is adverse require expert judgement” [emphasis added] (IPCS, 1994; SSC, 2000).
A decision about the adversity of an observed effect has to be made. That is, it is necessary to differentiate between adaptive and truly adverse reactions (Dybing et al., 2002). Observed effects of high nutrient intakes can range from biochemical effects (e.g. enzyme activity) without functional significance to clinical effects that signify irreversible impairment of organ function. A possible ranking of indicators of adverse effects has been given by Renwick et al. (2004):
Biochemical changes within the homeostatic range and without indication of adverse sequelae
↓ Biochemical changes outside the homeostatic range without known sequelae
↓ Biochemical changes outside the homeostatic range that represent a biomarker of
potential adverse effects due to excess ↓
Clinical symptoms indicative of a minor but reversible change ↓
Clinical symptoms of significant but reversible effects ↓
Clinical signs indicative of significant but reversible organ damage ↓
Clinical signs indicative of irreversible organ damage.
A Model for Establishing Upper Levels of Intake for Nutrients and Related Substances
126
Biochemical effects without functional significance should not be regarded as adverse effects (IPCS, 2002). Scientific judgement is required to decide where precisely to locate the adversity of an effect in the ranking.
However, with some nutrients, observed effects can be difficult to categorise as either bene-ficial or adverse. In the case of biotin, for instance, the administration during three weeks of 2100 μg/day (i.e. >40-fold the adequate intake) to healthy adults resulted in the increased expression of 139 genes and the decreased expression of 131 genes in ex-vivo cultured peripheral blood mononuclear cells. There was a substantial increase in the expression of the gene encoding cytochrome P450 1B1, which activates procarcinogens and promutagens (Wiedmann et al., 2004). Pharmacological concen-trations of biotin in the culture medium of NCl-H69 small cell lung cancer cells increased the expression of oncogenes (Scheerger and Zempleni, 2003). Currently, there is not a clear basis for a judgement of whether such findings are of relevance to human health and represent either a positive or negative effect. Biotin was considered not to cause adverse effects in humans by either the IOM (1998) or the SCF (2001).
Chemical hazards usually are identified from a series of in-vitro or in-vivo animal studies that are designed to address different endpoints or target systems and that follow established guidelines for the conductance of such studies (Barlow et al., 2002). With some limitations, the same study guide-lines can be applied to nutrients. Because the margin between the level of nutrient requirement and the level of nutrient toxicity may be narrow, for example, nutrient doses may need to be spaced more narrowly. Both the different bioavailability and the different toxicity of different forms of nutrients must be taken into account, as well as the method of exposure (diet, drinking water, by gavage as a bolus, or parenterally) and the relevance of such studies for human toxicity. The administration of high nutrient doses to test animals may have secondary effects on other nutrients, e.g. their bioavail-ability, that would not be observed in humans. Some animal models are inappropriate for the risk assessment of nutrient toxicity in humans, either because absorptive or metabolic functions are differ-ent or because adverse effects in humans, e.g. neurobehavioural effects or allergic reactions, cannot be elicited adequately in animals, (Barlow et al., 2002; Renwick et al., 2003).
For some nutrients (e.g. preformed vitamin A from liver, fluoride or copper from drinking water), excessive intakes via conventional foods are known to cause adverse health effects in healthy or susceptible persons. For many nutrients, however, the question of adverse effects has arisen only with increasing food fortification measures or the intake of food (dietary) supplements. In some instances, these practices have increased nutrient intakes to levels far above those possible from the consumption of conventional foods.
Human data are preferable over animal data in identifying hazards and in the assessment of risks to human health from exposure to nutrients. But hazard identification for nutrients in humans often has to rely on observational reports of single cases or on the reporting of adverse effects from intervention or therapeutic studies performed with the goal of proving a benefit from the adminis-tration. Even in well-conducted randomised placebo-controlled interventional studies, several factors are likely to cause uncertainties about the relevance of such studies for the assessment of nutrient toxicity: typically only one nutrient dose level is tested, the additional intake from the diet is not reported, and reporting of adverse effects is not systematically performed.
The establishment of causality between reported effects and the administered nutrient is another source of uncertainty, even when applying the Bradford-Hill criteria (1965). Factors such as selection of the study group according to sex, age, (risk of) disease, genetic variability or other inclusion or exclusion criteria raise uncertainties about the applicability of the data to the average human.
All adverse health effects identified in appropriate animal studies should be qualitatively described, along with the nature of those effects (Barlow et al., 2002). It is advisable to collect, organise and evaluate all information pertaining to the capacity of a nutrient to cause one or more types of adverse health effects in humans (Renwick et al., 2004). Uncertainty in hazard identification can to some extent be minimised by a-priori application of a strictly structured approach (as outlined in Discussion Paper 1, “An Evidence-based Approach to Nutrient Hazard Identification”). Such an

Annex 3
127
approach is based on a comprehensive search of data from human, animal and in-vitro studies, rank-ing of the evidence according to strength and statistical significance, and detailed explanation of the judgements made in identifying hazards. 1.2 Dose–response assessment 1.2.1 Exposure assessment Exposure assessment is part of the risk assessment and is needed for the dose–response evaluation and for the risk characterisation. A qualitative and quantitative description of the likely levels and the duration of the exposure to the risk source or sources is necessary. The nature and size of the human populations and the routes, magnitude, frequency and duration of exposure are included in the assess-ment (see Discussion Paper 3, “Estimating the Distribution of Usual Nutrient Exposures in Popula-tions”).
In the case of nutrients, an evaluation of the total exposure to a specific nutrient—predom-inantly oral intake from food, beverages, water, and supplements and, eventually, from drugs—must be performed in addition to the test doses of the same nutrient administered in experimental studies. The variability and distribution of the background dietary intake of the tested nutrient can introduce considerable uncertainties in the dose–response assessment.
Food consumption data for populations usually are gathered from observational protocols, not in an experimental controlled setting. They correspond to a crude estimate of intake, and their validity depends on the assessment methodology. Nutritional habits and food choices can be assessed reliably on an individual basis. For populations, the distribution curve of the exposure does not permit the estimation of the exposure for high percentiles of the curve (high consumers) or for special groups at risk due to variability in sensitivity (Kroes et al., 2002).
Food composition data banks of different origins, which are used to calculate nutrient intakes on the basis of food consumption data, vary in precision and completeness. They may lack data about some processed foods and meals and certain nutrients. Missing parameters for certain nutrients do not necessarily signify absence of the nutrient. Instead, they may be due to low analytic sensitivity. Changes in nutrient content due to the preparation of a food and differences due to degree of ripeness, selection of plant cultivars/animal strains, climatic and geographic influences and storage are possible and will have an impact on the precision of the estimation of the nutrient intake. The quality of food composition data banks is, moreover, dependent on the number of samples analysed and the sensi-tivity and validity of the methods of analysis. Results can vary between different laboratories. The data should include means and/or medians and ranges or percentiles to enable the calculation of the potential distribution of the nutrient intake from a food.
Apart from true total diet studies in which duplicates of food consumed are analysed, all intake calculations and most quantitative food consumption assessments contain some degree of uncertainty that can result in both under- and overestimation of intake. A careful evaluation of the quality of the exposure data will decide on the necessity and magnitude of adjustments.
When different forms of a nutrient differ in bioavailability, i.e. “the fraction of the dose that is transferred from the site of administration into the general circulation as the parent compound” differs (Renwick, 1993a), the estimated external dose of exposure to a nutrient (intake) ideally should be adjusted by the assessment of a biomarker of exposure (e.g. the daily excretion into the urine of a specific metabolite or the steady-state blood concentration of the nutrient). That would decrease uncertainty of the exposure assessment and consequently of the dose–response assessment (Kroes et al., 2002). However, this possibility is limited in the case of some nutrients, such as vitamins A, E, and D and copper and zinc, for which simple biomarkers of exposure determined in urine and/or blood do not exist. 1.2.2 Identification of the dose with/without adverse effect After having identified one or several hazards (endpoints), the relevant critical data sets from animal and human experimental or epidemiological studies must be selected that allow the identification of

A Model for Establishing Upper Levels of Intake for Nutrients and Related Substances
128
1) no-observed-adverse-effect levels (NOAEL) or, if not available, 2) lowest-observed-adverse-effect levels (LOAEL), or 3) the definition of a benchmark dose (BD), which seldom is used in the risk assessment of nutrients.
The NOAEL is the highest intake of a nutrient at which the adverse effect(s) of concern has (have) not been observed. It is identified from the dose–response data for the critical effect, usually the effect of relevance to humans that is produced at the lowest dose levels.
If the data are not adequate to demonstrate a NOAEL, then a LOAEL (the lowest intake at which an adverse effect has been demonstrated) may be used (Renwick et al., 2004). If different adverse effects have been observed for a nutrient, the NOAELs and LOAELs for these different endpoints can differ. The NOAEL corresponding to the lowest dose for eliciting an adverse health effect is chosen to identify the critical effect and then used for the derivation of a tolerable upper intake level (UL).
The identification of both a NOAEL and a LOAEL is affected by a number of uncertainties related to the quality of the animal study (sensitivity of the toxicological endpoint and the methods used to measure it, the size of the group studied, the increment between doses) and the steepness of the dose–response curve. These factors are decisive for the NOAEL to represent the true no-adverse-effect-level (NAEL) (Renwick et al., 2003). A concept of a threshold for a response is the basis for the identification of both a NOAEL and a LOAEL. From a biological perspective, a threshold should be seen as a certain dose range, above which a substantial change in response may occur, and one that takes into account the variability in homeostatic regulation within the population. Another factor that can have an impact on the dose threshold is the length of exposure to a nutrient. Chronic exposure to dose levels that do not elicit an adverse effect on short-term exposure can lead to accumulation in the body or at the cellular level and induce a toxic response when a critical level is surpassed (Dybing et al., 2002). NOAELs and especially LOAELs are, as a rule, imprecise because they depend on the study design: that is, the group size, the sensitivity of the detection method, and the spacing of the doses given.
The benchmark dose approach takes into account the entire dose–response curve and the variation in response within the studied population. The U.S. Environmental Protection Agency (EPA) has introduced a benchmark dose level as “a statistical lower confidence limit for a dose that produces a predetermined change in response rate of an adverse effect ... compared to background”. A regression function is fitted on the response data to estimate the dose at which adverse effects start to arise or at which a specified percent change in the level of the chosen endpoint occurs, e.g. an increase of 2.5%, 5%, or 10% over background (BD2.5, BD5 or BD10). A statistical lower bound, often the 95% lower bound on the dose, is used to account for statistical uncertainties. This lower bound is called the benchmark dose lower confidence limit (LBMD) or simply the benchmark dose (BD). The BD may be used for the development of an intake limit, e.g. a UL, by applying uncertainty factors (Crump, 1984; Edler et al., 2002; IPCS, 1994; 2002).
Figure A3-2, adapted from IPCS (2002), illustrates the principle of the benchmark approach in relationship to NOAELs and LOAELs.
In this figure, BMD2.5 is the benchmark dose at which 2.5% of the individuals experience an adverse effect over the background level. LBMD2.5 is the lower 95% confidence interval of the BMD2.5, i.e. the dose at which no more than 2.5% of the individuals experience the adverse effect estimated with 95% certainty. The position of the NOAEL and the LOAEL also are indicated in Figure A3-2. UF1 is the uncertainty factor applied to the NOAEL for deriving a UL (tolerable upper intake level), and UF2 is the uncertainty factor applied to the LBMD2.5 to derive the upper bound of the AROI. When an LMBD cannot be calculated, the upper bound of the AROI can be considered to be represented by the UL. Assumptions have been made that the BD of a chemical calculated from the lower 95% confidence limit for a 10% increased risk (BD10) is comparable to the LOAEL and that the BD derived on the basis of an increased risk at 5% (BD5) corresponds to the NOAEL. However, more recent data analyses indicate that the BD10 is closer to the NOAEL (Herrman and Younes, 1999). It is not known if this applies also to nutrients.

Annex 3
129
Figure A3-2: Theoretical representation of the lower part of the dose–response curve for an adverse effect in a
population with the upper 95% of confidence limit of response (modified from IPCS, 2002)
The benchmark approach has been used rarely in the risk assessment of nutrients, because the available data must be suitable for modelling and measurements at three or more dose levels are required. The approach has been used to explore the relationships between drinking water fluoride, urine fluoride, and serum fluoride and dental fluorosis in Chinese children from two villages with six categories of fluoride content in drinking water. The LBMD for the prevalence of dental fluorosis was found to be 1.01 mg fluoride/L (Xiang et al., 2004). The data from the studies of Dean et al. (1942) on the relationship between dental fluorosis in 12- to 14-year-old children and the fluoride content of their drinking water also lend themselves to benchmark modelling.
The three graphs in Figure A3-3 show benchmark dose modelling with the data of Dean et al. (1942). These graphs illustrate clearly how the decision on the endpoint influences the result. The study of dental fluorosis included 4429 children between the age of 12 and 14 years from 13 cities with different fluoride concentrations in the drinking water (0.09 to 2.55 mg/L). The fluoride concen-tration in the drinking water is used as a surrogate for the fluoride intake, because at that time drinking water was the main source of fluoride. Dental fluorosis was divided into seven degrees of severity: normal, questionable, very mild, mild, moderate and severe. The investigators considered the first two grades not to represent fluorosis. Following this judgement (Figure A3-3a), the LBMD is determined as 0.559 mg fluoride/L. When dental changes of the grades of mild and more are considered to represent the adverse effect, the LBMD is 1.499 mg fluoride/L (Figure A3-3b), and it is 2.205 mg/L when only changes graded as moderate and more are taken to be critical (Figure A3-3c).
Other methods for a quantitative dose–response analysis, such as categorical regression for non-cancer toxicity, or dose–response extrapolation to provide a quantitative risk estimate for non-threshold effects, or probabilistic approaches to derive tolerable intake levels or physiologically-based toxicokinetic ((PBTK) modelling to evaluate target organ doses following exposure to a substance by any route (Edler et al., 2002) have not been used in the risk assessment of nutrients as yet.
NOAELs, LOAELs and BMDs are adjusted for differences and variabilities in the suscep-tibility of individuals within and between species and for uncertainties in the data sets by numerical values called “safety factors”, “default values”, “uncertainty factors”, “assessment factors” or “correc-tion factors”. The lower the degree of confidence in the scientific basis of the data and the greater the gaps in knowledge of the differences in kinetic and dynamic functions in different species, the greater the uncertainty factors to be chosen will have to be.

A Model for Establishing Upper Levels of Intake for Nutrients and Related Substances
130
Figure A3-3a
Figure A3-3b

Annex 3
131
Figure A3-3c Figure A3-3: Benchmark dose approach to define the fluoride concentration in drinking water associated with a 5% increase of risk for three different degrees of severity of dental fluorosis in children (data from Dean et al., 1942). a) the 95% benchmark dose lower confidence limit is 0.559 mg fluoride/L for dental fluorosis of degree > questionable according to Dean; b) the LBMD0.5 is 1.499 mg fluoride/L for dental fluorosis of degree > mild according to Dean; c) the LBMD0.5 is 2.205 mg fluoride/L for dental fluorosis > moderate according to Dean
(Probit Model Rev. 2.1) The uncertainties to be taken into account include:
• Problems in estimating total exposure to a nutrient from all sources, especially in human epidemiological studies but also in intervention studies, lack of quantification of (dietary) intake in addition to the study dose. These uncertainties apply to both the modelling systems used and the reliability of analytical measurements of exposure markers;
• Problems of reliability of data due to study design, conductance of the study and statistical evaluation: too small and too short studies; selection of a particularly sensitive or insensitive study population; insufficient assessment of compliance and of adverse effects as opposed to the expected beneficial effects;
• Insufficient availability of data: animal and/or in-vitro data only; one dosage studies as compared to multiple dose studies;
• Differences in bioavailability of different forms of the test substance and the influence of food matrices on bioavailability;
• Influence of age, sex, genetic polymorphisms, or medication;
• Biological mechanisms causing the observed adverse effect;
• Relevance of data on the nature of an adverse effect gathered in animals for humans;

A Model for Establishing Upper Levels of Intake for Nutrients and Related Substances
132
• Gaps in knowledge of the variability in kinetics and dynamics of a nutrient between species;
• Clinical significance of observed/measured effects and reversibility of effects.
2 Dealing with uncertainties 2.1 Chemicals 2.1.1 Extrapolation and adjustment for uncertainty of data Methods of dealing with uncertainties in connection with identified risks from chemical or environmental hazards to protect public health by defining “safe”, “tolerable” or “acceptable” daily intakes (ADI) for non-carcinogenic substances were suggested 50 years ago. Lehman and Fitzhugh (1954) first proposed ADIs for additives and contaminants to be derived from a chronic animal NOAEL (or NOEL = no effect level) in mg/kg diet by dividing the NOAEL by 100. This factor was to account for both interspecies (animal → human) differences and intraspecies variability in sensi-tivity. This approach was adopted also for pesticide residues by the WHO Expert Committee for Pesticide Residues (Lu, 1979). One 10-fold factor is applied to convert a sub-threshold dose in mg/kg body weight/day for a population of test animals to a sub-threshold dose for average humans, whereas the second 10-fold factor is supposed to convert the dose for a group of average humans to a sub-threshold dose for sensitive individuals.
The overall adequacy of the factor of 10 for both interspecies and intraspecies variability was justified by subsequent reviews of numerous experimental data (Dourson and Strara, 1983; Calabres, 1985; Hattis et al., 1987; Sheehan and Gaylor, 1990; Lewis et al., 1990; Renwick, 1991; Calabrese et al., 1992; Naumann and Weideman, 1995; Dourson et al., 1996; Renwick and Lazarus, 1998), including children (Dourson et al., 2002).
Additional uncertainty factors ranging between 2 and 10 have been proposed to adjust for deficiencies in the database (Beck et al., 1993; IPCS, 1994; Vermeire et al., 1999):
• a factor between 3 and 10 when only a LOAEL is available; • an uncertainty factor between 3 and 10 for extrapolation of a subchronic NOAEL to a chronic
NOAEL when data from two animal species are available; • an additional factor of 2 when only one animal species has been tested.
Figure A3-4 schematically represents the application of different uncertainty factors when
deriving a UL from a NOAEL or LOAEL. Because the individual uncertainties have been deemed to be independent of each other, the
overall uncertainty factor is the product of multiplying all the individual uncertainty factors (Dourson and Stara, 1983). This total independence of uncertainty factors has been questioned (Calabrese and Gilbert, 1993). The choice of the magnitude of additional uncertainty factors requires scientific judge-ment on the strength of the available evidence (Dourson et al., 1996). The reasoning for the decision should be clearly and explicitly described in order to avoid the impression that additional uncertainty factors are policy driven. Uncertainty factors greater than 10,000 should not be applied, because they would signify an insufficient database for a reliable risk assessment (IPCS, 1994).
Figure A3-5 (taken from SCC, 2000) illustrates the different uncertainty factors applied by different agencies to establish acceptable levels of human exposure to chemical, environmental or microbiological agents based on animal databases. The factors shown with continuous lines are those usually used in the EU for the assessment of food additives and pesticides. Other factors may be used for other types of chemicals, e.g. contaminants, and by authorities and bodies outside the EU. The lower part of Figure A3-5 illustrates that extra factors can be applied to address the severity of the effects, such as teratogenicity or non-genotoxic carcinogenicity for risk management reasons. An example of the latter is the protection of special subgroups, such as infants and children, under the Food Quality Protection Act (FQPA) in the United States.

Annex 3
133
Inci
denc
e of
adv
erse
eff
ect
100%
intake (mg/kg/day)
LOAEL
UF1
UF2
NOAELUL
Figure A3-4: Schematic representation of the derivation of a UL from a NOAEL or LOAEL
by applying different uncertainty factors (UF1 or UF2)
Figure A3-5: Schematic representation of uncertainty factors applied to establish acceptable levels
of human exposure based on data derived from animal studies 2.1.2 Replacement of default uncertainty factors The 10-fold factors to adjust for interspecies and intraspecies differences are applied to a wide variety of compounds regardless of their structure and metabolic fates. They also are applied to different effects on organs of different species regardless of differences in kinetic and dynamic processes among species. Although the overall adequacy of these factors has been ascertained, they should be replaced by more specific factors that account for both kinetic and dynamic aspects of a compound in different species when such knowledge becomes available (Renwick, 1991; 1993b).

A Model for Establishing Upper Levels of Intake for Nutrients and Related Substances
134
It was proposed to divide each of these 10-fold factors into two components for the separate evaluation of differences in toxicokinetics and toxicodynamics. Toxicokinetics include the considera-tion of the rate and extent of absorption of a substance; its distribution, rate and pathway of bioactiva-tion; and its rate, route and extent of elimination. Toxicodynamics consider the toxic entity (either parent compound or metabolite) and its molecular target and the sensitivity of the target tissue as well as activating, protective or repair mechanisms. The interspecies differences in toxicokinetics generally are greater than toxicodynamic differences and can be attributed, in part, to differences in body weight. A generic kinetic default factor of 4.0 (100.6) was proposed in the absence of compound-specific data, which would be multiplied by a default factor of 2.5 (100.4) to give the interspecies factor of 10. The 10-fold factor for intra-human variability can be divided in a similar manner to allow for variability in kinetic and dynamic processes as a default value for compound-specific data (Renwick and Lazarus, 1998).
The International Programme on Chemical Safety (IPCS, 1994) has adopted these principles with the modification that the uncertainty factor of 10 for intraspecies variability be divided evenly into 3.16 (100.5) for both kinetics and dynamics. This modification is supported by data for the kinetics of 60 compounds in humans (Renwick and Lazarus, 1998). Sensitive humans are those with kinetic and dynamic characteristics such that their internal dose on exposure (kinetics) is >3.16-fold away from the population mean and their individual internal dose threshold for response is >3.16-fold lower than the population mean (Renwick, 1999). The prevalence of individuals in a population who would not be covered by the standard default factors for kinetics and dynamics depends on the variability of the distribution of the relevant parameters.
The ultimate uncertainty factor applied for interspecies and intra-human variability will be the result of the multiplication of the compound-specific factors for kinetics and dynamics, if available from animal and human data, respectively. Such a factor could be named a correction factor (Edler et al., 2002) or an adjustment factor (IPCS, 2002) instead of uncertainty factor. 2.1.3 Adjustment for body weight—scaling Quantitative extrapolation is part of the establishment of upper levels. It involves two steps. The first step adjusts for differences in body size between test animals and humans. The second step involves the application of uncertainty factors to compensate for data deficiencies and inter- and intraspecies variability in sensitivity. An additional quantitative extrapolation step is necessary when the UL was established for one particular age group only and needs to be adjusted (scaled) for other age groups. 2.1.3.1 Adjustment for body size between animal and humans An adjustment for differences in body size between experimental animals and humans can be done on the basis of body weight, energy requirement, and body surface area. In all three cases, body weight is used as the starting point, taken either to the power of 1, 0.75 or 0.67 for scaling according to body weight, “metabolic” body weight or (basal) metabolic rate, or body surface area, respectively.
The simplest approach is scaling on the basis of body weight (isometric scaling). This approach assumes that biological parameters show a linear correlation with body weight (Davidson et al., 1986). Quantitative interspecies differences in physiological processes, organ perfusion, and clearance also influence interspecies relationships based on body weight (Renwick, 1991; 1993b). The human NOAEL derived from a NOAEL for a rat on the basis of body weight scaling will be 4-fold to 6.5-fold higher than when adjustment is done on the basis of metabolic rate or body surface area (Feron et al., 1990).
The relationship between body weight and body surface area differs among species, and this difference is covered by the proposed interspecies uncertainty factor of 10. The general rule for determining equivalent doses in animals and humans was developed in pharmacological investiga-tions: namely, the capacity of elimination of metabolisable agents with slow induction of toxic actions is proportional to metabolism, i.e. with body surface area or with body weight 0.75. Therefore, doses in mg/kg body weight determined in mice, rats, and beagles could be divided by 8.4, 4.6, and 1.6, respectively, to arrive at the equivalent dose for a 60-kg man (Zielhuis and van der Kreek, 1979).

Annex 3
135
Biologic responses like absorption, plasma protein binding, and biliary excretion are independent of body weight. They correlate better with body surface area, which can be calculated from body weight 0.67 (Calabrese et al., 1992). Alternatively, the animal dose in mg/kg body weight can be adjusted by a factor that is calculated as the cubic root of the average human body weight (e.g. 60 kg) divided by the weight (w) of the experimental animal:
These adjustment factors vary between 2 for dogs and 13 for mice (Dourson and Stara, 1983).
This allometric scaling method can lead to inaccurate results in cases for which the specific metabolic profile of a compound does not correlate with the overall metabolic rate of the animal and, therefore, not with the surface area either (Dybing et al., 2002). This is conceivable with nutrients that are targeted to particular organs of the body for storage or specific metabolic functions.
An alternative allometric scaling to correct intake doses for differences in body size is based on caloric demand. The basic assumption is that the basic metabolic rate (BMR) across species is a function of body weight 0.75. A proportionality of the BMR to body mass 0.66—that is, to body surface area—was reported in the 1880s (Rubner, 1883). In the 1930s, the relationship between BMR and body mass was reported to scale with a significantly greater exponent of 0.75 (Kleiber, 1932; 1947). The discussion about the correct exponent is ongoing (White and Seymour, 2003; West et al., 1997; 2002); it appears to be between 0.6 and 0.8 (Rucker and Storms, 2002). This scaling method allows for species differences in many physiological functions (including rates of cellular metabolism) (West et al., 1997) and takes into account interspecies variabilities in toxicokinetics (Vermeire et al., 1999). The use of adjustment factors derived from body weight 0.75 for scaling from animal to human NOAELs, instead of the conventional 10-fold factor, may provide a justifiable contribution to reducing the size of the overall uncertainty factor.
Two other possibilities of scaling exist: those based on functional activity (lifespan differences between species) for extrapolation of long-term cancer assays in animals and humans; and those based on multiple species regression—for which, however, adequate data from at least four species are required for the estimation of the equivalent dose in humans (Dybing et al., 2002). 2.1.3.2 Adjustment (scaling) of the UL to different age groups In the risk assessment of nutrients, data for subgroups other than adults are scarce. Scaling of the UL for adults according to body size, body surface area, and caloric requirement (i.e. metabolic body weight equivalent to body weight 0.75) is a possibility. However, a model based on knowledge of differences in physiology and toxicokinetics between (young) children and adults would be prefer-able.
Scaling according to body weight (ULchild) = (ULadult) (weightchild / weightadult) is the easiest way; but it does not take into account intermediary metabolic rates, caloric intake, and BMR. The ULs extrapolated in this manner are consistently smaller than ULs scaled by surface area or body weight 0.75. This means that ULs derived from scaling based on body weight potentially are smaller than necessary.
Scaling on the basis of body surface area or body weight 0.75
(ULchild) = (ULadult) (weightchild / weightadult)0.75
will result in larger UL values than scaling according to body weight. This is illustrated by a com-parison of the ratios of the adult weight or adult surface area to the weight and surface area of children1 at different ages, shown in Table A3-1.
1 Note that the ratios shown in the table show the inverse of the ratios shown in the formula.
w603

A Model for Establishing Upper Levels of Intake for Nutrients and Related Substances
136
Table A3-1. Comparison of ratios of adult weight or adult surface area to that of a child, by child’s age
Age Adult weight Child weight
Adult surface area Child surface area
birth 21.2 9.1 0.5 years 9.7 5.4 1 year 7.3 4.3 10 years 2.2 1.7
The difference between the scaling methods becomes smaller with increasing age. If scaling
according to body weight 0.75 is accepted as the preferable method for adjustment of animal NOAELs to human NOAELs, then adjustment on the basis of body weight 0.75 within humans of different size is logical. However, such an adjustment does not take into account differences in adaptive and homeo-static mechanism among the nutrients with regard to absorption and elimination. A justification is needed based on scientific evidence for the choice of one or the other of the two scaling methods for a particular nutrient. 2.2 Nutrients The risk assessment of nutrients follows the general principles of risk assessment with the restriction that the derived tolerable upper intake level (UL) “judged to be unlikely to pose a risk of adverse health effect to almost all individuals in the general population” (SCF 2000) must not be lower than the nutritional requirement or the recommended intake. This restriction will influence the choice of uncertainty factors to correct for inter- and intra-species variability and for deficiencies in the available databases. NOAELs or, in the absence of appropriate data, LOAELs should be derived from human studies if possible. If they are identified from studies in animals, the relevance of observed adverse effects for humans must be evaluated.
Several institutions, authorities, or authors have undertaken systematic risk assessments of nutrients according to protocols they have developed and published. Some of them are described briefly in the following paragraphs, by year of publication. Four are summarised in Appendix 1 of this discussion paper. 2.2.1 Conseil Supérieur d’Hygiène Publique de France, 1995 All vitamins and the minerals zinc, iron, selenium, and fluoride were assessed. A review of the literature was undertaken to identify NOAELs or LOAELs from human and animal studies. The documented doses of a nutrient in studies were ranged according to magnitude and adverse effects observed: NOAELs or LOAELs were identified. Both NOAELs and LOAELs identified from human studies were divided by a safety factor of 10 to derive a “safety threshold dose” for intake in addition to the intake from a normal diet. In exceptional cases, where the safety threshold dose calculated in this way would be lower than the recommended daily allowance (RDA), this recommended dose was chosen as the safety threshold dose. 2.2.2 Food and Nutrition Board, Institute of Medicine, National Academy of
Sciences USA, 1997–2004 Since 1997, when the first report on Dietary Reference Intakes for calcium, phosphorus, magnesium, vitamin D, and fluoride was published by the Institute of Medicine (IOM, 1997), all other vitamins and indispensable (and some non-indispensable) minerals were evaluated and the results published. As part of the task, “Tolerable Upper Intake Levels” (UL), i.e. “the highest level of daily nutrient intake that is likely to pose no risk of adverse health effects to almost all individuals in the general population”, were derived.
Annex 3
137
Reviews of observational and experimental studies published mostly in peer-reviewed jour-nals and analysis of the evidence were performed; scientific judgement was used to determine the basis for establishing values. The possibility was considered and rejected that the methodology used to derive ULs might be reduced to a mathematical model that could be generally applied to all nutrients. A standard risk assessment procedure was followed for each nutrient individually, and two types of uncertainty were acknowledged: those related to data and those associated with inferences that are required when directly applicable data are not available. In the risk characterisation, scientific uncertainties associated with both the UL and the intake estimates were described.
ULs were preferably derived from identified NOAELs, taking into account causality, rele-vance of experimental data (animal versus human, route of exposure, duration of exposure), mech-anism of toxic action, quality and completeness of the database, and the identification of distinct and highly sensitive subgroups.
In the dose–response assessment, human data were preferred over animal data, and the routes and durations of exposure chosen were those most relevant for a toxic response in humans. The choice of uncertainty factors was determined by scientific judgements on the interindividual variation in sensitivity (between 1 and 10); for extrapolation from animal data to humans (up to 10); for using a LOAEL in the absence of a NOAEL, taking into account the severity and incidence of the adverse effect and the steepness of the dose–response (up to 5); and to correct for a subchronic NOAEL in the absence of a chronic NOAEL.
ULs were derived for the age categories for which the data were available. When data were not available on children and adolescents, ULs were determined by extrapolating from the UL for adults based on body weight differences using the formula:
ULchild = (ULadult) (weightchild / weightadult),
except in the case of niacin, vitamin B6, folate, and choline, for which a formula based on metabolic size was used:
ULchild = (ULadult) (weightchild / weightadult)0.75. 2.2.3 Scientific Committee on Food/European Food Safety Authority, 2000–2005 The framework of general principles for evaluation of the adverse effects of micronutrients in humans and for establishing upper levels of intake that are unlikely to result in adverse effects in the general population was formulated as a guideline in 2000. It was based on available reports in the literature.
ULs were stated not to be recommended levels of intake; but they were to apply to the general population throughout the life stage (excluding those receiving the nutrient under medical super-vision), including sensitive individuals. However, certain identifiable subgroups (e.g. those with gen-etic predisposition or certain disease states) were to be excluded while evaluating each nutrient. To the extent possible, ULs for age and life-stage groups were set. The usual steps of risk assessment were followed. Uncertainties in the database were to be described in the risk characterisation.
Scientific judgement was applied on the adversity of an effect and on the causality between nutrient and effect, the relevance of experimental data, and the mechanisms of adverse effects. Selec-tion of data was to give preference to human data, and, in the absence of human data, to the animal species with biological responses most like those of humans and with the most relevant route of expo-sure.
Low uncertainty factors were chosen with higher quality data and for adverse effects that are extremely mild and reversible. Uncertainty factors were applied for interindividual variation and sensitivity (between 1 and 10); for extrapolation from animal to human; for LOAEL to NOAEL (dependent on the slope of the dose–response curve); and for a subchronic NOAEL to a chronic NOAEL.
If no data were available to derive ULs for extrapolation to different age groups, it was sug-gested that extrapolations should be made on the basis of known differences in body size, physiology,

A Model for Establishing Upper Levels of Intake for Nutrients and Related Substances
138
metabolism, absorption and excretion. The extrapolation from an adult UL to ULs for children and adolescents was regularly based on body weight differences. Reference weights were given for males and females of nine age groups. Scaling of an adult UL to children was done on a body weight basis for niacin, vitamin B6, folic acid, fluoride, copper, molybdenum, and selenium and on a metabolic body size basis (body weight 0.75) for vitamin A, E, iodine, zinc, and boron.
In those cases where no UL could be established because of insufficient data, the risk charac-terisation included an indication on the highest level of intake where there is reasonable confidence in data on the absence of adverse effects. 2.2.4 Expert Group on Vitamins and Minerals (EVGM, 2003) of the Food Standards
Agency, UK The terms of reference of the expert group were somewhat different from those used by both the IOM and the SCF/EFSA, namely to establish principles on which controls for ensuring the safety of vita-min and mineral supplements sold under food law can be based and to recommend maximum levels of intakes of vitamins and minerals from supplements if appropriate, after having reviewed the levels of individual vitamins and minerals associated with adverse effects. Both animal and human studies were evaluated, including acute toxicity and single dose studies.
No single scheme of risk assessment was considered satisfactory, and each nutrient was assessed individually. Where adequate data were available, safe upper levels (SUL) of lifetime intake of a nutrient by the general population were established both per day and per kg body weight per day (using a reference body weight of 60 kg for adults). In the absence of sufficient data, guidance levels for safe intakes that would not be expected to cause adverse effects were defined. Uncertainty factors were applied for extrapolation from a LOAEL to a NOAEL (usually 3), for database deficiencies (subchronic exposure, few subjects only), and for the severity of the adverse effect. The magnitude of the factors was determined by scientific judgement, taking care to arrive at safe levels above the lower advisory levels of intake.
The following formulas were applied:
SUL (total intake) minus (intake from dietary and other known exposures) = available margin for additional intake exposure from supplements or new sources of fortification;
SUL (supplemental intake) plus (dietary and other known exposures) = estimated SUL (total).
SULs can be applied to children by scaling for body weight or body surface area as appropriate, unless it is specifically indicated that children are particularly vulnerable to the effect concerned or have a greater requirement. 2.2.5 Non-governmental assessment Two reports are mentioned, both of which were both published in 1997 (Hathcock, 1997; Shrimpton, 1997). Both applied the principles of risk assessment to establish safety limits while considering evidence for benefits from intakes of certain nutrients at levels above recommended dietary intakes. 2.2.5.1 Council for Responsible Nutrition (Hathcock, 1997) From a review of the available literature, NOAELs for all vitamins and for calcium, phosphorus, magnesium, chromium, copper, iodine, iron, manganese, molybdenum, selenium, and zinc were iden-tified as well as LOAELs for vitamin A, D, nicotinamide, nicotinic acid, vitamin B6, iron, selenium, and zinc.
NOAELs are proposed to be considered as safe levels of intake, whereas LOAELs are considered to be not safe for everyone: they may require the application of a safety factor to calculate a safe level of intake.
The author suggested that a nutrient safety limit be calculated as an intermediate between the LOAEL and the recommended intake when no NOAEL can be identified.

Annex 3
139
2.2.5.2 European Federation of Health Product Manufacturers Associations (Shrimpton, 1997) The goal was to base the upper safe level of intake from all sources of a vitamin or mineral well below that at which significant adverse effects have been responsibly reported. From a review of the available literature, two types of levels of intake were suggested: an upper safe level of long-term consumption and an upper limit of short-term consumption. With the exception of phosphorus, chro-mium, iron, and manganese, the upper safe levels of long-term consumption are identical to the NOAELs identified by Hathcock (1997). In contrast,the upper limits for short-term consumption suggested for vitamin B6, iron, selenium, zinc are somewhat lower than the LOAELs in the mentioned reference. 2.3 Risk assessments of vitamins and minerals and uncertainty Appendix 1 of this discussion paper contains a summary of the results of the risk assessments described in subsections 2.2.1 to 2.2.4. The appendix illustrates differences in procedure and results, namely:
• in the selection of the database (in some cases to be explained by the non-availability of data at the time of assessment). This applies to vitamin A, vitamin D, vitamin E, niacin (nicotin-amide), vitamin B6, vitamin C, calcium, phosphorus, magnesium, iron, fluoride, manganese, nickel, and zinc. Guidelines on the selection, evaluation and ranking of available data should be developed;
• in the selection of the critical adverse effect. This applies only to calcium, phosphorus, fluoride, and nickel. This is a question of scientific judgement and not easily to be managed by rules;
• in the identification of a LOAEL or NOAEL. This applies to vitamin E, vitamin B6, folic acid, vitamin C, calcium, magnesium, fluoride, iodine, nickel, selenium, and zinc. A structured approach in the form of guidelines can be expected to result in more consistency;
• in the establishment of a UL. This applies to vitamin D, vitamin E, niacin, vitamin B6, magnesium, fluoride, iodine, copper, molybdenum, selenium, zinc, and boron. However, the same database was used at least partially for nicotinic acid, vitamin B6, magnesium, iodine, copper, molybdenum, selenium, copper and boron. Scientific judgement and weighing of the evidence are responsible for these discrepancies;
• in the scaling method chosen to establish specific ULs for subgroups. It is not apparent from the reports on what basis the choice for the scaling method was made. It should be possible to establish a nutrient-specific approach;
• in the selection of uncertainty factors. This applies to vitamin E, vitamin C, iodine, copper, molybdenum, selenium, and boron—even when the same database was used and the same NOAEL or LOAEL was identified
The selection of uncertainty factors by different workgroups is shown for different nutrients
in Table A3-2, and a summary of their number and magnitude appears in Box A3-1. The information in Box A3-1 can create the false impression that the choice was arbitrary, but in each case the deliberations of the different scientific workgroups and the justification for individual uncertainty factors can be found in the report. It cannot be ignored, however, that for some nutrients the choice of an uncertainty factor was driven less by scientific judgement than by aiming for a UL above the recommended intake. Table A3-2 confirms the impression that, especially when ULs are established on the basis of human data, the choice of uncertainty factors is governed by an individual approach.

A Model for Establishing Upper Levels of Intake for Nutrients and Related Substances
140
Tabl
e A
3-2.
Com
paris
on o
f the
use
of u
ncer
tain
ty fa
ctor
s fo
r diff
eren
t nut
rient
s by
diff
eren
t org
anis
atio
ns
Com
posi
tion
of U
F LO
AE
L N
OA
EL
Nut
rient
O
rgan
isat
ion
Hum
an
Ani
mal
H
uman
A
nim
al
UF
LOA
EL
→ N
OAE
L A
nim
al
→ h
uman
S
ensi
tive
subp
opul
atio
n In
trasp
ecie
s va
riabi
lity
Oth
er ju
stifi
catio
n
adul
ts +
5 5
+ se
verit
y of
effe
ct
♀
+
1.
5
1.5
IO
M, 2
001
infa
nt +
10
10
+ re
vers
ible
effe
ct
SC
F, 2
002
+
1
Vita
min
A
CS
HP
F, 1
995
+
?
adul
ts
+
1.
2
un
certa
inty
of d
ata
IOM
, 199
7 in
fant
s
+
1.8
unce
rtain
ty o
f dat
a ad
ults
+
2
2
SC
F, 2
002
0-24
m
+
1
E
GVM
, 200
31
+
1
ad
ults
+
10
Vita
min
D
CS
HP
F, 1
995
<2 y
+
2
IO
M, 2
000
+
36
2 3
3
subc
hron
ic →
ch
roni
c: 2
S
CF,
200
3
+
2
2
E
GVM
, 200
3
+
1
Vita
min
E
CS
HP
F, 1
995
+
10
Vi
tam
in K
E
GVM
, 200
31
+
10
10
Vi
tam
in B
1 E
GVM
, 200
31
+
1
Vi
tam
in B
2 E
GVM
, 200
31
+
10
10
IO
M, 1
998
+
1.5
1.5
re
vers
ible
tran
sien
t ef
fect
N
iaci
n
CS
HP
F, 1
995
+
3
SC
F, 2
002
+
3 3
sl
ight
effe
ct, f
ew
subj
ects
N
icot
inic
ac
id
EG
VM, 2
0031
+
3 3
SC
F, 2
002
+
2
ch
ildre
n →
adu
lts
Nic
otin
amid
e E
GVM
, 200
3
+
3
3
smal
l num
ber o
f sp
ecia
l pop
ulat
ion

Annex 3
141
Tabl
e A3
-2. C
ontin
ued
Com
posi
tion
of U
F LO
AE
L N
OA
EL
Nut
rient
O
rgan
isat
ion
Hum
an
Ani
mal
H
uman
A
nim
al
UF
LOA
EL
→ N
OAE
L A
nim
al
→ h
uman
S
ensi
tive
subp
opul
atio
n In
trasp
ecie
s va
riabi
lity
Oth
er ju
stifi
catio
n
IOM
, 199
8
+
2
limite
d da
ta
SC
F, 2
000
+
4
in
suffi
cien
t dat
a: 2
su
bchr
onic
→
chro
nic:
2
EG
VM, 2
003
+
300
3 10
10
Vita
min
B6
CS
HP
F, 1
995
+
10
IO
M, 1
998
+
5 5
pl
us s
ever
ity o
f ef
fect
S
CF,
200
0 +
5
5
lack
of d
ata
betw
een
LOA
EL
+ N
OA
EL
EG
VM, 2
0031
+
1
Folic
aci
d Fo
lic a
cid
CS
HP
F, 1
995
+
5
Pant
othe
nic
acid
E
GVM
, 200
31
+
10
Vita
min
B12
E
GVM
, 200
31
+
1
B
iotin
E
GVM
, 200
31
+
10
IOM
, 200
0 +
1.
5 1.
5
E
GVM
, 200
31 +
3
3
Vi
tam
in C
CS
HP
F, 1
995
+
1
β-C
arot
ene
EG
VM, 2
003
+
3
IOM
, 199
7 +
2
2
C
alci
um
SC
F, 2
003
+
1
IOM
, 199
7
+
2.
5 (a
dults
)3.
0 (a
ge 1
-8
y)
2.5
3.3
la
ck o
f dat
a Ph
osph
orus
EG
VM, 2
0031
+
3
3

A Model for Establishing Upper Levels of Intake for Nutrients and Related Substances
142
Tabl
e A3
-2. C
ontin
ued
Com
posi
tion
of U
F LO
AE
L N
OA
EL
Nut
rient
O
rgan
isat
ion
Hum
an
Ani
mal
H
uman
A
nim
al
UF
LOA
EL
→ N
OAE
L A
nim
al
→ h
uman
S
ensi
tive
subp
opul
atio
n In
trasp
ecie
s va
riabi
lity
Oth
er ju
stifi
catio
n
IOM
, 199
7 +
1
mild
, rev
ersi
ble
effe
ct
SC
F, 2
002
+
1
Mag
nesi
um
EG
VM, 2
0031
+
1
+ 0-
8 y
1
IO
M, 1
997
+ >8
y
1
<8
y
thre
shol
d do
se
1
E
FSA
, 200
5
<8 y
th
resh
old
dose
5
Fluo
ride
CS
HP
F, 1
995
2
x R
DA
+
>19
y
2
2
IOM
, 200
0
+
0-6
y
1
re
sults
in s
ame
leve
l as
in a
dults
S
CF,
200
0
+
3
rem
aini
ng
unce
rtain
ties
EG
VM, 2
003
+
2 2
Sele
nium
CS
HP
F, 1
995
+
10
10
IOM
, 200
1
+
1
S
CF,
200
3
+
2
2
subc
hron
ic s
tudi
es
with
few
per
sons
Cop
per
EG
VM, 2
003
+
100
10
10
IO
M, 2
001
+
1.5
1.5
su
ppor
ted
by
NO
AE
L S
CF,
200
2
+
3
smal
l num
bers
, m
ostly
sho
rt-du
ratio
n st
udie
s
Iodi
ne
EG
VM, 2
0031
+
1
+ >1
9 y
1.
5 1.
5
IO
M, 2
001
+ 0-
8 y
1.
0
Iron
EG
VM, 2
003
+
3 3
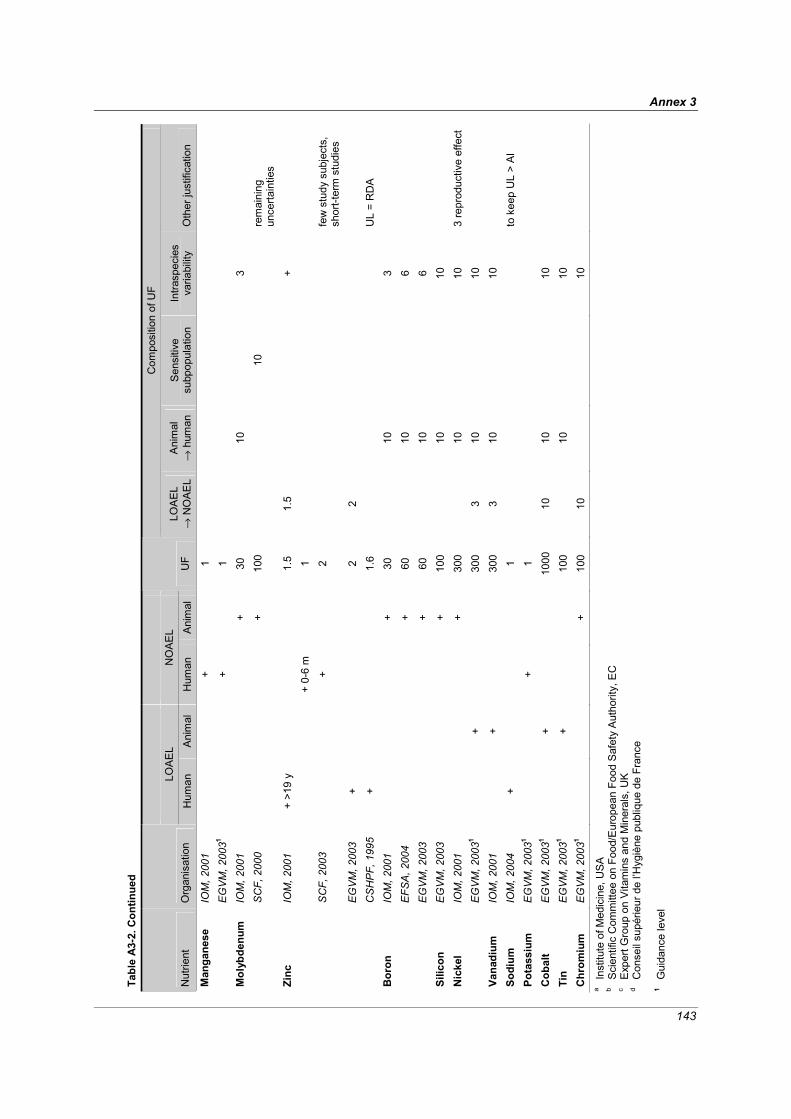
Annex 3
143
Tabl
e A3
-2. C
ontin
ued
Com
posi
tion
of U
F LO
AE
L N
OA
EL
Nut
rient
O
rgan
isat
ion
Hum
an
Ani
mal
H
uman
A
nim
al
UF
LOA
EL
→ N
OAE
L A
nim
al
→ h
uman
S
ensi
tive
subp
opul
atio
n In
trasp
ecie
s va
riabi
lity
Oth
er ju
stifi
catio
n
IOM
, 200
1
+
1
M
anga
nese
E
GVM
, 200
31
+
1
IO
M, 2
001
+
30
10
3
Mol
ybde
num
S
CF,
200
0
+ 10
0
10
rem
aini
ng
unce
rtain
ties
+ >1
9 y
1.
5 1.
5
+
IO
M, 2
001
+ 0-
6 m
1
SC
F, 2
003
+
2
fe
w s
tudy
sub
ject
s,
shor
t-ter
m s
tudi
es
EG
VM, 2
003
+
2 2
Zinc
CS
HP
F, 1
995
+
1.6
UL
= R
DA
IO
M, 2
001
+
30
10
3
EFS
A, 2
004
+
60
10
6
Bor
on
EG
VM, 2
003
+
60
10
6
Silic
on
EG
VM, 2
003
+
100
10
10
IO
M, 2
001
+
300
10
10
3 re
prod
uctiv
e ef
fect
N
icke
l E
GVM
, 200
31
+
30
0 3
10
10
Vana
dium
IO
M, 2
001
+
300
3 10
10
So
dium
IO
M, 2
004
+
1
to
kee
p U
L >
AI
Pota
ssiu
m
EG
VM, 2
0031
+
1
Cob
alt
EG
VM, 2
0031
+
1000
10
10
10
Ti
n E
GVM
, 200
31
+
10
0
10
10
Chr
omiu
m
EG
VM, 2
0031
+
100
10
10
a
Inst
itute
of M
edic
ine,
USA
b
Sci
entif
ic C
omm
ittee
on
Food
/Eur
opea
n Fo
od S
afet
y A
utho
rity,
EC
c E
xper
t Gro
up o
n V
itam
ins
and
Min
eral
s, U
K
d C
onse
il su
périe
ur d
e l’H
ygiè
ne p
ubliq
ue d
e Fr
ance
1
G
uida
nce
leve
l

A Model for Establishing Upper Levels of Intake for Nutrients and Related Substances
144
Box A3-1. A summary of the selection of uncertainty factors by different assessors
A NOAEL from human studies was identified 39 times. The following uncertainty factors were applied: 19 times a UF of 1 3 times a UF of 1.2, 1.5 or 1.8 7 times a UF of 2 1 times a UF of 2.5 4 times a UF of 3 5 times a UF of 10.
The high uncertainty factor of 10 to establish a UL from a human NOAEL was applied for vitamin K, vitamin B2, pantothenic acid, biotin and selenium because of variability of sensitivity in humans. Thirty LOAELs from human studies were identified. The following uncertainty factors were applied:
4 times a UF of 1 5 times a UF of 1.5 1 times a UF of 1.6 4 times a UF of 2 6 times a UF of 3 1 times a UF of 4 5 times a UF of 5 4 times a UF of 10
An uncertainty factor of 10 was applied for vitamin D, vitamin E and vitamin B6 as a routine procedure. Nine NOAELs from animal studies were identified. The following uncertainty factors were applied to establish a UL: 2 times a UF of 30 (interspecies extrapolation: 10; intraspecies variability: 3) 2 times a UF of 60 (interspecies extrapolation: 10; variability in kinetics: 6) 4 times a UF of 100 (interspecies extrapolation: 10; intraspecies variability: 10) 1 times a UF of 300 (interspecies extrapolation: 10; intraspecies variability: 10; adverse reproductive effects: 3). In the case of boron, for which the IOM, EFSA and EGVM all based their assessment on the same animal data, intraspecies variability was taken into account twice by an uncertainty factor of 6 and once by an uncertainty factor of 3 in addition to the uncertainty factor of 10 for extrapolation from animals to humans. Six LOAELs were identified from animal studies. The following uncertainty factors were applied to establish a UL: 1 times a UF of 36 (LOAEL → NOAEL: 2; animal → human: 3; intraspecies variability: 3;
subchronic → chronic: 2) 1 times a UF of 100 (animal → human: 10; intraspecies variability: 10) 3 times a UF of 300 (LOAEL → NOAEL: 3; animal → human: 10; intraspecies variability: 10) 1 times a UF of 1000 (LOAEL → NOAEL: 10; animal → human: 10; intraspecies variability: 10).
3 Summary and open questions The risk assessment of nutrients, even if performed according to established guidelines, is influenced by uncertainties that predominantly are due to the restricted availability of data and a relative lack of systematic studies with the desirable characteristics: a range of well defined doses, sufficient duration, and a design that assesses the occurrence of a priori defined adverse effects or validated biomarkers of such effects. In spite of existing guidelines for the risk assessment procedure, there also is a lack of consensus on how to proceed at those points in the process at which scientifically based decisions have to be made—e.g. in the selection of the decisive and reliable studies, the identification of the

Annex 3
145
critical adverse effect, the choice of uncertainty or adjustment factors, and the scaling to adjust for differences in body size.
Nutrients are a heterogeneous group of substances with widely differing properties with regard to absorption, elimination and biologic functions in the body, and different organs and cell types. Nutrients occur in different forms that can have different bioavailability. However, differences in bioavailability are almost never considered in the risk assessment; or one form only is taken into account.
The resultant overall uncertainty is largely responsible for the variability in the outcome of the risk assessments performed by different scientific workgroups. Considering the extent of uncertainty due to both data insufficiency and variance in approach, the degree of conformity in the magnitude of established upper tolerable intake levels is surprisingly high.
The workshop on nutrient risk assessment provides the opportunity to consider the following questions:
• What is the minimum amount of data required for the assessment of risk through consumption
of nutrients?
• Should an assessment be performed for each form of a nutrient or for a group of forms that have comparable bioavailability?
• Is a structured assessment procedure possible or desirable that is applicable to all nutrients?
• What criteria should determine the magnitude of uncertainty factors?
• What data on kinetic and dynamic properties of nutrients are needed to determine the method of dose scaling? How can variances in the distribution of exposure and sensitivity be incor-porated into the risk characterisation?
References Barlow SM, et al. (2002): Hazard identification by methods of animal-based toxicology. Food and
Chemical Toxicology 40: 145-191 Beck BD, Conolly RB, Dourson ML, Guth D, Harris D, Kimmel C, Lewis SC (1993): Improvements
in quantitative noncancer risk assessment. Fundamentals of Applied Toxicology 20: 1-14 Bradford-Hill A (1965): The environment and disease: association or causation? Proceedings of the
Royal Society of Medicine 58: 295-300 Calabrese EJ (1985): Uncertainty factors and interindividual variation. Regulatory Toxicology and
Pharmacology 5: 190-196 Calabrese EJ, Beck BD, Chappell WR (1992): Does the animal to human uncertainty factor
incorporate interspecies differences in surface area? Regulatory Toxicology and Pharmacology 15: 172-179
Codex Alimentarius Commission (2004): Procedural Manual. 13th edition. Food and Agriculture Organization of the United Nations. World Health Organization, Rome
Conseil Supérieur d’Hygiène Publique de France (CSHPF) (1995): Safety levels of vitamins and minerals. ISBN 2-11-089437-7
Crump KS (1984): A new method for determining allowable daily intakes. Fundamentals of Applied Toxicology. 4: 854-871
Davidson IW, Parker JC, Beliles RP (1986): Biological basis for extrapolation across mammalian species. Regulatory Toxicology and Pharmacology 6: 211-231
Dean HT, Arnold FA, Elvove E (1942): Domestic waters and dental caries. V. Additional studies of the relation of fluoride domestic waters to dental caries in 4425 white children, age 12-14 years, of 13 cities in 4 states. Public Health Reports 57: 1155-1179
Dourson M, Charnley G, Scheuplein R (2002): Differential sensitivity of children and adults to chemical toxicity. II. Risk and regulation. Regulatory Toxicology and Pharmacology 35: 448-467

A Model for Establishing Upper Levels of Intake for Nutrients and Related Substances
146
Dourson ML, Felter SP, Robinson D (1996): Evolution of science-based uncertainty factors in non-cancer risk assessment. Regulatory Toxicology and Pharmacology 24: 108-120
Dourson ML, Stara JF (1983): Regulatory history and experimental support of uncertainty (safety) factors. Regulatory Toxicology and Pharmacology 3: 224-238
Dybing E, Doe J, Groten J, Kleiner J, O’Brien J, Renwick AG, Schlatter J, Steinberg P, Tritscher A, Walker R, Younes M (2002): Hazard characterisation of chemicals in food and diet: dose response, mechanisms and extrapolation issues. Food and Chemical Toxicology 40: 237-282
Edler L, Poirier K, Dourson M, Kleiner J, Mileson B, Nordmann H, Renwick A, Slob W, Walton K, Würtzen G (2002): Mathematical modelling and quantitative methods. Food and Chemical Toxicology 40: 283-326
Expert Group on Vitamins and Minerals (EGVM) (2003): Safe upper levels for vitamins and minerals. Food Standards Agency. ISBN 1-904026-11-7
Feron VJ, van Bladeren PJ, Hermus RJJ (1990): A viewpoint on the extrapolation of toxicological data from animals to man. Food and Chemical Toxicology 28: 783-788
Hathcock JN (1997): Vitamin and mineral safety. Council for Responsible Nutrition, Washington, DC Hattis E, Erdreich L, Ballew M (1987): Human variability in susceptibility to toxic chemicals: A
preliminary analysis of pharmacokinetic data from normal volunteers. Risk Analysis 7: 415-426 Herrman JL, Younes M (1999): Background to the ADI/TFI/PTWI. Regulatory Toxicology and
Pharmacology 30: S109-S113 Institute of Medicine (IOM) (1997): Dietary reference intakes for calcium, phosphorus, magnesium,
vitamin D and fluoride. National Academy Press, Washington, DC Institute of Medicine (IOM) (1998): Dietary reference intakes for thiamin, riboflavin, niacin, vitamin
B6, folate, vitamin B12, pantothenic acid, biotin, and choline. National Academy Press, Washington, DC
Institute of Medicine (IOM) (1998): Dietary reference intakes: A risk assessment model for establishing upper intake levels for nutrients. National Academy Press, Washington, DC
Institute of Medicine (IOM) (2000): Dietary reference intakes for vitamin C, vitamin E, selenium and carotenoids. National Academy Press, Washington, DC
Institute of Medicine (IOM) (2001): Dietary reference intakes for vitamin A, vitamin K, arsenic, boron, chromium, copper, iodine, iron, manganese, molybdenum, nickel, silicon, vanadium and zinc. National Academy Press, Washington, DC
International Programme on Chemical Safety (IPCS) (1994): Assessing human health risk of chemi-cals: derivation of guidance values for health-based exposure limits. Environmental Health Criteria 170. WHO, Geneva
International Programme on Chemical Safety (IPCS) (2002): Principles and methods for the assess-ment of risk from essential trace elements. Environmental Health Criteria 228. WHO, Geneva
Kleiber M (1932): Body size and metabolism. Hilgardia 6: 315-353 Kleiber M (1947): Body size and metabolic rate. Physiological Reviews 27: 511-541 Kroes R, Müller D, Lambe J, Löwik MRH, van Klaveren J, Kleiner J, Massey R, Mayer S, Urieta I,
Verger P, Visconti A (2002): Assessment of intake from the diet. Food and Chemical Toxicology 40: 327-385
Lehman AJ, Fitzhugh OG (1954): 100-fold margin of safety. Assoc. Food and Drug Officials U.S. Quarterly Bulletin 18: 33-35
Lewis SC, Lynch JR, Nikiforov AI (1990): A new approach to deriving community exposure guidelines from no-observed-adverse-effect levels. Regulatory Toxicology and Pharmacology 11: 314-330
Lu FC (1979): Assessment at an international level of health hazards to man of chemicals shown to be carcinogenic in laboratory animals. In: Regulatory Aspects of Carcinogenesis. Coulston F (ed.) Academic Press, New York, pp. 315-328
National Research Council (NRC) (1983): Risk assessment in the federal government: Managing the process. National Academy Press, Washington, DC

Annex 3
147
National Research Council (NRC) (1994): Science and judgement in risk assessment. National Academy Press, Washington, DC
Naumann BD, Weideman PA (1995): Scientific basis for uncertainty factors used to establish occupational exposure limits for pharmaceutical active ingredients. Human and Ecological Risk Assessment 1: 590-613
Renwick AG (1991): Safety factors and establishment of acceptable daily intakes. Food Additives and Contaminants 8: 135-150
Renwick AG (1993a): Toxicokinetics. In: General and Applied Toxicology. Vol. 1. Ballantyne B, Marrs T, Turner P (eds.) Stockton Press, New York, pp 121-151
Renwick AG (1993b): Data-derived safety factors for the evaluation of food additives and environ-mental contaminants. Food Additives and Contaminants 10: 275-305
Renwick AG (1999): Subdivision of uncertainty factors to allow for toxicokinetics and toxico-dynamics. Human and Ecological Risk Assessment 5:1035-1050
Renwick AG, Barlow SM, Hertz-Picciotto I, Boobis AR, Dybing E, Edler L, Eisenbrand G, Greig JB, Kleiner J, Lambe J, Müller DJG, Smith MR, Tritscher A, Tuijtelaars S, van den Brandt PA, Walker R, Kroes R (2003): Risk characterisation of chemicals in food and diet. Food and Chemi-cal Toxicology 41: 1211-1271
Renwick AG, Flynn A, Fletcher RJ, Müller DJG, Tuijtelaars S, Verhagen H (2004): Risk-benefit analysis of micronutrients. Food and Chemical Toxicology 42: 1903-1922
Renwick AG, Lazarus NR (1998): Human variability and non-cancer risk assessment—an analysis of the default uncertainty risk factor. Regulatory Toxicology and Pharmacology 27: 3-20
Rubner M (1883): Über den Einfluss der Körpergrösse auf Stoff- und Kraftwechsel. Zeitschrift für Biologie 19: 536-562
Rucker R, Storms D (2002): Interspecies comparisons of micronutrient requirements: metabolic vs. absolute body size. Journal of Nutrition 132: 2999-3000
Scheerger S.B, Zempleni J (2003): Expression of oncogenes depends on biotin in human small cell lung cancer cells NCI-H69. International Journal for Vitamin and Nutrition Research 73: 461-467
Scientific Committee on Food (SCF) (2000): Guidelines of the Scientific Committee on Food for the development of tolerable upper intake levels for vitamins and minerals. SCF/CS/NUT/UPPLEV/ 11 Final of 28 November 2000. http://www.europa.eu.int/comm/food/fs/sc/scf/index_en.html
Scientific Committee on Food (SCF) (2001): Opinion of the Scientific Committee on Food on the tolerable upper intake level of biotin. Expressed on 26 September 2001. http://www.europa.eu.int/comm/food/fs/sc/scf/index_en.html
Scientific Steering Committee (SSC) (2000): Working Group on Harmonisation of Risk Assessment Procedures in the Scientific committees advising the European Commission in the area of human and environmental health 26-27 October 2000. First report on the harmonisation of risk assessment procedures, Part 1 and 2. (Published on the internet 20.12.2000). http://europa.eu.int/comm/food/fs/sc/ssc/out82_en.html
Sheehan DM, Gaylor DW (1990): Analysis of the adequacy of safety factors. Teratology 41: 590-591 Shrimpton D (1997): Vitamins and minerals. A scientific evaluation of the range of safe intakes.
European Federation of Health Product Manufacturers Association, Brussels Vermeire T, Stevenson H, Pieters MN, Rennen M, Slob W, Hakkert BC (1999): Assessment factors
for human health risk assessment: A discussion paper. Critical Reviews in Toxicology 29: 3439-3490
West GB, Brown JH, Enquist BJ (1997): A general model for the origin of allometric scaling laws in biology. Science 276: 122-126
West GB, Woodruff WH, Brown JH (2002): Allometric scaling of metabolic rate from molecules and mitochondria to cells and mammals. Proceedings of the National Academy of Sciences 99: 2473-2478
A Model for Establishing Upper Levels of Intake for Nutrients and Related Substances
148
White CR, Seymour RS (2003): Mammalian basal metabolic rate is proportional to body mass. Proceedings of the National Academy of Sciences 100: 4046-4049
Wiedmann S, Rodriguez-Melendez R, Ortega-Cuellar D, Zempleni J (2004): Clusters of biotin-responsive genes in human peripheral blood mononuclear cells. Journal of Nutritional Biochem-istry 15: 433-439
World Health Organisation (WHO) (1987): Principles for the safety assessment of food additives and contaminants in food. Environmental Health Criteria, 70, WHO, Geneva
Xiang QY, Liang YX, Chen BH, Wang CS, Zhen SQ, Chen LS, Zhou MS, Li JF (2004): Study on the application of benchmark dose and biological monitoring indexes of fluoride in drinking water (in Chinese with English abstract). Zhonghua Yu Fang Yi Xue Za Zhi 38: 261-264
Zielhuis RL, van der Kreek FW (1979): The use of a safety factor in setting health based permissible levels for occupational exposure. I. A proposal. International Archives of Occupational and Environmental Health 42: 191-201

Annex 3
149
App
endi
x 1
to A
nnex
3, C
ompa
rison
of b
ackg
roun
d da
ta u
sed
for t
he d
eriv
atio
n of
ULs
for v
itam
ins,
min
eral
s an
d tr
ace
elem
ents
by
IOM
a , SC
F/EF
SAb , E
GVM
c , CSH
PFd
Nut
rient
W
orkg
roup
U
L LO
AE
L N
OA
EL
UF
Crit
ical
adv
erse
ef
fect
s D
ecis
ive
data
A
pplic
abilit
y ex
trapo
latio
n/ad
just
men
t to
othe
r gro
ups
3 m
g 14
mg
5
liver
pat
holo
gy
Min
uk e
t al.,
198
8;
Zafra
ni e
t al.,
198
4 ad
ults
3 m
g (♀
of
repr
oduc
tive
age)
4.
5 m
g 1.
5 te
rato
geni
city
R
othm
an e
t al.,
199
5 ap
plic
able
14-
50 y
♀
IOM
, 200
1
infa
nts
0.6
mg
6 m
g
10
incr
ease
in
tracr
ania
l pr
essu
re
Per
sson
et a
l., 1
965
Ext
rapo
latio
n fo
r b.w
.0.75
SC
F, 2
002
3 m
g 3
mg
1
tera
toge
nici
ty
(hum
an)
Rot
hman
et a
l., 1
995
Ext
rapo
latio
n fo
r b.w
. 0.75
no
t app
licab
le to
pos
tmen
opau
sal
wom
en
EG
VM, 2
003
–
Gui
danc
e on
no
supp
lem
enta
ry in
take
w
ith re
gard
to te
rato
geni
city
and
bon
e he
alth
Vita
min
A
CS
HP
F, 1
995
3 m
g +
diet
ary
inta
ke8
mg
no
t sta
ted
hepa
topa
thy
Geu
bel e
t al.,
199
1 al
so a
pplic
able
in p
regn
ancy
0.05
mg
(adu
lts)
0.
06 m
g 1.
2 hy
perc
alca
emia
N
aran
g et
al.,
198
4 ap
plic
able
in p
regn
ancy
+ la
ctat
ion
IOM
, 199
7
0.02
5 m
g (in
fant
s)
0.
045
mg
1.8
grow
th
Jean
s &
Stea
rns,
193
8;
Fom
on e
t al.,
196
6 ap
plic
able
to 1
–18
y
0.05
mg
(adu
lts)
0.
1 m
g 2
hype
rcal
caem
ia +
el
evat
ed s
erum
25
(OH
)D
Tjel
lese
n et
al.,
198
6;
Vie
th e
t al.,
200
1 ap
plic
able
to c
hild
ren
>10
y
Vita
min
D
SFC
, 200
2
0.02
5 m
g (0
-24
m)
0.
025
mg
1 hy
perc
alca
emia
A
la-H
ouha
la, 1
985;
V
erve
l et a
l., 1
997
appl
icab
le to
chi
ldre
n 3–
10 y
EG
VM, 1
995
–
0.02
5 m
g 1
V
ieth
et a
l., 2
001
Gui
danc
e on
sup
plem
enta
ry in
take
with
re
gard
to h
yper
calc
aem
ia 0
.025
mg
0.02
5 m
g (a
dults
) 0.
25 m
g 0.
25 m
g 10
hy
perc
alca
emia
A
nnig
et a
l., 1
948;
Ber
lin
et a
l., 1
986
–
Vita
min
D
CS
HP
F, 1
995
0.05
mg
(<2
y)
0.1
mg
2
hype
rcal
caem
ia
Vid
ailh
et, 1
991;
Fra
ser e
t al
., 19
66
–
Vita
min
E
IOM
, 200
0 10
00 m
g 50
0 m
g/kg
/d
(rats
)
2x2x
3x3
haem
orrh
age
Whe
ldon
et a
l., 1
983
extra
pola
tion
for b
ody
wei
ght
S
CF,
200
3 30
0 m
g TE
540
mg
TE
2 bl
ood
coag
ulat
ion
Mey
dani
et a
l., 1
998
extra
pola
tion
for b
ody
wei
ght 0.
75

A Model for Establishing Upper Levels of Intake for Nutrients and Related Substances
150
Appe
ndix
1 to
Ann
ex 3
. Con
tinue
d
Nut
rient
W
orkg
roup
U
L LO
AE
L N
OA
EL
UF
Crit
ical
adv
erse
ef
fect
s D
ecis
ive
data
A
pplic
abilit
y ex
trapo
latio
n/ad
just
men
t to
othe
r gro
ups
E
GVM
, 200
3 54
0 m
g TE
540-
9709
m
g TE
1
– G
illila
n et
al.,
197
7;
Mey
dani
et a
l., 1
996;
S
teph
ens
et a
l., 1
996
–
C
SH
PF,
199
5 40
mg
+ di
etar
y in
take
50 m
g (4
00 m
g)
no
t sta
ted
(10)
ris
k of
stro
ke
ATB
C C
ance
r Pre
vent
ion
Stu
dy G
roup
, 199
4 –
IOM
, 200
1 –
SC
F, 2
003
–
E
GVM
, 200
3 –
10
mg
10
– C
raci
un e
t al.,
199
8 G
uida
nce
on s
uppl
emen
tal i
ntak
e 1
mg
Vita
min
K
CS
HP
F, 1
995
–
IO
M, 1
998
–
S
CF,
200
0 –
EG
VM, 2
003
–
100
mg
1 –
Gok
hale
et a
l., 1
996
Gui
danc
e fo
r sup
plem
enta
l int
ake
100
mg
Vita
min
B1
CS
HP
F, 1
995
–
IO
M, 1
998
–
S
CF,
200
0 –
EG
VM, 2
003
–
400
mg
10
–
Gui
danc
e fo
r sup
plem
enta
l int
ake
40 m
g
Vita
min
B2
CS
HP
F, 1
995
not d
one
Nia
cin
IOM
, 199
8 35
mg
50 m
g
1.5
flush
ing
Seb
rell
& B
utle
r, 19
38
extra
pola
tion
for b
ody
wei
ght 0.
75
nico
tinic
aci
d 10
mg
30 m
g
3 flu
shin
g (h
uman
) S
ebre
ll &
But
ler,
1938
ex
trapo
latio
n fo
r bod
y w
eigh
t ni
cotin
amid
e S
CF,
200
2 90
0 m
g
25 m
g/kg
/d
2 –
Sup
plem
enta
tion
trial
s in
di
abet
es m
ellit
us
extra
pola
tion
for b
ody
wei
ght
nico
tinic
aci
d –
50 m
g
3 flu
shin
g S
pies
et a
l., 1
998;
Seb
rell
& B
utle
r, 19
38
Gui
danc
e of
sup
plem
enta
l int
ake:
ni
cotin
ic a
cid
17 m
g ni
cotin
amid
e 50
0 m
g ni
cotin
amid
e
EG
VM, 2
003
25 m
g/kg
/d
3 –
Fozz
illi e
t al.,
199
5;
Lam
pete
r et a
l., 1
998
C
SH
PF,
199
5 33
mg
+ di
etar
y in
take
100
mg
3
flush
ing
(hum
an)
no re
fere
nce
–
Vita
min
B6
IOM
, 199
8 10
0 m
g
200
mg
2 ne
urop
athy
B
erns
tein
& L
obitz
, 198
8;
Del
Tre
dici
et a
l., 1
985
extra
pola
tion
for b
ody
wei
ght 0.
75
S
CF,
200
0 25
mg
100
mg
2x
2 ne
urop
athy
(h
uman
) D
alto
n &
Dal
ton,
198
7 ex
trapo
latio
n fo
r bod
y w
eigh
t
E
GVM
, 200
3 10
mg
50
mg/
kg/d
3x10
x10
neur
opat
hy (d
ogs)
P
hillip
s et
al.,
197
8

Annex 3
151
Appe
ndix
1 to
Ann
ex 3
. Con
tinue
d
Nut
rient
W
orkg
roup
U
L LO
AE
L N
OA
EL
UF
Crit
ical
adv
erse
ef
fect
s D
ecis
ive
data
A
pplic
abilit
y ex
trapo
latio
n/ad
just
men
t to
othe
r gro
ups
C
SH
PF,
199
5 5
mg
50 m
g
10
neur
opat
hy
(wom
en)
Dal
ton
& D
alto
n, 1
987
–
IOM
, 199
8 1
mg
5 m
g
5 m
aski
ng o
f ha
emat
olog
ical
si
gns
of v
itam
in B
12
defic
ienc
y
seve
ral r
efer
ence
s ex
trapo
latio
n fo
r bod
y w
eigh
t 0.75
appl
icab
le to
sup
plem
ents
and
fo
rtific
atio
n
SC
F, 2
000
1 m
g 5
mg
5
mas
king
of
haem
atol
ogic
al
sign
s of
vita
min
B12
de
ficie
ncy
(hum
an)
seve
ral r
efer
ence
s ex
trapo
latio
n fo
r bod
y w
eigh
t
EG
VM, 2
003
–
1 m
g 1
mas
king
of
haem
atol
ogic
al
sign
s of
vita
min
B12
de
ficie
ncy
seve
ral r
efer
ence
s G
uida
nce
for s
uppl
emen
tal i
ntak
e 1
mg
Folic
aci
d
CS
HP
F, 1
995
1 m
g 5
mg
5
mas
king
of
haem
atol
ogic
al
sign
s of
vita
min
B12
de
ficie
ncy
(hum
an)
Sch
war
tz e
t al.,
195
0;
Edi
toria
l NEJ
M, 1
947
–
IOM
, 199
8 –
SC
F, 2
002
–
E
GVM
, 200
3 –
20
00 m
g 10
–
Gen
eral
Pra
ctiti
oner
R
esea
rch
Gro
up, 1
980
Gui
danc
e fo
r sup
plem
enta
l int
ake
200
mg
Pant
othe
nic
acid
CS
HP
F, 1
995
–
IO
M, 1
998
–
S
CF,
200
0 –
EG
VM, 2
003
–
2 m
g 1
Ju
hlin
& O
lsso
n, 1
997
Gui
danc
e fo
r sup
plem
enta
l int
ake
2 m
g
Vita
min
B12
CS
HP
F, 1
995
–
IO
M, 1
998
–
S
CF,
200
1 –
EG
VM, 2
003
–
9 m
g 10
Mae
bash
i et a
l., 1
993
Gui
danc
e fo
r sup
plem
enta
l int
ake
0.9
mg
Bio
tin
C
SH
PF,
199
5 –
Vita
min
C
IOM
, 200
0 2
g 3
g
1.5
osm
otic
dia
rrhoe
a C
amer
on &
Cam
pbel
l, 19
74
E
FSA
, 200
4 –
E
GVM
, 200
3 –
3000
mg
3
– C
amer
on &
Cam
pbel
l, 19
74
Gui
danc
e fo
r sup
plem
enta
l int
ake
1000
m
g
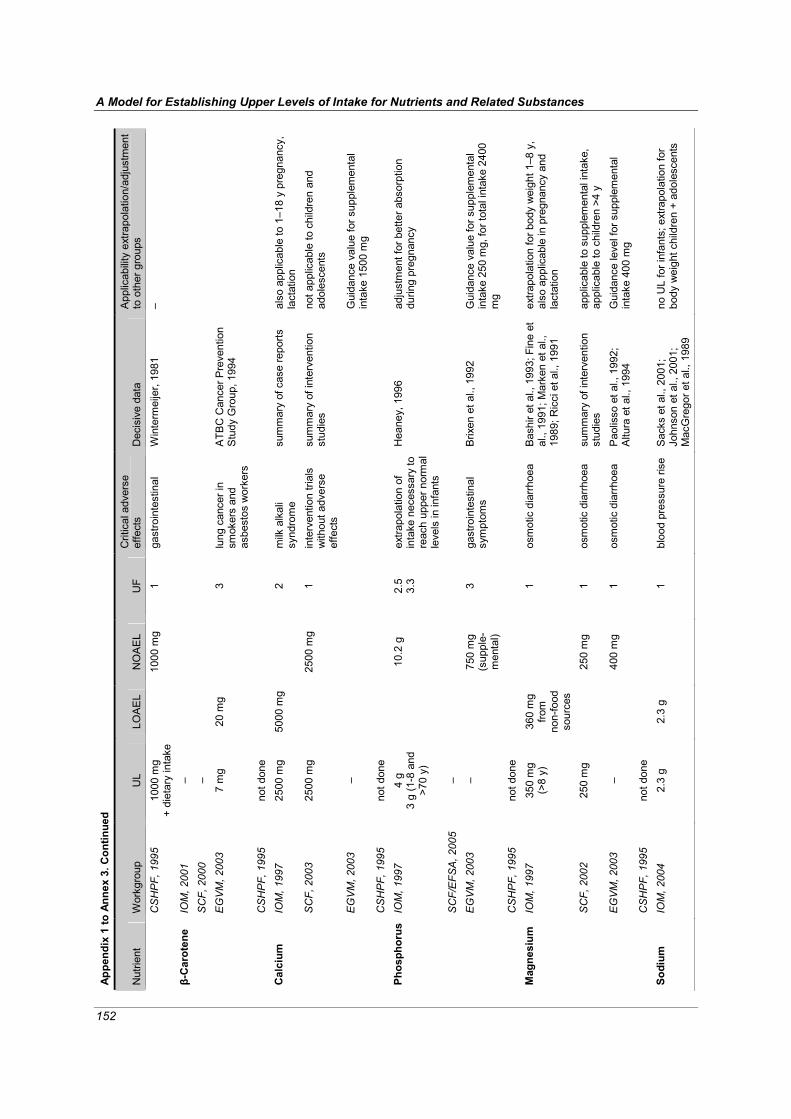
A Model for Establishing Upper Levels of Intake for Nutrients and Related Substances
152
Appe
ndix
1 to
Ann
ex 3
. Con
tinue
d
Nut
rient
W
orkg
roup
U
L LO
AE
L N
OA
EL
UF
Crit
ical
adv
erse
ef
fect
s D
ecis
ive
data
A
pplic
abilit
y ex
trapo
latio
n/ad
just
men
t to
oth
er g
roup
s
CS
HP
F, 1
995
1000
mg
+ di
etar
y in
take
10
00 m
g 1
gast
roin
test
inal
W
inte
rmei
jer,
1981
–
IOM
, 200
1 –
SC
F, 2
000
–
E
GVM
, 200
3 7
mg
20 m
g
3 lu
ng c
ance
r in
smok
ers
and
asbe
stos
wor
kers
ATB
C C
ance
r Pre
vent
ion
Stu
dy G
roup
, 199
4
β-C
arot
ene
CS
HP
F, 1
995
not d
one
IOM
, 199
7 25
00 m
g 50
00 m
g
2 m
ilk a
lkal
i sy
ndro
me
sum
mar
y of
cas
e re
ports
al
so a
pplic
able
to 1
–18
y pr
egna
ncy,
la
ctat
ion
SC
F, 2
003
2500
mg
25
00 m
g 1
inte
rven
tion
trial
s w
ithou
t adv
erse
ef
fect
s
sum
mar
y of
inte
rven
tion
stud
ies
not a
pplic
able
to c
hild
ren
and
adol
esce
nts
EG
VM, 2
003
–
Gui
danc
e va
lue
for s
uppl
emen
tal
inta
ke 1
500
mg
Cal
cium
CS
HP
F, 1
995
not d
one
IOM
, 199
7 4
g 3
g (1
-8 a
nd
>70
y)
10
.2 g
2.
5 3.
3 ex
trapo
latio
n of
in
take
nec
essa
ry to
re
ach
uppe
r nor
mal
le
vels
in in
fant
s
Hea
ney,
199
6 ad
just
men
t for
bet
ter a
bsor
ptio
n du
ring
preg
nanc
y
SC
F/E
FSA
, 200
5 –
EG
VM, 2
003
–
750
mg
(sup
ple-
men
tal)
3 ga
stro
inte
stin
al
sym
ptom
s B
rixen
et a
l., 1
992
Gui
danc
e va
lue
for s
uppl
emen
tal
inta
ke 2
50 m
g, fo
r tot
al in
take
240
0 m
g
Phos
phor
us
CS
HP
F, 1
995
not d
one
IOM
, 199
7 35
0 m
g (>
8 y)
36
0 m
gfro
m
non-
food
so
urce
s
1
osm
otic
dia
rrhoe
a B
ashi
r et a
l., 1
993;
Fin
e et
al
., 19
91; M
arke
n et
al.,
19
89; R
icci
et a
l., 1
991
extra
pola
tion
for b
ody
wei
ght 1
–8 y
, al
so a
pplic
able
in p
regn
ancy
and
la
ctat
ion
Mag
nesi
um
SC
F, 2
002
250
mg
25
0 m
g 1
osm
otic
dia
rrhoe
a su
mm
ary
of in
terv
entio
n st
udie
s ap
plic
able
to s
uppl
emen
tal i
ntak
e,
appl
icab
le to
chi
ldre
n >4
y
E
GVM
, 200
3 –
40
0 m
g 1
osm
otic
dia
rrhoe
a P
aolis
so e
t al.,
199
2;
Altu
ra e
t al.,
199
4 G
uida
nce
leve
l for
sup
plem
enta
l in
take
400
mg
C
SH
PF,
199
5 no
t don
e
So
dium
IO
M, 2
004
2.3
g 2.
3 g
1
bloo
d pr
essu
re ri
se
Sac
ks e
t al.,
200
1;
John
son
et a
l., 2
001;
M
acG
rego
r et a
l., 1
989
no U
L fo
r inf
ants
; ext
rapo
latio
n fo
r bo
dy w
eigh
t chi
ldre
n +
adol
esce
nts

Annex 3
153
Appe
ndix
1 to
Ann
ex 3
. Con
tinue
d
Nut
rient
W
orkg
roup
U
L LO
AE
L N
OA
EL
UF
Crit
ical
adv
erse
ef
fect
s D
ecis
ive
data
A
pplic
abilit
y ex
trapo
latio
n/ad
just
men
t to
othe
r gro
ups
S
CF/
EFS
A, 2
005
–
S
odiu
m
chlo
ride
EV
GM
, 200
3 –
ris
e in
blo
od
pres
sure
salt
inta
ke s
houl
d be
redu
ced
C
SH
PF,
199
5 no
t don
e
IO
M, 2
004
–
S
CF/
EFS
A, 2
005
–
E
GVM
, 200
3 –
37
00 m
g 1
gast
roin
test
inal
sy
mpt
oms
Grim
m e
t al.,
199
0; 1
998
Gui
danc
e va
lue
for s
uppl
emen
tal i
ntak
e 37
00 m
g
Pota
ssiu
m
CS
HP
F, 1
995
not d
one
IOM
, 200
4 3.
6 g
– –
– eq
uim
olar
am
ount
of
sod
ium
no U
L fo
r inf
ants
; ext
rapo
latio
n fo
r bod
y w
eigh
t chi
ldre
n an
d ad
oles
cent
s C
hlor
ide
SC
F/E
FSA
. 200
5 –
Sod
ium
ch
lorid
e E
GVM
, 200
3 –
6000
mg
rise
in b
lood
pr
essu
re
Mas
ciol
i et a
l., 1
991
no s
uppl
emen
tal i
ntak
e
C
SH
PF,
199
5 no
t don
e
45
(>
14 y
) 70
mg
1.
5 ga
stro
inte
stin
al
sym
ptom
s Fr
ykm
an e
t al.,
199
4; v
an
de V
ijver
et a
l., 1
999;
Bro
et
al.,
199
0
IO
M, 2
001
40 m
g (0
-13
y)
40
mg
(0-1
3 y)
1
Fa
rquh
ar 1
963;
Ree
ves
&
Yip
, 198
5
SC
F/E
FSA
, 200
4 –
EG
VM, 2
003
– 50
mg
3
gast
roin
test
inal
sy
mpt
oms
Bro
ck e
t al.,
198
5; C
oplin
et
al.,
199
1 G
uida
nce
valu
e fo
r sup
plem
enta
l int
ake
17 m
g
Iron
CS
HP
F, 1
995
–
IO
M, 2
001
–
S
CF/
EFS
A, 2
003
–
E
GVM
, 200
3 –
15
mg/
kg/d
ra
ts
10x1
0
And
erso
n et
al.,
199
7 G
uida
nce
valu
e fo
r tot
al in
take
10
mg;
no
t app
licab
le to
chr
omiu
m p
icol
inat
e
Chr
omiu
m
CS
HP
F, 1
995
not d
one
Fluo
ride
IOM
, 199
7 ad
ults
10
mg
10
mg
1 m
ild/p
recl
inic
al
skel
etal
fluo
rosi
s Le
one
et a
l., 1
955;
M
cCau
ley
& M
cClu
re,
1954
; Sch
lesi
nger
et a
l.,
1954
; Sow
ers
et a
l.,
1986
; Ste
vens
on &
W
atso
n, 1
987
appl
icab
le to
>8
y an
d pr
egna
ncy,
la
ctat
ion

A Model for Establishing Upper Levels of Intake for Nutrients and Related Substances
154
Appe
ndix
1 to
Ann
ex 3
. Con
tinue
d
Nut
rient
W
orkg
roup
U
L LO
AE
L N
OA
EL
UF
Crit
ical
adv
erse
ef
fect
s D
ecis
ive
data
A
pplic
abilit
y ex
trapo
latio
n/ad
just
men
t to
othe
r gro
ups
0.1
mg/
kg/d
(0-8
y)
0.1
mg/
kg/d
(0-8
y)
1
dent
al fl
uoro
sis
Dea
n, 1
942
extra
pola
tion
for b
ody
wei
ght
7 m
g (>
8 y)
0.
6 m
g/kg
5 ris
k of
ske
leta
l fra
ctur
es
Rig
gs e
t al.,
198
2; 1
990;
19
94; L
i et a
l., 2
001
extra
pola
tion
for b
ody
wei
ght
E
FSA
, 200
5
0.1
mg/
kg
(0-8
y)
1 ac
cept
able
den
tal
fluor
osis
D
ean,
194
2; F
ejer
skov
et
al.,
1996
EG
VM, 2
003
–
CS
HP
F, 1
995
0.04
mg/
kg
IOM
, 200
1 11
00 μ
g 17
00 μ
g
1.5
elev
ated
TS
H
conc
entra
tion
Gar
dner
et a
l., 1
988;
Pau
l et
al.,
198
8 ex
trapo
latio
n fo
r bod
y w
eigh
t
SC
F/E
FSA
, 20
02
600 μg
1800
μg
3 el
evat
ed T
SH
co
ncen
tratio
n P
aul e
t al.,
198
8; G
ardn
er
et a
l., 1
988
extra
pola
tion
for b
ody
wei
ght 0.
75
EG
VM, 2
003
–
500 μg
1
P
aul e
t al.,
198
8; C
how
et
al.,
1991
G
uida
nce
valu
e fo
r sup
plem
enta
l int
ake
0.5
mg;
for t
otal
inta
ke 0
.9 m
g
Iodi
ne
CS
HP
F, 1
995
not d
one
IOM
, 200
1 10
mg
10
mg
1 liv
er d
amag
e P
ratt
et a
l., 1
985;
O
’Don
ahue
et a
l., 1
993
extra
pola
tion
for b
ody
wei
ght
SC
F/E
FSA
, 20
03
5 m
g
10 m
g 2
liver
func
tion
Pra
tt et
al.,
198
5;
O’C
onno
r et a
l., 2
003
extra
pola
tion
for b
ody
wei
ght
EG
VM, 2
003
10 m
g
16 m
g/kg
rats
10
x10
H
eber
t et a
l., 1
993;
Pra
tt et
al.,
198
5; T
urnl
und
et
al.,
1989
–
Cop
per
CS
HP
F, 1
995
not d
one
IOM
, 200
1 11
mg
11
mg
1 el
evat
ed b
lood
m
anga
nese
and
ne
urot
oxic
ity
Gre
ger,
1999
ex
trapo
latio
n fo
r bod
y w
eigh
t
SC
F, 2
000
–
E
GVM
, 200
3 –
0.
07-0
.08
mg/
kg
1 ne
urot
oxic
ity
Vie
regg
e et
al.,
199
5;
Kon
daki
s et
al.,
198
9 G
uida
nce
valu
e fo
r sup
plem
enta
l int
ake
0.5
mg;
for t
otal
inta
ke 9
–12
mg
Man
gane
se
CS
HP
F, 1
995
not d
one
Mol
ybde
num
IO
M, 2
001
2 m
g (b
ody
wei
ght
61 k
g)
0.
9 m
g/kg
rats
10
x3
repr
oduc
tive
effe
cts
in ra
ts
Fung
we
et a
l., 1
990
extra
pola
tion
for b
ody
wei
ght
S
CF,
200
0 0.
6 m
g
0.9
mg/
kgra
ts
10x1
0 re
prod
uctiv
e ef
fect
s in
rats
and
m
ice
Fung
we
et a
l., 1
990
extra
pola
tion
for b
ody
wei
ght

Annex 3
155
Appe
ndix
1 to
Ann
ex 3
. Con
tinue
d
Nut
rient
W
orkg
roup
U
L LO
AE
L N
OA
EL
UF
Crit
ical
adv
erse
ef
fect
s D
ecis
ive
data
A
pplic
abilit
y ex
trapo
latio
n/ad
just
men
t to
othe
r gro
ups
E
GVM
, 200
3 –
G
uida
nce
valu
e is
die
tary
inta
ke
C
SH
PF,
199
5 no
t don
e
IO
M, 2
001
1 m
g (b
.w. 6
1 kg
)
5 m
g/kg
rats
10
x10x
3 de
crea
sed
wei
ght
gain
in ra
ts
AB
C, 1
988;
Am
bros
e et
al
., 19
76
extra
pola
tion
for b
ody
wei
ght;
appl
icab
le
to s
olub
le s
alts
onl
y E
FSA
, 200
5 –
EG
VM, 2
003
– 1.
3 m
g/kg
in ra
ts
30
0 10
x10x
3 pe
rinat
al m
orta
lity
in ra
ts
Smith
et a
l., 1
993
Gui
danc
e va
lue
0.26
mg
Nic
kel
CS
HP
F, 1
995
not d
one
400 μg
800 μg
2
sele
nosi
s Y
ang
& Zh
ou, 1
994
IO
M, 2
000
45 μ
g (0
-6 m
)
47 μ
g (2
–6 m
) 1
S
hear
er &
Had
jimar
kos,
19
75; B
rätte
r et a
l., 1
991
extra
pola
tion
for b
ody
wei
ght
SC
F, 2
000
300 μg
850 μg
3
sele
nosi
s Y
ang
et a
l., 1
989;
Yan
g &
Zhou
, 199
4 ex
trapo
latio
n fo
r bod
y w
eigh
t
EG
VM, 2
003
450 μg
91
0 μg
2 se
leno
sis
(hai
r, na
ils)
Yan
g et
al.,
198
9
Sele
nium
CS
HP
F, 1
995
150 μg
1500
μg
10
sele
nosi
s Y
ang
et a
l., 1
983
IO
M, 2
001
–
E
FSA
, 200
4 –
EG
VM, 2
003
700
(b.w
. 60
kg)
12
00
mg/
kg
rats
10x1
0 re
duce
d gr
owth
ra
te in
rats
Ta
kiza
wa
et a
l., 1
988
Gui
danc
e va
lue
for t
otal
inta
ke 7
60 m
g
Silic
on
CS
HP
F, 1
995
not d
one
IOM
, 200
1 1.
8 m
g (b
.w. 6
8.5
kg)
7.7
mg/
kgra
t
10x1
0x3
neph
roto
xici
ty in
ra
ts
Dom
ingo
et a
l., 1
985;
19
91
does
not
app
ly to
age
<19
y, p
regn
ancy
, la
ctat
ion
EFS
A, 2
004
–
E
GVM
, 200
3 –
no
t saf
e in
sup
plem
ents
Vana
dium
CS
HP
F, 1
995
not d
one
IOM
no
t don
e
C
obal
t S
CF/
EFS
A
not d
one
EG
VM, 2
003
– 2.
3 m
g/kg
mic
e
10x1
0x10
de
crea
se in
ferti
lity
in m
ice
Ped
igo
et a
l., 1
988
Gui
danc
e le
vel 1
.4 m
g
CS
HP
F no
t don
e
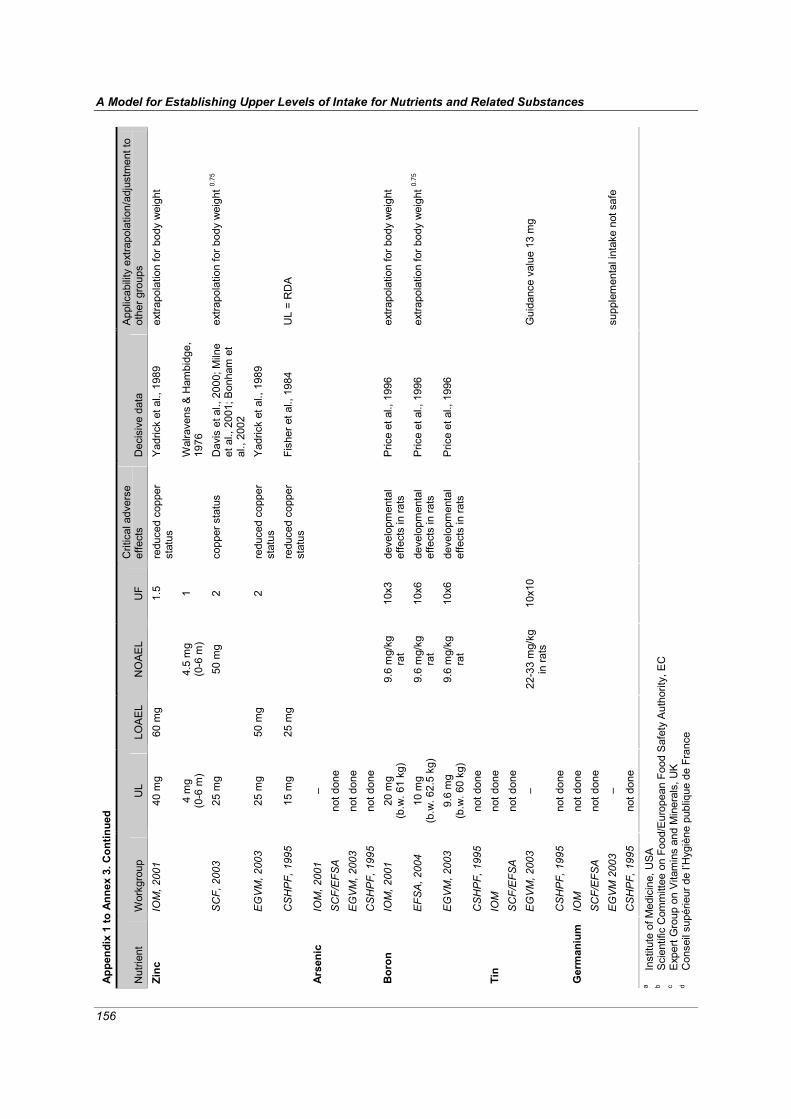
A Model for Establishing Upper Levels of Intake for Nutrients and Related Substances
156
Appe
ndix
1 to
Ann
ex 3
. Con
tinue
d
Nut
rient
W
orkg
roup
U
L LO
AE
L N
OA
EL
UF
Crit
ical
adv
erse
ef
fect
s D
ecis
ive
data
A
pplic
abilit
y ex
trapo
latio
n/ad
just
men
t to
othe
r gro
ups
40 m
g 60
mg
1.
5 re
duce
d co
pper
st
atus
Y
adric
k et
al.,
198
9 ex
trapo
latio
n fo
r bod
y w
eigh
t IO
M, 2
001
4 m
g (0
-6 m
)
4.5
mg
(0-6
m)
1
Wal
rave
ns &
Ham
bidg
e,
1976
SC
F, 2
003
25 m
g
50 m
g 2
copp
er s
tatu
s D
avis
et a
l., 2
000;
Miln
e et
al.,
200
1; B
onha
m e
t al
., 20
02
extra
pola
tion
for b
ody
wei
ght 0.
75
EG
VM, 2
003
25 m
g 50
mg
2
redu
ced
copp
er
stat
us
Yad
rick
et a
l., 1
989
Zinc
CS
HP
F, 1
995
15 m
g 25
mg
redu
ced
copp
er
stat
us
Fish
er e
t al.,
198
4 U
L =
RD
A
IOM
, 200
1 –
SC
F/E
FSA
no
t don
e
E
GVM
, 200
3 no
t don
e
Arse
nic
CS
HP
F, 1
995
not d
one
IOM
, 200
1 20
mg
(b.w
. 61
kg)
9.
6 m
g/kg
ra
t 10
x3
deve
lopm
enta
l ef
fect
s in
rats
P
rice
et a
l., 1
996
extra
pola
tion
for b
ody
wei
ght
EFS
A, 2
004
10 m
g (b
.w. 6
2.5
kg)
9.
6 m
g/kg
ra
t 10
x6
deve
lopm
enta
l ef
fect
s in
rats
P
rice
et a
l., 1
996
extra
pola
tion
for b
ody
wei
ght 0.
75
EG
VM, 2
003
9.6
mg
(b.w
. 60
kg)
9.
6 m
g/kg
ra
t 10
x6
deve
lopm
enta
l ef
fect
s in
rats
P
rice
et a
l., 1
996
Bor
on
CS
HP
F, 1
995
not d
one
IOM
no
t don
e
S
CF/
EFS
A
not d
one
EG
VM, 2
003
–
22-3
3 m
g/kg
in ra
ts
10x1
0
G
uida
nce
valu
e 13
mg
Tin
CS
HP
F, 1
995
not d
one
IOM
no
t don
e
S
CF/
EFS
A
not d
one
EG
VM 2
003
–
supp
lem
enta
l int
ake
not s
afe
Ger
man
ium
CS
HP
F, 1
995
not d
one
a In
stitu
te o
f Med
icin
e, U
SA
b S
cien
tific
Com
mitt
ee o
n Fo
od/E
urop
ean
Food
Saf
ety
Aut
horit
y, E
C
c
Exp
ert G
roup
on
Vita
min
s an
d M
iner
als,
UK
d
Con
seil
supé
rieur
de
l’Hyg
iène
pub
lique
de
Fran
ce

157
ANNEX 4 Discussion Paper 3:
Estimating the Distribution of Usual Nutrient Exposures in Populations
Prepared for the FAO/WHO Nutrient Risk Assessment Workshop 2-6 May 2005, WHO Headquarters, Geneva
Alicia Carriquiry, PhD1 Valerie Tarasuk, PhD2
1 Department of Statistics, Iowa State University, Ames, IA 50011-1210, USA 2 Department of Nutritional Sciences, Faculty of Medicine, University of Toronto, FitzGerald
Building, Room 326, 150 College Street, Toronto, Ontario, Canada M5S 3E2 1 Introduction Assessment of exposure to any substance in food—including nutrients—is best served by obtaining an estimate of the distribution of food consumption in the (sub) populations of interest. In the special case of assessment of exposure to nutrients, it often is important to consider total intake of the nutrient: from food sources, supplements, and, when relevant, drinking water. We discuss the estima-tion of usual (or habitual) exposure distributions, recognizing that these distributions are essentially the product of two types of databases: 1) a database that provides information on food, supplement, and, when relevant, water intakes in the population, and 2) food composition databases that provide the estimated nutrient content of foods, supplements, and water. Building on earlier work by WHO (1997), here we pay particular attention to the factors that may introduce uncertainty into the exposure estimates and briefly discuss their potential impact on risk estimates.
We first discuss the approaches for assessing exposure that have recently been employed by three expert working groups: the Institute of Medicine (IOM) for the United States and Canada, the Expert Group on Vitamins and Minerals (EVM) for the United Kingdom, and the European Union, Scientific Committee on Food (EU–SCF/EFSA). Then we address five types of exposure assessment information that may be useful to the risk assessor:
1. The population subgroup to which the exposure distribution corresponds; 2. The relevant form of the nutrient for which exposure is being estimated; 3. The time frame to which the exposure assessment corresponds; 4. The type of databases available for estimation and the criteria for choosing one over the other; 5. The uncertainties and possible biases that are associated with the exposure estimates.
We discuss exposure assessment under ideal circumstances. We give special attention to the
uncertainties associated with intake estimates and that arise from various sources. We then consider possible limitations in the available data and investigate the impact these limitations have on the type of exposure assessment that is possible and its reliability. Finally, we offer a set of guidelines and recommendations for interpreting estimates of exposure under different scenarios.

A Model for Establishing Upper Levels of Intake for Nutrients and Related Substances
158
2 The IOM, EVM and EU-SCF models for exposure assessment A review of the assessments of nutrient exposure conducted by three expert workgroups highlights the complexity of this task (see Annex 7, “National Model Comparison: Intake Assessment,” of the Context Paper). Each group compared estimates of the upper tail of exposure distributions to esti-mates of an upper level of intake (UL). However, the exposure estimates were derived from different sources of data on food, supplement, and, when applicable, water intakes. In most cases, upper levels of nutrient exposure were estimated using consumption surveys and food composition databases that had not been designed explicitly for this purpose—a fact that highlights the challenging nature of this area of dietary assessment. Given the need to estimate exposure across several countries with diverse approaches to dietary intake assessment, the EU–SCF/EFSA committees drew on intake data from 2-day, 7-day, and 8-day dietary records and from 24-hour dietary intake recalls. They also considered per capita intake estimates derived from household surveys. The EU–SCF/EFSA reports provide mean intake estimates and estimates of the 97.5th percentile of exposure from the combined intakes from food and supple-ments, typically for males and females. For some nutrients, the EU–SCF/EFSA also presented per capita household-level estimates. The estimates were compared to ULs to make a qualitative judg-ment of the exposure risk.
The EVM drew primarily on data from weighed 4-day or 7-day records from a 1986–1987 national nutrition survey for estimates of nutrient exposures from food sources. Nutrient intakes from supplements were estimated from manufacturers’ information on the nutrient content of supplements available in the United Kingdom (as labeled on the products) and their sales from an over-the-counter registry. Population estimates of the mean and 97.5th percentile of nutrient intakes from food sources were presented, and any population subgroup with the potential to have high intakes was identified. Further indication of risk was derived from calculations of maximal nutrient exposure: the sum of the estimated 97.5th percentile of nutrient intake from food sources for the population as a whole, the highest nutrient dose available per unit of supplements, and where relevant, from drinking water based on maximal concentration allowed in the water and an assumed quantity of water consumed per day.
The IOM relied primarily on 24-hour dietary intake recall data and quantitative assessments of water and supplement intakes from nationally-representative U.S. surveys. Data for Canada were drawn from a limited number of provincial surveys, including 24-hour recalls and assessments of supplement intake. These data were used to estimate the distributions of usual intake for different age, sex and life-stage (pregnancy or lactation) subgroups, adjusted for day-to-day variation. For nutrients (e.g. iodine) not captured in the surveys, exposure estimates were derived from a market basket sur-vey, and no adjustment for day-to-day variation in individuals’ intakes was conducted. The estimated distributions of usual nutrient intakes from food and supplements for specific age, sex, and life-stage subgroups were compared to the ULs for these groups to yield a judgment of the magnitude of the risk of adverse effects in the population. 3 Information needs 3.1 Population subgroups The results of the intake assessment are most useful when estimated for the subgroups with relevance for the UL. For example, if the estimated UL for a nutrient differs for specific subgroups within the population (e.g. based on age, sex, or life stage), the assessment of nutrient exposure should be conducted separately for each subgroup. Population subgroups also may be defined on the basis of vulnerability to excess consumption of the nutrient because of region, socioeconomic status, ethnic background, etc. Ideally, the estimate of exposure to a nutrient obtained in a subgroup is based on intake information collected on individuals that belong to the group. If intake data for a subgroup of interest are unavailable, their intakes can be inferred from available data for a different subgroup; but it is important to recognize the limitations of such inferences. For example, intake data for adults can

Annex 4
159
be adjusted down using the relative amount of energy consumed by a child and an adult. This adjust-ment would address the problem of amounts of energy consumed. If the children consume a very different menu of foods or have less dietary diversity than adults, however, this adjustment might significantly distort the relative amounts of nutrients consumed by the children. 3.2 Relevant form of the nutrient The nutrient for which exposure is assessed determines the type of intake information and food and supplement composition data required. Consider for example vitamin C. Risk assessors may be inter-ested in the distribution of total nutrient intake from sources that include water, food, other beverages, supplements and nutrient-containing drugs. In the case of folate, it may be that only exposure to the added forms of the nutrient in fortified foods and supplements is of interest—if the hazard is associated only with that form. Since the UL for magnesium in the United States and Canada is defined for intake of magnesium from supplements and medications but not from food, only the supplement and medication intake distributions would be relevant to the estimate of exposure.
When total exposure to a nutrient is of interest, differences in the bioavailability of the nutrient in different food forms may need to be considered. This is the case for folate, for example, because folic acid, which is used as a fortificant, has greater bioavailability than naturally-occurring forms of folate. When the exposure assessment needs to consider the bioavailability of different nutrient forms, a food composition database is needed that reports the content of each relevant form in foods. 3.3 Time frame We focus on methods and data needs for assessing chronic rather than acute exposure. Here, the reference time period is implicitly taken to be approximately one year, but other time frames are equally accommodated under the conceptual framework that we discuss. We recognize that lifetime exposure to a substance is used in some types of risk assessment. In light of the potential for different adverse endpoints for different age, sex, and life-stage subgroups, however, we argue that a shorter reference period is more relevant.
To estimate usual (or chronic) exposure to a nutrient, the best approach is to estimate the distribution of usual nutrient intake. Because individuals vary the amounts and types of food and supplements that they consume each day, estimation of the distribution of usual intakes by individuals in the group poses a number of challenges. (See Section 3.5 for more information.)
Although assessing acute exposure to nutrients also may be of interest, the data needs and statistical approaches are very different. Data are not needed on the habitual or long-run average intake of the nutrient. Instead, acute exposure estimates are based on the amounts of the nutrient consumed over one day or perhaps over an even shorter period such as one meal. The challenge then is to establish which days or periods of an individual’s intake are most relevant for assessment. 3.4 Databases for estimating nutrient intakes Various types of intake information may be available. For exposure assessment, it is important to analyze the data that best capture individual-level intakes.
In some countries, data on the daily intakes of individuals are collected routinely in nation-wide food consumption surveys that provide reasonably precise, up-to-date nutrient exposure information in a large sample. In some other countries, national food consumption surveys have been conducted periodically. Although other sources of intake information such as household or national food disappearance data also are typically available, the resulting exposure estimates are less valid than those based on individual-level data.
In many parts of the world, individual-level food consumption data may not be available. However, aggregated data such as national food disappearance data, household purchasing surveys or food inventories, or marketing data may be available. These data sources reflect food availability rather than food consumption, and they typically omit water consumption (WHO 1997). Clearly,
A Model for Establishing Upper Levels of Intake for Nutrients and Related Substances
160
exposure estimates based on such data are less precise than those based on individual consumption data from well-designed and well-conducted surveys. Using aggregate data to estimate exposure requires making assumptions that may not always be testable. We make recommendations on esti-mating exposure under different scenarios in Section 6.
When more than one database is available, the criteria for choosing one database over another in a particular nutrient exposure assessment include the following:
• Degree to which the information captures individual-level consumption. • Appropriateness of the database for the subgroups for which exposure is to be assessed. • Comprehensiveness of the intake assessment (i.e. capturing food, supplement and water
consumption). • Generalizability of the sample to the larger population (a function of the sample size and
sampling design). • Timeliness of the data: data obtained years ago may not reflect today’s eating habits, food
fortification practices, or supplement use patterns. 3.5 Uncertainties associated with nutrient intake estimates Most nutrients are present in a wide variety of foods; thus assessing exposure to any one nutrient typically will require information on total dietary intake or at least on total intake of the relevant form. This is in contrast to determining exposure to food contaminants such as pesticides, which ordinarily are used on a limited number of commodities. In these cases, it often suffices to gather information on the intake of a relatively small number of foods and beverages.
Reliably estimating usual nutrient intake distributions is challenging. Uncertainties and biases arise from many sources, including the methods used to collect dietary intake information, the type of dietary information that is collected, the food composition databases, and the statistical methods used to analyze the data. Some biases can be reduced or eliminated and some uncertainties can be quantified. Others are impossible to determine, and the risk assessor must make assumptions that are largely un-testable. Clear documentation of these assumptions is advisable. In the best of cases, individual-level information on food, supplement, and water intake is available on a representative sample of individuals over the appropriate period. Food intake data would then be translated into nutrient intake data using food composition databases that disaggregate recipes and foods into nutrient content.
Difficulties in the estimation of total nutrient intake of an individual or of a group arise because of:
• Heterogeneity in food consumption across subgroups: Food intake varies by age group and
sex. Nutrient intakes can also vary across regions or cultural groups because of differences in food availability, food selection, or customary food preparation practices (e.g. the use of iron pots increases the iron content of foods). In order to capture exposure at the national or regional levels, this heterogeneity must be taken into account.
• Day-to-day variability in intakes for a given individual: Persons typically vary the amounts and types of food they eat from day to day and from season to season. Nutrient consumption over a day or even over a single meal is important for assessing acute exposure. Yet assessing usual exposure requires that we estimate the usual or long-term nutrient intake—a quantity that we typically cannot observe directly.
• Systematic errors in measurements of food intake that rely on self-reporting: When dietary intake assessments of adults have been compared to intake measured using biomarkers of energy and nutrient, there is strong evidence of underreporting, particularly for energy intakes. While the magnitude and structure of the error differs depending on the assessment method (Kipnis et al., 2003), no method of assessment that relies on self-reporting appears

Annex 4
161
immune from this problem. Systematic overreporting of intakes may occur among some individuals as well, but errors of this type appear to be less common (Black and Cole, 2001) and have been the focus of much less study to date.
• Changes in the nutrient content of foods: Increasingly in many nations, voluntary fortification of a wide array of foods creates an almost insurmountable challenge to managers of food composition databases. To portray the nutrient content in foods accurately, composition data-bases should be updated frequently and be specific enough to accommodate many different formulations of the same foods. Food intake assessments should include the collection of brand names for processed foods to ensure that food composition data match the foods consumed.
• Changes in supplement formulations: Some reformulated products will be sold under previously used brand names. Other products will be introduced and pulled from the market within a relatively short period.
Ideally, the collection of individual-level data on total nutrient intake coupled with the
application of appropriate statistical methods will result in a reliable estimate of the usual total intake distribution or usual exposure distribution in the subgroup of interest. If the distribution of exposures in the subgroup is available, then it is possible to carry out ‘what-if?’ types of analyses to evaluate changes in exposure assessments that might result from specified policy actions. Such analyses are not possible when only a summary of the exposure distribution, such as a median or a percentile, is avail-able.
Even in an ideal scenario, the estimated exposure distribution is exactly that: an estimate. Assuming that no biases are introduced by the statistical methods used to obtain the estimate, other biases may have been introduced if intake data do not capture individual intakes accurately. The sample size used to obtain the estimate determines the size of the sampling variance associated with distribution summaries such as percentiles or mean. In the specific case of usual intake distributions, the precision of the estimate increases not only with the number of individuals in the sample, but also with the number of replicate observations obtained for each individual in the sample. Moreover, risk assessment typically involves upper-tail quantiles of the usual intake distribution. It is well docu-mented that estimates on the tails of distributions are less accurate than those in the center of the distribution. 4 Assessing exposure under (almost) ideal circumstances 4.1 Estimating the distribution of usual nutrient intake Consider the problem of estimating the distribution of usual total nutrient intake at the national level. Ideally, total daily intake (food, supplements, and perhaps water) of a large sample of individuals representative of the age, sex, and life-stage groups in the population is observed over many days during the time period of interest. This permits direct estimation of usual nutrient intake for each individual in the sample. The distribution of usual intakes could then be used to estimate, for example, the proportion of individuals in the population with usual intakes above or below a given threshold, such as a UL.
For reasons of cost and respondent burden, observing daily intake for a large enough number of days to permit direct calculation of usual intakes is not practical. Even for macronutrients with relatively low day-to-day variance in consumption, even seven days of intake data are not enough to assess usual intake accurately at the individual level (Basiotis et al., 1987). With the appropriate statistical methods, however, it is possible to accurately estimate the distribution of usual intakes in a population or subgroup given a smaller amount of information: that is, the total nutrient intake for a 24-hour period for each person in the sample and, for a subsample, the same information obtained on a nonconsecutive day.

A Model for Establishing Upper Levels of Intake for Nutrients and Related Substances
162
A 24-hour recall, weighed food record, or diet history can be used to capture the total daily intake of an individual (van Stavern and Ocke, 2004). However, if the purpose of the dietary assessment is to estimate the distribution of usual nutrient intakes in a (sub) population, the 24-hour recall is generally considered to be the most suitable instrument, in part because of its low respondent burden and cost-effectiveness (Biro et al., 2003). The 24-hour recall also has the advantage of being easily re-administered to individuals, facilitating the collection of data on individuals’ intakes across non-consecutive days, different days of the week, and different seasons. Such temporal spread in dietary data collection is important in accounting for major sources of variation in individuals’ nutrient intakes over time.
The statistical methods for estimating usual nutrient intake distributions are described elsewhere (NRC, 1986; Nusser et al., 1996; Carriquiry, 2003). In a recent publication, Hoffman et al. (2002) compared the performance of several methods for estimating usual nutrient intake distribu-tions. In a nutshell, the statistical approach for estimating a usual nutrient intake distribution for a (sub) population includes adjusting daily nutrient intake to remove the day-to-day variability in individual intakes. After adjustment, the estimated usual nutrient intake distribution has a variance that has removed the effect of day-to-day variability within individuals and, therefore, reflects only the variability in intakes among the individuals in the group. The methods require 1) at least two independent observations on total nutrient intake for at least a sub-sample of individuals in each age, sex, and life-stage group and 2) food composition databases and supplement product information that accurately reflect the nutrient content of the foods and supplements consumed. The major assumption behind the methods is that daily nutrient intake as captured by 24-hour recalls is an unbiased estimate of usual nutrient intake. Implicitly, that assumes that a simple measurement error model holds, namely:
Daily intake = usual intake + measurement error.
Here, daily nutrient intake is computed from all sources, including supplements and water, if applic-able. Perhaps after a suitable statistical transformation, it is assumed that daily intakes, usual intakes, and measurement error are normally-distributed random variables; and then estimates are obtained using standard statistical procedures. The transformation step at the end of the adjustment, which maps intakes back from the normal scale into the original scale, is an important component of the approaches for estimating usual nutrient intake distributions. If this transformation is not carried out well, a potentially serious bias in the estimate of the distribution can be introduced.
The tails of the estimated usual nutrient intake distribution depend critically on the relative size of the within-individual variance (that is, the individual day-to-day variance) and the between-individual (individual-to-individual) variances of intake. Only by obtaining replicate observations on at least some individuals in the sample can we obtain information about the within-individual variance of intake. Thus, in the typical survey in which no more than two daily observations are collected for each individual, the variance ratio will not be precisely estimated. The precision of the estimate is higher when the nutrient is consumed almost daily and in approximately constant amounts by most individuals in the sample. Consequently, the standard errors of tail exposure probabilities would be smaller. For nutrients that are consumed occasionally in bolus amounts (e.g. through the sporadic consumption of highly fortified foods or supplements), the variability of the within-individual variance in intake across persons in the sample results in a less precise estimate of the variance ratio that is used to adjust the intake distribution.
If daily intakes are assumed to be unbiased measurements of usual intakes, why not estimate the distribution of usual intakes simply as the distribution of individual mean intakes from multiple 24-hour recalls or food records or even as the distribution of one-day intakes? Under the model above, the variance of the individual mean intakes is given by Variance of individual mean intakes = variance of usual intake + measurement error variance / number of days,

Annex 4
163
where the term ‘number of days’ refers to the number of daily intake observations available for each individual in the sample.
It is well documented that the day-to-day variance (or measurement error variance) for micronutrients within individuals is at least as large as the individual-to-individual variance (or usual intake variance) (e.g. Sempos et al., 1985). Thus, unless the number of daily observations on each individual in the sample is very large, the distribution of observed individual means has a variance that significantly exceeds the usual intake variance (Hoffman et al., 2002). This excess variance has the potential to increase the length of the tails of the estimated intake distribution enormously and, consequently, to overstate the proportion of individuals with usual intakes above a certain threshold. Although estimates of central attributes of the exposure distribution such as means and medians are not greatly affected by the size of the variance of the intake distribution, estimates at the tails, such as 90th or 99th percentiles, are very sensitive to incorrectly estimated variances. If the recommended level of intake and the UL for a nutrient are close to each other, it is particularly important to accurately estimate the shape of the exposure distribution.
In a number of countries, daily intakes are collected in complex nationwide food consumption surveys that account for age, sex, life-stage, and ethnic and seasonal variability in food consumption. It is generally accepted that these surveys result in information that is accurate enough to estimate exposure to nutrients from food sources, assuming that the food composition databases used are up to date and sufficiently detailed to include the many versions of foods available to consumers. However, food consumption surveys often do not collect daily supplement intake information. We discuss possible approaches for combining supplement and food intake data when data are collected using different methods in Section 6.
Given an estimate of the exposure distribution and a threshold such as a UL, it is possible to determine the proportion of individuals in an age and sex group whose intakes of the nutrient are above or below the UL. It is important to note, however, that as long as the dose-response curve for nutrient intakes above the UL is unknown, we cannot infer that any intake above the UL puts the individual at risk. 4.2 The importance of adjusting daily intake data for within-individual variance The adjustment of daily intakes for within-individual variance in intakes is a very important feature of the methods proposed by the NRC (1986) and by Nusser et al. (1996) for estimating usual exposure distributions. The effect of the statistical adjustment is not important in the center of the distribution, but the adjustment has a major impact on the estimates of the tails of the usual intake distributions.
We prepared Table A4-1 to illustrate the importance of removing the day-to-day variance in daily intakes within individuals when estimating exposure distributions. The table allows comparison of different approaches for obtaining estimates of a set of percentiles in the upper half of the exposure distributions of vitamin C and zinc for men and women aged 19 to 30 years and for children aged 4 to 8 years.
The intake data used in the example were from 24-hour recalls collected in the third National Health and Nutrition Examination Survey. Approximately five percent of sampled individuals provided a second independent daily intake observation. The exposure estimates presented in Table A4-1 were computed using four approaches:
1. Using only the first 24-hour recall and not adjusting daily intakes for day-to-day variance (one-day estimates, diet only).
2. Using both 24-hour recalls where available and adjusting the daily intakes using the ISU method (Nusser et al., 1996) (adjusted estimates, diet only).

A Model for Establishing Upper Levels of Intake for Nutrients and Related Substances
164
Table A4-1. Mean and selected percentiles of estimated exposure distributions for vitamin C and zinc computed using four approaches for three sex and age groups
One-day estimates, by percentile Adjusted estimates, by percentile Nutrient and
subgroup Mean 50 75 90 95 97.5 99 Mean 50 75 90 95 97.5 99Vitamin C Males 19–30 y Diet only 124 82 167 266 368 475 613 122 115 149 186 212 237 269Diet + supplements
156 94 192 334 475 617 1191 151 120 158 211 274 459 1140
Females 19–30 y Diet only 93 63 128 208 274 363 482 93 87 115 146 167 187 213Diet + supplements
132 81 165 267 431 555 786 128 92 131 199 260 541 693
Children 4–8 y Diet only 102 82 136 208 248 300 365 102 98 122 148 165 182 202Diet + supplements
126 101 162 246 301 370 456 122 108 143 179 218 313 385
Zinc Males 19–30 y Diet only 15.5 13.4 18.6 26.3 33.2 38.8 46 15.4 15.2 17.2 19.2 20.6 21.8 23.3Diet + supplements
17 14.5 21.5 29.6 37 44 56 17.1 15.7 18.1 22.2 29.1 33.7 39.4
Females 19–30 y Diet only 9.8 8.6 12.2 16.5 21.4 26.7 31.6 9.9 9.6 11.3 13.1 14.4 15.5 17.1Diet + supplements
12.3 9.4 14.7 25.2 31.6 38.7 45 12.3 10.1 12.5 23.2 28.9 36.2 38.8
Children 4–8 y Diet only 9 8 11 14.6 16.9 19.1 24.4 8.9 8.7 10.2 11.7 12.8 13.9 15.2Diet + supplements
9.5 8.3 11.9 15.7 19.7 23.5 28.7 9.5 8.8 10.5 12.4 14.6 21.3 24.6
3. Using only the first 24-hour recall and adding to that an estimate of daily supplement intake
obtained from the information collected from respondents about their usual supplement consumption (one-day estimates, diet plus supplements).
4. Using both 24-hour recalls where available and adding to the adjusted individual usual nutrient intake from food sources the self-reported usual nutrient consumption from supple-ments (adjusted estimates, diet plus supplements). From the table, it is clear that adjusting daily intake data for within person variability has a
large impact on the estimated upper percentiles of the exposure distribution. Consider, for example, vitamin C in children aged 4 to 8 years. When only one day of daily intake information is used to estimate the 99th percentile of intake, the resulting value is 365 mg/day. When two independent 24-hour recalls and the appropriate statistical methods are used for calculations, the estimate is 202 mg/day. The mean of the exposure distribution and central percentiles such as the median, however, are not noticeably different across unadjusted and adjusted distribution estimates.
Removing day-to-day variance in intake from daily intake data is particularly important when assessing exposure to nutrients or other food components that are consumed in very different amounts from day to day. It has been shown (e.g. Beaton et al., 1979; Gibson et al., 1990; Sempos et al., 1985; Tarasuk and Beaton, 1991a, 1991b) that the day-to-day variance in intakes varies greatly across nutrients and is larger for nutrients that are not widely distributed in the food supply. As an example,

Annex 4
165
the ratio of the within- and the between-individual variances for energy (1.69) is much lower than for vitamin A (6.09).
From a statistical point of view, the variance adjustment in the NRC and the ISU methods results in exposure estimates that are similar to estimates that might be obtained if the daily intake of sampled individuals could be observed over a very large number of days. If a large number of daily intake observations were available for each sample person, then estimating the exposure distribution as the mean of those daily intakes would result in a similar distribution estimate. The number of days needed to obtain a mean nutrient intake with a variance approximately equal to the between-individual variance ranges from about 3 to 40 days, depending on the nutrient (Basiotis et al., 1987). Thus, the mean intake collected via food records or diaries over a single week typically will not result in a precise estimate of the upper percentiles of the exposure distribution for the nutrient. 5 Sources of uncertainties We first focus on the problem of assessing exposure to nutrients in the food supply and later discuss the more difficult problem of assessing total intake. 5.1 Available food intake data Collecting individual-level daily food intake data in nationwide food consumption surveys is expen-sive. Few countries conduct such extensive surveys on a regular basis. In addition to collecting food intake data, countries need to maintain extensive food composition databases tailored to the local foods and perhaps even to the local food handling practices that are likely to affect the nutrient content of foods. 5.1.1 Individual-level intake data In general terms, individual-level food intake data result in more precise exposure distribution esti-mates than do household-level data. Food intake at the individual level can be collected with 24-hour recalls, multiple day food records or diaries that record weights or measures, and various kinds of food frequency questionnaires. Household-level data, in turn, provide more information about expo-sure than do regional or national-level data. 5.1.1.1 24-hour recalls For the purposes of assessing exposure to nutrients, having a trained interviewer obtain multiple 24-hour recalls captures daily food consumption most accurately. During an in-person interview with the aid of food models and memory cues, respondents are likely to remember the foods and beverages consumed during the previous day and the amounts consumed. Interviews carried out by phone sometimes result in underestimation of the amounts of food consumed, but studies suggest that it may be possible to make statistical adjustments to the data collected by phone to represent intake more accurately. Underreporting is a widely documented source of error in 24-hour recalls, but there is some evidence to suggest that the extent of this problem may differ across cultures (Harrison et al., 2000). In the United States and Europe, biomarker validation studies have shown that intake data collected via 24-hour recalls tend to underestimate the actual total amount of energy and protein consumed. The magnitude of the underestimates differs, however, suggesting that foods are differentially misreported (Kroke et al., 1999; Subar et al., 2003). One study that also considered potassium found little evidence of underreporting for this nutrient (Freedman et al., 2004). Thus it is unclear to what extent the systematic underreporting of energy affects the estimated distribution of nutrient intakes in a (sub) population.
As discussed earlier, the estimation of usual exposure distributions requires that at least one replicate 24-hour recall be obtained on at least a sub-sample of persons in each age, sex, and life-stage group. The replicate observations permit estimating the relative sizes of the day-to-day and individual-to-individual variances in intakes. In turn, this allows the statistical adjustment of the distribution to obtain more precise estimates of the tails. Obtaining recalls for only one day can result
A Model for Establishing Upper Levels of Intake for Nutrients and Related Substances
166
in exposure distributions that overestimate the proportion of intakes at the tails, as shown in Table A4-1. Recently, it has been suggested that when only one diet recall is available, it might be appropriate to ‘borrow’ information on day-to-day variability in nutrient intake from a different sample in order to adjust the daily intake (Jahns et al., 2005). This may be a reasonable approach if it is possible to assume that food intake patterns, which determine day-to-day variability in intakes, are comparable across the two samples. From a statistical point of view, this approach amounts to combining in-sample and out-of-sample information into a single estimate. Depending on the specific problem, the properties of the resulting exposure estimate can be inferred, at least approximately. 5.1.1.2 Multiple-day food intake records Multiple-day food records or diaries also capture daily food intake at the individual level, and they can be designed to capture supplement and medication intakes too. If self-administered, recorded food intakes may not accurately reflect food consumed, despite intensive training of respondents, and follow-up by the interviewer (e.g. visits to commercial outlets to obtain detailed information on foods consumed away from home) can improve the completeness of the intake data (e.g. Henderson et al., 2003). In addition, some have argued that the act of recording food intake may alter the eating pattern of the individual during the recording period. When intake estimates from multiple-day food records have been compared to biomarkers, both underreporting and overreporting have been documented (Black and Cole, 2001; Goris et al., 2000; Goris and Westerterp, 1999; Henderson et al., 2003). Further, the high respondent burden associated with record-keeping can bias response toward more educated, motivated subgroups of the population (van Stavern and Ocke, 2004).
Distributions of usual nutrient intake can be estimated using data from food records. As discussed in Hoffman et al. (2002), usual intake distributions often are estimated as the distribution of seven-day intake means. Intake data from multiple-day food records also can be used to estimate usual nutrient intake distributions by following the methods described above using 24-hour recalls (Hoffman et al., 2002). However, because food records are typically collected over consecutive days, adjustment for the correlation among daily intakes needs to be incorporated into the methods for estimating exposure distributions (Carriquiry et al., 1995). Because seven days are not enough to accurately capture an individual’s usual nutrient intake, the estimated usual intake distributions tend to have a variance that exceeds the between-individual variance. Hoffman et al. (2002) estimated usual nutrient intake distributions using seven-day food records collected in a French and in a Belgian survey and found that the upper percentiles of the estimated usual nutrient intake distributions obtained from seven-day means tended to exceed those that were obtained applying variance-adjustment methods such as the ISU method (Nusser et al., 1996). 5.1.1.3 Food frequency questionnaires The use of food frequency questionnaires is the least costly means of collecting and analyzing individual-level intake data. In contrast to 24-hour recalls or food records, frequency questionnaires attempt to capture usual rather than daily food intake. Typically, only one questionnaire is adminis-tered to each person in the sample. Except in validation studies, no attempt is made to calibrate the responses using multiple questionnaires or other information. Food frequency questionnaires can be quantitative or qualitative. For both types of questionnaire, the period for which frequency of consumption is reported is specified, but it may vary from survey to survey. In a quantitative ques-tionnaire, individuals are asked to record not only frequency of consumption of the listed foods and beverages but also usual portion sizes. In a qualitative questionnaire, only the frequency of consump-tion of the listed foods is recorded. In terms of nutrient exposure assessment, the usefulness of qualitative questionnaires is limited because it is necessary to make sweeping assumptions about average portion sizes for each age, sex, and life-stage group. In addition, both quantitative and quali-tative questionnaires must, by construction, include a limited list of foods and beverages. In general, having a limited list also limits the usefulness of the intake information collected. On the other hand, if it is known that excessive exposure to a nutrient in a region is due to the consumption of a small number of foods and beverages, a carefully designed quantitative food frequency questionnaire can

Annex 4
167
provide very valuable information for exposure assessment at a low cost. In principle, an estimate of the usual exposure distribution can be obtained directly from the intake data collected via the questionnaires. Studies have shown, however, that food frequency questionnaires tend to do a poor job of capturing true usual nutrient intake (Kipnis et al., 2003). Some evidence suggests that underreporting is an even greater problem with food frequency questionnaires than with 24-hour recalls or food records (Kroke et al., 1999; Subar et al., 2003 ). Some overreporting of intakes has also been documented, although there has been considerably less examination of this source of error (Johansson et al., 1998).
Figure A4-1 was presented by Freedman et al. (2004) and serves to illustrate the differences in estimated exposure distributions that may result from various methods of collecting and analyzing dietary intake data. In the figure, usual energy intake distributions for adult women were estimated using a food frequency questionnaire, a single 24-hour recall, multiple 24-hour recalls, and an estimate of nutrient intake obtained from a biomarker. In addition, the 24-hour recalls were analyzed using a modified version of the method proposed by the NRC (1986) that was described in an IOM report (2003), the ISU method (Nusser et al., 1996) and the NRC method using protein-adjusted energy intakes to adjust for day-to-day variability in intakes. The differences are striking, especially when contrasting the exposure distribution estimates that are based on a food frequency questionnaire and on a single 24-hour recall. It is clear from Figure A4-1 that the estimated 95th percentile (or any other percentile) of energy consumption differs very significantly when estimates from the single food frequency questionnaire or 24-hour recall are compared with the other estimates. The figure also illustrates the impact of different adjustments for day-to-day variation on the estimate of the upper tail of the distribution. Although this example is for energy, not a nutrient, the results underscore the need to understand biases in the methods of intake assessment and analysis when interpreting exposure estimates.
5.1.2 Aggregate data on food consumption When individual-level food intake data are not available, sometimes household-level data are available. At the household level, food intake often is estimated indirectly from information on food purchases, and sometimes the data are corrected for spoilage and waste or changes in food inventories within the household. Per capita estimates of nutrient exposure can then be derived. Alternatively, if household composition is known, household-level data can be disaggregated into individual-level data by making assumptions about the consumption levels of children and adults, based, for example, on age- and sex-specific reference values for body weight and height and estimates of energy require-ments for maintaining weight. Although this approach might approximate individual-level consump-tion of macronutrients, there is little evidence that it is useful for estimating individual consumption of micronutrients—especially considering that food choices may vary considerably across household members. Household-level data are not well suited for estimating usual exposure distributions but may provide useful information for determining potential sources of excessive nutrient exposure in small geographic areas or in different socio-demographic groups.
National- or regional-level food-use data such as food balance sheets, regional diets, and sales of products such as fortified foods or supplements provide very limited information for quantitative exposure estimation (WHO, 1997). Typically, these country-level data are limited to point summaries (such as median, means, or perhaps percentiles) of food intake distributions. Because the summaries are based on measures of the available food supply rather than actual consumption patterns, they provide only crude estimates of exposure, typically on a per capita scale. Probabilistic approaches can be applied to estimate distributions of nutrient exposure among individuals by making gross assump-tions about consumption patterns and average body weight of children and adults (WHO, 1997). Without data on the food consumption patterns of individuals within a population, however, it is not possible to estimate nutrient exposure levels among vulnerable subgroups or subgroups having high levels of consumption of the nutrient.

A Model for Establishing Upper Levels of Intake for Nutrients and Related Substances
168
Figure A4-1: (modified from Freedman et al., 2004) Estimated usual energy intake distributions obtained using a food frequency questionnaire (FFQ), a single 24-hour recall, multiple 24-hour recalls,
protein-adjusted multiple 24-hour recalls, and doubly-labeled water information. 5.2 Limited information on intakes from fortified foods and supplements For most nutrients, the consumption of supplements and/or fortified foods—rather than the consump-tion of conventional foods—may be the reason for reaching the threshold beyond which consumption may pose a risk. Unusually high content of the nutrient of interest in the drinking water may be another important contributor to high intake.
In spite of the increasing impact of fortified foods and supplements to the nutrient intakes of individuals all over the world (e.g. Arab et al., 2002; Henderson et al., 2003), few countries have reliable intake data on these products. Ideally, data on daily consumption of nutrients from highly fortified foods and supplements would be collected via 24-hour recalls and food composition databases would accurately reflect the nutrient content of those products. The consumption would then be added to the daily nutrient consumption from other sources to obtain a total daily nutrient intake that could be statistically adjusted for estimating usual exposure distributions. With only two days of daily information on each individual in the sample, it would not be possible to capture usual fortified food and supplement intake from the occasional consumer (e.g. the person who has a cold and takes mega-doses of vitamin C for a few days). Some characteristics of supplements make data collection less challenging for supplement intake than for conventional food intake. For example, portion size is easier to determine because individuals typically take a pill or 5 cc or some other well-defined dose. Assuming that brand or label information is accurate and available and that all pertinent information has been recorded, determining the amount of the nutrient consumed from these types of products by an individual on a given day is easier than determining the amount of the same nutrient consumed from conventional food sources.
A significant concern in the assessment of nutrient exposure from fortified foods and supple-ments has to do with the information provided by manufacturers on the product label. Different countries regulate label information differently. Do nutrient contents listed on the label represent the average amount of the nutrient, and, if so, is it the average over units and shelf-life? Alternatively, do

Annex 4
169
the listed contents represent a minimum? In the latter case, a potentially significant overage can be expected. In order to interpret intake from fortified foods and supplements correctly, it is important to understand how the label values are derived.
Sometimes no information is available on supplement intakes by individuals. In such cases, how can total usual intake distributions be estimated? Several alternative approaches could be used; but, at best, these approaches produce only rough estimates of the total exposure distribution or of the exposure distribution for nutrients consumed from supplements. One method combines information on intake (from food) and maximal offering (from supplements). The U.K. Expert Committee on Vitamins and Minerals (2003), for example, derived an estimate of the upper tail of the distribution of total exposure by adding two quantities: the 97.5th percentile of nutrient intake from food sources and the maximal daily intake of the nutrient that would be available from supplements. The latter was obtained by choosing the product with the highest dose of the nutrient among both single and multiple nutrient supplements on the market. For most nutrients and most age and sex groups, the estimate thus obtained is likely to overestimate the true 97.5th percentile of the total exposure distribution by a substantial amount.
A second method would produce a less biased estimate. This method considers the array of doses of the nutrient among the most consumed products and then determines an average daily dose per person using sales data. A third method is a ‘worst case scenario’ estimate. It corresponds to the case in which every person in the sample consumes the average dose. A more realistic estimate could be obtained by making an informed guess about the proportion of persons that tend to consume supplements, by age and sex group and life-stage group. This information then could be combined with nutrient dosage information from product labels to obtain an approximate estimate of an individ-ual’s daily nutrient intake from supplement sources. 5.3 Food composition information When individual-level dietary intake data are available for assessment, the major source of bias and uncertainty in exposure estimates may well be the food composition databases. Food composition databases are used to map foods and beverages into nutrient content. We present sources of uncertainty in food composition estimates below. 5.3.1 Nature of the composition data Food composition databases are constructed primarily by chemically analyzing foods to determine nutrient content, calculating nutrient content based on composition information for ingredients used in mixed dishes, imputing values based on information on similar products, and relying on label information. Each approach introduces uncertainties.
The number of samples analyzed is directly proportional to the accuracy of the estimated average (across units) nutrient content of the food. Since analytical methods appropriate for determining the contents of the many nutrients in the food are expensive and time-consuming, usually relatively few samples of the food are analyzed. Then the average nutrient content (over the samples) is reported in the database. A specific food, however, can have widely varying nutrient content depending on factors such as the region where the food was grown, the season when the food was consumed, or the length of cooking time. For its nutrient database, the U.S. Department of Agriculture divides foods into groups depending on the proportion of calories that they contribute in the diet. For those foods considered to be ‘staples,’ they analyse a reasonably large number of samples obtained from different areas of the country and from different types of vendors to determine average (across units of the food) nutrient content. Since they analyse only a few samples of less frequently consumed foods, the estimated average nutrient content of such foods is less accurate.
Some databases use food label information or nutrient composition values provided by manu-facturers or the food service industry to represent the nutrient content of selected foods. For fortified foods, the degree of correspondence between the labeled value and the actual value may vary depending on the degree to which the fortificant can be distributed evenly within a batch and from batch to batch, the country in which the product is packaged, the length and conditions of storage of

A Model for Establishing Upper Levels of Intake for Nutrients and Related Substances
170
the product, and the nutrient involved. Food manufacturers must meet food labeling requirements, but different countries take different approaches to the regulation of labeling the nutrient content of fortified products. In the United States, for example, manufacturers are expected to list the low end of the distribution of nutrient content in the product. Therefore, any randomly-chosen fortified product (e.g. a box of cereal) likely will contain a substantially higher nutrient content than the one listed on the label (Rader et al., 2000). In the United Kingdom, on the other hand, manufacturers list the expected (or average) content of the nutrient in the product. In anticipation of the decay of some nutrients over time, manufacturers may add overages—amounts that exceed the labeled amount—of those nutrients to fortified food products. Thus, the content of some nutrients in such products depends partly on the date of consumption relative to the date of manufacture. 5.3.2 Number of recipes included in the database Commonly-consumed mixed dishes can be prepared using very different recipes and thus may have very different nutrient contents. Even the most complete food composition database will not include an exhaustive list of recipes for foods with multiple ingredients. The food composition database might include two or three variations on a recipe but cannot possibly include all versions of the dishes. Very detailed ingredient information for mixed dishes can be obtained during the course of a 24-hour dietary recall interview, but the resource implications of this additional data collection often mean it is not done. 5.3.3 Food fortification In countries where food fortification is voluntary (i.e. manufacturers are permitted but not required to add specific nutrients to foods), new versions of the same food with different nutrient content may be introduced into the market almost daily. Thus food composition databases can easily become out of date. Changes in fortification policies within countries (e.g. the mandatory fortification of flour with folic acid) also necessitate changes to the food composition database. The effect of changes in fortification practices on the distribution of usual intakes in a population can be modeled with existing food consumption data simply by updating the nutrient concentrations of selected foods in the database (e.g. IOM 2003; Lewis et al., 1999). If a more (or less) bioavailable form of the nutrient were used to fortify ingredients from which food products are made, the food composition database may need to track those ingredients meticulously to be able to report the content of the forms of the nutrient that are of interest. (Examples of ingredients that may contain added nutrients include flour, rice, salt, and milk.)
The validity of modeling done using such a method hinges on the assumption that food selection patterns do not change with changes in food fortification. 5.3.4 Sharing food composition from one country to another In many developing countries, food composition databases are not available or are incomplete. In principle, it might seem reasonable to share food composition data or databases among nations. Prob-lems arise, however, if fortification policies differ or if data on commonly-consumed local foods are not available. Different growing conditions (such as soil and weather characteristics) may introduce variability in the nutrient content of a food (e.g. potatoes grown in the state of Idaho in the United States have higher selenium concentrations than those grown elsewhere). In developing nations, many local fruits, vegetables, and animals are staples in the diet and provide a large portion of the calories and nutrients consumed by the population. The absence of accurate nutrient content data for the local food can seriously distort exposure estimates.

Annex 4
171
6 Guidelines and recommendations for assessing total nutrient chronic exposure To assess total exposure to a nutrient, the goal is to estimate the distribution of individual usual exposures in the population or subgroup under study. We discuss how to reach for that goal when the available information differs in quality and quantity. The information also is summarized in Table A4-2.
Table A4-2. Summary of qualities and approaches to different types of dietary intake data
Food intake data
Supplement intake data
Food composition data Suggested approach Reliability of estimates
Individual – multiple 24-h recalls
Individual – multiple 24-h recalls
Adequate • Compute total daily intake
• Remove day-to-day variance
• Obtain distribution of usual exposure
• Most reliable
• Biases may result from underreporting and from overages in fortified foods and supplements
Individual – multiple 24-h recalls
Food frequency questionnaire (FFQ )
Adequate • Adjust individual usual intake from food to remove day-to-day variance
• Add self-reported supplement usual intake
• Distribution of exposure is distribution of total adjusted intake
• Supplement FFQ may not reflect true usual intake
• Same causes of bias as above
Individual – single 24-h recall
Individual – single 24-h recall
Adequate • Add food and supplement intake
• Borrow adjustment factor from com-parable country
• Day-to-day intake pattern may not be the same
• Biases as above
Individual – FFQ
Individual – FFQ
Adequate (for foods in FFQ)
• Assume that self-reported intake is “usual” intake
• Add supplement and food usual intake
• Exposure distribu-tion is distribution of self-reported total intake
• Low correlation between FFQ report and actual intake
• Biased downwards if FFQ does not include all foods with high nutrient content
Household – disappearance data
Household – purchasing data
Adequate • Adjust household disappearance data for spoilage and waste
• Disaggregate household level data using info on house-hold composition, relative energy requirements
• Actual food and supple-ment intake may not correspond to needs by body weight and sex
• Biases at individual level may depend on socio-economic status of household

A Model for Establishing Upper Levels of Intake for Nutrients and Related Substances
172
Table A4-2. Continued
Food intake data
Supplement intake data
Food composition data Suggested approach Reliability of estimates
• Use supplement information to allocate intake to household members
• Compute an approximate total daily intake per individual
Household – disappearance data
None Adequate Disaggregate food intake data as above
Infer a per capita supplement consumption from sales and label information
Compute an approximate total daily intake per individual
If intake from supple-ment is main deter-minant of upper tail of intake distribution, serious biases may occur due to lack of individual consumption data
Other biases as above may occur
National – mean consumption of staples per capita
None Composition of staple foods available
• Estimate upper-tail quantities such as 95th and 99th percentiles as the corresponding percentiles in other countries shifted by the difference between the two countries’ mean intakes
• Inaccuracies and biases as above
• In addition, strong assumption about similar intake patterns in two countries
• Small difference may result in significant biases at the upper tail
National – food balance sheet
None Composition of staple foods available
• Disaggregate national data into individual data using information on demographics and food requirements by age and sex
• Proceed as above
• Same as above
• Intake data collected using multiple diet recalls or food intake records, information on
supplement intake: Assuming that the data are available for a representative sample of individuals, the exposure to nutrients in the food (distribution of intake) can be assessed as described in, for example, Dietary Reference Intakes: Applications in Dietary Planning (IOM, 2000). The accuracy of the exposure estimate is increased if the within-individual variance in intake is removed from observed daily intakes by the appropriate statistical procedure (e.g. Nusser et al., 1996; IOM, 2000, Hoffman et al., 2003; Carriquiry and Camano-Garcia, 2005). (See the example in Table A4-1.) To estimate nutrient intake from supplements, information is needed on brand, dose and frequency. Adding up each individual’s daily intake from food and from supplements provides a total daily nutrient intake. The intakes then can be statistically adjusted to obtain a distribution of usual exposure. If only exposure to nutrients consumed from supplements is sought, no statistical adjustment is needed, since respondents already report their usual or habitual

Annex 4
173
intake. A statistical approach for adjusting a single 24-hour recall using an external estimate of the within-person and the between-person variances is discussed by Jahns et al. (2005).
• Food intake and supplement intake data collected using a food frequency questionnaire: An
estimate of exposure can be obtained simply by adding up the daily intake of the nutrient from food and supplement sources derived from the frequency responses. Since excess nutrient consumption is most likely to arise as a consequence of the consumption of highly fortified foods and/or supplements rather than through the consumption of unfortified foods, approximately accurate exposure estimates may be obtainable using food frequency questionnaires. In this case, one focuses assessment on the sources of the nutrient that determine intakes in the upper tail of the distribution. Studies have shown, however, that food intake reported via frequency question-naires is not highly correlated to actual intake (e.g. Subar et al., 2003). It is difficult to establish whether the proportion of individuals with intakes above a threshold such as a UL will be over-estimated or underestimated when only frequency of consumption is available, since this will depend on whether the items included in the questionnaire are those that contribute most to the nutrient intake by the group under study. If the nutrient for which an exposure estimate is sought is known to appear in a limited number of foods, then it would be possible to design a food frequency questionnaire to capture the distribution of intake by the group of interest relatively accurately and inexpensively.
• Food intake data are available, but supplement intake information is not: If it is known that an
important proportion of nutrient intake in age and sex groups is likely to be derived from supple-ments but no supplement intake information is available, it will be important to obtain an estimate from other data sources. If data on household purchases of supplements are available, it is pos-sible to estimate individual supplement consumption by considering household composition, type of supplement purchased, dose recommended by manufacturer, and other such factors. For example, if a specified brand of vitamins is purchased for a household with small children, one can assume that each child receives the recommended vitamin dose each day. Factors that are associated with supplement intake have been identified (REFS). In the United States, for example, health-conscious individuals tend to consume more supplements. As a result, persons who already consume adequate amounts of nutrients from fruits and vegetables tend to be the ones who also consume additional amounts of the nutrient from synthetic sources. Similar associations may have been observed in other regions and may help disaggregate household purchases or marketing data into individual consumption estimates.
• No food or supplement intake data for individuals: In cases when intake data on individuals are
not collected, household food disappearance data, national food balance sheets, and/or data on supplement sales may be available. To estimate exposure in this case, risk assessors have various options. When household-level data on food disappearance are available, it might be possible to estimate individual food consumption by first adjusting disappearance data for waste and spoilage and then using information on average household composition and the relative amount of food consumed by individuals in different age, sex, and life-stage groups. This approach assumes that consumption by each household member is directly proportional to the amount required by each person. This assumption may not correspond to the actual eating patterns within the home. Nutrient intake from supplements would then be added to the estimated nutrient consumption from food sources.
• Only mean consumption per capita is available: Suppose that from national-level information it is
known that the average consumption of a nutrient by school-aged children is M. When only an estimated mean consumption per capita is available, the challenge is to attempt to recreate the distribution of intakes in the group of interest. A mean consumption does not provide enough information to assess risk; what is needed is an estimate of the upper tail of the consumption
A Model for Establishing Upper Levels of Intake for Nutrients and Related Substances
174
distribution. It might be possible to ‘borrow’ information from other countries to assess exposure. Suppose that an exposure distribution has been estimated in another country using reliable information on nutrient intake from food sources, and that the mean exposure was estimated to be some value x. By assuming that the shape of the distribution of exposure is similar in the two countries, it is possible to estimate the percentiles of the exposure distribution by shifting the ‘borrowed’ exposure distribution by an amount equal to M-x. If data from more than one country or region can be used, the risk assessor would borrow information from the country that is most like the country of interest in terms of demographic, social and economic characteristics and in terms of the array of foods most consumed by the population. It would not be reasonable to calibrate a mean consumption in Ecuador using exposure distributions estimated in the United States, for example, but it might make sense to use data collected in Colombia to do so.
• No intake data at any level are available: Presumably, exposure assessment in a country where no
routine monitoring of food intake takes place is triggered by specific concerns about a nutrient or a small group of nutrients. In this case, it is useful to try to determine the potential upper bound of consumption in the age, sex, and life-stage groups of interest, perhaps by taking the following steps:
• Determine the concentration of the nutrient in the foods that provide the highest proportion of the nutrient consumption in the sex and age group of interest.
• Assume potentially highest consumption amounts by individuals based on body weight, income, season of the year, and other factors that might affect consumption of the foods.
• Add the maximum potential amount of the nutrient that might be consumed from supplement sources by considering product formulation, recommended dose, price, and availability.
• Estimate the proportion of individuals with potential consumption above a threshold such as a UL by counting the number of persons in an age and sex group with physical and socio-economic characteristics consistent with highest possible consumption of the nutrient.
This approach is likely to result in overestimation of the proportion of individuals with excess nutrient consumption, because at each step the risk assessor is considering the upper bound of consumption.
• Design of dietary intake surveys: If dietary intake data are to be collected via a nationwide or
perhaps only a region-wide food intake survey, it will be useful to consider the following desirable survey features: • The sample is representative of the population subgroups of interest. If oversampling of one
or more groups is desirable, then the appropriate individual weights should be constructed to allow for population-level inference.
• Food intake data are obtained over a long enough period to permit capturing possible seasonal effects on food intake. Similarly, food consumption collected during the seven days of the week permit capturing effects of weekdays and weekends on intake.
• Multiple observations are obtained on at least a representative sub-sample of individuals on days separated enough in time to allow for the assumption of independence of observations within a person. If consecutive days of intake data are collected, then the auto-correlation of intake over consecutive days must be estimated and incorporated in the analysis.
• For some nutrients, if the upper tail of the exposure distribution is driven by the nutrient content in some fortified foods or food aid packages, a reasonably accurate estimate of the proportion of individuals in the group with intakes exceeding the UL may be estimated at a reduced cost from information on intake of the fortified food or the foods in the aid package.
• In the case of infrequently consumed items, supplementing the 24-hour recalls with a propensity questionnaire (Carriquiry, 2003; NCI, unpublished work) permits distinguishing

Annex 4
175
the never-consumers from respondents who sometimes consume the items but did not do so over the survey days.
• Reporting the results of an exposure assessment: We have argued that in assessing the exposure to
a nutrient (or in fact, to any toxicant or other substances) it is important to obtain a reliable estimate of the usual exposure distribution in each of the subgroups of interest. In reporting the results of the exposure assessment, therefore, we recommend that as much information about the exposure distribution as possible be provided. At a minimum, the exposure assessor should report the median and several upper percentiles of the estimated exposure distribution. Since exposure distributions typically are very skewed, reporting a mean and a standard deviation is not useful: when distributions are skewed, the 97.5th percentile is not equal to the mean plus two standard deviations and thus the standard deviation is not a useful statistical summary. For illustration, consider the exposure distributions presented in Table A4-1 for adult females. For zinc, the value of the mean plus two SD is 14.7 mg but the 97.5th percentile is 15.5 mg. For vitamin C, the respective values are 172 mg and 187 mg.
References
Arab L, Carriquiry AL, Gaudet M, Scott S. Ethnic differences in the nutrient intake adequacy of premenopausal women: results from the National Health and Nutrition Examination Survey III. Journal of the American Dietetic Association 2002; 103: 1008-1014.
Basiotis PP, Welsh SO, Cronin FJ, et al. Number of days of food intake records required to estimate individual and group nutrient intakes with defined confidence. Journal of Nutrition 1987; 117: 1638-1641.
Beaton GH, Milner J, Corey P, McGuire V, Cousins M, Stewart E, deRamos M, Hewitt D, Grambsch PV, Kassim N, Little JA. Sources of variance in 24-hour dietary recall data: Implications for nutrition study design and interpretation. American Journal of Clinical Nutrition 1979; 32: 2546-2559.
Beaton GH, Milner J, McGuire V, Feather TE, Little JA. Source of variance in 24-hour dietary recall data: Implications for nutrition study design and interpretation. Carbohydrate sources, vitamins, and minerals. American Journal of Clinical Nutrition 1983; 37: 986-995.
Biro G, Hulshof KFAM, Ovesen L, et al. Selection of methodology to assess food intake. European Journal of Clinical Nutrition 2002; 56 (Suppl 2): S25-S32.
Black AE, Cole TJ. Biased over- or under-reporting is characteristic of individuals whether over time or by different assessment methods. Journal of the American Dietetic Association 2001; 101: 70-80.
Carriquiry AL. Estimation of usual intake distributions of nutrients and foods. Journal of Nutrition 2003; 133: 601-608.
Carriquiry AL, Goyeneche JJ, Fuller WA, Jensen HH. Estimated correlations among days for the combined 1989-91 CSFII. Staff Report 95-SR 77, Center for Agricultural and Rural Development, September, 1995.
European Commission. Scientific Committee on Food. Opinion of the Scientific Committee on Food on the Tolerable Upper Level for Preformed Vitamin A (retinol and retinyl esters). SCF/CS/NUT/UPPLEV/24 Final. 7 October 2002.
Expert Group on Vitamins and Minerals. Safe Upper Levels for Vitamins and Minerals. London: Food Standards Agency Publications. May 2003.
Freedman LS, Midthune D, Carroll RJ, Krebs-Smith S, Subar A, Troiano RP, Dodd K, Schatzkin A, Ferrari P, Kipnis V. Adjustments to improve the estimation of usual dietary intake distributions in the population. Journal of Nutrition 2004; 134: 1836-1843.
Gibson RS. Principles of Nutritional Assessment. 1990. New York: Oxford University Press.

A Model for Establishing Upper Levels of Intake for Nutrients and Related Substances
176
Gibson RS, Gibson IL, Kitching J. A study of inter- and intrasubject variability in seven-day weighed dietary intakes with particular emphasis on trace elements. Biological Trace Element Research 1985; 8: 79-91.
Goris AH, Westerterp KR. Underreporting of habitual food intake is explained by undereating in highly motivated lean women. Journal of Nutrition 1999; 129: 878-882.
Goris AH, Westerterp-Plantenga MS, Westerterp KR. Undereating and underrecording of habitual food intake in obese men: selective underreporting of fat intake. American Journal of Clinical Nutrition 2000; 71: 130-134.
Guenther PM, Kott PS, Carriquiry AL. Development of an approach for estimating usual nutrient intake distributions at the population level. Journal of Nutrition 1997; 127: 1106-1112.
Harrison GG, Galal OM, Ibrahim N, et al. Underreporting of food intake by dietary recall is not universal: a comparison of data from Egyptian and American women. Journal of Nutrition 2000; 130: 2049-2054.
Henderson L, Irving K, Gregory J, et al. 2003. The National Diet & Nutrition Survey: adults aged 19 to 64 years. Volume 3. Vitamin and mineral intake and urinary analytes. London: HMSO.
IOM. 2003. Dietary Reference Intakes: Applications in Dietary Planning. Washington DC: The National Academies Press.
Jahns L, Arab L, Carriquiry AL, Popkin B. The use of external within-person variance estimates to adjust nutrient intake distributions over time and across populations. Public Health Nutrition 2005; 6: 19-32.
Johansson L, Solvoll K, Bjorneboe GEA, Drevon CA. Under- and overreporting of energy intake related to weight status and lifestyle in a nationwide sample. American Journal of Clinical Nutrition 1998; 68; 266-274.
Kipnis V, Subar AF, Midthune D, et al. Structure of dietary measurement error: results of the OPEN biomarker study. American Journal of Epidemiology 2003; 158: 14-21.
Kroke A, Klipstein-Grobusch K, Voss S, et al. Validation of a self-administered food-frequency questionnaire administered in the European Prospective Investigation into Cancer and Nutrition (EPIC) Study: comparison of energy, protein, and macronutrient intakes estimated with the doubly labeled water, urinary nitrogen, and repeated 24-h dietary recall methods. American Journal of Clinical Nutrition 1999;70:439-47
Lewis CJ, Crane NT, Wilson DB, Ytley, EA. Estimated folate intakes: data updated to reflect food fortification, increased bioavailability, and dietary supplement use. American Journal of Clinical Nutrition 1999; 70: 198-207.
Nusser SM, Carriquiry AL, Dodd KW, Fuller WA. A semiparametric approach to estimating usual intake distributions. Journal of the American Statistical Association 1996; 91: 1440-1449.
Rader JI, Weaver CM, Angyal G. Total folate in enriched cereal-grain products in the United States following fortification. Food Chemistry 2000; 70: 275-289.
Renwick AG, Flynn A, Fletcher RJ, Muller DJG, Tuijtelaars S, Verhagen H. Risk-benefit analysis of micronutrients. Food and Chemical Toxicology 2004; 42: 1903-1922.
Sempos CT, Johnson NE, Smith EL, Gilligan C. Effects of intraindividual and interindividual variation in repeated dietary records. American Journal of Epidemiology 1985; 121: 120-130.
Subar AF, Kipnis V, Troiana RP, et al. Using intake biomarkers to evaluate the extent of dietary misreporting in a large sample of adults: the OPEN study. American Journal of Epidemiology 2003; 158: 1-13.
Tarasuk V, Beaton GH. Menstrual-cycle patterns in energy and macronutrient intake. American Journal of Clinical Nutrition 1991a; 53: 442-447.
Tarasuk V, Beaton GH. The nature and individuality of within-subject variation in energy intake. American Journal of Clinical Nutrition 1991b; 54: 464-470.
WHO. Report of the Joint FAO/WHO Consultation on Food Consumption and Exposure Assessment of Chemicals. Geneva, Switzerland, 10-14 February 1997.

177
ANNEX 5 Discussion Paper 4:
Nutrient Risk Characterization: Key Considerations
Prepared for the FAO/WHO Nutrient Risk Assessment Workshop 2-6 May 2005, WHO Headquarters, Geneva
Katharine E. Gourlie, BScPharm1
1 Katharine E. Gourlie Associates, 171 James St., Ottawa, Ontario, Canada K1R 5M6
1 Introduction Risk characterization is usually described as the final step in risk assessment and plays the very important role of summarizing and communicating the scientific outcomes of the risk assessment to those who must make use of it, notably the risk managers. It pulls together and integrates the quanti-tative and qualitative findings of the previous steps to produce a scientific ‘scenario’ or ‘context’ that may be used by risk managers in their decision-making process.
By its very nature, risk characterization should be a reflective and active process, one that specifically links the risk assessment outcomes to the needs of the risk manager and, in effect, to the policy options of the risk manager. Because the risk characterization information is not the sole or determinant component in a risk management decision, the risk assessor is responsible to provide the information in a manner that does not pre-empt or pre-judge a risk management decision.
This paper has as its goal to identify the basic components of nutrient risk characterization for use within the setting of the risk assessment of nutrients and related substances and to set them in the context of being useful to nutrient risk managers. That is, it considers nutrient risk characterization from the perspective of preparing a summary of findings to help inform the nutrient risk manager’s decision-making process. 2 Setting the stage for risk characterization Available definitions for risk characterization in general include the following:
Risk characterization: The qualitative and/or quantitative estimation, including attendant uncertainties, of the probability of occurrence and severity of known or potential adverse health effects in a given population based on hazard identification, hazard characterization and exposure assessment. (Definition – Codex Alimentarius Commission Procedural Manual, Thirteenth edition1) Risk assessment should use available quantitative information to the greatest extent possible and risk characterizations should be presented in a readily understandable and useful form. (Principle 4 in Statements of Principle Relating to the Role of Food Safety Risk Assessment – Codex Alimentarius Commission Procedural Manual, Thirteenth edition)
These definitions highlight principles for nutrient risk characterization, but the pragmatic
process of nutrient risk characterization can be described more clearly. Throughout this paper the 1 Codex Alimentarius Commission. Joint FAO/WHO Food Standards Programme: Procedural Manual. Thirteenth edition. Rome: Food and Agriculture Organization of the United Nations and the World Health Organization, 2004.

A Model for Establishing Upper Levels of Intake for Nutrients and Related Substances
178
generic term ‘risk characterization’ often is used in place of the longer term ‘nutrient risk charac-terization,’ but it should be understood that this paper focuses on nutrient risk characterization in particular, not risk characterization in general. Also, for ease of reading, sometimes reference is made only to ‘nutrients’ when the intent is ‘nutrients and related substances’ as specified by the charges to the workshop.
Nutrient risk assessment is conducted to address specified questions. Before it begins, the risk manager needs to formulate the problem and conduct iterative dialogue with the risk assessor to provide a clear mandate to the risk assessors. Since risk characterization serves as a communication tool between the risk assessors and risk managers, it is more likely to be targeted appropriately if the risk managers have both identified the relevant questions and established the risk assessment policy for the risk assessment.
Nutrient risk characterization occurs after the three preceding components of risk assessment (i.e. hazard identification, hazard characterization, and exposure assessment) have been addressed and documented. The output of the hazard characterization serves as the starting point for risk charac-terization. In the case of risk assessment for nutrients and related substances, the output is an ‘upper level’ of intake (UL) plus the supporting framework that permitted the derivation of the UL. That is, it includes the evaluation of adverse effects, assessment of dose-responses, and the consequent develop-ment of uncertainty factors. The risk assessor integrates this information with the intake/exposure assessments to identify the proportion of the population ‘at risk’ of exceeding the UL and the degree to which the UL is exceeded. The focus includes the general population of interest but also identified vulnerable subgroups, including age and life-stage (pregnancy, lactation) groups. Then the assessor evaluates the significance of the risk of excessive nutrient or related substance intake by addressing the severity of adverse effects and the likelihood of reversibility at lower intakes.
The nutrient risk characterization also clearly presents the scientific uncertainties associated with the three preceding components of risk assessment. Risk characterization may include indica-tions of the overall public health significance of the possible harm to the population and subgroups of interest, including special groups ‘at risk.’ Thus, the risk characterization sets the UL within a broader scientific context of risk to produce a summary of the risk assessment that addresses the questions asked by risk managers. The risk characterization stops short of any discussion or recommendations for reducing risk (IOM, 1998). In general, risk characterization may summarize the types of informa-tion shown in Box A5-1.
Box A5-1. Basic components of nutrient risk characterization
• the nature of adverse effects that can occur • the indication of the severity of adverse effects
• the nature of the dose-response relationship and the existence of thresholds for response
• the use of uncertainty and adjustment factors and/or the degree of uncertainty surrounding estimates of key considerations including exposure, data extrapolation to general population or between species, data insufficiency, and significant gaps in dose-response data
• the derivation of a UL or of another form of guidance in the absence of a UL • the use of data on intake to compile and analyze exposure and related use of uncertainty and adjustment
factors and consideration of any biases from exposure data
• the estimate of what proportion of the subgroup exceeds the UL
• the identification of special groups at risk
• the indication of exceptions for which exceeding the UL may be warranted
The risk assessor uses the available scientific evidence, the assessment process, and the appli-
cation of scientific judgement to present the information for each of the above components in a manner that makes its meaning clear to the risk manager.

Annex 5
179
2.1 Examples of risk characterization for nutrients and related substances It is illustrative to compare the nature of the risk characterizations conducted by different national or regional working groups. Table A5-1 presents such a comparison using information from publications of the three working groups (SCF/EFSA, EVM, and IOM) identified in the Context Paper. The table presents the terms of reference (mandate) of the risk assessment, the generic description of risk characterization, and key points from the risk characterization found in the three risk assessments for vitamin A. Comparisons of risk characterizations for vitamin C, iron, and zinc appear in Appendix 1 of this discussion paper.
The risk characterizations in the three reports are quite different in both content and format. To some extent this would be expected, since the Terms of Reference row in Table A5-1 indicates that the mandates for tasks differ somewhat for the three risk assessment workgroups. The three mandates are similar in that they call for reviewing upper levels of intakes of vitamins and minerals in relation to the risk of adverse effects. All three also refer to establishing or recommending an upper level or maximum with low or unlikely risk of adverse effects.
However, the mandate for the first (EFSA/SCF) refers to providing the basis for establish-ment of safety factors for ensuring the safety of fortified foods and food supplements. The second (EVM) refers to the establishment of principles on which to set controls for ensuring the safety of vitamin and mineral supplements (and added fortified foods), while the third (IOM) did not go beyond requesting the development of a model and the establishment of an upper level. Table A5-1. A comparison of selected risk characterization information in three risk assessment reports,
focus on vitamin A
Workgroup Basis of comparison EU–SCF/EFSAa UK–EVMb US–IOMc
Terms of reference for risk assessment
To review upper levels of daily intakes of individual vitamins and minerals that are unlikely to pose a risk of adverse health effects.
To provide basis for establishment of safety factors, where necessary, for individual vitamins and minerals which would ensure the safety of fortified foods and food supplements containing these nutrients.
Establish principles on which controls for ensuring the safety of vitamin and mineral supplements sold under food law can be based;
Review the levels of individual vitamins and minerals associated with adverse effects;
Recommend maximum levels of intake of vitamins and minerals from supplements if appropriate; report to the Food Advisory Committee.
The EVM also agreed to advise on the levels of vitamins and minerals in fortified foods where appropriate.
n.b., EVM preferred to frame advice in terms of additional intake, covering both supplements and fortified foods, rather than as separate categories.
Develop a model to establish the maximum level of a nutrient intake that would pose a low risk of adverse effects. Apply the model to [the sub-stances in question] to develop Tolerable Upper Intake Levels.
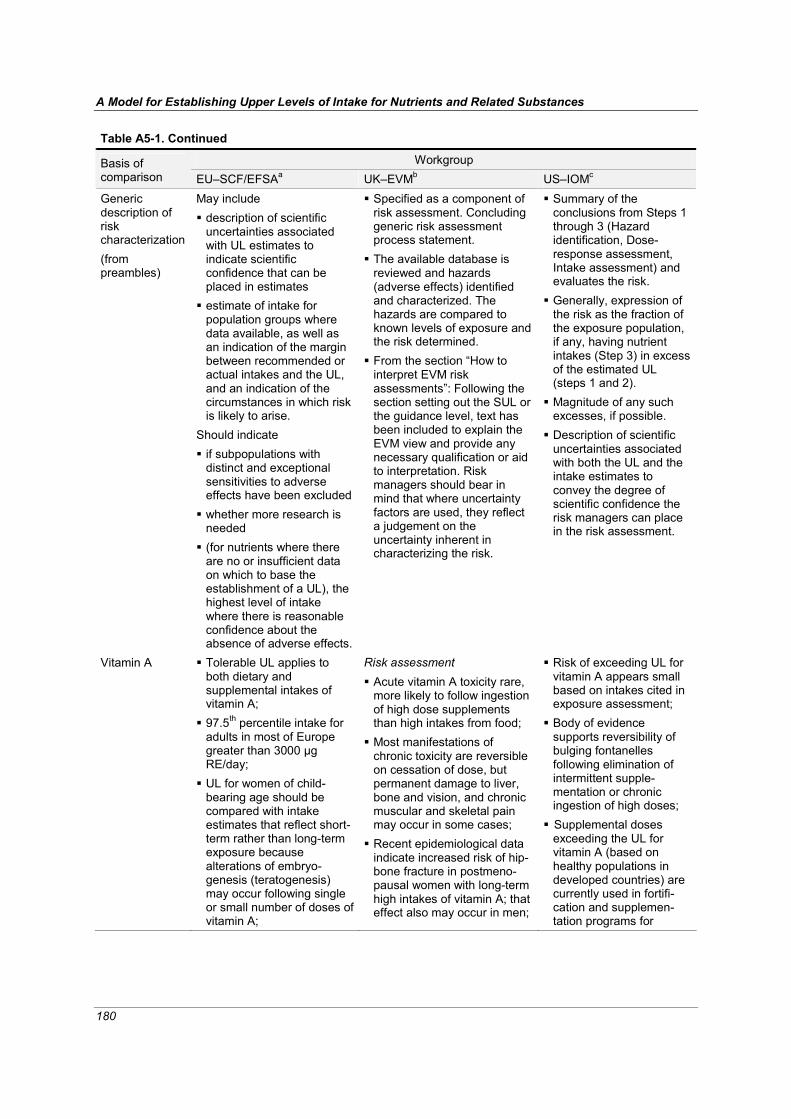
A Model for Establishing Upper Levels of Intake for Nutrients and Related Substances
180
Table A5-1. Continued
Workgroup Basis of comparison EU–SCF/EFSAa UK–EVMb US–IOMc
Generic description of risk characterization (from preambles)
May include description of scientific uncertainties associated with UL estimates to indicate scientific confidence that can be placed in estimates
estimate of intake for population groups where data available, as well as an indication of the margin between recommended or actual intakes and the UL, and an indication of the circumstances in which risk is likely to arise.
Should indicate if subpopulations with distinct and exceptional sensitivities to adverse effects have been excluded
whether more research is needed
(for nutrients where there are no or insufficient data on which to base the establishment of a UL), the highest level of intake where there is reasonable confidence about the absence of adverse effects.
Specified as a component of risk assessment. Concluding generic risk assessment process statement.
The available database is reviewed and hazards (adverse effects) identified and characterized. The hazards are compared to known levels of exposure and the risk determined.
From the section “How to interpret EVM risk assessments”: Following the section setting out the SUL or the guidance level, text has been included to explain the EVM view and provide any necessary qualification or aid to interpretation. Risk managers should bear in mind that where uncertainty factors are used, they reflect a judgement on the uncertainty inherent in characterizing the risk.
Summary of the conclusions from Steps 1 through 3 (Hazard identification, Dose-response assessment, Intake assessment) and evaluates the risk.
Generally, expression of the risk as the fraction of the exposure population, if any, having nutrient intakes (Step 3) in excess of the estimated UL (steps 1 and 2).
Magnitude of any such excesses, if possible.
Description of scientific uncertainties associated with both the UL and the intake estimates to convey the degree of scientific confidence the risk managers can place in the risk assessment.
Vitamin A Tolerable UL applies to both dietary and supplemental intakes of vitamin A;
97.5th percentile intake for adults in most of Europe greater than 3000 μg RE/day;
UL for women of child-bearing age should be compared with intake estimates that reflect short-term rather than long-term exposure because alterations of embryo-genesis (teratogenesis) may occur following single or small number of doses of vitamin A;
Risk assessment Acute vitamin A toxicity rare, more likely to follow ingestion of high dose supplements than high intakes from food;
Most manifestations of chronic toxicity are reversible on cessation of dose, but permanent damage to liver, bone and vision, and chronic muscular and skeletal pain may occur in some cases;
Recent epidemiological data indicate increased risk of hip-bone fracture in postmeno-pausal women with long-term high intakes of vitamin A; that effect also may occur in men;
Risk of exceeding UL for vitamin A appears small based on intakes cited in exposure assessment;
Body of evidence supports reversibility of bulging fontanelles following elimination of intermittent supple-mentation or chronic ingestion of high doses;
Supplemental doses exceeding the UL for vitamin A (based on healthy populations in developed countries) are currently used in fortifi-cation and supplemen-tation programs for

Annex 5
181
Table A5-1. Continued
Workgroup Basis of comparison EU–SCF/EFSAa UK–EVMb US–IOMc
Vitamin A (continued)
Women planning to become pregnant should not consume cooked animal livers;
Postmenopausal women should restrict intake to 1500 μg RE/ day as tolerable UL may not adequately address possible risk of bone fracture in vulnerable group at greater risk of osteo-porosis and bone fracture;
Because current intakes may exceed tolerable UL, careful consideration needed as to appropriate-ness of enrichment of human foods with vitamin A and to potential effects on human exposure of addition of vitamin A to animal feed.
Guidance level Not possible to establish a safe upper limit: levels of dietary intakes may overlap intakes at which adverse effects . . . occur;
3000 μg RE/day is a prudent threshold for teratogenicity;
Risk of hip fracture is a continuous graded response associated with exposure levels that include average dietary intakes, . . . intakes greater than 1500 μg RE/day may be inappropriate relative to risk of hip fracture;
High level consumers of liver and liver products and/or supplements may exceed intakes at which adverse effects have been reported;
Dietary supplements may contain overages that are 20–100% more than label declaration . . . Consider this in view of the graded response with the risk of fracture increasing with increased intake.
the prevention and treatment of vitamin A deficiency, especially in developing countries. The UL is not meant to apply to communities of mal-nourished individuals receiving vitamin A prophylactically, either periodically or through fortification, as a means to prevent vitamin A deficiency, or for individ-uals being treated with vitamin A for diseases such as retinitis pigmen-tosa.
a Scientific Committee on Food/European Food Safety Authority, EC b Expert Group on Vitamins and Minerals, UK c Institute of Medicine, USA UL = upper level, SUL = safe upper level
Certainly, under these circumstances, the nature of risk characterization will vary among the working groups. Moreover, the different conclusions in respect of the establishment of an upper limit for the same nutrient have produced different risk characterizations and advice for decision-making. Such differences, while they may result in part from the different questions asked of the risk assess-ors, may also differ because of the different approaches to risk assessment taken in the stages that precede risk characterization. This observation underscores that there may be benefit in identifying more clearly the components of a model risk assessment (including risk characterization), at least for the purposes of an international model. The three working groups also differed in their generic descriptions of the information to be provided in the risk characterization (see the second row of Table A5-1). The EFSA/SCF and the IOM suggest different approaches to content and format. The EVM does not describe a risk characteriza-tion section per se but indicates that elements of risk characterization will be present in the concluding risk assessment summation section for each nutrient.
Furthermore, within reports from these working groups are risk characterization components that appear to contain prescriptive risk reduction ‘recommendations.’ Those components could be argued to have been the result of the risk assessor having taken on the role of the risk manager. Examples include advice to provide warnings that women planning to become pregnant should not consume cooked animal livers (Table A5-1, EU-EFSA/SCF), and advice that men and postmeno-pausal women avoid iron supplements and foods highly fortified with iron.
A Model for Establishing Upper Levels of Intake for Nutrients and Related Substances
182
It may be that at times the risk manager either inadvertently or deliberately identifies ques-tions for risk assessors that generally have been considered to belong in the domain of risk manage-ment or that appear to invite the risk assessor to give advice in risk management terms. For example, in the Terms of Reference in Table A5-1, UK-EVM, reference is made to “controls for ensuring the safety of vitamin and mineral supplements” and risk assessors are to “advise on levels of vitamins and minerals in fortified foods.” Certainly there is some latitude for ‘drawing the line’ between risk assessment and risk management, and this line may move depending upon the nature of the issue at hand and the needs of national and regional authorities. For an international model for nutrient risk assessment, however, the specification of some general guidance could help achieve the desirable outcome that risk assessment does not overextend its conclusions into risk management. This attribute is particularly relevant to the risk characterization step, but other steps in nutrient risk assessment may be vulnerable to the same concerns.
The results of the comparison of nutrient risk characterization information from the three working groups suggest that there would be value to developing either 1) a standard approach to nutrient risk characterization and format for presentation of information or 2) at least an identified process to ensure that the risk characterization contains the needed components. Such an approach or process would be useful in the work of nutrient risk assessors: it would help ensure that nutrient risk assessors do not extend their work to take on that of the nutrient risk manager, and could help ensure that the basic components of risk characterization listed in Box A5-1 are consistently addressed. This would maximize the utility of the risk characterization for the risk manager in relation to available policy options. 2.2 Challenges to risk characterization for nutrients and related substances To stimulate thinking about how to construct a risk characterization for nutrients and related substances, the author presents the following issues and questions—each of which poses a challenge to the preparation of a risk characterization. • Information gaps and complexities are challenges in the hazard identification and the hazard
characterization steps. Recognizing this, How can a risk characterization be prepared that, while presenting the uncertainties, still provides useful information that does not transgress the boundary between risk assessment and risk management?
With regard to the gaps and complexities, Renwick et al. (2003), for example, have drawn attention to the preponderance of human and epidemiological micronutrient studies with limited dose–response data; to the limitations in numbers and applicability of studies using animal models; to the narrow margin between essential intake and a toxic intake; to possible interactions between micronutrients; and to the chemical or dosage form in which they are consumed in the case of micronutrients in dietary supplements.
• Communication among different science disciplines may present a barrier to the integration of the
component parts of a risk assessment in the risk characterization if they have been developed independently by experts with different backgrounds. How can nutrition, toxicology, and the other science disciplines involved in the risk assessment of nutrients and related substances be brought together effectively?
The involvement of two or more science disciplines raises the possibility of different emphases and different perspectives in interpreting and evaluating data and exercising scientific judgement in relation to uncertainty. If there are substantial differences, the content of the risk charac-terization could be strongly affected by which discipline was involved in the precedent steps. Renwick et al. (2003) have suggested different roles in the hazard characterization step of

Annex 5
183
micronutrients for nutritionists and toxicologists. This could have an undesirable effect on the risk characterization if it leads to ‘silos’ of experts. To avoid this, the process could be designed to provide sufficient opportunity for a dialogue among the experts to maintain the focus on respond-ing to the risk manager’s needs, which generally will relate to nutrition policy options.
• The content and manner of presentation of the risk characterization can influence its effectiveness
in communicating information to the risk manager. Therefore, What should the risk charac-terization contain and how repetitive does it need to be in terms of information presented in earlier sections of the risk assessment? Stated differently, How much information needs to be brought forward from the three precedent steps into the risk characterization to transfer the essential information for the risk management activity? The hallmark of current risk characterizations appears to be brevity. Is this truly the type of summarizing and integrative presentation of the results of the risk assessment suggested by the classic definition of risk characterization at the beginning of this paper? Do the risk character-izations in Appendix 1 of this paper satisfy the expectations and needs of the risk manager, or are they more likely to lead to requests for clarification or further risk assessments from risk managers?
• Some scientists may be accustomed to providing advice in the form of risk management actions in
connection with other responsibilities. Recognizing this, How may scientists be assisted to characterize a risk without unconsciously suggesting a risk management option? Sorting out and clearly identifying the respective roles of risk assessor and risk manager in the nutrients and related substances area may be a very important aspect of improving the interface between risk assessment and risk management.
• Renwick et al. (2003) point out that addressing the substantial gaps and research needs with regard to nutrient risk methodologies—especially the methods used for acquiring and evaluating the data inputs for the various steps of risk assessment—would assist and improve the risk characterization process. Should the risk characterization be followed by or include a section containing recommendations relative to further research?
3 Components of risk characterization for nutrients and related substances As highlighted earlier, components of risk characterization usually are addressed within the context of discussions about the nature of the data that are derived during the three earlier steps of risk assessment. Although there is agreement on the general purpose of risk characterization and its importance, the actual practice of risk characterization merits more attention, primarily as it relates to its goal of being useful to risk managers.
In many ways the identification of a separate box for risk characterization is an artifice that makes the point that good risk assessment must provide an integrated summary and that the summary will be used by others. It also, however, underpins the fact that the summary is intended for risk managers, not for risk assessors. The summary—that is, the risk characterization—requires consid-erable linking with the preceding three steps in a manner that addresses the policy options available to the risk manager.

A Model for Establishing Upper Levels of Intake for Nutrients and Related Substances
184
3.1 Process for risk characterization for nutrients and related substances In general, the ‘basic components’ of risk characterization are said to include a summary description of the consequences of exposure to the hazard, as well as an estimate of the likelihood of the adverse consequences of interest in a risk estimate. Importantly, they recognize that the outputs of a risk characterization should clearly identify important data gaps, assumptions, and uncertainties in order to help risk managers judge how close the characterization might come to describing reality. Risk characterization rarely gives more than a reasonable estimate or an informed view of the risk in reality (from the Draft Version (uncirculated) FAO/WHO Food Safety Risk Analysis: An Overview and Framework Manual1).
The outcomes of the ‘measuring’ tasks of the risk assessor mentioned in the Context Paper for this workshop serve as a starting point for the risk characterization. The other three Discussion Papers for the Workshop will have highlighted and discussed aspects of the gathering, organization, and review of relevant scientific evidence; modalities for presentation and methods for analysis of data; the handling of gaps and deficiencies in available scientific evidence; and when and how uncertainty and adjustment factors and appropriate scientific judgements were used. Next, there must be at least a general recognition by the risk assessor of the nature of the policy options that the ‘describing’ task of the risk characterization must address. The Context Paper has provided examples of policy options available to the nutrient risk manager relative to upper levels of intake for nutrients and related substances. By making use of these examples, Table A5-2 illustrates the organization of a nutrient risk characterization that maximizes its ability to be relevant to risk managers. It also acknowledges that policy options may relate either to the general food supply or to specific product categories (e.g. highly fortified foods, supplements) or perhaps to products targeted to certain subgroups (children, elderly). The elements corresponding to the check marks (x) across the rows indicate what would be expected from the summary outputs of the three preceding steps in order to complete a risk assessment and set the risk within its scientific context.
Table A5-2 indicates how the outputs may be characterized within a context that addresses the questions asked by the risk manager. All the elements listed in the row that corresponds to Row 1, the timing option, are relevant to the other policy options. The elements listed in Rows 2, 3, and 4 are relevant only to the policy option listed for the specific row. The third and fourth columns (General Food Supply and Specific Product Category) indicate the focus of the nutrient risk.
Some of the components included in Table A5-2 may be less important if the risk assessment questions asked by the risk manager at the national or regional level focus the assessment on a limited task, but for an overall international model for nutrient risk assessment the uses should be considered as potentially multi-purpose with the end use of the information varying depending upon the need at the time. For this reason, risk characterization for a generic model is most likely to have maximum utility for multi-purposes if it addresses risk by age and sex groups to the extent the available data make possible.
As a general model, Table A5-2 cannot be expected to serve every risk assessment requirement. There will be instances when the options available to the risk manager are not yet fully developed, or they may need to be amended during the course of a risk assessment to take account of a change in circumstances. Particularly at the national or regional level, in order to maximize the usefulness of a risk assessment for the risk manager, it may be necessary for the risk manager to request that the risk assessor address additional science issues that relate to an adjustment to, or specific aspect of, a particular policy option.
Although possibly beyond the scope of this workshop, there is a need to recognize that there may be value in further iterations between the risk assessor and risk manager. Typically, these would involve changes to assumptions underlying the original policy options. Some of the types of questions that could be posed in such an iterative dialogue are presented in the following examples: 1 Reproduced with permission: FAO/WHO (Food and Agriculture Organization of the United Nations/World Health Organization). Draft Version (uncirculated): Food Safety Risk Analysis: An Overview and Framework Manual.

Annex 5
185
Table A5-2. Proposed elements to include in nutrient risk characterizations for different purposes
Policy Optiona [Proposed] Elements to Include in Nutrient Risk Characterization
General Food
Supply
Specific Product Category
▪ Adverse effect × × 1. Timing of Response - Severity × ×
- Vulnerable subgroups × × ▪ UL × × - By age and sex × × ▪ Total intake distributions × × - For all groups with UL × × - For specific food product categoriesb × For both, include i. magnitude of intakes exceeding UL × × ii. numbers of people exceeding UL × × iii. reasons intakes are above UL × × ▪ Special subgroups potentially at risk × × ▪ If no UL established, explanation as to why × × ▪ Uncertainties related to each of the above, including
underreporting biases, for example × ×
▪ Products exceeding UL, when intake exceeds UL × ▪ Systemic biases in intake data, when intakes close to
UL × ×
▪ All forms or specific sources × × 2. Product Formulation - Identification by food product category if data allowc × ▪ Bioavailability, interactions with other food
components or other nutrients × ×
▪ Relative contribution to daily intake of particular product types or classes if data allow
×
▪ Uncertainties related to each of the above × × ▪ Data gaps in respect of a food or product category × ▪ High level intake interventions to address inadequate
nutrition × ×
3. Labeling ▪ Ability of individuals at risk to self-identify × × ▪ Practices, behaviours or use conditions likely to
increase or decrease risk × ×
▪ Uncertainties related to each of the above × × 4. Education ▪ Ability of individuals at risk to self-identify and related
uncertainties × ×
a From Table 1 in the Context Paper b Additionally, risk managers at the national or regional level may specify food product categories of interest—see discussion
in Context Paper c Although the identification and development of ‘what if’ scenarios are outside the scope of the role of the risk assessor
relative to a generic international model for nutrient risk assessment, national and regional risk managers may specify questions for risk assessors that relate to the scientific evaluation and impact of particular scenarios related to changes in product formulation or changes in intakes from certain sources. See Section 3.1, “Process for Risk Characterization of Nutrients and Related Substances.”
• What would happen to the distribution of intake of a nutrient by different subgroups if the
fortification level of a food were increased by specified amounts to address problems of

A Model for Establishing Upper Levels of Intake for Nutrients and Related Substances
186
inadequacy? (This could involve iterations with different fortification levels and different foods.)
• If limits were placed on the content of nutrient X in certain fortified foods or supplements in an attempt to reduce the population’s exposure to the nutrient, what would happen to the distribution of nutrient intakes of vulnerable subgroups with lower intakes?
Some particular issues arise in association with considerations highlighted in Table A5-2.
Accordingly, the workshop may wish to give the following issues special attention:
1. Types of information. Is it helpful to give some guidance on the types of information that would be useful in risk characterization? Are there certain ‘pieces’ of useful information that have the potential to be overlooked but may contribute meaningful information to the utility of the risk assessment? For example, a statement indicating that there are virtually no dose-response data available may be important to risk managers, but risk assessors sometimes do not clearly specify this.
2. Useful interpretive statements. Is there guidance on the nature of information or useful interpretive statements that the risk assessor might fail to include in the risk assessment text, not recognizing their potential usefulness for the risk manager? Examples include statements that - point out data gaps more clearly: “The effect of taking nutrient X at doses between X mg
and Y mg is unclear” - highlight behaviours that may change risk: “Intake from supplements in [vulnerable
subgroup(s)] and highly fortified foods may increase proportion of population with [particular adverse effect],” and “Some users of high dose supplements may exceed the UL.”
3. Tiering or triaging. Can and should risk characterization take into account some strategic tiering or triaging in terms of the need for in-depth review of data from earlier steps of the risk assessment or for undertaking further assessment? For example, - If the gap is between the UL and intake is small, should the risk characterization ensure
that intake data are examined for systemic biases that could result in under- or over-reporting and for a need to weight the different methods used in collection of intake data?
- If the gap between UL and intake is large, should it be determined that intake data do not require further elaboration?
- If intake assessment indicates (sub) population intakes are greater than the UL, should there be investigation of products that may be contributing to the high intake?
4. Inadequately nourished populations. What role does risk characterization play when the risk assessment is for an inadequately nourished population? While to some extent this question is to be addressed during the earlier stages of risk assessment, there may be special components of the risk characterization that need to be considered.
3.2 Adaptation of risk characterization for different categories of nutrients and related substances The question arises of what method would be useful to address risk characterization for nutrients and related substances to which the threshold model does not apply. Such is the case for at least some macronutrients and perhaps also for vitamin A related to bone health.
The IOM Panel on Macronutrients (IOM, 2002) did not set a UL for saturated fatty acids despite well-documented adverse effects of intake of this nutrient. The data indicate that any increment in fatty acid intake increases coronary heart disease risk; that is, there is no threshold. Specifying zero as a UL was not an option because eliminating all foods that contain saturated fatty
Annex 5
187
acids would not be feasible and could have an adverse impact on the intakes of many other nutrients, including protein, essential fatty acids, and micronutrients such as iron and zinc.
Renwick et al. (2003) have discussed elements important in the hazard characterization of macronutrients. In particular, they advise giving consideration to tolerance, toxicological potential, nutritional impact, and, perhaps local effects on the gut that may be important, such as changes in the microflora and in the absorption of other nutrients. They point out that human trials and observational studies play a prime role in the risk characterization—in part because of the difficulties in administering the bulky doses that would be required in animal studies and in interpreting significance for human health of any adverse effect observed. Additionally, Renwick and colleagues (2003) suggest that human trials might be used to look at relevant health endpoints to provide confirmation of the absence of adverse effects, and they give as an example the use of biomarkers of risk factors for coronary heart disease when fats are administered.
Nonetheless, in the absence of a threshold level, models for the risk assessment of nutrients and related substances that are dependent upon threshold levels are of little use in providing much needed guidance for risk managers. In those cases where guidance is needed and cannot be provided with available models, important questions are, “What are risk assessors to do?” and “How should such risk be characterized?”
3.3 Components of risk characterization for inadequately nourished populations The international model that is the subject of this workshop will have been initially considered, due to necessity, in terms of adequately nourished populations. Then the workshop needs to take into consideration adjustments to the model or special approaches for inadequately nourished populations. It is quite likely that a UL and the resulting risk characterization may be different if the target population is inadequately nourished. These differences may change depending upon the nature of the nutritional adequacy as well as the subject nutrient or related substance. For example, workshop participants may be familiar with intervention outcomes suggesting that supplementation strategies for inadequately nourished populations may result in certain problems or undesirable side-effects that would not have been anticipated if the subject population had been adequately nourished.
This issue comes into play broadly throughout the entire risk assessment process, but its impact on risk characterization can be substantial. Nutrient risk management decisions relative to inadequately nourished populations would require that risk assessment address additional information and considerations, but obviously nutrient risk managers still would need to know the severity of the adverse effect and at what level of intake it occurred. It also would be important to know if the adverse effect were chronic or short term and if it were reversible. Also of importance would be interpretive comments from the risk assessor relevant to the risk of adverse effects and the size and frequency of the dose. In Table A5-2, many of the elements identified in rows 1 and 2 should have relevance for a nutrient risk characterization appropriate for use in situations of inadequate nutrition, but the question remains of how models for risk assessment need to be adjusted to address inadequately nourished populations. 4 Conclusions The process of risk characterization takes place throughout the risk assessment process as each successive step builds on, adds to, and progresses the output of its predecessor step. At the same time, the risk characterization is a separate process that must develop an integrated summary of the key findings, uncertainties, and expert judgements and organize them such that they provide relevant and useful answers to the questions raised by the risk manager—questions raised at the beginning of the risk assessment in the context of the policy options.
For nutrient risk assessment, the risk manager generally will have available a limited number of policy options that will be common among nutrients and related substances. A risk assessment can

A Model for Establishing Upper Levels of Intake for Nutrients and Related Substances
188
be structured for each step, and the elements that need to be brought forward into the risk characterization can be identified and linked to a policy option.
The review for this workshop of previously completed risk characterizations suggests that the lack of a consistently applied framework for development and presentation of a risk characterization leads to differences in the selection of information provided to risk managers and contributes to variability in the characterization of the identified risks.
A framework (Table A5-2) has been developed to guide the preparation of a nutrient risk characterization such that it addresses the policy options available to a risk manager. The proposed framework conveys the elements associated with each of the policy options and thus the information necessary to make a risk management decision regarding to the most appropriate option. Risk charac-terization also will address special issues when the risk assessment is for different types of nutrient categories or for populations that are experiencing inadequate nutriture. References European Commission, Scientific Committee on Food. Opinion of the Scientific Committee on Food
on the Tolerable Upper Intake Level of Preformed Vitamin A (retinol and retinyl esters). SCF/CS/NUT/UPPLEV/24 Final. 7 October 2002.
European Commission, Scientific Panel on Dietetic Products, Nutrition and Allergies. Opinion of the Scientific Panel on Dietetic Products, Nutrition and Allergies on a request from the Commission related to the Tolerable Upper Intake Level of Vitamin C (L-Ascorbic acid, its calcium, potassium and sodium salts and L-ascorbyl-6-palmitate). 28 April 2004. (Request No EFSA-Q-2003-018). In The EFSA Journal. Volume 59. 2004. 1-21.
European Commission, Scientific Panel on Dietetic Products, Nutrition and Allergies. Opinion of the Scientific Panel on Dietetic Products, Nutrition and Allergies on a request from the Commission related to the Tolerable Upper Intake Level of Iron. 19 October 2004. (Request No EFSA-Q-2003-18). In The EFSA Journal. Volume 125. 2004. 1-34.
European Commission, Scientific Committee on Food. Opinion of the Scientific Committee on Food on the Tolerable Upper Intake Level of Zinc. SCF/CS/NUT/UPPLEV/62 Final. 19 March 2003.
Expert Group on Vitamins and Minerals. Safe Upper Levels for Vitamins and Minerals. London: Food Standards Agency Publications, May 2003.
Food and Nutrition Board Institute of Medicine. Dietary Reference Intakes: A Risk Assessment Model for Establishing Upper Intake Levels for Nutrients. Washington, D.C.: National Academy Press, 1998.
Food and Nutrition Board, Institute of Medicine, National Academy of Sciences. Dietary Reference Intakes for Vitamin A, Vitamin K, Arsenic, Boron, Chromium, Copper, Iodine, Iron, Manganese, Molybdenum, Nickel, Silicon, Vanadium, and Zinc. Washington, D.C.: National Academy Press, 2001.
Food and Nutrition Board, Institute of Medicine, National Academy of Sciences. Dietary Reference Intakes for Vitamin C, Vitamin E, Selenium, and Carotenoids. Washington, D.C.: National Academy Press, 2000.
Food and Nutrition Board, Institute of Medicine, National Academy of Sciences. Dietary Reference Intakes for Energy, Carbohydrate, Fiber, Fat, Fatty Acids, Cholesterol, Protein and Amino Acids. Washington, D.C.: National Academy Press, 2002.
Renwick, A.G., et al. Risk characterisation of chemicals in food and diet. In Food and Chemical Toxicology. Volume 41. 2003. 1211-1271.

Annex 5
189
Appendix 1 to Annex 5, A comparison of selected risk characterization information from three workgroups—iron, vitamin C, and zinc
Workgroup Nutrient EU–EFSA/SCFa UK–EVMb US–IOMc
Iron
Conclusions - a UL for iron from all sources cannot be based on adverse gastrointestinal effects reported after short-term oral dosage of supplemental non-haem iron preparations; or based on iron overload because of poor correlations; or based on increase of chronic diseases such as cardiovascular disease, diabetes or cancer because of lack of convincing causality evidence. Risk characterization - adverse gastrointestinal effects reported after short-term oral dosage (50–60 mg/day of supplemental non-haem iron preparations, particularly taken without food); - the point at which an elevated serum ferritin level becomes associated with increased risk of adverse effects (such as liver fibrosis) is not known; - epidemiological associations between high iron intake and/or stores and increased risk of chronic diseases (cardiovascular disease, type 2 diabetes, and cancer of the gastrointestinal tract) are conflicting and do not provide convincing evidence of a causal relationship between iron intake or stores and such adverse effects; - risk of adverse effects from high iron intake from food sources, including fortified foods in some countries, but excluding supplements, is considered to be low for the population as a whole; - intake from supplements in men and postmenopausal women may increase the proportion of the population likely to develop high iron stores;
Risk assessment - in humans acute iron poisoning is associated with severe gastrointestinal damage that may include haemorrhagic gastro-enteritis—relatively rare in adults at lethal dose of approximately 100 g, but more common in children; - iron overload from dietary intake unusual in normal population and may be due to reduction in iron absorp-tion that occurs as exposure increases; - individuals with hereditary haemochromatosis are particularly vulnerable to iron overload resulting from enhanced uptake—subjects heterozygous for the con-dition may have a small increase in iron storage; - suggestion that hetero-zygous subjects (up to 1% of population) may have increased risk of cardio-vascular disease remains controversial. Guidance level - insufficient appropriate data to establish safe upper limit; - for iron-replete individuals, most common reported side effects are gastrointestinal, usually constipation, but nausea, vomiting and epigastric pain also reported following supplemental doses between 50 and 220 mg iron/day; - a supplemental intake of approximately 17 mg/day (equivalent to 0.28 mg/kg of body weight/d for a 60 kg adult) would not be expected to produce adverse effects in the majority of people; - this guidance level does not apply to the small proportion of the population
- based on a UL of 45 mg/day of iron for adults, the risk of adverse effects from dietary sources appears to be low; - gastrointestinal distress does not occur from con-suming a diet containing naturally occurring fortified iron; - individuals taking iron salts at a level above the UL may encounter gastrointestinal side effects, especially when taken on an empty stomach; - 25% of men aged 31-50 years in USA have ferritin concentrations > 200 μg/L, which may be a risk factor for cardiovascular disease, and prevalence is higher in men older than 50 years; - significance of high ferritin concentrations and their relationship to dietary iron intake is uncertain; - association between a high iron intake and iron overload in sub-Saharan Africa makes it prudent to recommend that men and postmenopausal women avoid iron supplements and highly fortified foods; - UL is not meant to apply to those being treated with iron under medical supervision.

A Model for Establishing Upper Levels of Intake for Nutrients and Related Substances
190
Appendix 1 to Annex 5. Continued
Workgroup Nutrient EU–EFSA/SCFa UK–EVMb US–IOMc
Iron (continued)
- some groups at special risk for poor iron status, such as menstruating women or children, could benefit from additional dietary intake and/or improved availability of dietary iron; - a particularly sensitive sub-population (up to 0.5% of the population) are homozygotes for hereditary haemochroma-tosis, who are susceptible to iron overload even with normal dietary iron intakes. Such individuals should avoid iron supplements and highly iron-fortified foods; - the majority of these homo-zygotes are not diagnosed or identified, and they are not aware of their greater sus-ceptibility until sufficient iron has accumulated to produce adverse effects.
who have increased susceptibility to iron over-load associated with the homozygous haemochroma-tosis genotype; - many of available studies do not look at side effects in detail and information on the long-term implications of iron supplementation on iron status and storage is lacking.
Vitamin C
Conclusions - limited human and animal data indicate low acute toxicity; - acute gastrointestinal intolerance is most clearly defined adverse effect at high intakes but limited dose-response relationship data for adults or groups (e.g. children or elderly); - insufficient data to establish a tolerable upper intake level for vitamin C. Risk characterization - limited available human data suggest supplemental daily doses up to about 1 g in addition to normal dietary intakes not associated with adverse gastrointestinal effects; - acute gastrointestinal effects may occur at higher intakes (3-4 g/day); - increased risk of kidney stones not found with habitual intakes of 1.5 g/day, but uncertainty whether higher intakes increase renal excretion of oxalate, which
Risk assessment - available data suggest no significant adverse effects and no specific key toxic endpoints for oral dose to healthy subjects; - conflicting data on increased oxalate excretion attributable to vitamin C; - potential vulnerable groups include sufferers from dis-orders of iron metabolism or storage; - significance of reported variety of anti-oxidant effects produced by vitamin C uncertain for general population; - very low acute toxicity in animals, no reported effects on reproductive parameters. Guidance level - insufficient data to set a safe upper limit; - low toxicity, though adverse effect on gastro-intestinal system may occur with quantities > 1 g/day, and may be serious problem for individuals with dis-
- risk of adverse effects from excess intake from food and supplements appears to be very low at highest intakes (>1.2 g/day); - members of general population should be advised not to exceed the UL routinely; - intake above UL may be appropriate for well-controlled clinical trials; - clinical trials of doses above UL should not be discouraged, provided participating subjects have signed informed consent documents regarding possible toxicity and provided trials employ appropriate subject safety monitoring; - UL not meant to apply to individuals receiving vitamin C under medical super-vision.

Annex 5
191
Appendix 1 to Annex 5. Continued
Workgroup Nutrient EU–EFSA/SCFa UK–EVMb US–IOMc
Vitamin C (continued)
could increase risk of renal stones; - due to saturated absorption at high doses, intakes above 1 g/day would be associated with negligible increased uptake and tissue levels, but increased gastrointestinal effects; - conclusion applies as well to ascorbic acid and its salts and esterified forms of vitamin C although no data on gastrointestinal absorption or tolerability of esterified forms of vitamin C (e.g. ascorbyl palmitate) but all these forms might be expected to show similar properties; - average daily intakes reported in surveys in European countries are above Population Reference Intake with the 95th percentile intake from food and supple-ments ranging up to about 1 g/day. These dietary intakes do not represent cause for concern; - there has not been a sys-tematic assessment of the safety of the long-term use of high dose vitamin C supple-ments.
ordered gastrointestinal function; - a supplemental level of 1 g/day would not be expected to have any significant adverse effects; - a guidance level for vitamin C intake has not been estimated, since adverse effects appear to follow supplemental bolus doses rather than intake from food; - higher levels of vitamin C intake may be without adverse effects in many individuals; - potentially vulnerable groups for adverse effects at intakes > 1 g/day include individuals heterozygous for haemochromatosis, and thalassaemia or with pre-disposition to renal stones.
Zinc - available studies show that the 97.5th percentiles of total zinc intakes for all age groups are close to the ULs, which, in the view of the Committee are not a matter of concern.
Establishment of safe upper level - assuming a maximum intake of 17 mg/day from food, a total intake of 42 mg/day would not be expected to result in any adverse effects.
- the risk of adverse effects resulting from excess zinc intake from food and supple-ments appears to be low at the highest intakes indicated in the exposure assessment; - high intakes of zinc are due to the use of supplements, especially during lactation and pregnancy.
a Scientific Committee on Food/European Food Safety Authority, EC b Expert Group on Vitamins and Minerals, UK c Institute of Medicine, USA

192
ANNEX 61 Key elements of hazard identification/hazard
characterization for vitamin A, summarized from reports by three national/regional authorities
National/regional authority Element EU: SCF (2002) UK: EVM (2003) US/Can: IOM (2001) Definition of vitamin A
Retinoids; “preformed” vitamin A; not provitamin A carotenoids (e.g. β-carotene).
Retinoids; “preformed” vitamin A; not vitamin A precursors (e.g. β-carotene).
Retinoids; “preformed” vitamin A; not provitamin A carotenoids (e.g. β-carotene).
Vitamin A sources included in setting the upper level (UL)
All sources (dietary and supplemental). Short-term and long-term intakes.
Long-term intake from all sources.
Food, fortified food, and/or supplements; chronic intakes.
Adverse health effect: selections and considera-tions
Teratogenicity Selected for UL for women of childbearing age:
Severe and irreversible toxicity occurs at intakes >3000 μg RE/d. Toxicity unrelated to pre-existing liver stores or nutritional status of mother. Critical period is during first 2 mo of pregnancy and may occur with a single dose or a limited number of dosages.
Discussed in section on a Guidance Level for women who are pregnant or wish to become pregnant:
Epidemiological studies have indicated that exposure to high levels of vitamin A during pregnancy might increase the risk of birth defects. Vitamin A has been shown to be teratogenic in animals. The available data do not allow identification of a threshold dose. One epidemiological study has suggested that effects may occur at modest intakes (>3000 μg RE/d from supple-ments). Other studies indicate that the thresh-old may be higher. However, given the severity of the effect, it is prudent to take 3000 μg RE/d as the threshold for teratogenicity.
Selected for UL for women of reproductive age (14–50 y, pregnant, lactating):
A causal relationship between high vitamin A intakes and birth defects is based on unequivocal demonstration of human teratogenicity of 13-cis-retinoic acid and results from numerous animal and epidemiological studies. The critical period for susceptibility is the first trimester of pregnancy. The threshold at which risk occurs remains a matter of debate. Selected as the critical adverse effect based on considerations of causality, quality, and completeness of the database.
1 Notes and references cited in the table appear at the end of the annex.

Annex 6
193
National/regional authority Element EU: SCF (2002) UK: EVM (2003) US/Can: IOM (2001) Hepatotoxicity; liver abnormalities
Selected for UL for men and children:
Causally linked to high intakes of vitamin A over long time periods. One of most severe outcomes of chronic intake of high doses. Toxicity not always reversible after withdrawal of vitamin A.
Discussed but not selected.
Selected for UL for adults ≥ 19 y (excluding women of childbearing age):
Human and animal data show strong causal association between excess vitamin A intake and liver abnormalities. Abnormal liver pathology characteristic of vitamin A intoxication (or grossly elevated hepatic vitamin A levels) was used rather than liver enzymes because of uncertainties regarding other possible causes of enzyme changes.
Bone metabolism; reduced bone mineral density; bone toxicity
Special note for postmenopausal women:
Several major epidemiological studies indicate an increased risk of bone fracture over an intake range similar to that normally consumed from food and supplements. This occurs at lower doses than other adverse effects. Available data do not establish causality and therefore were not appro-priate for establishing a tolerable upper level. Not clear if the same dose–response would apply to men.
Discussed in section on Guidance Level:
Recent epidemiological studies have indicated that postmenopausal women with long-term high intakes of vitamin A have an increased risk of hip-bone fracture. Other supporting epidemiological data have indicated that this effect may occur in men as well as women. These findings are supported by animal data, which have indicated that retinol has a direct effect on bone. Damage to the bone may be permanent. The risk of hip fracture is a continuous graded response associated with exposure levels that include average dietary intakes. It is not possible to identify an intake that is without some degree of risk. However, the available data indicate that total intakes greater than 1500 μg RE/d may be inappropriate.
Discussed: Chronic, excessive vitamin A intake has been shown to lead to bone mineral loss in animals. The findings from four epidemiological studies are provocative, but conflicting, and therefore are not useful for setting a UL for vitamin A.

A Model for Establishing Upper Levels of Intake for Nutrients and Related Substances
194
National/regional authority Element EU: SCF (2002) UK: EVM (2003) US/Can: IOM (2001) Hypervitaminosis A (e.g. bulging fontanelle; intracranial pressure)
Discussed: Rapidly reversible bulging fontanelle that is not associated with adverse growth or developmental sequelae has been observed in infants receiving high doses of vitamin A. In older children and adults, excessive vitamin A intakes are linked to increased intra-cranial pressures.
Discussed: Acute toxicity (e.g. bulging of fontanelles in neonates and infants) is associated with doses well in excess of 100 000 μg RE. Infants <6 months develop acute symptoms following a single dose of 7500–15 000 μg RE whereas a dose of 30 000 μg RE is well-tolerated in older infants (6 and 9 mo). Acute toxicity in humans is rare. Most manifesta-tions of chronic vitamin A toxicity are reversible on cessation of dose.
Selected for UL for boys 14–18 y, children 9–13 y, children 4–8 y, children 1–3 y, infants 0–12 mo:
Intracranial (bulging fontanelle) and skeletal abnormalities can result in infants given vitamin A doses of 5500 to 6750 μg RE/d.
Lipid metabolism Discussed: Patients ingesting 7500 μg RE/d for 4 y had small increases in cholesterol concentration (2–3%); not observed in patients on 4500 μg RE/d for 12 y.
– –
No observed adverse effect level (NOAEL)
– – Women of reproductive age (14–50 y, pregnant, lactating): 4500 μg RE/day.
No adverse effects below 3000 μg RE/d from supplemental vitamin A. Significantly increased risk above 4500 μg RE/d from food plus supplements. Most data involve doses ≥ 7800 μg RE/d. 4500 μg/d represents a conservative value in light of evidence of no adverse effects at or below that level.
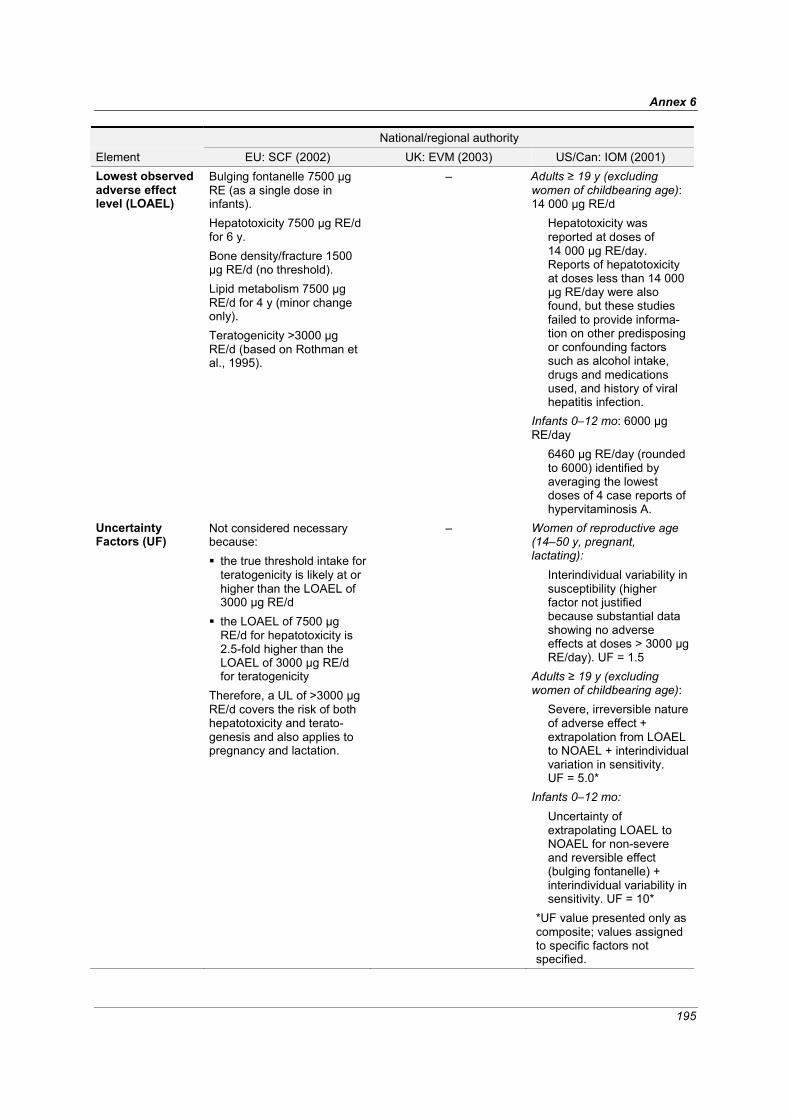
Annex 6
195
National/regional authority Element EU: SCF (2002) UK: EVM (2003) US/Can: IOM (2001) Lowest observed adverse effect level (LOAEL)
Bulging fontanelle 7500 μg RE (as a single dose in infants). Hepatotoxicity 7500 μg RE/d for 6 y. Bone density/fracture 1500 μg RE/d (no threshold). Lipid metabolism 7500 μg RE/d for 4 y (minor change only). Teratogenicity >3000 μg RE/d (based on Rothman et al., 1995).
– Adults ≥ 19 y (excluding women of childbearing age): 14 000 μg RE/d
Hepatotoxicity was reported at doses of 14 000 μg RE/day. Reports of hepatotoxicity at doses less than 14 000 μg RE/day were also found, but these studies failed to provide informa-tion on other predisposing or confounding factors such as alcohol intake, drugs and medications used, and history of viral hepatitis infection.
Infants 0–12 mo: 6000 μg RE/day
6460 μg RE/day (rounded to 6000) identified by averaging the lowest doses of 4 case reports of hypervitaminosis A.
Uncertainty Factors (UF)
Not considered necessary because: the true threshold intake for teratogenicity is likely at or higher than the LOAEL of 3000 μg RE/d
the LOAEL of 7500 μg RE/d for hepatotoxicity is 2.5-fold higher than the LOAEL of 3000 μg RE/d for teratogenicity
Therefore, a UL of >3000 μg RE/d covers the risk of both hepatotoxicity and terato-genesis and also applies to pregnancy and lactation.
– Women of reproductive age (14–50 y, pregnant, lactating):
Interindividual variability in susceptibility (higher factor not justified because substantial data showing no adverse effects at doses > 3000 μg RE/day). UF = 1.5
Adults ≥ 19 y (excluding women of childbearing age):
Severe, irreversible nature of adverse effect + extrapolation from LOAEL to NOAEL + interindividual variation in sensitivity. UF = 5.0*
Infants 0–12 mo: Uncertainty of extrapolating LOAEL to NOAEL for non-severe and reversible effect (bulging fontanelle) + interindividual variability in sensitivity. UF = 10*
*UF value presented only as composite; values assigned to specific factors not specified.
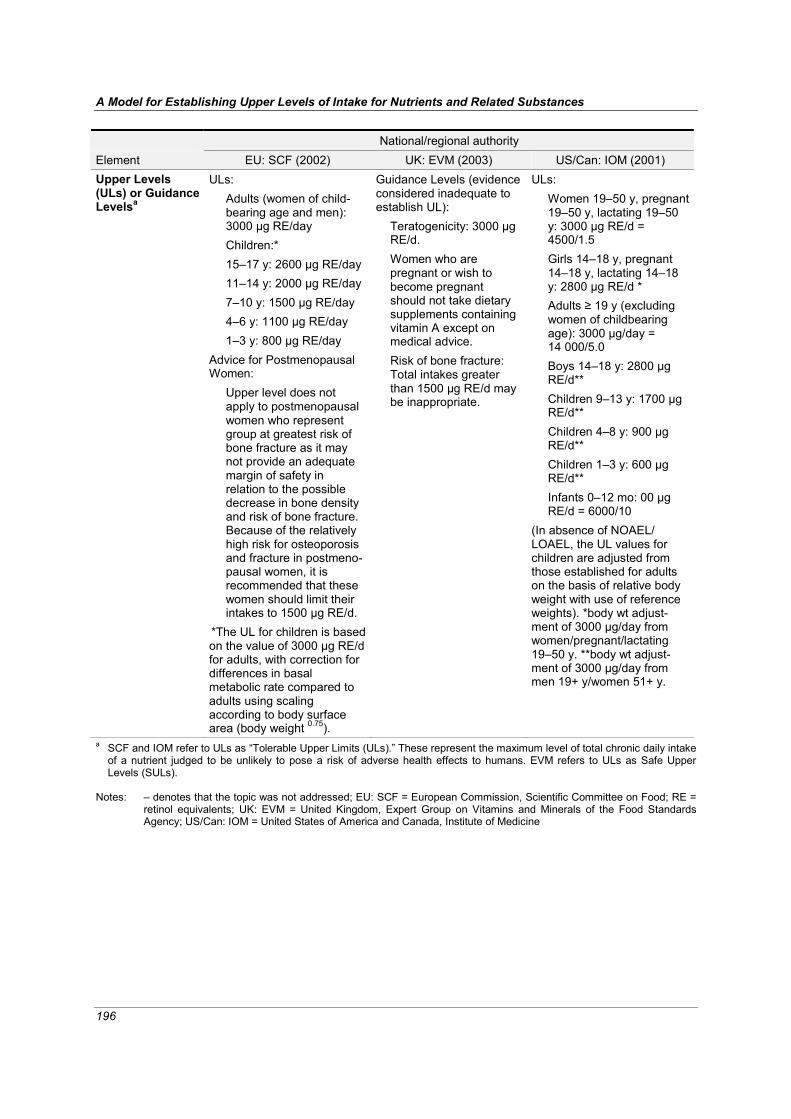
A Model for Establishing Upper Levels of Intake for Nutrients and Related Substances
196
National/regional authority Element EU: SCF (2002) UK: EVM (2003) US/Can: IOM (2001) Upper Levels (ULs) or Guidance Levelsa
ULs: Adults (women of child-bearing age and men): 3000 μg RE/day Children:* 15–17 y: 2600 μg RE/day 11–14 y: 2000 μg RE/day 7–10 y: 1500 μg RE/day 4–6 y: 1100 μg RE/day 1–3 y: 800 μg RE/day
Advice for Postmenopausal Women:
Upper level does not apply to postmenopausal women who represent group at greatest risk of bone fracture as it may not provide an adequate margin of safety in relation to the possible decrease in bone density and risk of bone fracture. Because of the relatively high risk for osteoporosis and fracture in postmeno-pausal women, it is recommended that these women should limit their intakes to 1500 μg RE/d.
*The UL for children is based on the value of 3000 μg RE/d for adults, with correction for differences in basal metabolic rate compared to adults using scaling according to body surface area (body weight 0.75).
Guidance Levels (evidence considered inadequate to establish UL):
Teratogenicity: 3000 μg RE/d. Women who are pregnant or wish to become pregnant should not take dietary supplements containing vitamin A except on medical advice. Risk of bone fracture: Total intakes greater than 1500 μg RE/d may be inappropriate.
ULs: Women 19–50 y, pregnant 19–50 y, lactating 19–50 y: 3000 μg RE/d = 4500/1.5 Girls 14–18 y, pregnant 14–18 y, lactating 14–18 y: 2800 μg RE/d * Adults ≥ 19 y (excluding women of childbearing age): 3000 μg/day = 14 000/5.0 Boys 14–18 y: 2800 μg RE/d** Children 9–13 y: 1700 μg RE/d** Children 4–8 y: 900 μg RE/d** Children 1–3 y: 600 μg RE/d** Infants 0–12 mo: 00 μg RE/d = 6000/10
(In absence of NOAEL/ LOAEL, the UL values for children are adjusted from those established for adults on the basis of relative body weight with use of reference weights). *body wt adjust-ment of 3000 μg/day from women/pregnant/lactating 19–50 y. **body wt adjust-ment of 3000 μg/day from men 19+ y/women 51+ y.
a SCF and IOM refer to ULs as “Tolerable Upper Limits (ULs).” These represent the maximum level of total chronic daily intake of a nutrient judged to be unlikely to pose a risk of adverse health effects to humans. EVM refers to ULs as Safe Upper Levels (SULs).
Notes: – denotes that the topic was not addressed; EU: SCF = European Commission, Scientific Committee on Food; RE =
retinol equivalents; UK: EVM = United Kingdom, Expert Group on Vitamins and Minerals of the Food Standards Agency; US/Can: IOM = United States of America and Canada, Institute of Medicine

Annex 6
197
References EVM (Expert Group on Vitamins and Minerals) (2003). Safe upper levels for vitamins and minerals.
London, Food Standards Agency Publications (http://www.food.gov.uk/multimedia/pdfs/vitmin2003.pdf, accessed 1 May 2005). IOM (Institute of Medicine) (2001). Dietary Reference Intakes for vitamin A, vitamin K, arsenic,
boron, chromium, copper, iodine, iron, manganese, molybdenum, nickel, silicon, vanadium, and zinc. Washington, DC, National Academy Press.
SCF (Scientific Committee on Food) (2002). Opinion of the Scientific Committee on Food on the tolerable upper intake level of preformed vitamin A (retinol and retinyl esters) (SCF/CS/NUT/ UPPLEV/24 Final), European Commission
(http://europa.eu.int/comm/food/fs/sc/scf/out80g_en.pdf, accessed 1 May 2005).
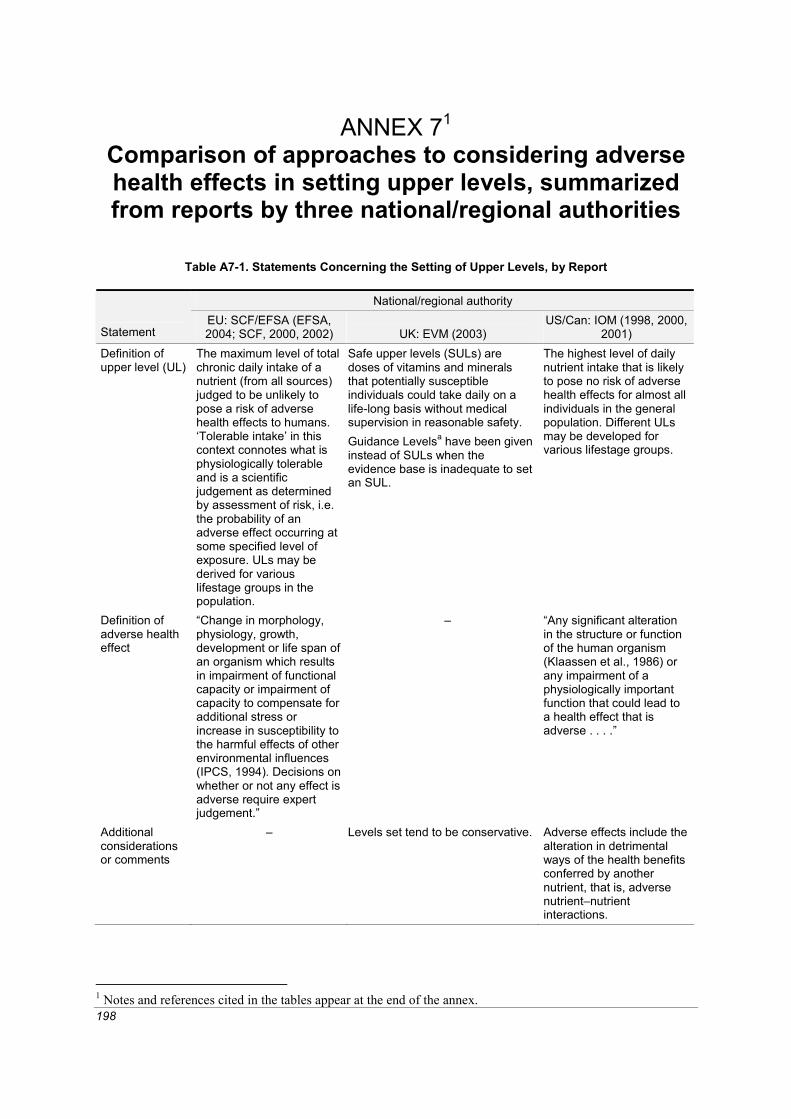
198
ANNEX 71 Comparison of approaches to considering adverse health effects in setting upper levels, summarized from reports by three national/regional authorities
Table A7-1. Statements Concerning the Setting of Upper Levels, by Report
National/regional authority
Statement EU: SCF/EFSA (EFSA, 2004; SCF, 2000, 2002) UK: EVM (2003)
US/Can: IOM (1998, 2000, 2001)
Definition of upper level (UL)
The maximum level of total chronic daily intake of a nutrient (from all sources) judged to be unlikely to pose a risk of adverse health effects to humans. ‘Tolerable intake’ in this context connotes what is physiologically tolerable and is a scientific judgement as determined by assessment of risk, i.e. the probability of an adverse effect occurring at some specified level of exposure. ULs may be derived for various lifestage groups in the population.
Safe upper levels (SULs) are doses of vitamins and minerals that potentially susceptible individuals could take daily on a life-long basis without medical supervision in reasonable safety. Guidance Levelsa have been given instead of SULs when the evidence base is inadequate to set an SUL.
The highest level of daily nutrient intake that is likely to pose no risk of adverse health effects for almost all individuals in the general population. Different ULs may be developed for various lifestage groups.
Definition of adverse health effect
“Change in morphology, physiology, growth, development or life span of an organism which results in impairment of functional capacity or impairment of capacity to compensate for additional stress or increase in susceptibility to the harmful effects of other environmental influences (IPCS, 1994). Decisions on whether or not any effect is adverse require expert judgement.”
– “Any significant alteration in the structure or function of the human organism (Klaassen et al., 1986) or any impairment of a physiologically important function that could lead to a health effect that is adverse . . . .”
Additional considerations or comments
– Levels set tend to be conservative. Adverse effects include the alteration in detrimental ways of the health benefits conferred by another nutrient, that is, adverse nutrient–nutrient interactions.
1 Notes and references cited in the tables appear at the end of the annex.

Annex 7
199
Table A7-1. Continued National/regional authority
Statement EU: SCF/EFSA (EFSA, 2004; SCF, 2000, 2002) UK: EVM (2003)
US/Can: IOM (1998, 2000, 2001)
Approach for determining which observed effects are adverse
Not all demonstrable structural or functional alterations represent adverse effects. Some alterations may be con-sidered of little or self-limiting biological impor-tance. Decisions on which observed effects are adverse are based on scientific judgements.
– Based on scientific judge-ments. Some demon-strable structural or functional alterations or nutrient–nutrient inter-actions may be considered of little or self-limiting biological importance.
Table A7-2. Adverse Health Effects Considered and Used in Setting Upper Level for Vitamin A, by Reportb
National/regional authority EU: SCF (2002) UK: EVM (2003) US/Can: IOM (2001) Effect Adult Decreased bone mineral density and increased risk of hip fracture
× Suggestive evidence that excess vitamin A intake may increase bone resorption and decrease bone formation. Vulnerable group: post-menopausal women.
× Vulnerable groups: older people, those with osteoporosis.
× Evidence is conflicting, data lacking to confirm findings of Melhus et al. (1998).
Teratogenicity √ For women of childbearing age; in addition, UL set on this basis was discussed in relation to other subgroups.
× A potential risk, especially in the first trimester of pregnancy.
√ For women of childbearing age.
Liver abnormalities, hepatotoxicity
√ Toxicity appears to depend on the dose taken and on the duration of intake.
× Details not specified.
√ For all other adults—specifically abnormal liver pathology that is characteristic of vitamin A intoxication, or grossly elevated hepatic vitamin A levels.
Elevated serum cholesterol
× Small increase observed. – –
Chronic toxicity – × Signs described in animals and humans.
–
Infants and Children
Intracranial and skeletal abnormalities, retarded growth
× Bulging fontanelle and intracranial hypertension discussed in relation to studies of high-dose vitamin A to prevent deficiency.
× – √ Case reports of “hypervitaminosis A,” which included a wide variety of adverse effects.

A Model for Establishing Upper Levels of Intake for Nutrients and Related Substances
200
Table A7-2. Continued National/regional authority EU: SCF (2002) UK: EVM (2003) US/Can: IOM (2001) Various other signs including bone pain, desquamation, weight loss, vomiting, hepatomegaly
– – √
UL Established? Yes No. Report indicates that a guidance levela was set, but it was not found.
Yes
Other Comments Narrow margin between the population reference intake and intakes associated with adverse effects.
Several vulnerable groups listed, but not linked with a specific adverse effect.
–
Table A7-3. Adverse Health Effects Considered and Used in Setting Upper Level for Iron, by Reportb
National/regional authority EU: SCF (2002) UK: EVM (2003) US/Can: IOM (2001) Effect Acute intoxication
× Young children especially at risk.
× Mainly from accidental ingestion by children.
× Mainly from accidental ingestion by children.
Iron–zinc interactions
–
× Significance of the decreased serum zinc concentrations is unclear.
× Significance of the decreased serum zinc concentrations is unclear.
Gastrointestinal effects (e.g., constipation, vomiting, diarrhoea)
× Vary with the delivery system. × Vary with the form of iron.
√ Although not serious compared with other effects considered, this was the only effect for which there was sufficient evidence on which to base a UL.
Iron overload × Susceptible groups include adults homozygous for hereditary haemochromatosis, those receiving long-term, high-dose medical treatment with iron, and those given repeated blood transfusions; a causative factor for Bantu siderosis. Poor correlation between iron intake and various indicators.
× Parenteral iron and/or increased absorption rather than high oral intake typically involved.
× Only one clear example of dietary iron overload (among South African and Zimbabwean blacks), and there may be a genetic component. Secondary iron overload discussed.
Cardiovascular disease, type 2 diabetes
× Epidemiological evidence is contradictory and unconvincing.
× Mentions problems of interpreting the data from epidemiological studies.
× Body of evidence does not provide convincing support for a causal relation-ship between dietary iron intake and the risk for CHD.

Annex 7
201
Table A7-3. Continued National/regional authority EU: SCF (2002) UK: EVM (2003) US/Can: IOM (2001) Cancer × Body of evidence is
not consistent and does not demonstrate causality.
× In the absence of chemical carcinogens, few studies on tumorigenesis in animals.
× Hepatic iron accumulation is a risk factor for hepato-cellular carcinoma among those with haemochroma-tosis, but evidence for a relationship between dietary iron intake and cancer is inconclusive in the general population.
Reproductive and develop-mental toxicity
– × None noted in animals.
–
UL Established? No No, however Guidance Levela set.
Yes
Other Comments – Guidance Level does not apply to those with increased susceptibility to iron overload.
–
Table A7-4. Adverse Health Effects Considered and Used in Setting Upper Level for Vitamin C, by Reportb
National/regional authority EU: EFSA (2004) UK: EVM (2003) US/Can: IOM (2000) Effect Gastrointestinal effects (e.g., distention, flatulence, diarrhea)
× The most clearly defined adverse effect at high intakes, but data on the dose–response relationship are too limited to use as the basis for an upper level intake value.
× Associated with high doses; few controlled studies address this response. Data insufficient for a UL.
√ Effect attributed to osmotic effect of the unabsorbed vitamin. Data primarily from case–control studies.
Metabolic acidosis
× Details not specified. × Details not specified. –
Pro-oxidant effects
Details not specified. × Significance is uncertain for the general population.
× No clear causal relationship shown.
Changes in prothrombin activity
× Not sufficiently well documented or substantiated to be used as the basis for risk assessment.
× Details not specified. –
Systemic conditioning, ‘conditioned need’ scurvy
× Reported in guinea pigs; anecdotal evidence in humans, doesn’t pose a significant risk.
× Details not specified. × Evidence of an effect is scanty and conflicting for both infants and adults.
Renal effects: stones, high oxalate or uric acid excretion
× Not sufficiently well documented or sub-stantiated to be used as the basis for risk assess-ment.
× Data are conflicting. Potentially vulnerable group: those with a predisposition to urinary or renal stones.
× Cases of stones limited to a few subjects with renal disease. No clear causal relationship shown. Highly sensitive subpopulation: those with renal disorders.

A Model for Establishing Upper Levels of Intake for Nutrients and Related Substances
202
Table A7-4. Continued National/regional authority EU: EFSA (2004) UK: EVM (2003) US/Can: IOM (2000) Excessive iron uptake from the gut
Small increase in iron absorption could be a problem for those with haemochromatosis or heterozygous for the condition.
× Vulnerable group: those with disorders of iron metabolism or storage.
× Highly sensitive subpopulation: those with haemochromatosis.
Reduced vitamin B12 and copper status
× Not sufficiently well documented or substan-tiated to be used as the basis for risk assess-ment.
× Details not specified. × No clear causal relationship shown.
Reproductive effects
– – –
Decreased growth
– × Reported in guinea pigs.
–
Genotoxicity × Current data do not allow adequate eval-uation of the genotoxic potential of high intakes of the vitamin. Oxidative DNA damage observed in vitro and in vivo is of uncertain significance.
–
–
Carcinogenicity × Findings in animals not relevant to human health; conflicting evi-dence about the rela-tionship with breast cancer.
× Mixed results from in vitro studies.
–
Increase in serum cholesterol concentration
× Evidence is conflicting. –
–
Dental enamel erosion
– – × Single study, no clear causal relationship shown.
Allergic response – – × Single study, no clear causal relationship shown.
Haemolysis –
–
× Highly sensitive sub-populations: newborns with glucose-6-phos-phate dehydrogenase deficiency, normal preterm infants.
UL Established? No No, however a Guidance Levela was set.
Yes
Other Comments – – – a By definition, Guidance Level is not expected to produce adverse effects in a majority of the people. b × denotes that the adverse health effect was mentioned or reviewed in the hazard identification; √ denotes that the adverse
effect was identified as providing a basis for setting a UL. Notes: – denotes that the topic was not addressed; EU: SCF/EFSA = European Commission, Scientific Committee on
Food/European Food Safety Authority; UK: EVM = United Kingdom, Expert Group on Vitamins and Minerals of the Food Standards Agency; US/Can: IOM = United States of America and Canada, Institute of Medicine.
Note: Some differences may be due to differences in the publications available since reviews were conducted in different years.

Annex 7
203
References EFSA (European Food Safety Authority) (2004). Opinion of the Scientific Panel on Dietetic Products,
Nutrition and Allergies on a request from the Commission Related to the Tolerable Upper Intake Level of Iron. The EFSA Journal, 125:1-34.
EVM (Expert Group on Vitamins and Minerals) (2003). Safe upper levels for vitamins and minerals. London, Food Standards Agency Publications
(http://www.food.gov.uk/multimedia/pdfs/vitmin2003.pdf, accessed 1 May 2005). IOM (Institute of Medicine) (1998). Dietary Reference Intakes: a risk assessment model for estab-
lishing upper intake levels for nutrients. Washington, DC, National Academy Press. IOM (2000). Dietary Reference Intakes for vitamin C, vitamin E, selenium, and carotenoids.
Washington, DC, National Academy Press. IOM (2001). Dietary Reference Intakes for vitamin A, vitamin K, arsenic, boron, chromium, copper,
iodine, iron, manganese, molybdenum, nickel, silicon, vanadium, and zinc. Washington, DC, National Academy Press.
IPCS (International Programme on Chemical Safety) (1994). Assessing human health risks of chemicals: derivation of guidance values for health-based exposure limits. Environmental Health Criteria 170. Geneva, World Health Organization (http://www.inchem.org/documents/ehc/ehc/ehc170.htm, accessed 1 May 2005).
Klaassen CD, Amdur MO, Doull J, eds. 1986. Casarett and Doull’s toxicology: the basic science of poisons, 3rd ed. New York, Macmillan.
Melhus et al. (1998). Excessive dietary intake of vitamin A is associated with reduced bone mineral density and increased risk for hip fracture. Annals of Internal Medicine, 129:770-778.
SCF (Scientific Committee on Food) (2000). Guidelines of the Scientific Committee on Food for the development of tolerable upper intake levels for vitamins and minerals (SCF/CS/NUT/UPPLEV/ 11 Final), European Commission (http://europa.eu.int/comm/food/fs/sc/scf/out80a_en.pdf, accessed 1 May 2005).
SCF (2002). Opinion of the Scientific Committee on Food on the tolerable upper intake level of preformed vitamin A (retinol and retinyl esters) (SCF/CS/NUT/UPPLEV/24 Final), European Commission (http://europa.eu.int/comm/food/fs/sc/scf/out80g_en.pdf, accessed 1 May 2005).

204
ANN
EX
81 C
ompa
rison
of s
cien
tific
revi
ew o
f dat
a on
vita
min
A a
nd b
one
dens
ity,
sum
mar
ized
from
repo
rts
by th
ree
natio
nal/r
egio
nal a
utho
ritie
s
Tabl
e A
8-1.
Com
paris
on o
f Ref
eren
ces
Use
d an
d Su
mm
ary
of In
form
atio
n, b
y R
epor
t
N
atio
nal/r
egio
nal a
utho
rity
Ref
eren
ce
EU
: SC
F (2
002)
U
K: E
VM
(200
3)
US
/Can
: IO
M (2
001)
Nie
man
and
O
bbin
k, 1
954
A
s re
view
ed in
Hat
hcoc
k et
al.
(199
0), v
itam
in A
do
ses
(up
to 1
3 50
0 μg
RE
per a
nim
al) h
ave
been
sh
own
to le
ad to
bon
e fra
gilit
y an
d sp
onta
neou
s fra
ctur
es.
– –
Leel
apru
te e
t al.,
19
73
– G
ross
bon
e le
sion
s ch
arac
teriz
ed b
y re
sorp
tion
of p
arts
of
pel
vis,
fibu
lae,
and
sca
pula
e w
ith b
one
thin
ning
wer
e ob
serv
ed in
gro
win
g fe
mal
e ra
ts tr
eate
d w
ith 7
500–
22 5
00 μ
g R
E/d
vita
min
A a
s pa
lmita
te o
r ret
inol
for
17 d
. Sof
t tis
sue
calc
ifica
tion
also
occ
urre
d. D
oses
giv
en
eith
er o
rally
or b
y in
trape
riton
eal i
njec
tion.
The
latte
r as
soci
ated
with
gre
ater
toxi
city
from
retin
ol b
ut n
ot fr
om
vita
min
A p
alm
itate
.
–
Dhe
m a
nd G
oret
-N
icai
se, 1
984
His
topa
thol
ogic
al c
hang
es in
ani
mal
bon
e fo
llow
ing
very
hig
h vi
tam
in A
dos
es (u
p to
13
500 μg
RE
per
an
imal
) hav
e be
en s
how
n to
lead
to b
one
fragi
lity
and
spon
tane
ous
fract
ures
in ra
ts.
– –
Freu
denh
eim
et a
l.,
1986
M
easu
red
bone
min
eral
con
tent
in 4
-y c
linic
al tr
ial
in w
omen
rece
ivin
g or
not
rece
ivin
g ca
lciu
m
supp
lem
ents
. Hig
hly
sign
ifica
nt e
ffect
of v
itam
in A
at
uln
a on
ly. H
ard
to in
terp
ret a
s se
ems
due
to
sing
le in
divi
dual
with
ver
y hi
gh in
take
of v
itam
in A
(4
300 μg
RE
) who
sho
wed
a ra
pid
bone
loss
.
4 y
clin
ical
tria
l in
99 w
omen
age
d 35
–60
y gi
ven
eith
er
calc
ium
sup
plem
ent o
r pla
cebo
. Eva
luat
ed e
ffect
of
usua
l int
akes
of e
nerg
y an
d 14
nut
rient
s on
sin
gle-
phot
on a
bsor
ptio
met
ric m
easu
res
of m
iner
al c
onte
nt in
ar
m b
one.
Vita
min
A in
take
inve
rsel
y co
rrela
ted
with
ra
te o
f cha
nge
in u
lna
bone
min
eral
con
tent
in p
ost-
men
opau
sal w
omen
of t
reat
men
t gro
up. I
n a
sing
le
patie
nt re
ceiv
ing
a hi
gh s
uppl
emen
tal d
ose
(ave
rage
in
take
439
2 μg
RE/
d), b
one
loss
was
ver
y ra
pid
with
no
othe
r app
aren
t rea
son.
The
auth
ors
eval
uate
d th
e co
rrela
tion
betw
een
mea
n 3-
y vi
tam
in A
inta
kes
rang
ing
from
app
rox-
imat
ely
2–3
mg/
d an
d ra
tes
of c
hang
e in
BM
D in
82
wom
en, 3
5–65
y o
f age
(17
prem
enop
ausa
l and
67
post
men
opau
sal).
No
cons
iste
nt re
latio
nshi
p be
twee
n vi
tam
in A
inta
ke a
nd ra
te o
f bon
e m
iner
al
cont
ent.
The
sing
le s
ubje
ct w
ho s
how
ed ra
pid
bone
m
iner
al lo
ss w
ith v
ery
high
vita
min
A a
lso
appe
ared
to
hav
e co
nsum
ed la
rge
amou
nts
of o
ther
mic
ro-
nutri
ents
as
wel
l, ob
scur
ing
the
sign
ifica
nce
of th
is
rela
tions
hip.
The
stu
dy a
lso
suffe
rs fr
om a
sm
all
sam
ple
size
in e
ach
of th
e fo
ur k
ey g
roup
s, m
akin
g co
rrela
tions
of p
oten
tial n
utrit
iona
l or p
atho
logi
cal
impo
rtanc
e in
dete
rmin
ate.
1 N
otes
and
refe
renc
es c
ited
in ta
ble
appe
ar a
t the
end
of t
he a
nnex
.

Annex 8
205
Tabl
e A8
-1. C
ontin
ued
N
atio
nal/r
egio
nal a
utho
rity
Ref
eren
ce
EU
: SC
F (2
002)
U
K: E
VM
(200
3)
US
/Can
: IO
M (2
001)
Fran
kel e
t al.,
198
6
– A
fter s
ingl
e or
al d
ose
of 8
2 00
0 μg
RE
/kg
bw g
iven
, ad
ult r
ats
had
no b
iolo
gica
lly a
ctiv
e pa
rath
yroi
d ho
rmon
e co
ncen
tratio
ns. S
ecre
tions
of b
ioac
tive
PTH
no
t alte
red
by in
cuba
tion
of ra
t thy
ropa
rath
yroi
d co
mpl
exes
with
retin
ol in
vitr
o. 3
-wk-
old
rats
giv
en
15 0
00 μ
g R
E 3
tim
es/w
k fo
r 6 w
k ha
d hi
gher
ost
eocl
ast
num
bers
and
low
er o
steo
id th
an in
con
trols
. Ser
um
bioa
ctiv
e P
TH w
as n
ot d
etec
tabl
e an
d se
rum
25-
hydr
oxyv
itam
in D
was
sig
nific
antly
low
er th
an in
co
ntro
ls. A
t 750
0 μg
RE
3 ti
mes
/wk
for 3
wk,
ser
um
bioa
ctiv
e P
TH w
as s
uppr
esse
d to
und
etec
tabl
e le
vels
bu
t no
effe
ct o
n se
rum
25-
hydr
oxyv
itam
in D
. Ser
um
calc
ium
and
25-
hydr
oxyv
itam
in D
wer
e lo
wer
in v
itam
in
D in
toxi
cate
d ra
ts th
at w
ere
also
giv
en 7
500 μg
RE
3
times
/wk.
Aut
hors
sug
gest
ed th
at s
kele
tal c
hang
es
caus
ed b
y hi
gh le
vels
of v
itam
in A
wer
e in
depe
nden
t of
the
effe
cts
on P
TH b
ut c
ould
be
caus
ed b
y ch
ange
s in
vi
tam
in D
met
abol
ites;
thes
e pa
thol
ogic
al c
hang
es c
ould
be
mod
ified
by
seco
ndar
y ch
ange
s in
cal
cium
met
abo-
lism
and
in th
e m
etab
olis
m o
f cal
cium
-regu
late
d ho
r-m
ones
.
–
Hou
gh e
t al.,
198
8
– Y
oung
rats
(100
g) t
reat
ed w
ith 3
000
or 7
500 μg
RE/
d re
tinyl
pal
mita
te fo
r 21
d by
sto
mac
h tu
be. T
ibia
l hi
stom
orph
omet
ry re
veal
ed in
crea
sed
bone
reso
rptio
n (in
crea
sed
oste
ocla
st s
ize
and
num
ber)
and
redu
ced
bone
form
atio
n. T
here
was
a p
auci
ty o
f tra
becu
lar
surfa
ces
cove
red
with
ost
eoid
. Spo
ntan
eous
lim
b fra
ctur
es a
nd in
crea
sed
skel
etal
turn
over
(as
mea
sure
d by
ser
um a
lkal
ine
phos
phat
ase
and
urin
ary
hydr
oxy-
prol
ine
excr
etio
n) a
lso
wer
e ob
serv
ed in
hig
h-do
se
grou
p. S
erum
cal
cium
and
mag
nesi
um le
vels
wer
e un
rem
arka
ble,
but
ser
um p
hosp
horu
s le
vels
wer
e si
gnifi
cant
ly e
leva
ted
in th
e co
ntro
l ani
mal
s. C
ircul
atin
g le
vels
of p
oten
t bon
e re
sorb
ers
(PTH
, 1,2
5-di
hydr
oxy-
vita
min
D a
nd 2
5-O
H v
itam
in D
) wer
e co
mpa
rabl
e,
sugg
estin
g th
at v
itam
in A
was
hav
ing
a di
rect
effe
ct o
n bo
ne.
–
Bie
sals
ki, 1
989
Rep
orts
of s
ever
al is
olat
ed c
ases
of s
kele
tal
prob
lem
s in
chi
ldre
n w
ith s
ever
e hy
perv
itam
inos
is
A w
ere
revi
ewed
in th
is a
rticl
e. B
one
sign
s in
volv
e a
decr
ease
in d
ensi
ty, o
steo
poro
tic c
hang
es, a
nd
corti
cal t
hick
enin
g of
the
long
tubu
lar b
ones
, le
adin
g to
reta
rded
gro
wth
.
– –

A Model for Establishing Upper Levels of Intake for Nutrients and Related Substances
206
Tabl
e A8
-1. C
ontin
ued
N
atio
nal/r
egio
nal a
utho
rity
Ref
eren
ce
EU
: SC
F (2
002)
U
K: E
VM
(200
3)
US
/Can
: IO
M (2
001)
Sow
ers
and
Wal
lace
, 199
0
No
rela
tions
hip
betw
een
vita
min
A in
take
or s
erum
re
tinol
con
cent
ratio
ns a
nd ra
dial
bon
e m
ass
or
fract
ure
hist
ory
in 2
46 p
ostm
enop
ausa
l wom
en.
Vita
min
A in
take
, ser
um re
tinol
, rad
ial b
one
mas
s, a
nd
fract
ure
hist
ory
eval
uate
d in
246
pos
tmen
opau
sal
wom
en. M
ore
than
36%
use
d a
vita
min
A s
uppl
emen
t, w
ith 8
% u
sing
a s
uppl
emen
t con
tain
ing
>200
0 μg
RE/
d.
No
rela
tions
hip
betw
een
radi
al b
one
mas
s an
d fra
ctur
e hi
stor
y an
d ei
ther
vita
min
A o
r ser
um re
tinol
. Whe
n po
pula
tion
was
stra
tifie
d by
sup
plem
ent u
se, n
o st
atis
tical
ly s
igni
fican
t rel
atio
nshi
p be
twee
n se
rum
re
tinol
and
bon
e m
ass
afte
r adj
ustin
g fo
r fac
tors
(suc
h as
age
) ass
ocia
ted
with
bon
e m
ass.
Whe
n se
rum
retin
ol
was
div
ided
into
terti
les,
no
rela
tions
hip
with
bon
e m
ass
whe
n ad
just
ed o
n ag
e, m
uscl
e ar
ea, a
nd u
se o
f thi
azid
e an
ti-hy
perte
nsiv
es. S
tudy
had
inad
equa
te p
ower
to te
st
an a
ssoc
iatio
n be
twee
n bo
ne m
ass
and
vita
min
A
inta
kes
> 20
00 μ
g R
E/da
y. 3
6% o
f the
pop
ulat
ion
wer
e ag
ed <
60 y
and
wer
e lik
ely
to b
e he
tero
gene
ous
with
re
gard
to e
stro
gen
depl
etio
n bo
ne lo
ss; t
he s
ite w
here
bo
ne m
ass
was
mea
sure
d (c
entra
l rad
ius)
is c
onsi
dere
d le
ss re
spon
sive
to c
hang
e.
–
Sch
even
and
H
amilt
on, 1
990
R
etin
oic
acid
stim
ulat
es o
steo
clas
t for
mat
ion
and
bone
reso
rptio
n.
– –
Hat
hcoc
k et
al.,
19
90
His
topa
thol
ogic
al c
hang
es in
ani
mal
bon
e fo
llow
ing
high
vita
min
A d
oses
(up
to 1
3 50
0 μg
RE
per
an
imal
) wer
e re
view
ed.
– –
John
ell e
t al.,
199
2 –
ME
DO
S s
tudy
gro
up fo
und
that
hip
frac
ture
rate
s va
ried
acro
ss E
urop
e, b
eing
11-
and
7-fo
ld h
ighe
r for
wom
en
and
men
in N
. Eur
ope
(par
ticul
arly
in S
wed
en a
nd
Nor
way
) tha
n in
S. E
urop
e. F
ract
ure
rate
s w
ere
high
er
in S
wed
ish
men
than
in S
wis
s or
Eng
lish
wom
en. T
he
diffe
renc
e in
inci
denc
e w
as h
ighe
r bet
wee
n co
untri
es
than
bet
wee
n se
xes,
sug
gest
ing
that
an
impo
rtant
ge
netic
or e
nviro
nmen
tal f
acto
r was
invo
lved
. Kno
wn
risk
fact
ors
wer
e no
t tho
ught
to e
xpla
in th
e fin
ding
.
–
Mel
ton,
199
5
– H
ip fr
actu
re ra
tes
wer
e hi
gher
in S
cand
inav
ia th
an in
co
mpa
rabl
e po
pula
tions
in N
. Am
eric
a. W
hen
diet
ary
patte
rns
in E
urop
e w
ere
com
pare
d in
diff
eren
t Eur
opea
n to
wns
, ret
inol
inta
kes
wer
e 6-
fold
hig
her i
n Sc
andi
navi
a co
mpa
red
to S
. Eur
ope.
–
Kin
dmar
k et
al.,
19
95
Ret
inoi
c ac
id s
timul
ates
ost
eocl
ast f
orm
atio
n an
d bo
ne re
sorp
tion.
–
–
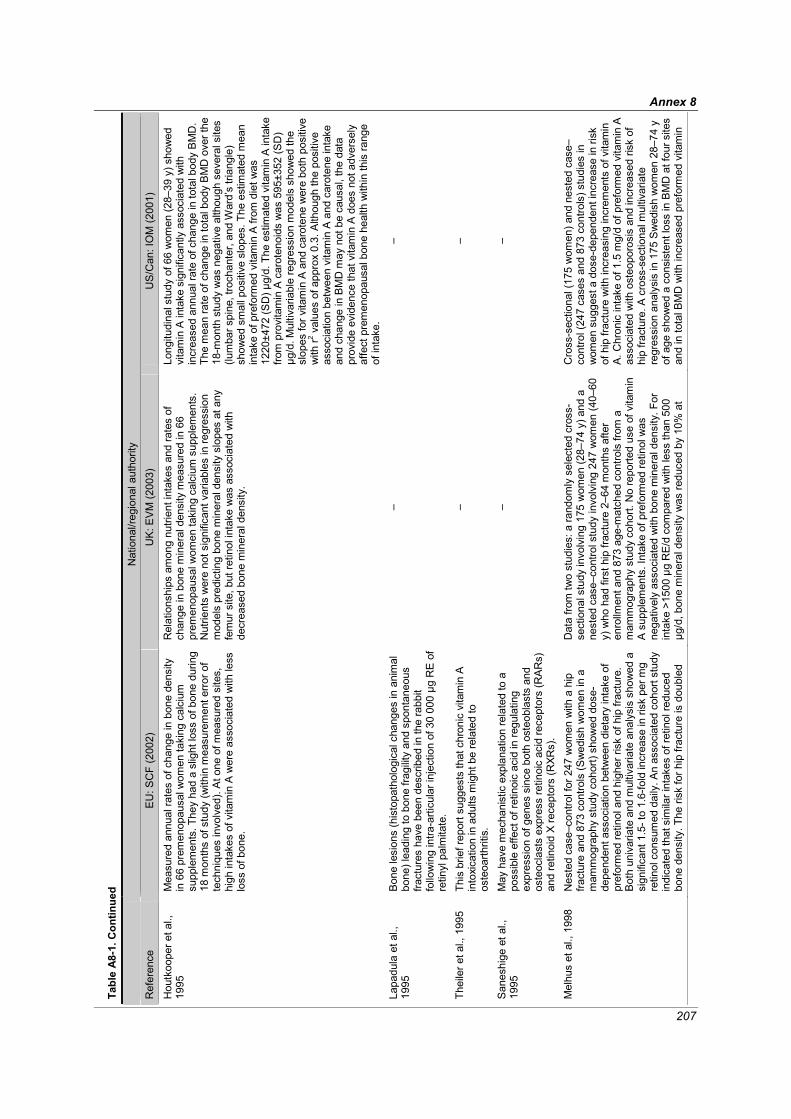
Annex 8
207
Tabl
e A8
-1. C
ontin
ued
N
atio
nal/r
egio
nal a
utho
rity
Ref
eren
ce
EU
: SC
F (2
002)
U
K: E
VM
(200
3)
US
/Can
: IO
M (2
001)
Hou
tkoo
per e
t al.,
19
95
Mea
sure
d an
nual
rate
s of
cha
nge
in b
one
dens
ity
in 6
6 pr
emen
opau
sal w
omen
taki
ng c
alci
um
supp
lem
ents
. The
y ha
d a
slig
ht lo
ss o
f bon
e du
ring
18 m
onth
s of
stu
dy (w
ithin
mea
sure
men
t erro
r of
tech
niqu
es in
volv
ed).
At o
ne o
f mea
sure
d si
tes,
hi
gh in
take
s of
vita
min
A w
ere
asso
ciat
ed w
ith le
ss
loss
of b
one.
Rel
atio
nshi
ps a
mon
g nu
trien
t int
akes
and
rate
s of
ch
ange
in b
one
min
eral
den
sity
mea
sure
d in
66
prem
enop
ausa
l wom
en ta
king
cal
cium
sup
plem
ents
. N
utrie
nts
wer
e no
t sig
nific
ant v
aria
bles
in re
gres
sion
m
odel
s pr
edic
ting
bone
min
eral
den
sity
slo
pes
at a
ny
fem
ur s
ite, b
ut re
tinol
inta
ke w
as a
ssoc
iate
d w
ith
decr
ease
d bo
ne m
iner
al d
ensi
ty.
Long
itudi
nal s
tudy
of 6
6 w
omen
(28–
39 y
) sho
wed
vi
tam
in A
inta
ke s
igni
fican
tly a
ssoc
iate
d w
ith
incr
ease
d an
nual
rate
of c
hang
e in
tota
l bod
y B
MD
. Th
e m
ean
rate
of c
hang
e in
tota
l bod
y B
MD
ove
r the
18
-mon
th s
tudy
was
neg
ativ
e al
thou
gh s
ever
al s
ites
(lum
bar s
pine
, tro
chan
ter,
and
War
d’s
trian
gle)
sh
owed
sm
all p
ositi
ve s
lope
s. T
he e
stim
ated
mea
n in
take
of p
refo
rmed
vita
min
A fr
om d
iet w
as
1220
±472
(SD
) μg/
d. T
he e
stim
ated
vita
min
A in
take
fro
m p
rovi
tam
in A
car
oten
oids
was
595
±352
(SD
) μg
/d. M
ultiv
aria
ble
regr
essi
on m
odel
s sh
owed
the
slop
es fo
r vita
min
A a
nd c
arot
ene
wer
e bo
th p
ositi
ve
with
r2 val
ues
of a
ppro
x 0.
3. A
lthou
gh th
e po
sitiv
e as
soci
atio
n be
twee
n vi
tam
in A
and
car
oten
e in
take
an
d ch
ange
in B
MD
may
not
be
caus
al, t
he d
ata
prov
ide
evid
ence
that
vita
min
A d
oes
not a
dver
sely
af
fect
pre
men
opau
sal b
one
heal
th w
ithin
this
rang
e of
inta
ke.
Lapa
dula
et a
l.,
1995
B
one
lesi
ons
(his
topa
thol
ogic
al c
hang
es in
ani
mal
bo
ne) l
eadi
ng to
bon
e fra
gilit
y an
d sp
onta
neou
s fra
ctur
es h
ave
been
des
crib
ed in
the
rabb
it fo
llow
ing
intra
-arti
cula
r inj
ectio
n of
30
000 μg
RE
of
retin
yl p
alm
itate
.
– –
Thei
ler e
t al.,
199
5
This
brie
f rep
ort s
ugge
sts
that
chr
onic
vita
min
A
into
xica
tion
in a
dults
mig
ht b
e re
late
d to
os
teoa
rthrit
is.
– –
San
eshi
ge e
t al.,
19
95
May
hav
e m
echa
nist
ic e
xpla
natio
n re
late
d to
a
poss
ible
effe
ct o
f ret
inoi
c ac
id in
regu
latin
g ex
pres
sion
of g
enes
sin
ce b
oth
oste
obla
sts
and
oste
ocla
sts
expr
ess
retin
oic
acid
rece
ptor
s (R
AR
s)
and
retin
oid
X re
cept
ors
(RXR
s).
– –
Mel
hus
et a
l., 1
998
Nes
ted
case
–con
trol f
or 2
47 w
omen
with
a h
ip
fract
ure
and
873
cont
rols
(Sw
edis
h w
omen
in a
m
amm
ogra
phy
stud
y co
hort)
sho
wed
dos
e-de
pend
ent a
ssoc
iatio
n be
twee
n di
etar
y in
take
of
pref
orm
ed re
tinol
and
hig
her r
isk
of h
ip fr
actu
re.
Bot
h un
ivar
iate
and
mul
tivar
iate
ana
lysi
s sh
owed
a
sign
ifica
nt 1
.5- t
o 1.
6-fo
ld in
crea
se in
risk
per
mg
retin
ol c
onsu
med
dai
ly. A
n as
soci
ated
coh
ort s
tudy
in
dica
ted
that
sim
ilar i
ntak
es o
f ret
inol
redu
ced
bone
den
sity
. The
risk
for h
ip fr
actu
re is
dou
bled
Dat
a fro
m tw
o st
udie
s: a
rand
omly
sel
ecte
d cr
oss-
sect
iona
l stu
dy in
volv
ing
175
wom
en (2
8–74
y) a
nd a
ne
sted
cas
e–co
ntro
l stu
dy in
volv
ing
247
wom
en (4
0–60
y)
who
had
firs
t hip
frac
ture
2–6
4 m
onth
s af
ter
enro
llmen
t and
873
age
-mat
ched
con
trols
from
a
mam
mog
raph
y st
udy
coho
rt. N
o re
porte
d us
e of
vita
min
A
sup
plem
ents
. Int
ake
of p
refo
rmed
retin
ol w
as
nega
tivel
y as
soci
ated
with
bon
e m
iner
al d
ensi
ty. F
or
inta
ke >
1500
μg
RE/
d co
mpa
red
with
less
than
500
μg
/d, b
one
min
eral
den
sity
was
redu
ced
by 1
0% a
t
Cro
ss-s
ectio
nal (
175
wom
en) a
nd n
este
d ca
se–
cont
rol (
247
case
s an
d 87
3 co
ntro
ls) s
tudi
es in
w
omen
sug
gest
a d
ose-
depe
nden
t inc
reas
e in
risk
of
hip
frac
ture
with
incr
easi
ng in
crem
ents
of v
itam
in
A. C
hron
ic in
take
of 1
.5 m
g/d
of p
refo
rmed
vita
min
A
asso
ciat
ed w
ith o
steo
poro
sis
and
incr
ease
d ris
k of
hi
p fra
ctur
e. A
cro
ss-s
ectio
nal m
ultiv
aria
te
regr
essi
on a
naly
sis
in 1
75 S
wed
ish
wom
en 2
8–74
y
of a
ge s
how
ed a
con
sist
ent l
oss
in B
MD
at f
our s
ites
and
in to
tal B
MD
with
incr
ease
d pr
efor
med
vita
min

A Model for Establishing Upper Levels of Intake for Nutrients and Related Substances
208
Tabl
e A8
-1. C
ontin
ued
N
atio
nal/r
egio
nal a
utho
rity
Ref
eren
ce
EU
: SC
F (2
002)
U
K: E
VM
(200
3)
US
/Can
: IO
M (2
001)
Mel
hus
et a
l., 1
998
(Con
tinue
d)
for r
etin
ol in
take
gre
ater
than
150
0 μg
RE
/d a
s co
mpa
red
to in
take
s le
ss th
an 4
80 μ
g R
E/d
. Bas
ed
on u
niva
riate
ana
lysi
s, th
e R
R a
t int
akes
of 5
00–
1000
μg
RE
/d, 1
000–
1500
μg
RE
/d, a
nd >
1500
μg
RE
/d, c
ompa
red
with
inta
kes
<500
μg
RE
/d, w
ere
0.93
, 1.2
7, a
nd 1
.95,
resp
ectiv
ely.
Alth
ough
the
asso
ciat
ion
may
hav
e ar
isen
from
unr
ecog
nize
d co
nfou
ndin
g, th
e m
echa
nist
ic d
ata
on th
e ac
tions
of
retin
oic
acid
on
bone
met
abol
ism
are
con
sist
ent
with
the
repo
rted
rela
tions
hip.
Th
is s
tudy
indi
cate
s an
incr
ease
d ris
k of
bon
e fra
ctur
e ov
er a
n in
take
rang
e si
mila
r to
that
no
rmal
ly c
onsu
med
from
food
or s
uppl
emen
ts.
fem
oral
nec
k, 1
4% a
t lum
bar s
pine
and
6%
for t
otal
bo
dy. R
isk
for h
ip fr
actu
re w
as d
oubl
ed. F
or e
very
100
0 μg
incr
ease
in d
aily
RE
inta
ke, r
isk
of h
ip fr
actu
re
incr
ease
d by
68%
. Sm
okin
g w
as a
con
foun
der.
Info
rmat
ion
bias
pos
sibl
e fro
m q
uest
ioni
ng c
ase-
patie
nts
afte
r hip
frac
ture
. No
data
on
thyr
oid
horm
one
ther
apy
and
fam
ily h
isto
ry o
f ost
eopo
rosi
s. C
onfo
undi
ng
influ
ence
s of
an
unid
entif
ied
diet
ary
fact
or p
ossi
ble;
hig
h de
gree
of r
ando
m e
rror i
n es
timat
e of
retin
ol in
take
m
ight
lead
to u
nder
estim
atio
n of
true
risk
of h
ip fr
actu
re.
A in
take
. Num
erou
s nu
tritio
nal a
nd n
on-n
utrit
iona
l ex
posu
res
wer
e as
sess
ed a
llow
ing
subs
tant
ial
cont
rol o
f pot
entia
l con
foun
ders
. With
use
of
stra
tifie
d es
timat
es o
f ret
inol
inta
ke in
regr
essi
on
anal
ysis
, BM
D in
crea
sed
with
eac
h 0.
5 m
g/d
incr
emen
t in
inta
ke a
bove
a re
fere
nce
inta
ke o
f les
s th
an 0
.5 m
g/d
until
inta
kes
exce
eded
1.5
mg/
d.
Abo
ve th
is le
vel,
mea
n B
MD
dec
reas
ed m
arke
dly
at
each
site
. It i
s no
t cle
ar w
heth
er th
e fin
ding
s ar
e eq
ually
app
licab
le to
pre
- and
pos
tmen
opau
sal
wom
en.
The
seco
nd p
art w
as a
nes
ted
case
–con
trol s
tudy
on
the
risk
fact
ors
for h
ip fr
actu
re. C
ases
wer
e m
ostly
pos
tmen
opau
sal w
omen
with
firs
t hip
frac
ture
w
ithin
2–6
4 m
onth
s af
ter e
ntry
into
the
larg
e co
hort
stud
y, o
r 5–6
7 m
onth
s af
ter m
id-p
oint
of t
he re
calle
d di
etar
y as
sess
men
t. Fo
ur m
atch
ed c
ontro
l sub
ject
s w
ere
sele
cted
for e
ach
case
. Log
istic
regr
essi
on
show
ed a
dos
e-de
pend
ent i
ncre
ase
in ri
sk o
f hip
fra
ctur
e w
ith e
ach
0.5
mg/
d in
crem
ent i
n re
porte
d re
tinol
inta
ke a
bove
0.5
mg/
d ba
selin
e. O
dds
ratio
w
as 2
.05
at in
take
s >1
.5 m
g/d.
Coh
en-T
anug
i and
Fo
rest
, 199
8
Ret
inoi
c ac
id in
hibi
ts o
steo
blas
t diff
eren
tiatio
n.
– –
Cru
z et
al.,
199
9 –
Whe
n di
etar
y pa
ttern
s in
Eur
ope
wer
e co
mpa
red
in
diffe
rent
Eur
opea
n to
wns
, ret
inol
inta
kes
wer
e 6-
fold
hi
gher
in S
cand
inav
ia c
ompa
red
to S
outh
ern
Eur
ope.
–
Roh
de e
t al.,
199
9 M
olec
ular
inte
ract
ion
of v
itam
ins
A an
d D
cou
ld b
e re
spon
sibl
e fo
r ant
agon
ism
of v
itam
in A
tow
ards
ac
tion
of v
itam
in D
in ra
ts.
– C
hron
ic e
xces
sive
vita
min
A in
take
has
bee
n sh
own
to le
ad to
bon
e m
iner
al lo
ss in
ani
mal
s, m
akin
g su
ch
a co
nseq
uenc
e in
hum
ans
biol
ogic
ally
pla
usib
le.
Bin
kley
and
K
rueg
er, 2
000
D
ata
sugg
est t
hat e
xces
sive
vita
min
A m
ay
incr
ease
bon
e re
sorp
tion
and
decr
ease
bon
e fo
rmat
ion.
– –
Bal
lew
et a
l., 2
001
No
asso
ciat
ion
betw
een
seru
m re
tinyl
est
ers
and
redu
ced
bone
den
sity
in U
K’s
198
8–94
Nat
iona
l H
ealth
and
Nut
ritio
n S
urve
y, b
ut s
erum
retin
yl
este
rs re
flect
rece
nt in
take
and
are
not
a g
ood
indi
cato
r of v
itam
in A
sta
tus.
Ass
ocia
tion
betw
een
fast
ing
seru
m le
vels
of r
etin
yl
este
rs a
nd b
one
min
eral
den
sity
was
stu
died
in 5
790
non-
preg
nant
par
ticip
ants
≥20
y. U
sing
mul
tiple
re
gres
sion
s, th
ere
wer
e no
sig
nific
ant a
ssoc
iatio
ns
betw
een
fast
ing
seru
m re
tinyl
est
ers
and
BM
D a
s as
sess
ed a
t the
fem
oral
nec
k, tr
ocha
nter
, in
tertr
ocha
nter
and
tota
l hip
.
(? u
nava
ilabl
e be
fore
com
plet
ion
of re
port)

Annex 8
209
Tabl
e A8
-1. C
ontin
ued
N
atio
nal/r
egio
nal a
utho
rity
Ref
eren
ce
EU
: SC
F (2
002)
U
K: E
VM
(200
3)
US
/Can
: IO
M (2
001)
Joha
nsso
n an
d M
elhu
s, 2
001
D
ata
from
a tr
ial i
n 9
heal
thy
volu
ntee
rs re
ceiv
ing
8250
μg
RE
vita
min
A o
r 2 μ
g of
1,2
5(O
H)2
D3
vita
min
D, o
r bot
h, in
dica
ted
that
retin
yl p
alm
itate
an
tago
nize
s ra
pid
calc
ium
resp
onse
to p
hysi
o-lo
gica
l lev
els
of v
itam
in D
.
– (?
una
vaila
ble
befo
re c
ompl
etio
n of
repo
rt)
Kaw
ahar
a et
al.,
20
02
No
chan
ges
in s
erum
mar
kers
of s
kele
tal t
urno
ver
in 4
0 m
ales
giv
en 7
.6 m
g vi
tam
in A
retin
yl p
al-
mita
te d
aily
for 6
wee
ks. T
hese
mea
sure
s w
ere
cons
ider
ed b
y au
thor
s to
be
sens
itive
mar
kers
of
bone
turn
over
. Cou
ld n
ot d
eter
min
e w
heth
er lo
ng-
term
vita
min
A s
uppl
emen
tatio
n m
ight
hav
e ad
vers
e sk
elet
al e
ffect
s.
– (U
nava
ilabl
e be
fore
com
plet
ion
of re
port)
Fesk
anic
h et
al.,
20
02
Nur
ses’
Hea
lth S
tudy
in th
e U
.S.A
. rep
orte
d in
crea
sed
risk
of h
ip fr
actu
res
in >
72 0
00 w
omen
st
udie
d fo
r 18
y th
at w
as a
ttrib
utab
le to
tota
l ret
inol
in
take
but
not
to β
-car
oten
e. S
igni
fican
t ele
vate
d R
R (1
.48
and
1.89
) in
quin
tiles
with
inta
kes
>300
0 an
d >2
000 μg
RE
/d c
ompa
red
to lo
wes
t qui
ntile
s.
Mul
tivar
iate
ana
lyse
s re
veal
hig
hly
sign
ifica
nt
trend
s fo
r tot
al in
take
s of
vita
min
A a
nd fo
od +
su
pple
men
t but
not
for f
ood
only
. D
ata
divi
ded
into
qui
ntile
s fo
r tot
al v
itam
in A
and
fo
r ret
inol
inta
ke. S
igni
fican
t tre
nds
appa
rent
be
twee
n R
R a
nd in
take
s fro
m fo
od a
nd
supp
lem
ents
of t
otal
vita
min
A a
nd re
tinol
. A
sign
ifica
nt in
crea
se fo
r the
2 h
ighe
st q
uint
iles
com
pare
d w
ith th
e lo
wes
t. Tr
end
anal
ysis
for
retin
ol fr
om fo
od a
nd s
uppl
emen
ts c
ompa
red
with
fo
od o
nly
indi
cate
s an
impo
rtant
con
tribu
tion
from
su
pple
men
ts; t
his
wou
ld b
e le
ss li
kely
to b
e af
fect
ed b
y di
etar
y co
nfou
ndin
g th
an th
e M
elhu
s et
al
. (19
98) s
tudy
.
Nur
ses’
Hea
lth S
tudy
– re
late
d hi
gh v
itam
in A
inta
ke
from
food
and
sup
plem
ents
and
hip
frac
ture
for m
ore
than
72
000
post
men
opau
sal w
omen
age
d 34
–77
y fro
m 1
980–
1998
. 603
hip
frac
ture
s oc
curre
d af
ter l
ow o
r m
oder
ate
traum
a. A
fter c
ontro
lling
for c
onfo
undi
ng
fact
ors,
wom
en in
hig
hest
qui
ntile
of v
itam
in A
inta
ke
(≥30
00 μ
g R
E/d
) had
a s
igni
fican
t 1.4
8 R
R fo
r hip
fra
ctur
es c
ompa
red
to w
omen
in lo
wes
t qui
ntile
of i
ntak
e (<
1250
μg
RE/
d). I
ntak
e ris
k pr
imar
ily a
ttrib
utab
le to
re
tinol
. Ass
ocia
tion
of re
tinol
with
hip
frac
ture
was
re
duce
d in
wom
en ta
king
pos
tmen
opau
sal e
stro
gens
. β-
caro
tene
did
not
con
tribu
te to
frac
ture
risk
. Wom
en
curre
ntly
taki
ng v
itam
in A
sup
plem
ents
had
non
-si
gnifi
cant
40%
hig
her r
isk
of h
ip fr
actu
re c
ompa
red
to
thos
e no
t tak
ing
supp
lem
ents
. Am
ong
wom
en n
ot ta
king
su
pple
men
ts, r
etin
ol fr
om fo
od w
as s
igni
fican
tly
asso
ciat
ed w
ith fr
actu
re ri
sk. L
ong-
term
inta
ke o
f die
t hi
gh in
retin
ol m
ay p
rom
ote
the
deve
lopm
ent o
f os
teop
orot
ic h
ip fr
actu
res
in w
omen
. (St
udy
coho
rt pr
imar
ily w
hite
wom
en.)
(Una
vaila
ble
befo
re c
ompl
etio
n of
repo
rt)
Pro
mis
low
et a
l.,
2002
–
570
wom
en a
nd 3
88 m
en, 5
5– 9
2 y.
Die
tary
inta
ke b
y qu
estio
nnai
re fo
r 4 y
. Mea
sure
d BM
D a
nd b
one
loss
4 y
la
ter.
Ret
inol
inta
ke w
as a
ssoc
iate
d w
ith d
ecre
ased
B
MD
and
incr
ease
d bo
ne lo
ss a
t int
akes
>84
0 μg
RE
/d
even
afte
r adj
ustm
ent f
or p
ossi
ble
conf
ound
ers.
S
uppl
emen
tal r
etin
ol u
se a
lso
asso
ciat
ed w
ith
decr
ease
d B
MD
and
incr
ease
d bo
ne lo
ss.
(Una
vaila
ble
befo
re c
ompl
etio
n of
repo
rt)
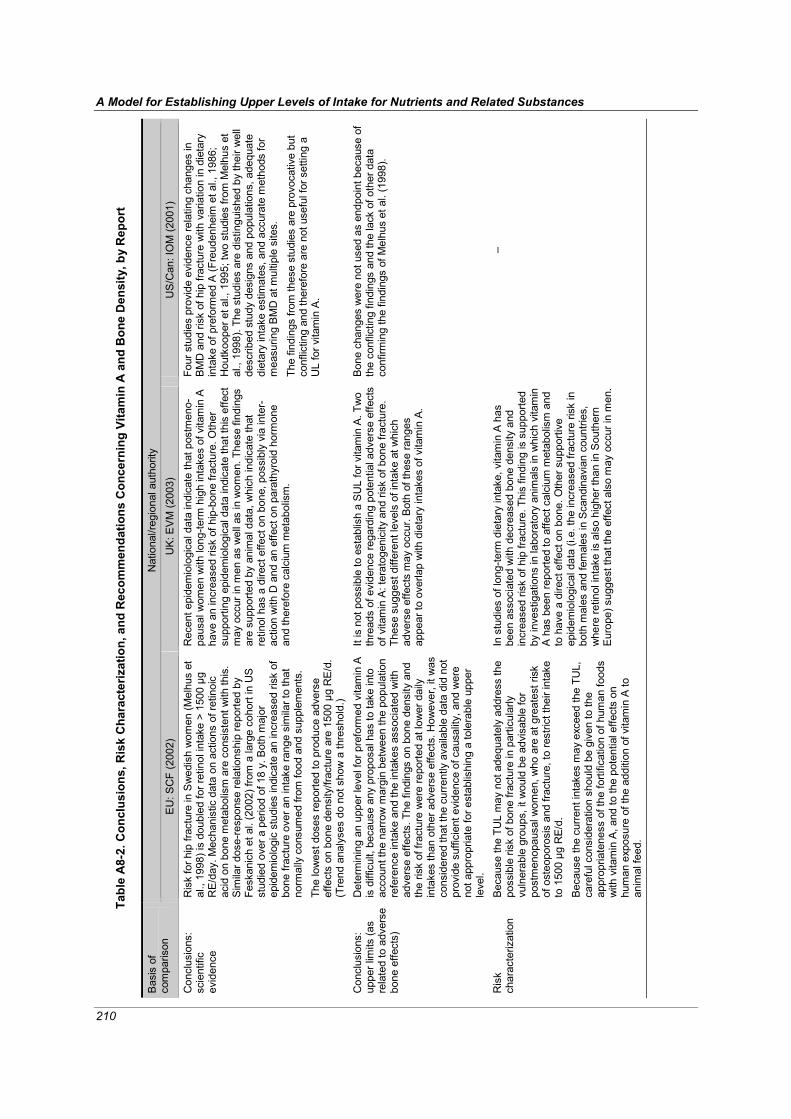
A Model for Establishing Upper Levels of Intake for Nutrients and Related Substances
210
Tabl
e A
8-2.
Con
clus
ions
, Ris
k C
hara
cter
izat
ion,
and
Rec
omm
enda
tions
Con
cern
ing
Vita
min
A a
nd B
one
Den
sity
, by
Rep
ort
N
atio
nal/r
egio
nal a
utho
rity
Bas
is o
f co
mpa
rison
E
U: S
CF
(200
2)
UK
: EV
M (2
003)
U
S/C
an: I
OM
(200
1)
Con
clus
ions
: sc
ient
ific
evid
ence
Ris
k fo
r hip
frac
ture
in S
wed
ish
wom
en (M
elhu
s et
al
., 19
98) i
s do
uble
d fo
r ret
inol
inta
ke >
150
0 μg
R
E/d
ay. M
echa
nist
ic d
ata
on a
ctio
ns o
f ret
inoi
c ac
id o
n bo
ne m
etab
olis
m a
re c
onsi
sten
t with
this
. S
imila
r dos
e-re
spon
se re
latio
nshi
p re
porte
d by
Fe
skan
ich
et a
l. (2
002)
from
a la
rge
coho
rt in
US
st
udie
d ov
er a
per
iod
of 1
8 y.
Bot
h m
ajor
ep
idem
iolo
gic
stud
ies
indi
cate
an
incr
ease
d ris
k of
bo
ne fr
actu
re o
ver a
n in
take
rang
e si
mila
r to
that
no
rmal
ly c
onsu
med
from
food
and
sup
plem
ents
. Th
e lo
wes
t dos
es re
porte
d to
pro
duce
adv
erse
ef
fect
s on
bon
e de
nsity
/frac
ture
are
150
0 μg
RE
/d.
(Tre
nd a
naly
ses
do n
ot s
how
a th
resh
old.
)
Rec
ent e
pide
mio
logi
cal d
ata
indi
cate
that
pos
tmen
o-pa
usal
wom
en w
ith lo
ng-te
rm h
igh
inta
kes
of v
itam
in A
ha
ve a
n in
crea
sed
risk
of h
ip-b
one
fract
ure.
Oth
er
supp
ortin
g ep
idem
iolo
gica
l dat
a in
dica
te th
at th
is e
ffect
m
ay o
ccur
in m
en a
s w
ell a
s in
wom
en. T
hese
find
ings
ar
e su
ppor
ted
by a
nim
al d
ata,
whi
ch in
dica
te th
at
retin
ol h
as a
dire
ct e
ffect
on
bone
, pos
sibl
y vi
a in
ter-
actio
n w
ith D
and
an
effe
ct o
n pa
rath
yroi
d ho
rmon
e an
d th
eref
ore
calc
ium
met
abol
ism
.
Four
stu
dies
pro
vide
evi
denc
e re
latin
g ch
ange
s in
B
MD
and
risk
of h
ip fr
actu
re w
ith v
aria
tion
in d
ieta
ry
inta
ke o
f pre
form
ed A
(Fre
uden
heim
et a
l., 1
986;
H
outk
oope
r et a
l., 1
995;
two
stud
ies
from
Mel
hus
et
al.,
1998
). Th
e st
udie
s ar
e di
stin
guis
hed
by th
eir w
ell
desc
ribed
stu
dy d
esig
ns a
nd p
opul
atio
ns, a
dequ
ate
diet
ary
inta
ke e
stim
ates
, and
acc
urat
e m
etho
ds fo
r m
easu
ring
BM
D a
t mul
tiple
site
s.
The
findi
ngs
from
thes
e st
udie
s ar
e pr
ovoc
ativ
e bu
t co
nflic
ting
and
ther
efor
e ar
e no
t use
ful f
or s
ettin
g a
UL
for v
itam
in A
.
Con
clus
ions
: up
per l
imits
(as
rela
ted
to a
dver
se
bone
effe
cts)
Det
erm
inin
g an
upp
er le
vel f
or p
refo
rmed
vita
min
A
is d
iffic
ult,
beca
use
any
prop
osal
has
to ta
ke in
to
acco
unt t
he n
arro
w m
argi
n be
twee
n th
e po
pula
tion
refe
renc
e in
take
and
the
inta
kes
asso
ciat
ed w
ith
adve
rse
effe
cts.
The
find
ings
on
bone
den
sity
and
th
e ris
k of
frac
ture
wer
e re
porte
d at
low
er d
aily
in
take
s th
an o
ther
adv
erse
effe
cts.
How
ever
, it w
as
cons
ider
ed th
at th
e cu
rrent
ly a
vaila
ble
data
did
not
pr
ovid
e su
ffici
ent e
vide
nce
of c
ausa
lity,
and
wer
e no
t app
ropr
iate
for e
stab
lishi
ng a
tole
rabl
e up
per
leve
l.
It is
not
pos
sibl
e to
est
ablis
h a
SU
L fo
r vita
min
A. T
wo
thre
ads
of e
vide
nce
rega
rdin
g po
tent
ial a
dver
se e
ffect
s of
vita
min
A: t
erat
ogen
icity
and
risk
of b
one
fract
ure.
Th
ese
sugg
est d
iffer
ent l
evel
s of
inta
ke a
t whi
ch
adve
rse
effe
cts
may
occ
ur. B
oth
of th
ese
rang
es
appe
ar to
ove
rlap
with
die
tary
inta
kes
of v
itam
in A
.
Bon
e ch
ange
s w
ere
not u
sed
as e
ndpo
int b
ecau
se o
f th
e co
nflic
ting
findi
ngs
and
the
lack
of o
ther
dat
a co
nfirm
ing
the
findi
ngs
of M
elhu
s et
al.
(199
8).
Ris
k ch
arac
teriz
atio
n B
ecau
se th
e TU
L m
ay n
ot a
dequ
atel
y ad
dres
s th
e po
ssib
le ri
sk o
f bon
e fra
ctur
e in
par
ticul
arly
vu
lner
able
gro
ups,
it w
ould
be
advi
sabl
e fo
r po
stm
enop
ausa
l wom
en, w
ho a
re a
t gre
ates
t ris
k of
ost
eopo
rosi
s an
d fra
ctur
e, to
rest
rict t
heir
inta
ke
to 1
500 μg
RE/
d.
Bec
ause
the
curre
nt in
take
s m
ay e
xcee
d th
e TU
L,
care
ful c
onsi
dera
tion
shou
ld b
e gi
ven
to th
e ap
prop
riate
ness
of t
he fo
rtific
atio
n of
hum
an fo
ods
with
vita
min
A, a
nd to
the
pote
ntia
l effe
cts
on
hum
an e
xpos
ure
of th
e ad
ditio
n of
vita
min
A to
an
imal
feed
.
In s
tudi
es o
f lon
g-te
rm d
ieta
ry in
take
, vita
min
A h
as
been
ass
ocia
ted
with
dec
reas
ed b
one
dens
ity a
nd
incr
ease
d ris
k of
hip
frac
ture
. Thi
s fin
ding
is s
uppo
rted
by in
vest
igat
ions
in la
bora
tory
ani
mal
s in
whi
ch v
itam
in
A h
as b
een
repo
rted
to a
ffect
cal
cium
met
abol
ism
and
to
hav
e a
dire
ct e
ffect
on
bone
. Oth
er s
uppo
rtive
ep
idem
iolo
gica
l dat
a (i.
e. th
e in
crea
sed
fract
ure
risk
in
both
mal
es a
nd fe
mal
es in
Sca
ndin
avia
n co
untri
es,
whe
re re
tinol
inta
ke is
als
o hi
gher
than
in S
outh
ern
Eur
ope)
sug
gest
that
the
effe
ct a
lso
may
occ
ur in
men
.
–

Annex 8
211
Tab
le A
8-2
. C
on
tin
ue
d
National/re
gio
nal auth
ority
B
asis
of
com
parison
EU
: S
CF
(2002)
UK
: E
VM
(2003)
US
/Can:
IOM
(2001)
Ris
k
chara
cte
rization
(Continued)
The r
isk o
f hip
fra
ctu
re is a
continuous g
raded
response a
ssocia
ted w
ith e
xposure
levels
that
inclu
de
avera
ge d
ieta
ry inta
kes. It
is n
ot
possib
le t
o identify
an
inta
ke t
hat
is w
ithout som
e d
egre
e o
f risk.
How
ever,
th
e a
vaila
ble
data
indic
ate
that
tota
l in
takes g
reate
r th
an 1
500
g R
E/d
may b
e inappro
priate
. T
his
corr
esponds t
o 2
5
g R
E/k
g b
w/d
in a
60 k
g a
dult.
Data
on r
etinol in
takes fro
m food a
nd s
upple
ments
suggest
that
hig
h-level consum
ers
of liv
er
and liv
er
pro
ducts
and/o
r supple
ments
may e
xceed inta
kes a
t w
hic
h a
dvers
e e
ffects
have b
een r
eport
ed in t
he
litera
ture
. It
should
als
o b
e n
ote
d that
die
tary
supple
ments
may c
onta
in 2
0-1
00%
more
vitam
in A
th
an is s
tate
d o
n the label, d
ue to the p
ractice o
f usin
g
‘overa
ges’ w
ithin
the food s
upple
ments
industr
y t
o
ensure
that
the p
roduct
conta
ins n
o less than t
he
sta
ted c
onte
nt
of
the v
itam
in t
hro
ughout
its s
helf life.
This
may b
e p
art
icula
rly im
port
ant giv
en t
hat th
e e
ffect
on f
ractu
re r
isk a
ppears
to b
e a
gra
ded r
esponse,
with
the r
isk o
f fr
actu
re incre
asin
g w
ith incre
ased inta
ke.
–
Recom
men-
dations
The p
ossib
le lin
ks b
etw
een b
one d
ensity,
the r
isk
of
fractu
re,
and v
itam
in A
inta
ke s
hould
be
revie
wed w
hen f
urt
her
data
becom
e a
vaila
ble
.
Ideally
, a p
rospective s
tudy w
ould
be d
esig
ned to
take into
account th
e e
ffects
of
age a
nd o
f confo
undin
g v
ariable
s o
n the r
isk. It
is r
ecogniz
ed
that such a
stu
dy w
ould
require a
very
larg
e
popula
tion a
nd p
rolo
nged t
reatm
ent
and follo
w-u
p.
–M
ore
researc
h is n
eeded t
o c
larify
wheth
er
chro
nic
vitam
in A
inta
ke,
at
levels
that
chara
cte
rize u
pper-
usual in
take r
anges for
many A
merican a
nd
Euro
pean p
opula
tions, m
ay lead to loss in B
MD
and
consequent in
cre
ased r
isk o
f hip
fra
ctu
re in c
ert
ain
popula
tion g
roups,
part
icula
rly a
mong p
re-
and
postm
enopausal w
om
en.
Note
s:
– d
enote
s t
hat
the t
opic
was n
ot
addre
ssed;
BM
D =
bone m
inera
l density;
bw
= b
ody w
eig
ht;
SU
L =
safe
upper
level; E
U:
SC
F =
Euro
pean C
om
mis
sio
n,
Scie
ntific C
om
mitte
e o
n F
ood;
ME
DO
S =
Mediterr
anean O
ste
oporo
sis
Stu
dy;
PT
H =
para
thyro
id h
orm
one;
RE
= r
etinol
equiv
ale
nts
; R
R =
rela
tive r
isk;
UK
: E
VM
= U
nited K
ingdom
; E
xpert
Gro
up o
n V
itam
ins a
nd
Min
era
ls o
f th
e F
ood S
tandard
s A
gency;
US
/Can =
United S
tate
s o
f A
merica a
nd C
anada, In
stitu
te o
f M
edic
ine.

A Model for Establishing Upper Levels of Intake for Nutrients and Related Substances
212
References Ballew C, Galuska D, Gillespie C (2001). High serum retinyl esters are not associated with reduced
bone mineral density in the Third National Health and Nutrition Examination Survey, 1988-1994. Journal of Bone and Mineral Research, 16:2306-2312.
Biesalski HK (1989). Comparative assessment of the toxicology of vitamin A and retinoids in man. Toxicology, 57:117-161.
Binkley N, Krueger D (2000). Hypervitaminosis A and bone. Nutrition Reviews, 58:138-144. Cohen-Tanugi A, Forest N (1998). Retinoic acid suppresses the osteogenic differentiation capacity of
murine osteoblast-like 3/A/1D-1M cell cultures. Differentiation, 63:115-123. Cruz JA et al. (1999). Intake of vitamins and minerals. Euronut SENECA investigators. European
Journal of Clinical Nutrition, 45(suppl3):121-138. Dhem A, Goret-Nicaise N (1984). Effects of retinoic acid on rat bone. Food and Chemical
Toxicology, 22:199-206. EVM (Expert Group on Vitamins and Minerals) (2003). Safe upper levels for vitamins and minerals.
London, Food Standards Agency Publications (http://www.food.gov.uk/multimedia/pdfs/vitmin2003.pdf, accessed 1 May 2005). Feskanich D et al. (2002). Vitamin A intake and hip fractures among postmenopausal women. Journal
of the American Medical Association, 287:47-54. Frankel TL et al. (1986). Hypervitaminosis A and calcium-regulating hormones in the rat. Journal of
Nutrition, 116:578-587. Freudenheim JL, Johnson NE, Smith EL (1986). Relationships between usual nutrient intake and
bone-mineral content of women 35-65 years of age: longitudinal and cross-sectional analysis. American Journal of Clinical Nutrition, 44:863-876.
Hathcock J et al. (1990). Evaluation of vitamin A toxicity. American Journal of Clinical Nutrition, 52:183-202.
Hough S et al. (1988). Effects of hypervitaminosis A on the bone and mineral metabolism of the rat. Endocrinology, 122:2933-2939.
Houtkooper LB et al. (1995). Nutrients, body composition and exercise are related to change in bone mineral density in premenopausal women. Journal of Nutrition, 125:1229-1237.
IOM (Institute of Medicine) (2001). Dietary Reference Intakes for vitamin A, vitamin K, arsenic, boron, chromium, copper, iodine, iron, manganese, molybdenum, nickel, silicon, vanadium, and zinc. Washington, DC, National Academy Press.
Johansson S, Melhus H (2001). Vitamin A antagonizes calcium response to vitamin D in man. Journal of Bone and Mineral Research, 16:1899-1905.
Johnell O et al. (1992). The apparent incidence of hip fracture in Europe: a study of national register sources. Osteoporosis International 2:298-302.
Kawahara TN et al. (2002). Short-term vitamin A supplementation does not affect bone turnover in men. Journal of Nutrition, 132:1169-1172.
Kindmark A et al. (1995). Inhibitory effects of 9-cis and all-trans retinoic acid on 1,25(OH)2 vitamin D3-induced bone resorption. Calcified Tissue International, 57:242-244.
Lapadula G et al. (1995). Early ultrastructural changes of articular cartilage and synovial membrane in experimental vitamin A-induced osteoarthritis. Journal of Rheumatology, 22:1913-1921.
Leelaprute V et al. (1973). Hypervitaminosis A in rats. Varying responses due to different forms, doses, and routes of administration. Archives of Pathology, 96:5-9.
Melhus et al. (1998). Excessive dietary intake of vitamin A is associated with reduced bone mineral density and increased risk for hip fracture. Annals of Internal Medicine, 129:770-778.
Melton LJ (1995). Epidemiology of fractures. In: Riggs BL, Melton LJ, eds. Osteoporosis: etiology, diagnosis, and management, 2nd ed. Philadelphia, Lippincot-Raven.
Nieman C, Obbink HJ (1954). The biochemistry and pathology of hypervitaminosis A. Vitamins and Hormones, 12:69-99.

Annex 8
213
Promislow JH et al. (2002). Retinol intake and bone mineral density in the elderly: the Rancho Bernardo Study. Journal of Bone and Mineral Research, 17:1349-1358.
Rohde CM et al. (1999). Vitamin A antagonizes the action of vitamin D in rats. Journal of Nutrition, 129:2246-2250.
Saneshige S et al. (1995). Retinoic acid directly stimulates osteoclastic bone resorption and gene expression of cathepsin K/OC-2. The Biochemical Journal, 309:721-724.
SCF (Scientific Committee on Food) (2002). Opinion of the Scientific Committee on Food on the tolerable upper intake level of preformed vitamin A (retinol and retinyl esters) (SCF/CS/NUT/ UPPLEV/24 Final), European Commission (http://europa.eu.int/comm/food/fs/sc/scf/out80g_en.pdf, accessed 1 May 2005).
Scheven BA, Hamilton NJ (1990). Retinoic acid and 1,25-dihydroxyvitamin D3 stimulate osteoclast formation by different mechanisms. Bone, 11:53-59.
Sowers MF, Wallace RB (1990). Retinol, supplemental vitamin A and bone status. Journal of Clinical Epidemiology, 43:693-699.
Theiler R et al. 1995. Can vitamin A (retinol) and synthetic retinoids influence bone metabolism? Three case reports. Challenges of Modern Medicine, 7:393-397.

214
ANNEX 91 Comparison of national/regional nutrient intake assessments, summarized from reports by three
national/regional authorities
Table A9-1. Background: Data sources, methodologies, and caveats, by report
National/regional authority
Background
EU: SCF (2000a-c, 2002a-c, 2003a-d),
EFSA (2004) UK: EVM (2003) US/Can: IOM (1997, 1998,
2000, 2001, 2002-2005) Intakes from foods
Data Source: Published summary tables of intake data. Number and source of studies varied by nutrient. For nutrients described in table below, up to 15 publications for 8 countries were available. 7- and 8-day records - 7 studies - 1 household study
(n = 2734) - 6 studies with
individuals (n = >11 510)
7-day weighed record - 1 study - 2197 individuals
7-day weighed intake, 3-d weighed intake, 24-h recall - 1 study - 4972 individuals
2-day records - 1 study - 5958 households
24-h recall - 1 study - 2488 individuals
Semi-quantitative FFQ (180 food items) - 1 study - 2672 individuals
Computer-assisted dietary interview
Data Source: Three nutrition surveys. National Diet and Nutrition Survey 1986–1987 (NDNS) - Generally used - Cross-sectional data - Nationally representative
samples of specific population age groups
- Uses a weighed 4- or 7-day dietary record kept by the participant
- Rolling program of detailed dietary surveys of individuals divided into specific population age groups
- Caution: 1986/7 data do not reflect recent changes in use of supplements and fortified foods
- Nutrients from food sources only (including beverages such as teas but excluding supple-ments and drinking water)
- Prone to underreporting because of respondent burden
- Nutrient status information is collected via blood samples and physical measurements
- Detailed interview information on SES, demographic and lifestyle characteristics
Data Source - USA: Three surveys. National Health and Nutrition Examination Survey of 1988–94 (NHANES III)
- Nationally representative - 30 000 subjects - Ages 2 months and older - Single 24-h recall for all
subjects + second recall for a 5% nonrandom sub-sample to allow statistical adjustment of intake estimates for day-to-day variation
- Contains quantitative estimates of water and supplement consumption
Continuing Survey of Food Intakes by Individuals (CSFII) for 1994–96 - Nationally representative - 16 000 subjects - All ages - Statistical adjustment for
day-to-day variations - Qualitative intake data for
supplements FDA’s Total Diet Study - Used for nutrients not
covered by the two surveys above
- A market basket survey - 306 core foods
representing the USDA food consumption survey data for 1994–96 for numerous age/sex groups
1 Notes and references cited in table appear at the end of the annex.
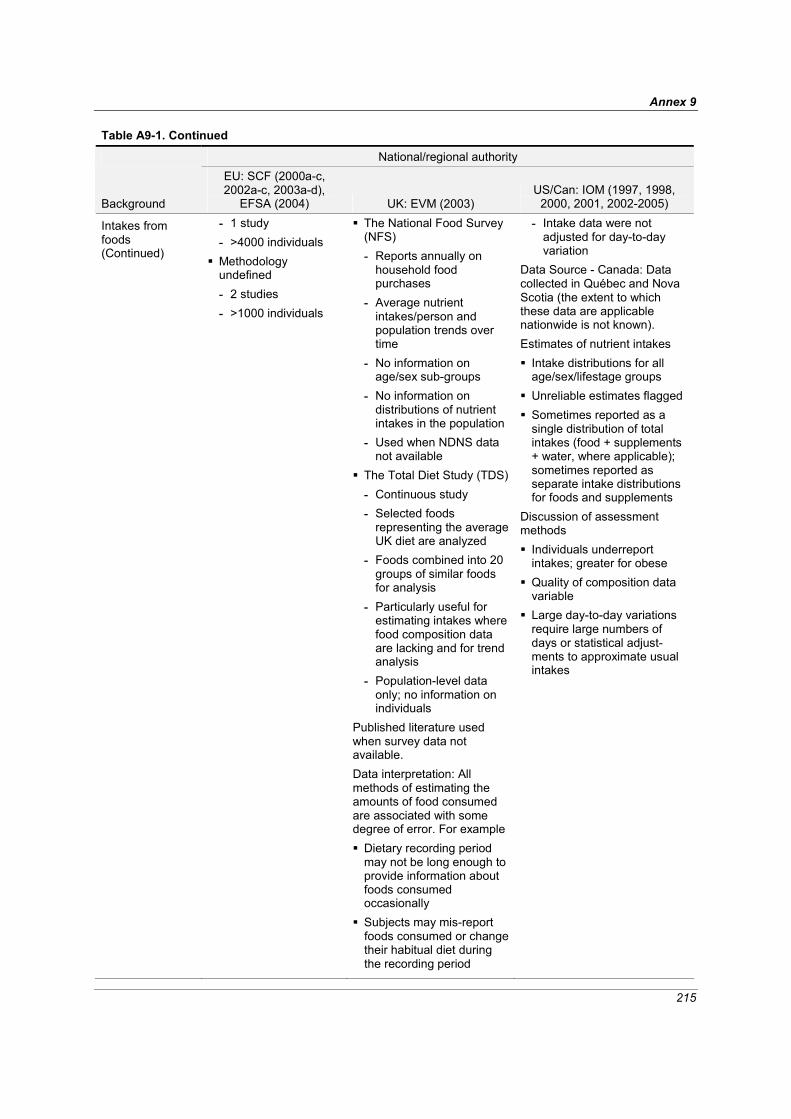
Annex 9
215
Table A9-1. Continued
National/regional authority
Background
EU: SCF (2000a-c, 2002a-c, 2003a-d),
EFSA (2004) UK: EVM (2003) US/Can: IOM (1997, 1998,
2000, 2001, 2002-2005)
Intakes from foods (Continued)
- 1 study - >4000 individuals
Methodology undefined - 2 studies - >1000 individuals
The National Food Survey (NFS) - Reports annually on
household food purchases
- Average nutrient intakes/person and population trends over time
- No information on age/sex sub-groups
- No information on distributions of nutrient intakes in the population
- Used when NDNS data not available
The Total Diet Study (TDS)- Continuous study - Selected foods
representing the average UK diet are analyzed
- Foods combined into 20 groups of similar foods for analysis
- Particularly useful for estimating intakes where food composition data are lacking and for trend analysis
- Population-level data only; no information on individuals
Published literature used when survey data not available. Data interpretation: All methods of estimating the amounts of food consumed are associated with some degree of error. For example Dietary recording period may not be long enough to provide information about foods consumed occasionally
Subjects may mis-report foods consumed or change their habitual diet during the recording period
- Intake data were not adjusted for day-to-day variation
Data Source - Canada: Data collected in Québec and Nova Scotia (the extent to which these data are applicable nationwide is not known). Estimates of nutrient intakes Intake distributions for all age/sex/lifestage groups
Unreliable estimates flagged Sometimes reported as a single distribution of total intakes (food + supplements + water, where applicable); sometimes reported as separate intake distributions for foods and supplements
Discussion of assessment methods Individuals underreport intakes; greater for obese
Quality of composition data variable
Large day-to-day variations require large numbers of days or statistical adjust-ments to approximate usual intakes
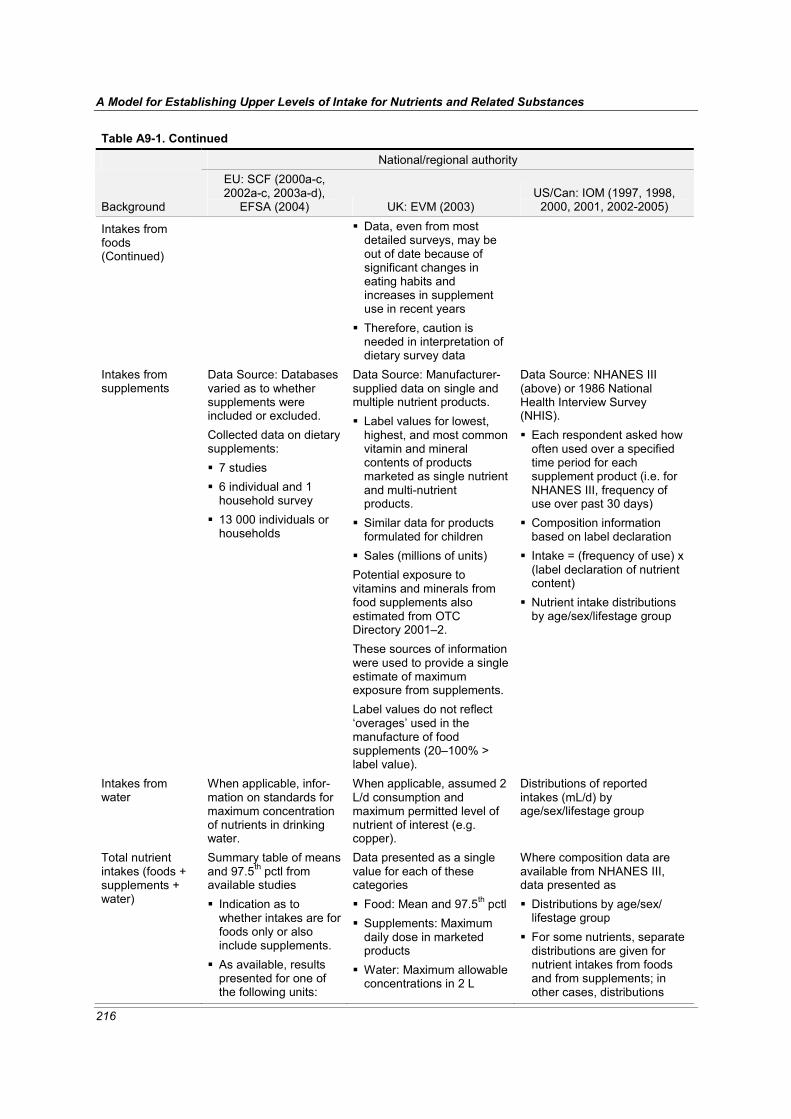
A Model for Establishing Upper Levels of Intake for Nutrients and Related Substances
216
Table A9-1. Continued
National/regional authority
Background
EU: SCF (2000a-c, 2002a-c, 2003a-d),
EFSA (2004) UK: EVM (2003) US/Can: IOM (1997, 1998,
2000, 2001, 2002-2005)
Intakes from foods (Continued)
Data, even from most detailed surveys, may be out of date because of significant changes in eating habits and increases in supplement use in recent years
Therefore, caution is needed in interpretation of dietary survey data
Intakes from supplements
Data Source: Databases varied as to whether supplements were included or excluded. Collected data on dietary supplements: 7 studies 6 individual and 1 household survey
13 000 individuals or households
Data Source: Manufacturer-supplied data on single and multiple nutrient products. Label values for lowest, highest, and most common vitamin and mineral contents of products marketed as single nutrient and multi-nutrient products.
Similar data for products formulated for children
Sales (millions of units) Potential exposure to vitamins and minerals from food supplements also estimated from OTC Directory 2001–2. These sources of information were used to provide a single estimate of maximum exposure from supplements. Label values do not reflect ‘overages’ used in the manufacture of food supplements (20–100% > label value).
Data Source: NHANES III (above) or 1986 National Health Interview Survey (NHIS). Each respondent asked how often used over a specified time period for each supplement product (i.e. for NHANES III, frequency of use over past 30 days)
Composition information based on label declaration
Intake = (frequency of use) x (label declaration of nutrient content)
Nutrient intake distributions by age/sex/lifestage group
Intakes from water
When applicable, infor-mation on standards for maximum concentration of nutrients in drinking water.
When applicable, assumed 2 L/d consumption and maximum permitted level of nutrient of interest (e.g. copper).
Distributions of reported intakes (mL/d) by age/sex/lifestage group
Total nutrient intakes (foods + supplements + water)
Summary table of means and 97.5th pctl from available studies Indication as to whether intakes are for foods only or also include supplements.
As available, results presented for one of the following units:
Data presented as a single value for each of these categories Food: Mean and 97.5th pctl Supplements: Maximum daily dose in marketed products
Water: Maximum allowable concentrations in 2 L
Where composition data are available from NHANES III, data presented as Distributions by age/sex/ lifestage group
For some nutrients, separate distributions are given for nutrient intakes from foods and from supplements; in other cases, distributions
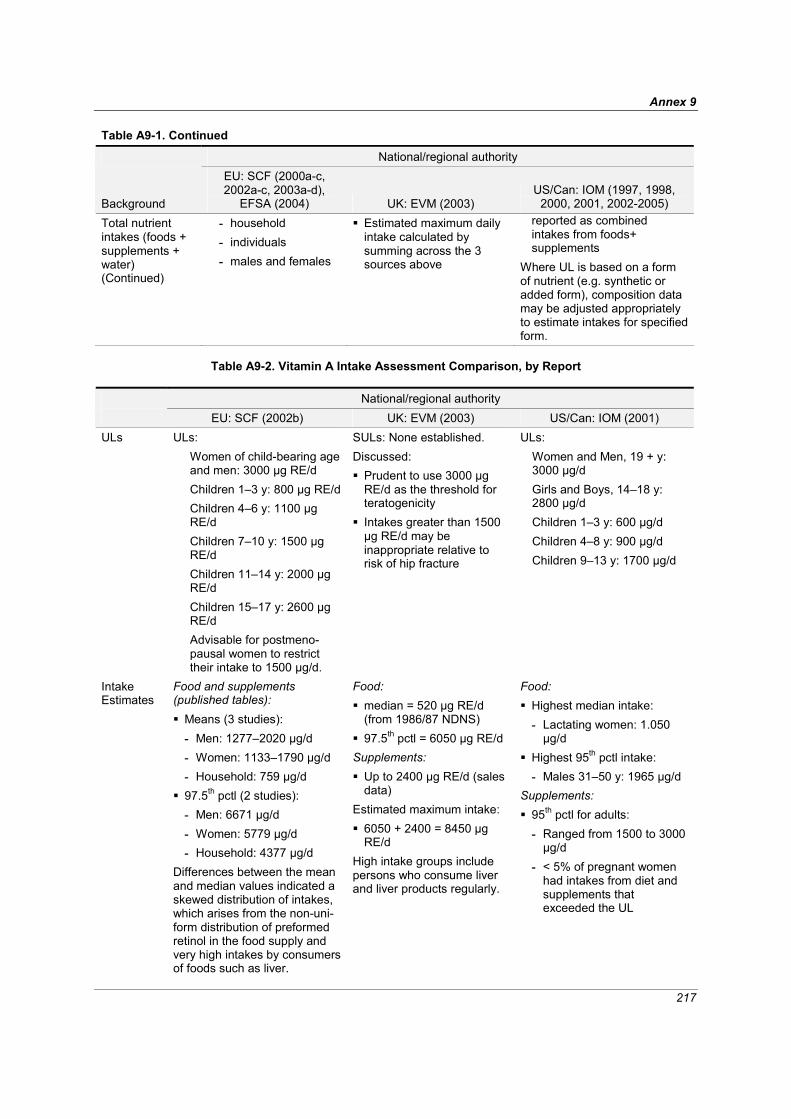
Annex 9
217
Table A9-1. Continued
National/regional authority
Background
EU: SCF (2000a-c, 2002a-c, 2003a-d),
EFSA (2004) UK: EVM (2003) US/Can: IOM (1997, 1998,
2000, 2001, 2002-2005) Total nutrient intakes (foods + supplements + water) (Continued)
- household - individuals - males and females
Estimated maximum daily intake calculated by summing across the 3 sources above
reported as combined intakes from foods+ supplements
Where UL is based on a form of nutrient (e.g. synthetic or added form), composition data may be adjusted appropriately to estimate intakes for specified form.
Table A9-2. Vitamin A Intake Assessment Comparison, by Report
National/regional authority EU: SCF (2002b) UK: EVM (2003) US/Can: IOM (2001) ULs ULs:
Women of child-bearing age and men: 3000 μg RE/d Children 1–3 y: 800 μg RE/d Children 4–6 y: 1100 μg RE/d Children 7–10 y: 1500 μg RE/d Children 11–14 y: 2000 μg RE/d Children 15–17 y: 2600 μg RE/d Advisable for postmeno-pausal women to restrict their intake to 1500 μg/d.
SULs: None established. Discussed: Prudent to use 3000 μg RE/d as the threshold for teratogenicity
Intakes greater than 1500 μg RE/d may be inappropriate relative to risk of hip fracture
ULs: Women and Men, 19 + y: 3000 μg/d Girls and Boys, 14–18 y: 2800 μg/d Children 1–3 y: 600 μg/d Children 4–8 y: 900 μg/d Children 9–13 y: 1700 μg/d
Intake Estimates
Food and supplements (published tables): Means (3 studies): - Men: 1277–2020 μg/d - Women: 1133–1790 μg/d - Household: 759 μg/d
97.5th pctl (2 studies): - Men: 6671 μg/d - Women: 5779 μg/d - Household: 4377 μg/d
Differences between the mean and median values indicated a skewed distribution of intakes, which arises from the non-uni-form distribution of preformed retinol in the food supply and very high intakes by consumers of foods such as liver.
Food: median = 520 μg RE/d (from 1986/87 NDNS)
97.5th pctl = 6050 μg RE/d Supplements: Up to 2400 μg RE/d (sales data)
Estimated maximum intake: 6050 + 2400 = 8450 μg RE/d
High intake groups include persons who consume liver and liver products regularly.
Food: Highest median intake: - Lactating women: 1.050 μg/d
Highest 95th pctl intake: - Males 31–50 y: 1965 μg/d
Supplements: 95th pctl for adults: - Ranged from 1500 to 3000 μg/d
- < 5% of pregnant women had intakes from diet and supplements that exceeded the UL

A Model for Establishing Upper Levels of Intake for Nutrients and Related Substances
218
Table A9-2. Continued
National/regional authority EU: SCF (2002b) UK: EVM (2003) US/Can: IOM (2001) Discussion (as risk characterization)
The 97.5th pctl intake for adults in most of Europe is greater than the UL of 3000 μg RE/d. Because alterations of embryogenesis may occur following a single or a small number of doses of vitamin A, for women of childbearing age the UL should be compared with intake estimates that reflect short-term, rather than long-term, exposure. Because current intakes may exceed the TUL, careful consideration should be given to the appropriateness of the enrichment of human foods with vitamin A, and to the potential effects on human exposure of the addition of vitamin A to animal feed.
(as discussion on Guidance Levels) Endorse current advice that women who are pregnant or who wish to become pregnant should not take dietary supplements containing vitamin A except on medical advice. High level consumers of liver and liver products and/or supplements may exceed intakes at which adverse effects have been reported. Dietary supplements may contain overages that are 20–100% more than label declaration. This may be particularly important given that the effect on fracture risk appears to be a graded response, with the risk of fracture increasing with increased intake.
(as risk characterization) The risk of exceeding the UL for vitamin A appears to be small based on the intakes cited above.
Table A9-3. Iron Intake Assessment Comparison, by Report
National/regional authority EU: EFSA (2004) UK: EVM (2003) US/Can: IOM (2001) ULs ULs: None provided
SULs: None established Guidance Level: A supplemental intake of approximately 17 mg/d (equivalent to 0.28 mg/kg/bw/d for a 60 kg adult) would not be expected to produce adverse effects in the majority of people.
This guidance level does not apply to the small proportion of the population who have increased susceptibility to iron overload.
ULs: Male & female ≥ 14 y: 45 mg/d Children 1–13 y: 40 mg/d
Intake Estimates
Food and supplements (published tables): Means (5 studies): - Males: 13–22 mg/d - Females: 12–18 mg/d - Household: 13 mg/d
Food: Mean = 12 mg/d 97.5th pctl = 24 mg/d (from 1986/7 NDNS)
Supplements: 20 mg/d (up to 60 mg/d for particular conditions, e.g.
Food and supplements (NHANES III): Highest intakes (excluding pregnant and lactating women):
Median: Men 31–50 y = 19 mg/d
90th pctl: Men ≥ 51 y = 34

Annex 9
219
Table A9-3. Continued
National/regional authority EU: EFSA (2004) UK: EVM (2003) US/Can: IOM (2001)
Intake Estimates (Con-tinued)
97.5th pctl (5 studies): - Males: 27–41 mg/d - Females: 27–72 mg/d - Household: 22 mg/d
pregnancy) (sales data) Water: 0.4 mg/d (assuming 2 L/d at U.K. limit of 0.2 mg/L)
Estimated maximum intake: 24 + 0.4 + 20 mg = 44 mg/d
mg/d Pregnant and lactating women:
50–75% of pregnant and lactating women consumed iron from food and supplements at a level greater than 45 mg/d, but iron supplement is usually supervised in pre- and postnatal care programs.
The 90th pctl intakes are below the UL of 45 mg/d.
Discussion (as risk characterization) Risk of adverse effects from high iron intake from food sources, including fortified foods in some countries, but excluding supplements, is considered to be low for the population as a whole. Intake from supplements in men and postmenopausal women may increase the proportion of the population likely to develop biochemical indicators of high iron stores. Up to 0.5% of the population) are homozygotes for hereditary haemochromatosis, who are susceptible to iron overload even at normal dietary iron intakes. Such individuals should avoid iron supplements and highly iron-fortified foods. The majority of homozygotes are not diagnosed or identified, and they are not aware of their greater susceptibility until sufficient iron has accumulated to produce adverse effects.
– (as risk characterization) The risk of adverse effects from dietary sources appears to be low. Individuals taking iron salts at a level above the UL may encounter g.i. side effects, especially when taken on an empty stomach. 25% of men aged 31–50 years in U.S.A. have ferritin concen-trations greater than 200 μg/L, which may be a risk factor for cardiovascular disease. This prevalence is higher in men older than 50 y. The signifi-cance of high ferritin concen-trations and their relationship to dietary iron intake is uncertain. Nevertheless, the association between a high iron intake and iron overload in sub-Saharan Africa makes it prudent to recommend that men and postmenopausal women avoid iron supplements and highly fortified foods.

A Model for Establishing Upper Levels of Intake for Nutrients and Related Substances
220
Table A9-4. Vitamin C Intake Assessment Comparison, by Report
National/regional authority EU: EFSA (2004) UK: EVM (2003) US/Can: IOM (2000) ULs ULs: None provided.
SULs: None established. Guidance Level: A supplemental level of 1000 mg/d would not be expected to have any significant adverse effects
A guidance level for total vitamin C has not been estimated since adverse effects appear to follow supplemental, bolus doses rather than intake of vitamin C from food
Higher levels of vitamin C may be without adverse effects in many individuals
ULs: Adults ≥ 19 y: 2000 mg/d Adolescents 14–18 y: 1800 mg/d Children 1–3 y: 400 mg/dChildren 4–8 y: 650 mg/dChildren 9–13 y: 1200 mg/d
Intake Estimates Food and supplements (published tables): Means (5 studies): - Men: 101–168
mg/d - Women: 108–169
mg/d - Household: 113
mg/d 97.5th pctl (5 studies): - Men: 309–1056
mg/d - Women: 285–
1117 mg/d - Household: 268
mg/d
Food: Mean = 64 mg/d 97.5th pctl = 160 mg/d (from 1986/7 NDNS)
Supplements: Up to 3000 mg/d (sales data)
Estimated maximum daily intake: 160 + 3000 = 3160 mg
Vegetarians are a potential high intake group.
Food and supplements: Highest mean intake: - Males 51–70 y and
females ≥ 51 y: about 200 mg/d
Highest 99th pctl intake: - Males 31–70 y and
females 51–70 y: > 1200 mg/d
Discussion (as risk characterization) These dietary intakes do not represent a cause for concern.
(as discussion on Guidance Levels) Potentially vulnerable groups include individuals who are heterozygous for haemochroma-tosis and thalassaemia or those with a predisposition to urinary or renal stones. Data on the possible adverse effects of vitamin C on these individuals are also conflicting, but appear to occur at intakes > 1 g/d.
(as risk characterization) The risk of adverse effects resulting from excess intake of vitamin C from food and supplements appears to be very low at the highest intakes.
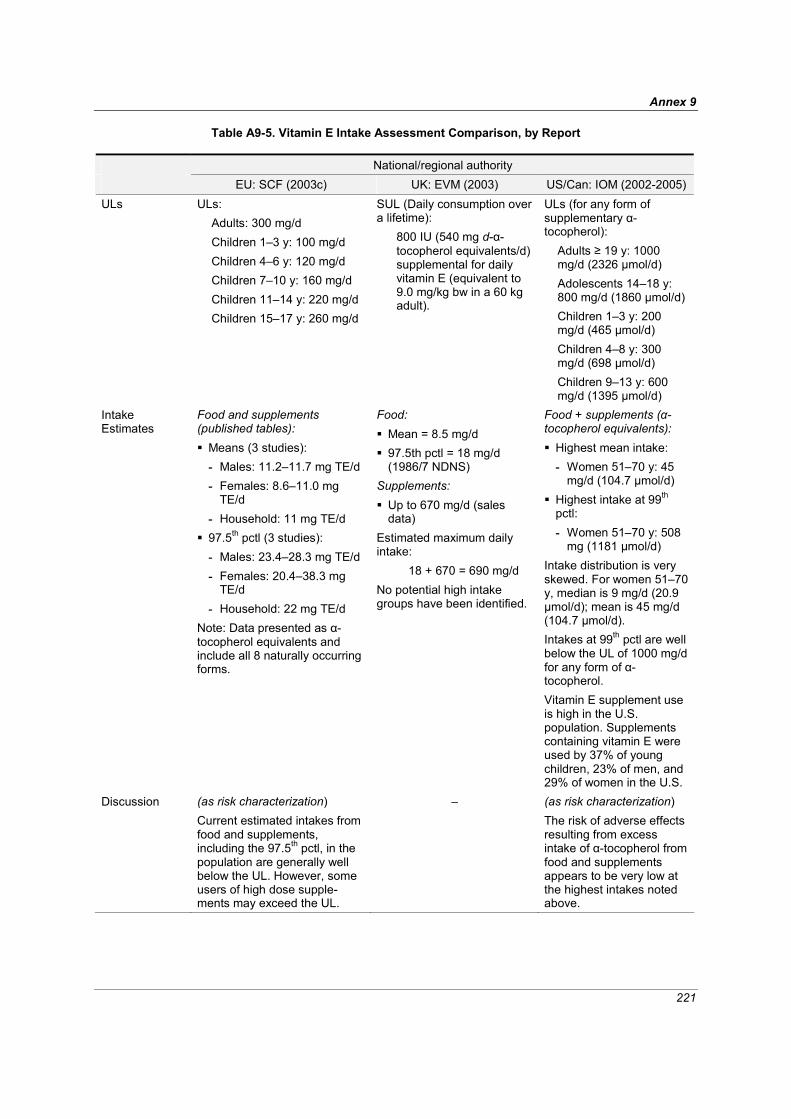
Annex 9
221
Table A9-5. Vitamin E Intake Assessment Comparison, by Report
National/regional authority EU: SCF (2003c) UK: EVM (2003) US/Can: IOM (2002-2005) ULs ULs:
Adults: 300 mg/d Children 1–3 y: 100 mg/d Children 4–6 y: 120 mg/d Children 7–10 y: 160 mg/d Children 11–14 y: 220 mg/d Children 15–17 y: 260 mg/d
SUL (Daily consumption over a lifetime):
800 IU (540 mg d-α-tocopherol equivalents/d) supplemental for daily vitamin E (equivalent to 9.0 mg/kg bw in a 60 kg adult).
ULs (for any form of supplementary α-tocopherol):
Adults ≥ 19 y: 1000 mg/d (2326 μmol/d) Adolescents 14–18 y: 800 mg/d (1860 μmol/d) Children 1–3 y: 200 mg/d (465 μmol/d) Children 4–8 y: 300 mg/d (698 μmol/d) Children 9–13 y: 600 mg/d (1395 μmol/d)
Intake Estimates
Food and supplements (published tables): Means (3 studies): - Males: 11.2–11.7 mg TE/d - Females: 8.6–11.0 mg
TE/d - Household: 11 mg TE/d
97.5th pctl (3 studies): - Males: 23.4–28.3 mg TE/d - Females: 20.4–38.3 mg
TE/d - Household: 22 mg TE/d
Note: Data presented as α-tocopherol equivalents and include all 8 naturally occurring forms.
Food: Mean = 8.5 mg/d 97.5th pctl = 18 mg/d (1986/7 NDNS)
Supplements: Up to 670 mg/d (sales data)
Estimated maximum daily intake:
18 + 670 = 690 mg/d No potential high intake groups have been identified.
Food + supplements (α-tocopherol equivalents): Highest mean intake: - Women 51–70 y: 45
mg/d (104.7 μmol/d) Highest intake at 99th pctl: - Women 51–70 y: 508
mg (1181 μmol/d) Intake distribution is very skewed. For women 51–70 y, median is 9 mg/d (20.9 μmol/d); mean is 45 mg/d (104.7 μmol/d). Intakes at 99th pctl are well below the UL of 1000 mg/d for any form of α-tocopherol. Vitamin E supplement use is high in the U.S. population. Supplements containing vitamin E were used by 37% of young children, 23% of men, and 29% of women in the U.S.
Discussion (as risk characterization) Current estimated intakes from food and supplements, including the 97.5th pctl, in the population are generally well below the UL. However, some users of high dose supple-ments may exceed the UL.
– (as risk characterization) The risk of adverse effects resulting from excess intake of α-tocopherol from food and supplements appears to be very low at the highest intakes noted above.

A Model for Establishing Upper Levels of Intake for Nutrients and Related Substances
222
Table A9-6. Selenium Intake Assessment Comparison, by Report
National/regional authority EU: SCF (2000b) UK: EVM (2003) US/Can: IOM (2000) ULs ULs:
Adults: 300 μg/d Children 1–3 y: 60 μg/d Children 4–6 y: 90 μg/d Children 7–10 y: 130 μg/d Children 11–14 y: 200 μg/d Children 15–17 y: 250 μg/d
SUL (Daily consumption over a lifetime):
0.45 mg total selenium/d
ULs: Persons ≥ 14 years: 400 μg/d (5.1 μmol) Children 1–3 y: 90 μg/d (1.1 μmol) Children 4–8 y: 150 μg/d (1.9 μmol) Children 9–13 y: 280 μg/d (3.6 μmol)
Intake Estimates
Food and supplements (?), mean intakes of non-vegetarian adults from various studies:
Belgium: 28–61 μg/d Denmark: 41–57 μg/d Finland: 100–110 μg/d France: 29–43 μg/d UK: 63 μg/d The Netherlands: 40–54 μg/d Norway: 28–89 μg/d Spain: 79 μg/d Sweden: 24–35 μg/d
The amount of selenium available in the soil for plant growth and corresponding variations in the intake of selenium by humans varies considerably among regions and countries.
Food: Mean = 0.039 mg/d 97.5th pctl = 0.1 mg/d (1994 TDS)
Supplements: Up to 0.3 mg/d (sales data)
Estimated maximum intake:
0.1 + 0.3 = 0.4 mg/d No potential high intake groups have been identified.
Food: Dietary selenium intake in a high-selenium area: 68–724 μg/d (0.9–9.2 μmol).
About half the subjects were consuming more than 200 μg/d (2.5 μmol) with no evidence of selenosis.
Supplements: Available in many doses but usually under 100 μg/dose (1.3 μmol).
Water: Water selenium content is usually trivial compared to food selenium content. However, irrigation runoff water has been shown to contain significant amounts of selenium when the soil irrigated contains large amounts of the element.
The extensive food distribution system in Canada and the U.S. ensures that individuals do not eat foods that originate solely from one locality. This moderates the selenium content of diets, even in high-selenium areas.

Annex 9
223
Table A9-6. Continued
National/regional authority EU: SCF (2000b) UK: EVM (2003) US/Can: IOM (2000) Discussion (as risk characterization)
In most European countries, mean intakes are in the range of 30–90 μg/d. Norway has a somewhat higher mean intake (60 μg/d) due to import of wheat rich in selenium. Finland has an intake of 100–110 μg/d because of selenium fertilization. The margin between the present mean intake, excluding supple-ments, in the European popu-lation and a UL (adult) of 300 μg/d would be between 2.7 and 10. The 97.5th pctl intake was 81 and 90 μg Se/d in Italy and The Netherlands, respectively, giving a margin to the UL of about 2.7.
(as discussion on SUL) Assuming a maximum intake of 0.1 mg/d from food, a margin of 0.35 mg/d selenium is available for supplementation or other additional intake.
(as risk characterization) The risk of selenium intake above the UL for the U.S.A. and Canada appears to be small. There have been no cases of selenosis in the high-selenium regions. Although intakes above the UL indicate an increased level of risk, these intakes—if below the LOAEL—would be unlikely to result in observable clinical disease. This is especially true in a population that could self-select for high intakes, so that people who might experience symptoms could alter their diets or move.

A Model for Establishing Upper Levels of Intake for Nutrients and Related Substances
224
Table A9-7. Zinc Intake Assessment Comparison, by Report
National/regional authority EU: SCF (2003d) UK: EVM (2003) US/Can: IOM (2001) ULs ULs:
Adults: 25 mg/d Children 1–3 y: 7 mg/d Children 4–6 y: 10 mg/d Children 7–10 y: 13 mg/d Children 11–14 y: 18 mg/d Children 15–17 y: 22 mg/d
SUL (Daily consumption over a lifetime):
25 mg zinc/d for supplemental zinc
ULs: Adults ≥ 19 y: 40 mg/d Adolescents 14–18 y: 34 mg/d Children 1–3 y: 7 mg/d Children 4–8 y: 12 mg/d Children 9–13 y: 23 mg/d
Intake Estimates
Food and supplements (published tables): Means (3 studies): - Males: 10.8–11.4 mg/d - Females: 7.5–8.4 mg/d - Households: 11 mg/d
97.5th pctl (3 studies): - Males: 19.0–23.5 mg/d - Females: 13.6–22.1
mg/d - Households: 19.0 mg/d
Water: Concentrations of zinc in tap water may be elevated as a result of dissolution of pipes and contaminated wells may lead to high exposure. Drinking water quality standards for European countries provide a zinc content of not more than 5 mg/L. Other exposures: Inhalation of zinc metal or oxide fumes in industrial settings and storage of food and drink in galvanized containers.
Food: Mean = 9.8 mg/d 97.5th pctl = 17 mg/d (from 1986/87 NDNS)
Supplements: Up to 50 mg/d (sales data)
Water: Up to 10 mg/d (assuming 2 L/d consumption at maximum UK concentration of 5 mg/L)
Estimated maximum intake: 17 + 10 + 50 = 77 mg/d
No potential high intake groups were identified.
Food: Highest 95th pctl intake: - Adults = 25 mg/d
Supplements: In 1986, approximately 17% of women and 15% of men consumed supplements that contained zinc.
Intakes from food and supplements: Highest 95th pctl intake: - Adult men and non-
pregnant women = 25–32 mg/d
- For pregnant and lactating women, approximately 43 mg/d
Note: Although not presented in the IOM report, the intake estimates for zinc from food + supplements at the 95th pctl are as follows: children 1–3 y, 12.9 mg/d; children 4–8 y, 14.2 mg/d; boys 9–13 y, 17.3 mg/d; girls 9–13 y, 14.5 mg/d; and girls 14–18 y, 15.5 mg/d. All of these values exceed the UL for their respective age/sex groups.
Discussion (as risk characterization) The available studies show that the 97.5th pctl of total zinc intakes for all age groups are close to the ULs, which, in the view of the Committee, are not a matter of concern.
(as discussion on SUL) Assuming a maximum intake of 17 mg/d from food, a total intake of 42 mg/d would not be expected to result in any adverse effects.
(as risk characterization) The risk of adverse effects resulting from excess zinc intake from food and supplements appears to be low at the highest intakes. High intakes of zinc are due to the use of supplements, especially during lactation and pregnancy.

Annex 9
225
Table A9-8. Vitamin B6 Intake Assessment Comparison, by Report
National/regional authority EU: SCF (2000c) UK: EVM (2003) US/Can: IOM (1998) ULs ULs:
Adults: 25 mg/d Children 1–3 y: 5 mg/d Children 4– 6 y: 7 mg/d Children 7–10 y: 10 mg/d Children 11–4 y: 15 mg/d Children 15–7 y: 20 mg/d
SUL (Daily consumption over a lifetime):
10 mg/d supplemental vitamin B6 for 60 kg adult (0.17 mg/kg bw/d supplemental pyridoxine)
ULs (as pyridoxine): ≥ 19 y: 100 mg/d Adolescents 14–18 y: 80 mg/d Children 1–3 y: 30 mg/d Children 4–8 y: 40 mg/d Children 9–13 years: 60 mg/d
Intake Estimates
Food and supplements (published tables): Means (3 studies): - Men: 2.68–3.5 mg/d - Women: 2.84–3.6 mg/d - Households: 2.0 mg/d
97.5th pctl (3 studies): - Men: 5.35–7.6 mg/d - Women: 10.46–30.3
mg/d - Households: 3.3 mg/d
The Dietary and Nutritional Survey of British Adults (1990) (n > 2000): The majority of the intake by men was from food sources
Supplements represented about 50% of total intake for women > 24 y
Use of supplements by some women resulted in a skewed distribution with the highest 97.5th pctl intake = 16 mg/d in women aged 35–49 y
Food: Mean = 2.0 mg/d 97.5th pctl = 3.9 mg/d (NDNS, 1986/7)
Supplements: Up to 100 mg/d
Estimated maximum daily exposure:
3.9 + 100 = 104 mg No potential high intake groups have been identified.
Food and supplements: Highest mean intake: - Pregnant females 14–55
y = 9 mg/d Highest 95th pctl: - Pregnant females 14–55
y = 21 mg/d (most of which is pyridoxine from supplements)
Vitamin B6 is available over the counter in many dosages ranging up to 100 mg or more.

A Model for Establishing Upper Levels of Intake for Nutrients and Related Substances
226
Table A9-8. Continued
National/regional authority EU: SCF (2000c) UK: EVM (2003) US/Can: IOM (1998) Discussion (as risk characterization)
No safety concerns in relation to vitamin B6 from foods. Intakes from foods and supplements are generally <UL. However, recent data from Ireland indicate that, while the 95th pctl intake of 18- to 64-y-old women is 8 mg day, the intakes of 2.5% of this population group exceed the UL of 25 mg (range of intake of 30–62 mg/d) due to supplement use. Some supplements contain amounts per tablet/capsule that are considerably > UL.
(as discussion of SUL) In humans, a supplementary dose of 10 mg/d represents a clear SUL with no adverse effects being anticipated over a lifetime’s exposure. Doses of 200 mg/d or more taken for long periods are associated with reports of neuropathy in some human subjects. The effect of taking vitamin B6 at doses between 10 and 200 mg is unclear. The risk posed by such exposure in the short term may be negligible, but the available data do not allow identification of a dose or duration of exposure above the SUL that would be of negligible risk.
(as risk characterization) The risk of adverse effects from excess intake of vitamin B6 from food and supple-ments appears to be very low at the highest intakes noted above. Increased risks are likely to result from large intakes of pyridoxine used to treat various conditions. The UL is not meant to apply to individuals who are being treated with pyridoxine under close medical supervision.

Annex 9
227
Table A9-9. Copper Intake Assessment Comparison, by Report
National/regional authority EU: SCF (2003b) UK: EVM (2003) US/Can: IOM (2001) ULs ULs:
Adults: 5 mg/d Children 1–3 y: 1 mg/d Children 4–6 y: 2 mg/d Children 7–10 y: 3 mg/d Children 11–14 y: 4 mg/d Children 15–17 y: 4 mg/d
SUL (Daily consumption over a lifetime):
0.16 mg/kg bw/d (equivalent to 10 mg/d in a 60 kg adult)
ULs: Adults ≥ 19 y: 10 mg/d (10 000 μg/d) Adolescents 14–18 y: 8000 μg/d Children 1–3 y: 1000 μg/d Children 4–8 y: 3000 μg/d Children 9–13 y: 5000 μg/d
Intake Estimates
Food and supplements (published tables): Means (3 studies): - Males: 1.5–1.6 mg/d - Females: 1.2 mg/d - Households: 1.4 mg/d
97.5th pctl (3 studies): - Males: 3.1–3.5 mg/d - Females: 2.7–2.8 mg/d - Households: 2.8 mg/d
Water: Copper piping used for water distribution can add 0.1 mg/day to intakes in hard water areas but 10 times this amount in acid and soft water conditions. The current EU standard is 2 mg/L for maximum concentration of copper in drinking water.
Other exposures: Emissions from mines, smelters and foundries, burning of coal for power generation from municipal waste incinerators.
Food: Mean = 1.4 mg/d 97.5th pctl = 3.0 mg/d (NDNS, 1986/7)
Supplements: Up to 2 mg/d (OTC 2001; sales data)
Drinking water: Up to 6 mg/d (assuming 2 L/d consumption and the maximum permitted water copper concentration of 3 mg/L)
Estimated maximum daily intake:
3.0 + 2 + 6 = 11 mg/d No potential high intake groups have been identified.
Food and supplements: Highest median intakes: - Males 1–50 y = 1700 μg/d - Males 51–70 y = 1600 μg/d - Pregnant/lactating women
= 1600 μg/d Highest 99th pctl: - Lactating females = 4700 μg/d
- Pregnant females and males 51–70 y = 4600 μg/d
Water: Drinking water with copper at the EPA Maximum Goal would contribute 2600 μg/d copper in adults and 1000 μg in 1- to 4-y-old old children.
EPA data indicate 98% of flushed drinking water samples had copper levels < 460 μg/L.
Most of the US population receives < 100–900 μg/d of copper from drinking water.
Adverse health effects depend on the species of copper in the media of concern, its degree of ionization, and its bioavailabil-ity.
Discussion (as risk characterization) The 97.5th pctl of total copper intakes for all age groups are close to the ULs which, in the view of the Committee, are not a matter of concern. Additional copper intakes from drinking water may be appreciable and may need to be taken into account.
(as discussion on SUL) Individuals in the UK could theoretically consume in excess of 6 mg/d copper from water alone if consumed at the statutory limit. However, copper levels in UK drinking water are much lower so this level of exposure is unlikely to occur. There is no evidence that copper intakes in water in the UK present any risk to health.
(as risk characterization) The risk of adverse effects from excess intake of copper from food, water, and supplements appears to be very low in adults at the highest intakes. A small % of children 1–8 y is likely to exceed the UL for their age group.

A Model for Establishing Upper Levels of Intake for Nutrients and Related Substances
228
Table A9-10. Vitamin D Intake Assessment Comparison, by Report
National/regional authority EU: SCF (2002c) UK: EVM (2003) US/Can: IOM (1997) ULs
ULs: Adults: 50 μg/d Children 0–10 y: 25 μg/d Children 11–17 y: 50 μg/d
SULs: None established. Guidance Level:
A level of 0.025 mg/d supplementary vitamin D would not be expected to cause adverse effects in the general population. This is equivalent to 0.0004 mg/kg bw/d for a 60 kg adult.
ULs: Persons ≥ 1 y: 50 μg (2000 IU)/d
Intake Estimates
Food and supplements (published tables): Means (4 studies): - Males: 3.7–11.2 μg/d - Females: 3.1–10.3 μg/d
- Household: 3.0 μg/d 97.5th pctl (4 studies): - Males: 12.7–37.6 μg/d - Females: 12.6–33.3 μg/d
- Households: 8.4 μg/d The main reasons for the relatively good vitamin D status in the Scandinavian countries are probably fortification of food and a higher percentage of persons taking vitamin D supplements.
Food: Mean = 0.003 mg/d 97.5th pctl = 0.009 mg/d (NDNS, 1986/7)
Supplement: Up to 0.0125 mg (manufacturer; OTC 2001)
Estimated maximum intake: 0.009 + 0.0125 = 0.022 mg/d
No potential high intake groups have been identified.
Food: Vitamin D content of unsupplemented diets is low, averaging about 2.5 μg (100 IU)/d for women.
Diets high in fish are considerably higher in vitamin D.
Because milk is fortified to contain 10 μg (400 IU)/quart, persons with high milk intakes have relatively high vitamin D intakes.
Supplements: A 1986 survey estimated that the 95th pctl of supplement intake by users of vitamin D supplements was 20 μg/d (800 IU) for men and 17.2 μg/d (686 IU) for women.
The endogenous formation of vitamin D3 from sunlight irradiation of skin has never been implicated in vitamin intoxication.
Discussion (as risk characterization) In Norway, the 95th pctl intake with supplements is about 1.5 x less than the UL. The 97.5th pctl values with supplements are 8.4, 12.7, 14.3 and 22.16 μg/d in Italy, United Kingdom, Ireland, and Austria, respectively. These values are well below the UL.
(as discussion on Guidance Level) Because of the difficulties in assessing total vitamin D exposure, an estimate for total intake has not been provided. Such an intake, or more, might well be required under medical supervision in managing overt or occult deficiency states.
(as risk characterization) For most people, vitamin D intake from food and supplements is unlikely to exceed the UL. However, persons who are at the upper end of the ranges for both sources of intake, particularly persons who use many supplements and those with high intakes of fish or fortified milk, may be at risk for vitamin D toxicity.

Annex 9
229
Table A9-11. Calcium Intake Assessment Comparison, by Report
National/regional authority EU: SCF (2003a) UK: EVM (2003) US/Can: IOM (1997) ULs ULs:
Adults: 2500 mg/d
ULs: None established. Guidance Level: Doses up to 1500 mg/d supplemen-tal calcium would not be expected to result in any adverse effect, but higher doses could result in adverse gastrointestinal effects in some persons
An estimate for total calcium intakes has not been made as the effect is related to calcium in supplemental doses
ULs: Adults ≥19: 2500 mg/d (62.5 mmol/d) Children 1–18 y: 2500 mg/d (62.5 mmol/d)
Intake Estimates
Food and supplements (published tables): Means (2 studies): - Males: 940–949
mg/d - Females: 730–
742 mg/d 97.5th pctl: - Males: 1607–
1657 mg/d - Females: 1317–
1340 mg/d
Food: Mean = 830 mg/d (1990 NDNS) 97.5th pctl = 1500 mg/d
Supplements: Up to 2400 (3 x 800) mg/d (OTC, 2001)
Water: Up to 600 mg (assuming 2 L/d consumption at 300 mg/L)
Estimated maximum intake: 1500 + 600 + 2400 = 4500 mg/d
Food: Highest median intake in 1994 CSFII: - Males 14-18 y = 1094 mg/d
(27.4 mmol) Highest 95th pctl intake for any age group: - Males 14–18 y with an
intake of 2039 mg/d (51 mmol/d)
Supplements: Calcium supplements were used by < 8% of young children, 14% of men, and 25% of women in the US (1986).
Daily dosages from supplements at the 95th pctl were relatively small for children (160 mg; 4 mmol), larger for men (624 mg; 15.6 mmol/d), and largest for women (904 mg; 22.6 mmol)/d

A Model for Establishing Upper Levels of Intake for Nutrients and Related Substances
230
Table A9-11. Continued
National/regional authority EU: SCF (2003a) UK: EVM (2003) US/Can: IOM (1997) Discussion (as risk
characterization) Data from European populations indicate that the intakes of calcium from all sources in adolescents and adults can be close to the UL in a small percentage of the population, especially in those taking supplements. Although there are no data to set a numeri-cal UL for children and adolescents, no appreciable risk has been identified even with current extreme levels of calcium intake in this age group.
– (as risk characterization) Although the 95th pctl of daily intake did not exceed the UL for any age group, persons with very high caloric intake, especially if intakes of dairy products are also high, may exceed the UL of 2500 mg/d. The 95th pctl intake from foods and supplements added together for teen-age boys (1920 + 928 mg/d), or for teenage girls (1236 + 1200 mg/d) are at or slightly above the UL. Users of dietary supplements tend to also have higher intakes of calcium from food than nonusers, but it is unlikely that the same person would fall at the upper end of both ranges. The prevalence of usual intakes (from foods + supple-ments) > UL is < 5% but recently calcium-fortified foods in marketplace have doubled; important to monitor their impact on calcium intake.

Annex 9
231
Table A9-12. Folic Acid Intake Assessment Comparison, by Report
National/regional authority EC: SCF (2000a) UK: EVM (2003) US/Can: IOM (1998) ULs ULs (as folic acid):
Adults: 1 mg/d Children 1–3 y: 200 μg/d Children 4–6 y: 300 μg/d Children 7–10 y: 400 μg/d Children 11–14 y: 600 μg/d Children 15–17 y: 800 μg/d
SULs: None established. Guidance Level:
A supplemental dose of 1 mg/d would not be expected to cause adverse effects.
ULs (from fortified food or supplements):
Adults ≥ 19 y: 1000 μg/d Adolescents 14–18 y: 800 μg/d Children 1–3 y: 300 μg/d Children 4–8 y: 400 μg/d Children 9–13 y: 600 μg/d
Intake Estimates
Food and supplements (used 5 studies): Means: - Males: 255–332 μg/d - Females: 210–260 μg/d - Males and females: 251–
398 μg/d High intake (97.5th pctl): - Males: 662 μg/d - Females: 638 μg/d - Males and females: 412–
1795 μg/d Note: No information as to whether supplements were included or excluded
No information on dietary methodology used
Food: Mean = 0.26 mg/d (1986/7 NDNS)
97.5th pctl = 0.49 mg/d Supplements: Up to 0.50 mg in over-the counter supplements for males (OTC, 2001)
Up to 0.80 mg in over-the-counter supplements for females (sales data)
Estimated maximum intake: 0.99 mg/d for males 1.29 mg/d for females
No potential high intake groups have been identified.
Food (included fortified ready-to-eat cereals): Highest 95th pctl: Females 30–50 y = 438 μg/d
Food and supplements (excluding pregnant women for whom folate supplements are prescribed): Highest 95th pctl: Females 30–50 y = 983 μg/d
Intake assessment–USA: It is not possible to determine intakes of folic acid only. Survey data do not distinguish between food folate and folic acid added as a fortificant or taken as a supplement. Intake assessment–Canada: The contribution of ready-to-eat cereals is expected to be lower because the maximum amount of folic acid that can be added to breakfast cereal is 60 μg/100 g
It is possible to exceed the UL of 1000 μg/d of folic acid by ingesting fortified foods or supplements, or both

A Model for Establishing Upper Levels of Intake for Nutrients and Related Substances
232
Table A9-12. Continued
National/regional authority EC: SCF (2000a) UK: EVM (2003) US/Can: IOM (1998) Discussion (as risk characterization)
97.5th pctl intakes for folate from dietary sources around 500 μg/d have been reported, the higher data for Austria are likely from all sources, including supplements. Data for the 2nd Dutch National Food Consumption Survey on supplement use indicated that 97.5th pctl and maximum intake are 400 and 800 μg, respec-tively. Regular supplements on the market usually contain 400–500 μg folic acid. In some European countries (e.g. the United Kingdom), cereals and breads are fortified with folic acid contributing 25–100 μg per serving. Subjects at risk for too high folic acid supplementation are those with an undiagnosed vitamin B12 deficiency and other conditions associated with cobalamin malabsorption. Figures on prevalence of pernicious anaemia in W-Europe vary between 1.2 and 1.98/1000. Recent data show a high prevalence (ca 25%) of marginal cobalamin deficiency in elderly but not or hardly associated with haematological abnormalities.
(as discussion on Guidance Level) A general consistency of data indicates that supplementation with ≤ 1 mg/d folic acid does not mask vitamin B12-associated anaemia in the majority of patients, whereas supplementation with ≥ 5 mg/d does. The effects of doses between 1 and 5 mg/d are unclear.
(as risk characterization) In the USA, the intake of folate is currently higher than indicated because enriched cereal grains in the U.S. food supply, to which no folate was added previously, are now fortified with folate. The FDA estimated that the 95th pctl of folate intakes for males aged 11 to 18 years would be 950 μg of total folate at this level of fortification; this value assumes these young males would also take supplements containing 400 μg of folate (REF). The 95th pctl for all other groups (excluding pregnant women) would be lower, and folic acid intake would be lower still. Using a different method of analysis, FDA estimated that those who follow the Food Guide Pyramid and consume cereal grains at the upper end of the recommended range would obtain an additional 440 μg of folate under fortification regulations. Those who eat other fortified foods (cookies, crackers) might ingest a comparable amount of folic acid. By either method of analysis and assuming regular use of a supplement that contains 400 μg of folate, it is unlikely that intake of added folate would regularly exceed 1000 μg for any group.

Annex 9
233
Table A9-13. Iodine Intake Assessment Comparison, by Report
National/regional authority EU: SCF (2002a) UK: EVM (2003) US/Can: IOM (2001) ULs ULs:
Adults: 600 μg/d Children 1–3 y: 200 μg/d Children 4–6 y: 250 μg/d Children 7–10 y: 300 μg/d Children 11–14 y: 450 μg/d Children 15–17 y: 500 μg/d
SULs: None established. Guidance Levels:
A supplemental intake of 0.5 mg/d in addition to the iodine in the diet (equivalent to 0.003 mg/kg bw in a 60 kg adult) would not be expected to have any significant adverse effects in adults.
ULs: Adults ≥ 19 y: 1100 μg/d Adolescents 14–18 y: 900 μg/d Children 1–3 y: 200 μg/d Children 4–8 y: 300 μg/d Children 9–13 y: 600 μg/d
Intake Estimates
Germany, Mean intakes of supplement users: - Males: 124 μg I/d - Females: 102 μg I/d
Great Britain, 97.5th pctl intakes from all sources: - Males: 434 μg/d - Females: 359 μg/d - Young children aged 1½
–4½ y (high milk consumers in winter): 247–309 μg/d
Data suggest that some pre-school children are likely to have intakes exceeding the JECFA/PMTDI.
Food: Mean = 0.22 mg/d (1986/7 NDNS)
97.5th pctl = 0.43 mg/d Supplements: Up to 0.49 mg/d (sales data)
Water: <0.03 mg/d (estimated intake from 2 L water containing < 0.015 g/L)
Estimated maximum intake: 0.43 + 0.03 + 0.49 = 0.95 mg/d
Children are a potential high intake group, because iodine intakes in children are higher than those in adults due to higher milk consumption.
Normal diets are unlikely to supply more than 1 mg/day
Intake of 10 g of 0.0001% iodized salt results in an intake of 770 μg/d
Based on the Total Diet Study, the highest intake of dietary iodine for any group at the 95th pctl was 1 mg/d, which is equivalent to the UL for adults
The iodine intake from the diet and supplements at the 95th pctl is approx-imately 1.15 mg/d, which is slightly higher than the UL
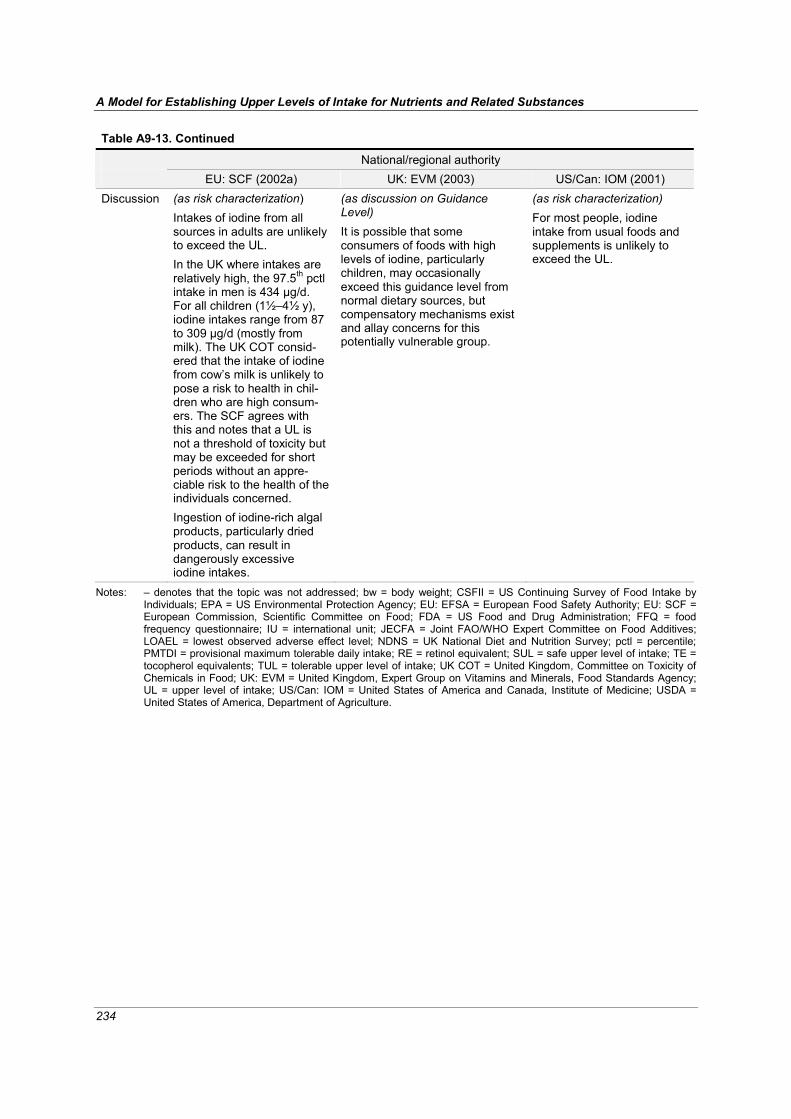
A Model for Establishing Upper Levels of Intake for Nutrients and Related Substances
234
Table A9-13. Continued
National/regional authority EU: SCF (2002a) UK: EVM (2003) US/Can: IOM (2001) Discussion (as risk characterization)
Intakes of iodine from all sources in adults are unlikely to exceed the UL. In the UK where intakes are relatively high, the 97.5th pctl intake in men is 434 μg/d. For all children (1½–4½ y), iodine intakes range from 87 to 309 μg/d (mostly from milk). The UK COT consid-ered that the intake of iodine from cow’s milk is unlikely to pose a risk to health in chil-dren who are high consum-ers. The SCF agrees with this and notes that a UL is not a threshold of toxicity but may be exceeded for short periods without an appre-ciable risk to the health of the individuals concerned. Ingestion of iodine-rich algal products, particularly dried products, can result in dangerously excessive iodine intakes.
(as discussion on Guidance Level) It is possible that some consumers of foods with high levels of iodine, particularly children, may occasionally exceed this guidance level from normal dietary sources, but compensatory mechanisms exist and allay concerns for this potentially vulnerable group.
(as risk characterization) For most people, iodine intake from usual foods and supplements is unlikely to exceed the UL.
Notes: – denotes that the topic was not addressed; bw = body weight; CSFII = US Continuing Survey of Food Intake by Individuals; EPA = US Environmental Protection Agency; EU: EFSA = European Food Safety Authority; EU: SCF = European Commission, Scientific Committee on Food; FDA = US Food and Drug Administration; FFQ = food frequency questionnaire; IU = international unit; JECFA = Joint FAO/WHO Expert Committee on Food Additives; LOAEL = lowest observed adverse effect level; NDNS = UK National Diet and Nutrition Survey; pctl = percentile; PMTDI = provisional maximum tolerable daily intake; RE = retinol equivalent; SUL = safe upper level of intake; TE = tocopherol equivalents; TUL = tolerable upper level of intake; UK COT = United Kingdom, Committee on Toxicity of Chemicals in Food; UK: EVM = United Kingdom, Expert Group on Vitamins and Minerals, Food Standards Agency; UL = upper level of intake; US/Can: IOM = United States of America and Canada, Institute of Medicine; USDA = United States of America, Department of Agriculture.

Annex 9
235
References EFSA (European Food Safety Authority) (2004). Opinion of the Scientific Panel on Dietetic Products,
Nutrition and Allergies on a request from the Commission Related to the Tolerable Upper Intake Level of Iron. The EFSA Journal, 125:1-34.
EVM (Expert Group on Vitamins and Minerals) (2003). Safe upper levels for vitamins and minerals. London, Food Standards Agency Publications (http://www.food.gov.uk/multimedia/pdfs/vitmin2003.pdf, accessed 1 May 2005).
IOM (Institute of Medicine) (1997). Dietary Reference Intakes for calcium, phosphorus, magnesium, vitamin D, and fluoride. Washington, DC, National Academy Press.
IOM (1998). Dietary Reference Intakes for thiamin, riboflavin, niacin, vitamin B6, folate, vitamin B12, pantothenic acid, biotin, and choline. Washington, DC, National Academy Press.
IOM (2000). Dietary Reference Intakes for vitamin C, vitamin E, selenium, and carotenoids. Washington, DC, National Academy Press.
IOM (2001). Dietary Reference Intakes for vitamin A, vitamin K, arsenic, boron, chromium, copper, iodine, iron, manganese, molybdenum, nickel, silicon, vanadium, and zinc. Washington, DC, National Academy Press.
IOM (2002-2005). Dietary Reference Intakes for energy, carbohydrate, fiber, fat, fatty acids, cholesterol, protein, and amino acids. Washington, DC, The National Academies Press.
SCF (Scientific Committee on Food) (2000a). Opinion of the Scientific Committee on Food on the tolerable upper intake level of folate (SCF/CS/NUT/UPPLEV/18 Final), European Commission (http://europa.eu.int/comm/food/fs/sc/scf/out80e_en.pdf, accessed 1 May 2005).
SCF (2000b). Opinion of the Scientific Committee on Food on the tolerable upper intake level of selenium (SCF/CS/NUT/UPPLEV/25 Final), European Commission (http://europa.eu.int/comm/food/fs/sc/scf/out80g_en.pdf, accessed 1 May 2005).
SCF (2000c). Opinion of the Scientific Committee on Food on the tolerable upper intake level of vitamin B6 (SCF/CS/NUT/UPPLEV/16 Final), European Commission (http://europa.eu.int/comm/food/fs/sc/scf/out80c_en.pdf, accessed 1 May 2005).
SCF (2002a). Opinion of the Scientific Committee on Food on the tolerable upper intake level of iodine (SCF/CS/NUT/UPPLEV/26 Final), European Commission (http://europa.eu.int/comm/food/fs/sc/scf/out146_en.pdf, accessed 1 May 2005)
SCF (2002b). Opinion of the Scientific Committee on Food on the tolerable upper intake level of preformed vitamin A (retinol and retinyl esters) (SCF/CS/NUT/UPPLEV/24 Final), European Commission (http://europa.eu.int/comm/food/fs/sc/scf/out80g_en.pdf, accessed 1 May 2005).
SCF (2002c). Opinion of the Scientific Committee on Food on the tolerable upper intake level of vitamin D (SCF/CS/NUT/UPPLEV/38 Final), European Commission (http://europa.eu.int/comm/food/fs/sc/scf/out157_en.pdf, accessed 1 May 2005).
SCF (2003a). Opinion of the Scientific Committee on Food on the tolerable upper intake level of calcium (SCF/CS/NUT/UPPLEV/64 Final), European Commission (http://europa.eu.int/comm/food/fs/sc/scf/out194_en.pdf, accessed 1 May 2005).
SCF (2003b). Opinion of the Scientific Committee on Food on the tolerable upper intake level of copper (SCF/CS/NUT/UPPLEV/57 Final), European Commission (http://europa.eu.int/comm/food/fs/sc/scf/out176_en.pdf, accessed 1 May 2005).
SCF (2003c). Opinion of the Scientific Committee on Food on the tolerable upper intake level of vitamin E (SCF/CS/NUT/UPPLEV/31 Final), European Commission (http://europa.eu.int/comm/food/fs/sc/scf/out195_en.pdf, accessed 1 May 2005).
SCF (2003d). Opinion of the Scientific Committee on Food on the tolerable upper intake level of zinc (SCF/CS/NUT/UPPLEV/62 Final), European Commission (http://europa.eu.int/comm/food/fs/sc/scf/out177_en.pdf, accessed 1 May 2005).
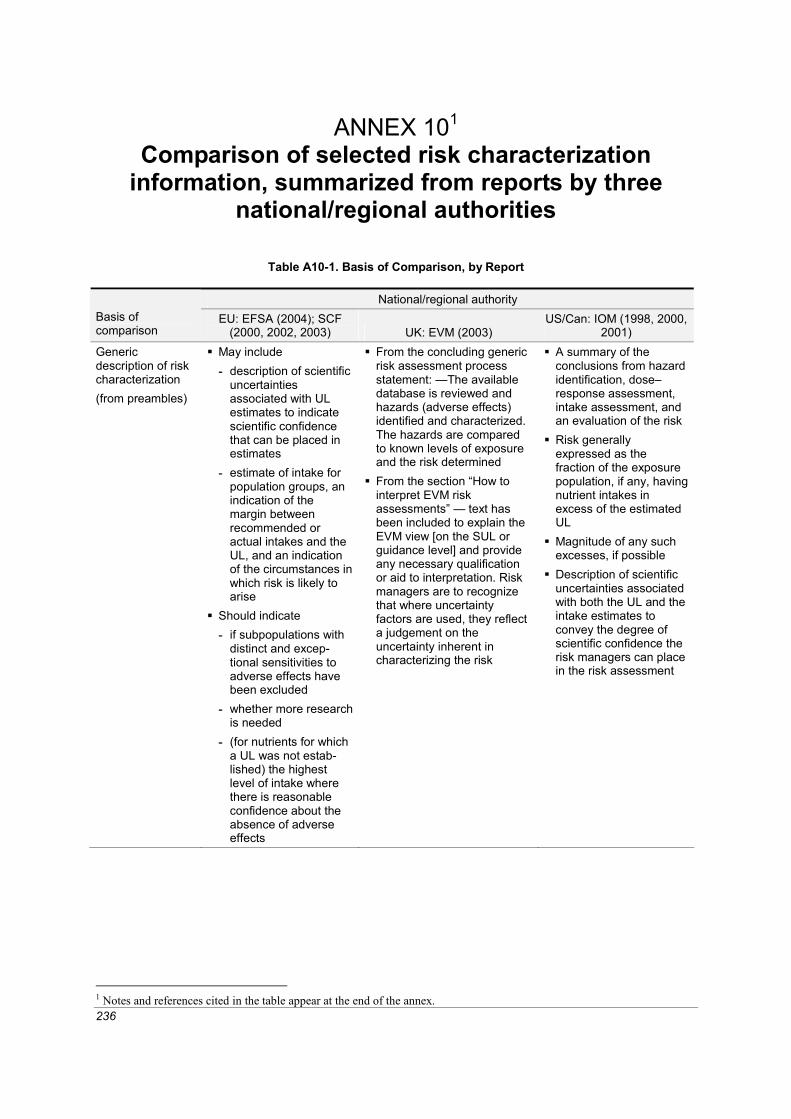
236
ANNEX 101 Comparison of selected risk characterization
information, summarized from reports by three national/regional authorities
Table A10-1. Basis of Comparison, by Report
National/regional authority Basis of comparison
EU: EFSA (2004); SCF (2000, 2002, 2003) UK: EVM (2003)
US/Can: IOM (1998, 2000, 2001)
Generic description of risk characterization (from preambles)
May include - description of scientific
uncertainties associated with UL estimates to indicate scientific confidence that can be placed in estimates
- estimate of intake for population groups, an indication of the margin between recommended or actual intakes and the UL, and an indication of the circumstances in which risk is likely to arise
Should indicate - if subpopulations with
distinct and excep-tional sensitivities to adverse effects have been excluded
- whether more research is needed
- (for nutrients for which a UL was not estab-lished) the highest level of intake where there is reasonable confidence about the absence of adverse effects
From the concluding generic risk assessment process statement: —The available database is reviewed and hazards (adverse effects) identified and characterized. The hazards are compared to known levels of exposure and the risk determined
From the section “How to interpret EVM risk assessments” — text has been included to explain the EVM view [on the SUL or guidance level] and provide any necessary qualification or aid to interpretation. Risk managers are to recognize that where uncertainty factors are used, they reflect a judgement on the uncertainty inherent in characterizing the risk
A summary of the conclusions from hazard identification, dose–response assessment, intake assessment, and an evaluation of the risk
Risk generally expressed as the fraction of the exposure population, if any, having nutrient intakes in excess of the estimated UL
Magnitude of any such excesses, if possible
Description of scientific uncertainties associated with both the UL and the intake estimates to convey the degree of scientific confidence the risk managers can place in the risk assessment
1 Notes and references cited in the table appear at the end of the annex.

Annex 10
237
Table A10-2. Nutrient Substance Risk Characterization Information, by Report
National/regional authority Nutrient substance
EU: EFSA (2004); SCF (2002, 2003) UK: EVM (2003) US/Can: IOM (2000, 2001)
Vitamin A
Tolerable UL applies to both dietary and supplemental intakes of vitamin A
97.5th percentile intake for adults in most of Europe greater than 3000 μg RE/day
UL for women of childbearing age should be compared with intake estimates that reflect short-term rather than long-term exposure because teratogenesis may occur following single or small number of doses of vitamin A
Women planning to become pregnant should not ingest cooked animal liver
Tolerable UL may not adequately address possible risk of bone fracture in vulnerable group at greater risk of osteoporosis and bone fracture; thus, postmeno-pausal women should restrict intake to 1500 μg RE/day
Current intakes may exceed tolerable UL, careful consideration is needed as to appropriateness of fortification of human foods with vitamin A and to potential effects on human exposure of addition of vitamin A to animal feed
Risk assessment - Acute vitamin A
toxicity rare, more likely to follow ingestion of high dose supplements than high intakes from food
- Most manifestations of chronic toxicity are reversible on cessa-tion of dose, but permanent damage to liver, bone and vision, and chronic muscular and skeletal pain may occur in some cases
- Recent epidemiolog-ical data indicate increased risk of hip-bone fracture in post-menopausal women with long-term high intakes of vitamin A; that effect also may occur in men
Guidance level - Not possible to estab-
lish a safe upper limit: levels of dietary intakes may overlap intakes at which adverse effects occur
- 3000 μg RE/day is a prudent threshold for teratogenicity
- Risk of hip fracture is a continuous graded response associated with exposure levels that include average dietary intakes, . . . intakes greater than 1500 μg RE/day may be inappropriate relative to risk of hip fracture
- Consumers of large amounts of liver and liver products and/or supplements may exceed intakes at which adverse effects
Risk of exceeding UL for vitamin A appears small based on intakes cited in exposure assessment
Body of evidence supports reversibility of bulging fontanelles following cessation of high-dose supplementation
Supplemental doses exceed-ing the UL for vitamin A (based on healthy popula-tions in developed countries) are currently used in fortifica-tion and supplementation programs for the prevention and treatment of vitamin A deficiency, especially in developing countries. The UL is not meant to apply to communities of malnourished individuals receiving vitamin A prophylactically, either periodically or through fortification, as a means to prevent vitamin A deficiency, or for individuals being treated with vitamin A for diseases such as retinitis pigmentosa
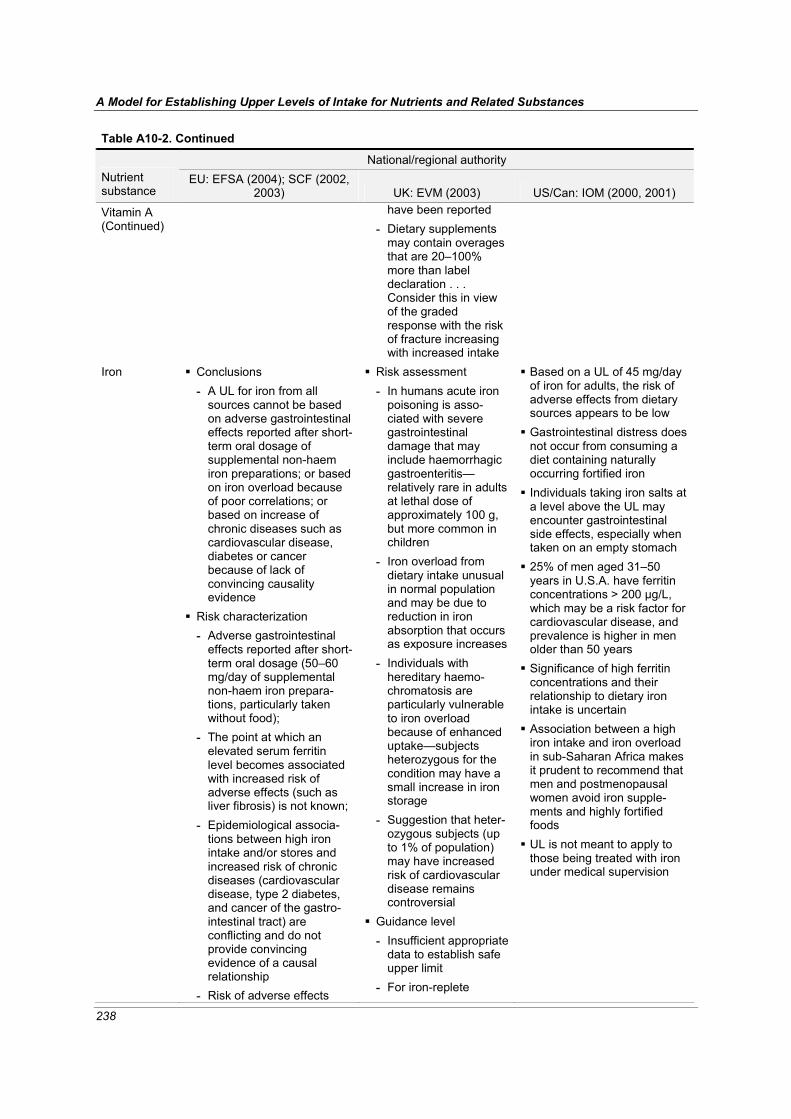
A Model for Establishing Upper Levels of Intake for Nutrients and Related Substances
238
Table A10-2. Continued
National/regional authority Nutrient substance
EU: EFSA (2004); SCF (2002, 2003) UK: EVM (2003) US/Can: IOM (2000, 2001)
Vitamin A (Continued)
have been reported - Dietary supplements
may contain overages that are 20–100% more than label declaration . . . Consider this in view of the graded response with the risk of fracture increasing with increased intake
Iron
Conclusions - A UL for iron from all
sources cannot be based on adverse gastrointestinal effects reported after short-term oral dosage of supplemental non-haem iron preparations; or based on iron overload because of poor correlations; or based on increase of chronic diseases such as cardiovascular disease, diabetes or cancer because of lack of convincing causality evidence
Risk characterization - Adverse gastrointestinal
effects reported after short-term oral dosage (50–60 mg/day of supplemental non-haem iron prepara-tions, particularly taken without food);
- The point at which an elevated serum ferritin level becomes associated with increased risk of adverse effects (such as liver fibrosis) is not known;
- Epidemiological associa-tions between high iron intake and/or stores and increased risk of chronic diseases (cardiovascular disease, type 2 diabetes, and cancer of the gastro-intestinal tract) are conflicting and do not provide convincing evidence of a causal relationship
- Risk of adverse effects
Risk assessment - In humans acute iron
poisoning is asso-ciated with severe gastrointestinal damage that may include haemorrhagic gastroenteritis— relatively rare in adults at lethal dose of approximately 100 g, but more common in children
- Iron overload from dietary intake unusual in normal population and may be due to reduction in iron absorption that occurs as exposure increases
- Individuals with hereditary haemo-chromatosis are particularly vulnerable to iron overload because of enhanced uptake—subjects heterozygous for the condition may have a small increase in iron storage
- Suggestion that heter-ozygous subjects (up to 1% of population) may have increased risk of cardiovascular disease remains controversial
Guidance level - Insufficient appropriate
data to establish safe upper limit
- For iron-replete
Based on a UL of 45 mg/day of iron for adults, the risk of adverse effects from dietary sources appears to be low
Gastrointestinal distress does not occur from consuming a diet containing naturally occurring fortified iron
Individuals taking iron salts at a level above the UL may encounter gastrointestinal side effects, especially when taken on an empty stomach
25% of men aged 31–50 years in U.S.A. have ferritin concentrations > 200 μg/L, which may be a risk factor for cardiovascular disease, and prevalence is higher in men older than 50 years
Significance of high ferritin concentrations and their relationship to dietary iron intake is uncertain
Association between a high iron intake and iron overload in sub-Saharan Africa makes it prudent to recommend that men and postmenopausal women avoid iron supple-ments and highly fortified foods
UL is not meant to apply to those being treated with iron under medical supervision

Annex 10
239
Table A10-2. Continued
National/regional authority Nutrient substance
EU: EFSA (2004); SCF (2002, 2003) UK: EVM (2003) US/Can: IOM (2000, 2001)
Iron (Continued)
from high iron intake from food sources, including fortified foods in some countries, but excluding supplements, is considered to be low for the population as a whole
- Intake from supplements in men and postmenopausal women may increase the proportion of the popula-tion likely to develop high iron stores
- Some groups at special risk for poor iron status, such as menstruating women or children, could benefit from additional dietary intake and/or improved availability of dietary iron
- Up to 0.5% of the popula-tion are homozygotes for hereditary haemochroma-tosis. These individuals are susceptible to iron over-load even with normal dietary iron intakes. Such individuals should avoid iron supplements and foods that are highly fortified with iron
- The majority of these homozygotes are not diagnosed or identified, and they are not aware of their greater susceptibility until sufficient iron has accumulated to produce adverse effects
individuals, most common reported side effects are gastro-intestinal, usually constipation, but also nausea
- Vomiting and epi-gastric pain also reported following supplemental doses between 50 and 220 mg iron/day
- A supplemental intake of approximately 17 mg/day (equivalent to 0.28 mg/kg of body weight/d for a 60 kg adult) would not be expected to produce adverse effects in the majority of people
- This guidance level does not apply to the small proportion of the population who have increased suscep-tibility to iron overload associated with the homozygous haemo-chromatosis genotype
- Many of available studies do not look at side effects in detail and information on the long-term implications of iron supplemen-tation on iron status and storage is lacking
Vitamin C
Conclusions - Limited human and animal
data indicate low acute toxicity
- Acute gastrointestinal intolerance is the most clearly defined adverse effect at high intakes but limited dose–response relationship data
- Insufficient data to establish a tolerable upper intake level for vitamin C
Risk assessment - Available data suggest
no significant adverse effects and no specific key toxic endpoints for oral dose to healthy subjects
- Conflicting data on increased oxalate excretion attributable to vitamin C
- Persons with disorders of iron metabolism or storage are more
Risk of adverse effects from excess intake from food and supplements appears to be very low at highest intakes (>1.2 g/day)
Members of general popu-lation should be advised not to exceed the UL routinely
Intake above UL may be appropriate for well-controlled clinical trials
Clinical trials of doses above UL should not be discour-aged, provided participating

A Model for Establishing Upper Levels of Intake for Nutrients and Related Substances
240
Table A10-2. Continued
National/regional authority Nutrient substance
EU: EFSA (2004); SCF (2002, 2003) UK: EVM (2003) US/Can: IOM (2000, 2001)
Vitamin C (Continued)
Risk characterization - Limited human data
suggest supplemental daily doses up to about 1 g in addition to normal dietary intakes not associated with adverse gastrointestinal effects
- Acute gastrointestinal effects may occur at higher intakes (3–4 g/day)
- Increased risk of kidney stones not found with habitual intakes of 1.5 g/day, but uncertainty whether higher intakes increase renal excretion of oxalate, which could increase risk of renal stones
- Because increased intakes decrease absorption, intakes greater than 1 g/day would be associated with negligible increased uptake and tissue levels but increased gastro-intestinal effects
- Conclusion applies to ascorbic acid, its salts, and esterified forms of vitamin C; although data are lacking on gastrointestinal absorption or tolerability of esterified forms of vitamin C (e.g. ascorbyl palmitate), all these forms might be expected to show similar properties
- Average daily intakes reported in surveys in European countries are greater than the Population Reference Intake; the 95th percentile intake from food and supplements ranges up to about 1 g/day. These dietary intakes do not represent cause for concern
- There has not been a systematic assessment of the safety of the long-term use of high dose vitamin C supplements
vulnerable - Significance of
reported variety of anti-oxidant effects produced by vitamin C uncertain for general population
- Very low acute toxicity in animals, no reported effects on reproductive parameters
Guidance level - Insufficient data to set
a safe upper limit - Low toxicity, but
adverse effect on gastrointestinal system may occur with doses > 1 g/day; this may pose serious problem for individuals with disordered gastrointestinal function
- A supplemental level of 1 g/day would not be expected to have any significant adverse effects
- A guidance level for vitamin C intake has not been estimated, since adverse effects appear to follow supplemental bolus doses rather than intake from food
- Higher intakes of vitamin C intake may be without adverse effects in many individuals
- Potentially vulnerable groups for adverse effects at intakes > 1 g/day include individuals hetero-zygous for haemo-chromatosis, and thalassaemia or with predisposition to renal stones
subjects have signed informed consent documents regarding possible toxicity and provided trials employ appropriate subject safety monitoring
UL not meant to apply to individuals receiving vitamin C under medical supervision

Annex 10
241
Table A10-2. Continued
National/regional authority Nutrient substance
EU: EFSA (2004); SCF (2002, 2003) UK: EVM (2003) US/Can: IOM (2000, 2001)
Zinc Available studies show that the 97.5th percentiles of total zinc intakes for all age groups are close to the ULs, which, in the view of the Committee are not a matter of concern
Establishment of safe upper level - Assuming a maximum
intake of 17 mg/day from food, a total intake of 42 mg/day would not be expected to result in any adverse effects
The risk of adverse effects resulting from excess zinc intake from food and supplements appears to be low at the highest intakes indicated in the exposure assessment
High intakes of zinc are due to the use of supplements, especially during lactation and pregnancy
Notes: EU: EFSA = European Food Safety Authority; EU: SCF = European Commission, Scientific Committee on Food; RE = retinol equivalent; SUL = safe upper level of intake; UK: EVM = United Kingdom, Expert Group on Vitamins and Minerals, Food Standards Agency; UL = upper level of intake; US/Can: IOM = United States of America and Canada, Institute of Medicine
References EFSA (European Food Safety Authority) (2004). Opinion of the Scientific Panel on Dietetic Products,
Nutrition and Allergies on a request from the Commission Related to the Tolerable Upper Intake Level of Iron. The EFSA Journal, 125:1-34.
EVM (Expert Group on Vitamins and Minerals) (2003). Safe upper levels for vitamins and minerals. London, Food Standards Agency Publications (http://www.food.gov.uk/multimedia/pdfs/vitmin2003.pdf, accessed 1 May 2005).
IOM (Institute of Medicine) (1998). Dietary Reference Intakes: a risk assessment model for estab-lishing upper intake levels for nutrients. Washington, DC, National Academy Press.
IOM (2000). Dietary Reference Intakes for vitamin C, vitamin E, selenium, and carotenoids. Washington, DC, National Academy Press.
IOM (2001). Dietary Reference Intakes for vitamin A, vitamin K, arsenic, boron, chromium, copper, iodine, iron, manganese, molybdenum, nickel, silicon, vanadium, and zinc. Washington, DC, National Academy Press.
SCF (Scientific Committee on Food) (2000). Guidelines of the Scientific Committee on Food for the development of tolerable upper intake levels for vitamins and minerals (SCF/CS/NUT/UPPLEV/ 11 Final), European Commission (http://europa.eu.int/comm/food/fs/sc/scf/out80a_en.pdf, accessed 1 May 2005).
SCF (Scientific Committee on Food) (2002). Opinion of the Scientific Committee on Food on the tolerable upper intake level of preformed vitamin A (retinol and retinyl esters) (SCF/CS/NUT/ UPPLEV/24 Final), European Commission (http://europa.eu.int/comm/food/fs/sc/scf/out80g_en.pdf, accessed 1 May 2005).
SCF (2003). Opinion of the Scientific Committee on Food on the tolerable upper intake level of zinc (SCF/CS/NUT/UPPLEV/62 Final), European Commission (http://europa.eu.int/comm/food/fs/sc/scf/out177_en.pdf, accessed 1 May 2005).