a minimum income standard for the uk in 2012
TRANSCRIPT

REPORT
JULY 2012 WWW.JRF.ORG.UK
A MINIMUM INCOME STANDARD FOR THE UK IN 2012 KEEPING UP IN HARD TIMESAbigail Davis, Donald Hirsch, Noel Smith, Jacqueline Beckhelling and Matt Padley
This is the 2012 update of the Minimum Income Standard for the United Kingdom, based on new research into what members of the public think people need for an acceptable minimum standard of living.
Budgets for families with children, originally researched in 2008, have for the first time been researched again from scratch. Budgets for other household types have been reviewed. Overall, the report shows that in the past four years both minimum living costs and the earnings needed to afford them have risen significantly more than headline inflation for families with children. For households without children, they have remained more stable.
This report shows::• what incomes different family types require in 2012 to meet the minimum
standard; and• how much the cost of a minimum household budget has risen since the last
update in 2011.

CONTENTS
Executive summary 03
1 Introduction 062 Updating the minimum in 2012 – new research 103 Income requirements and comparison with benefits,
wages and the poverty line 284 Changes in MIS 2008–12 – driving forces 335 Rural budgets – summary update 406 Conclusions 42
Notes 44 References 45 Appendix 46 Acknowledgements 50 About the authors 51
List of figures1 Planned programme of MIS research 072a Car ownership, 1995–2009 172b The relative price of bus and car travel, 1997–2011 183 The rising cost of childcare 254 Minimum household budgets 2008–12 345 Pay and net income compared with MIS, 2012 366 Influences on minimum family income requirements,
2008–12 (summary) 377 Influences on minimum family income requirements,
2008–12 (detail) 38
List of tables1 Estimated cost of running a second-hand Ford Focus 1.4 182 Comparison of MIS and average spending by category
(April 2012 prices) 263 Summaries of MIS for four family types, April 2012 284 MIS compared with out-of-work benefits, April 2012 305 MIS compared with median income 2009/10 316 Gross earnings required to meet MIS, April 2012 327 Summary of rural budgets 2012 – requirements for
village residents 40

03
EXECUTIVE SUMMARY
This report is the April 2012 update of research on a Minimum Income Standard (MIS) for the United Kingdom.
For the first time since the original MIS research was published in 2008, some of the household budgets on which the standard is based – those for families with children – have been researched again from scratch. New groups comprising members of the public have specified what households need in order to reach an acceptable standard of living in 2012. This research thus produces the first detailed assessment of the minimum acceptable level of living standards following the economic downturn that began in 2008.
The main research involved 21 detailed focus groups in which members of the public from a range of social backgrounds were tasked with producing lists of items that households would need in order to reach the specified threshold. Fifteen of these groups involved parents considering the needs of families with children, in three waves of drawing up and checking the lists. The remaining groups reviewed previous lists drawn up for working-age adults without children and for pensioners. As in previous MIS research, deliberations by members of the public were complemented by expert knowledge, including a nutritionist who helped to construct adequate diets and a heating engineer who specified home energy requirements.
The information gathered was compiled into calculations both of minimum household budgets and the earnings or pensions required in order to afford these budgets after taxes have been deducted and benefits and tax credits have been added to household income.
Household needs in 2012
The most important finding of this research is that there has been a high degree of continuity in what the public consider to be an adequate standard of living, despite unstable economic times. Comparing the original research (conducted mainly in 2007) with the present wave (carried out in late 2011 and early 2012), the great majority of items in essential baskets of goods and services are very similar. Thus, hard times do not appear to have caused the British public to rethink fundamentally what households need in order to make ends meet and to participate in society.
A minimum income standard for the UK in 201204
Nevertheless, certain areas of the budgets have changed significantly. The two most important changes involve transport and leisure. Households have been finding public transport less adequate than previously in meeting their needs. For the first time, in 2012, this has caused families with children (but not households without children) to define a car as essential. This significantly raises the cost of a minimum living standard. This increase has been partially offset by a reduction in budgets for recreational activities and other aspects of social participation. Groups still specified the same range of goods and activities in these categories as four years previously, but in a number of cases reduced the amounts that they said were needed. This included, for example, cases where eating out could take place less often or more economically than specified in the past, and where the value of presents that adults would normally expect to get from their partners was reduced.
Comparison with wages, benefits and poverty, and how these change over time
MIS produces a benchmark that can be compared with the levels of wages and benefits and with the income distribution. Since 2008, household incomes in the UK have tended to stagnate or fall in real terms. In the same period, the minimum that households need for an acceptable living standard has not generally fallen, and for some households it has risen. The consequence is that households are in general finding it tougher to reach the standard.
These effects have not been evenly spread. Working-age households without children have seen spending requirements rise somewhat faster than consumer prices over the four-year period as a whole. For those in work, this has been offset by rising tax allowances, but nevertheless the earnings required to make ends meet have risen significantly faster than average earnings or the National Minimum Wage. For those out of work, benefits have remained at a similar percentage of MIS, but this level is very low (around 40 per cent), and more people are having to depend on these benefits because of higher unemployment.
Pensioners, on the other hand, have seen both their minimum income requirements and their minimum guaranteed benefits rise roughly in line with inflation. As a result, this guaranteed level in 2012 is just over what is needed to meet MIS, as was the case in 2008.
Families with children have faced the toughest situation in keeping up with the minimum. Their needs have gone up in real terms – most severely for lone parents, for whom the cost of owning a car represents a large proportion of spending needs. Cuts in tax credits have also hit such families, and only partially been compensated by the increased tax allowance. Over the period as a whole, the joint amount that a couple with two children needs to earn in order to make ends meet has risen by £5,000 a year, after inflation. Without the need for a car, this earnings requirement would have stayed about the same in real terms. However, this is the product of many different factors, some causing earnings requirements to rise, and others causing them to fall.
An important aspect of these changes for families is that those receiving tax credits and in-work benefits find it hard to make up income shortfalls by increasing their earnings – for example, by working longer hours. The situation is the most extreme for lone parents, who at present can get to about 90 per cent of their required net income by working full-time on the National Minimum Wage, but may have to earn nearly twice this – close to the median wage – to increase net income to MIS. This is because they may lose at least 90 per cent of what they earn in increased taxes and reduced benefits. This

05Executive summary
severely limits the ability of such families to increase their living standards relative to MIS, or to find a means of affording an extra cost (such as a car) when a new need arises.
Conclusion
The MIS was established as a way of monitoring how the incomes required to participate in society evolve as society changes. While it was designed at a time of seemingly perpetual income growth, it has been tested in a period of real income decline. In these circumstances, it has found that definitions of an acceptable living standard do not readily fall as the population becomes poorer, but rather that more people are unable to meet socially accepted norms.
A second main conclusion is that this situation is particularly difficult for families with children. Not only do they have particular needs that are growing rather than declining, but also those on low incomes have become heavily dependent on government help, alongside wages, to maintain their standard of living. This makes cuts in tax credits particularly problematic. By 2008, an increase in such support had made it possible for many families with children to reach a minimum standard with a similar level of wages to those without. However, since that time, the minimum wage required for an acceptable living standard has risen faster for families with children than for other working households. This has effectively increased the cost of having children in terms of its effect on the risk of having to live below minimum standards. It makes it more likely that children will grow up in families where they or their parents will have to do without essentials.

06
1 INTRODUCTION
How much income is needed to achieve a minimum acceptable standard of living in the United Kingdom today? In 2008, the first Minimum Income Standard (MIS) for Britain produced income standards based on detailed research into what ordinary people thought should go into a minimum household budget. This was supported by expert knowledge on certain physical living requirements, including nutrition (Bradshaw et al., 2008; see also ‘MIS in brief’ in Box 1).
As part of that project, there was a commitment to keep MIS up to date in order to reflect changes in the cost of living and in the social norms that determine the items included in the calculation of a minimum budget. Annual updates alternate between those based on new research and those based only on estimates of price rises.
In 2012, new research has looked afresh at what households need in order to achieve a minimum living standard, according to members of the general public. This provides the most detailed update of the research since the original work in 2008. For families with children, it has involved a complete repeat of the original work compiling budgets, starting again from a ‘blank sheet’. For other household types covered by MIS (singles and couples, working-age and pensioner), a lighter-touch review has been used to revise budgets where changes over time have been identified, while uprating unchanged elements by inflation.
This research follows the schedule shown in Figure 1, which involves ‘rebasing’ families with children’s budgets using fresh research in 2012 and rebasing other budgets in 2016. Meanwhile, all budgets are at least reviewed every two years, in addition to annual inflation updates.
Chapter 2 of this report presents the new research on budgets for families with children and the minimum baskets that these have produced for 2012. It also reports on the results of the review of baskets for working-age adults without children and for pensioners. Chapter 3 presents the results in terms of

07Introduction
Figure 1: Planned programme of MIS research
Originalresearch
Review Review Review
Pricing Inflation Inflation Inflation Inflation Inflation Inflation Inflation
Originalresearch
Review Review Rebase
Pricing Inflation Inflation Inflation Inflation Inflation Inflation Pricing
Publication date 2008 2009 2010 2011 2012 2013 2014 2015 2016
Families with children
Families without children
Contents ofbudgets
Prices of items
Contents ofbudgets
Prices of items
This report
Rebase
Pricing
Review
Inflation
Notes: Definitions Rebase: repeat original research to create new budgets from scratch.Review: ask groups to consider whether existing budgets need selective changes.Pricing: identify current prices of individual items from suppliers.Inflation: apply Retail Prices Index (RPI)-based uprating method to adjust budget costs from previous year.
the income requirements that they produce, and looks at how these compare with benefits, with earnings on the National Minimum Wage (NMW) and with the official poverty line. Chapter 4 analyses change in the first four years of MIS, considering how much income requirements have evolved and the role of various factors in contributing to this change. Notably, it looks at the part played, respectively, by changes in prices, by changes in what people specify as being required as part of the minimum, and by changes in tax and benefit entitlements that affect how much people need to earn in order to have a given amount of disposable income. Chapter 5 updates earlier calculations of rural budgets and income requirements. Finally, Chapter 6 draws conclusions.
Box 1 summarises the main features of MIS. For further details, see Bradshaw et al., 2008. The results of MIS, updated to April 2012, are available in full using the online Minimum Income Calculator (CRSP, 2012a), and in a summary spreadsheet published on the MIS website (CRSP, 2012b), as well as in tables for selected household types in Chapter 3. The Minimum Income Calculator allows users to specify the number and ages of family members and to adjust for some costs over which they have little control, such as rent, in order to personalise a minimum budget. Users can also see the gross earnings or pension that their family will need in order to achieve that budget, and compare the spending available to someone on a different income with the minimum requirement.
Box 1: Minimum Income Standard in brief
What is MIS?The Minimum Income Standard (MIS) is the income that people need in order to reach a minimum socially acceptable standard of living in the UK today, based on what members of the public think. It is calculated by specifying baskets of goods and services required by different types of household in order to meet these needs and to participate in society.
How is it arrived at?A sequence of groups has detailed negotiations about the things a family would have to be able to afford in order to achieve an acceptable living standard. Experts check that these specifications meet basic criteria such as nutritional adequacy and, in some cases, feed back information to subsequent research groups that check and amend the budgets. Groups typically comprise six to eight people from a mixture of socio-economic

A minimum income standard for the UK in 201208
Box 1 continued
backgrounds, but all participants within each group are from the category under discussion. So parents with dependent children discuss the needs of parents and children, working-age adults without children discuss the needs of single and coupled adults without children and pensioner groups decide the minimum for pensioners.
What does it include?Groups in the original research defined MIS thus: ‘A minimum standard of living in Britain today includes, but is more than just, food, clothes and shelter. It is about having what you need in order to have the opportunities and choices necessary to participate in society.’
Thus, a minimum is about more than survival alone. However, it covers needs, not wants; necessities, not luxuries: items that the public think people need in order to be part of society. In identifying things that everyone should be able to afford, it does not attempt to specify extrarequirements for particular individuals and groups – for example, those resulting from living in a remote location or having a disability. So, not everybody who has more than the minimum income can be guaranteed to achieve an acceptable living standard. However, someone falling below the minimum is unlikely to achieve such a standard.
To whom does it apply?MIS applies to households that comprise a single adult or a couple, with or without dependent children. It covers most such households, with its level adjusted to reflect their make-up. The needs of over a hundred different family combinations (according to numbers and ages of family members) can be calculated. It does not cover families living with other adults, such as households with grown-up children.
Where does it apply?MIS was originally calculated as a minimum for Britain; subsequent research in Northern Ireland in 2009 showed that the required budgets there are all close to those in the rest of the UK, so the national budget standard now applies to the whole of the UK. This standard was calculated based on the needs of people in urban areas. A further project published in 2010 (Smith, Davis and Hirsch, 2010) looked at how requirements differ in rural areas. This information is also contained in the online Minimum Income Calculator (CRSP, 2012a) and can be obtained by clicking on the ‘rural’ option on the main results page. Outside the UK, the team responsible for the UK MIS has applied the method in Guernsey (Smith, Davis and Hirsch, 2011) and supported MIS projects employing the same method in Japan and Portugal (both in progress). An ongoing MIS programme in the Republic of Ireland uses methods based on the UK work (Collins et al., 2012).
How is it related to the poverty line?MIS is relevant to the discussion of poverty, but does not claim to be a poverty threshold. This is because participants in the research were not specifically asked to talk about what defines poverty. However, it is relevant to the poverty debate in that almost all households officially defined as being in income poverty (having below 60 per cent of median income) are also below MIS. Thus households classified as in relative income poverty are generally unable to reach an acceptable standard of living as defined by members of the public.
09Introduction
Box 1 continued
Who produced it?The original research was supported by the Joseph Rowntree Foundation (JRF). It was conducted by the Centre for Research in Social Policy (CRSP) at Loughborough University in partnership with the Family Budget Unit at the University of York. Updating is being carried out by CRSP, again with JRF support. In 2011, the Family Budget Unit was wound up on the basis that the calculation of MIS takes forward its mission.
When was it produced and how is it being updated?The original research was carried out in 2007 and the findings presented in 2008 were costed using April 2008 prices. Every July, new MIS figures are published, updated to April of the same year. The updates take on board inflation and changes in minimum needs as set out in Figure 1.

10
2 UPDATING THE MINIMUM IN 2012 – NEW RESEARCH
For the 2012 MIS, the budgets for households with children were rebased, that is, developed from scratch. New groups of parents were recruited to draw up lists of goods and services required by various households containing lone parents or couples and children of different ages (see Box 2). As usual, participants were formed into groups to consider needs of individuals and families that corresponded with the makeup of their own households.
As in the original research, an initial set of ‘task groups’ drew up detailed lists of what families would need, comprising hundreds of items. These were subsequently priced by retailers to produce full household budgets and presented to another set of groups for checking and revising. The individual budgets were then combined for families and these family budgets were presented to a further focus group for final negotiation and resolution of outstanding issues.
In addition, separate ‘review’ groups of working-age adults and pensioners were held to review the existing lists (originally published in 2008 and last reviewed in 2010) for households without children and assess whether any revisions were needed in 2012 to reflect changing needs and living standards. All budget areas are revisited in the review process, but some are examined and discussed in great detail and others receive just a ‘light touch’. Groups are asked to focus particularly on aspects of the budget where changing norms might necessitate revisions, even over a relatively short period, such as technology and social and cultural participation. Other budget areas such as kitchen utensils, clothing and the weekly food menus are presented in summary form as these are less likely to require significant change at this stage, and will be revisited in their entirety in the next rebase for households without children.1

11Updating the minimum in 2012 – new research
The rest of this chapter discusses the findings from this new research, looking at what has changed and what has remained the same over time, divided into broad categories of goods and services included in the budgets. Although different research methods (‘review’ and ‘rebase’) were applied to budgets of different family types, the results are reported here as a whole. The items in each budget can be grouped into the following elements:
• food and drink• clothing• household goods and services• personal goods and services• transport• social and cultural participation• housing (e.g. rent, water, electricity, gas, Council Tax)• childcare
Food and drink
As in 2008, the rebase groups for families with children listed food and drink options for a typical week for each of the individual budgets. These were
Box 2: Summary of research elements
Fieldwork consisted of 21 focus groups held in Derby, Loughborough and Northampton. Each group involved new participants (typically six to ten per group) who had not previously participated in MIS research, except for the group looking at minimum car costs, whose members had also participated at the task group phase.
Rebasing of budgets for families with childrenSeven task groups comprised:
• partnered mothers• partnered fathers• lone parents• parents of under 2-year-old children• parents of 2- to 4-year-old children• parents of primary school-aged children• parents of secondary school-aged children
Each of these compiled a budget for the adult or child specified in the list.
Six checkback groups looked at the decisions made by this original set of groups. Partnered parents were combined into a single group considering the needs of couples.
One final group looked at the whole-family budgets compiled from these first two stages and another looked at the basis for minimum car costs for different family types.
Reviewing budgets for households without childrenThree successive groups of working-age adults without children considered the case for changing existing budgets for such households. Changes were implemented only where there was consensus across groups. The same process was repeated for pensioners.

A minimum income standard for the UK in 201212
combined into weekly menus for households and checked for nutritional adequacy, with any changes recommended by the nutritionist being approved by subsequent groups. The final menus are very similar to those originally developed in 2008 and tend to follow a pattern of a breakfast of cereal and/or toast, one lighter meal and one more substantial meal each day, along with drinks and occasional snacks such as a piece of fruit or a biscuit. Groups included a cooked breakfast/brunch option and a roast dinner at weekends as a reflection of the kind of variations there might be throughout the week. The review groups (for households without children) did not examine the weekly menus in detail, but were asked about whether we needed to change the way in which the food baskets were priced.
Although participants were mindful of changing times and rising prices, as in the 2010 review, it was agreed that the food and drink should continue to be priced at Tesco. There was general agreement that there was not much to choose between shopping at Asda, Tesco, Morrisons and Sainsbury as the cost of cheaper and more expensive items available at each would balance out, and Tesco was still seen as the most prevalent of these. Discounted supermarkets such as Aldi, Lidl and Netto were thought to offer equivalent products at a lower price, but in all working-age groups, with and without children, participants said that, partly in view of time constraints, people should not need to shop around in order to afford a minimum food basket. Pensioner groups said that although they had more time available to shop around, this was not feasible because of transport issues. All groups agreed that we should still avoid including discounted prices as there was no guarantee that the same goods could always be purchased at the discounted price. They said that if items were available at a lower price from time to time, the money saved would be used to enhance the choice of items that could be afforded rather than reduce the total shopping budget.
… you budget for the standard price. I know how much stuff costs but if it’s on special offer and I save a few pounds, that gives me the choice to buy something with those few pounds that week.– Parent, Northampton
Because a car is now included in the minimum budget for families with children, it has become possible to cost for some food and drink items more economically, taking advantage of savings achieved through bulk-buying. This helped to offset price rises in food in some cases. Overall, the food costs for families with children increased by about 20 per cent since 2008 – the same amount as the average increase in food prices, measured by the Retail Prices Index (RPI).
Clothing
There was some discussion across all groups about the quality of items that should be included and which retailers should be used to price clothing for the budgets. As in 2010, there was general agreement that the clothing from supermarkets and retailers such as Primark and Matalan was acceptable in terms of quality. Although such cheap clothing was not likely to last more than a year or two at most, participants in 2010 and 2012 did not feel that buying more expensive items would guarantee greater durability – a change since the original research in 2008.
Thus, in the new lists drawn up and agreed by the rebase groups, there was more emphasis on sourcing items from cheaper retailers and fewer items were identified as needing to be ‘better quality’ than in 2008. This was particularly
A car is now included in the minimum budget for families with children.

13Updating the minimum in 2012 – new research
noticeable in the case of partnered fathers. Although the items themselves were similar to those detailed in 2008, far fewer men’s items were specified as being better quality, so the ‘lifetimes’ given for garments were shorter and much more similar to the women’s than in the past. This caused an increase in the men’s clothing budget as the weekly cost of items increases if they have to be replaced more frequently, and this more than offsets the lower price. In the few cases where men did specify mid-range clothing as being the minimum acceptable they said it would still not be particularly durable. This suggests that the overall move to cheaper clothing may not always bring overall clothing budgets down. In 2012, the total male clothing budget in 2012 is similar to, although still lower than, that of the adult female.
Parents of older children also said that buying cheaper clothes was more acceptable than it would have been when they were young, and that this would mostly meet secondary school-aged children’s needs, with the addition of one or two brand-name items.
Man: I think there’s a generation thing as well. I don’t know what the Primark thing was in my day but the thought of wearing something that was equivalent when I was that age … but now it’s trendy to go to Primark and all those sorts of shops and buy bargain-basement things and come out with bags full of stuff.
Woman: It’s because cheap shops do fashion now.
Man: They never used to.– Parents, Loughborough
These groups said that teenage children were often more conscious of fashion and attached importance to owning brand-name items as a way of fitting in with their peers. They said that if the secondary-school child wanted a brand-name item, parents would expect this to be a birthday or Christmas present. They said that rather than paying a premium for the latest branded goods, they would purchase a more reasonably priced ‘last-season’ item as this would still meet the need to fit in, but in a more economical way.
Nowadays branded ain’t like when we were kids and it was all designer because T. K. Maxx sells all last season’s don’t it?– Father, Loughborough
Groups agreed that most clothes should be priced as new rather than based on finding the required style, size and colour of second-hand item. However, parents of younger children said that the pre-school child’s party dress and shoes could be purchased on eBay as these items tended to be worn only once or twice before children grew out of them.
The clothing budgets followed a similar pattern to those in 2008, with the highest costs being for the secondary school-aged child and the single and partnered mothers. As before, the younger children’s clothes budget is higher than the primary-school child’s because they are growing faster and therefore need clothes to be replaced more frequently.
Household goods and services
The review groups for households without children looked at the lists of furniture in each room and an overview of kitchen, cleaning and bathroom

A minimum income standard for the UK in 201214
items and concluded that, for the most part, the items included in 2008 did not need to change. The new lists of household goods constructed by the rebase groups were very similar to those developed in 2008 for families with children. One key difference was that the inclusion of home computers and internet access for these families meant that large appliances, such as the fridge and washing machine, should be priced online to get the best deal. In contrast, in 2008 everything was priced at high-street stores (see Davis, Hirsch and Smith, 2010, pp. 13–14 for further discussion of computer and internet provision).
As in previous years’ research, the question of whether or not a tumble dryer was an essential item caused much debate. In 2012, groups thinking about the needs of a household with one or two children decided that it was not essential, and that laundry could be dried using a combination of the washing line outside, an airer and the radiators (all accommodation is assumed to have gas central heating). However, groups looking at the needs of very young children (0–1 years) said that without a tumble dryer it might be necessary occasionally to take a load of washing to the launderette to be dried. They therefore included £5 per month for six months of the year in order to make this possible.
In 2012, we were able to conduct some additional groups looking in more detail at the needs of different family types, including additional requirements of larger families (see Hirsch et al (2012), forthcoming). These groups agreed that the ‘tipping point’ at which a tumble dryer changed from a ‘nice-to-have’ item to a ‘need-to-have’ one was when a family had three or more children. A tumble dryer has now been included for this size of family. It is interesting to note that the main cost impact of this is the extra power required, which for a couple with three children is over eight times as high as the weekly cost of paying for the machine itself.
TelephoneWhile there was some discussion about the need for landlines in addition to mobile phones, the landline was still seen as a necessity for households that needed internet access. For pensioners, the landline was the principal means of communicating and they said that the budgets should include the cost of a package for line rental and inclusive daytime and evening calls. For these households, mobile phones were still mostly for emergency purposes only, reserved for occasional use, and a modest amount was included for topping up a ‘pay-as-you-go’ phone. In 2010, working-age groups said that cheap mobile phone contracts were now more cost effective than pay-as-you-go options. This remained the case in 2012, when the price of a cheap contract was less than in 2010. However, neither landline nor mobile packages included calls to certain numbers, such as 0844 numbers, and an additional amount was allocated for this.
Personal goods and services
This budget area includes a range of elements:
• healthcare (including prescriptions, dentistry, optical care, first aid items)• toiletries• personal care (e.g. nail scissors, tweezers, hot water bottle)• hairdressing (haircuts and hair products)• accessories and personal items (includes jewellery, handbags, belts, watches,
umbrellas, suitcases)

15Updating the minimum in 2012 – new research
• cosmetics and perfume• children’s items (e.g. nappies, baby wipes, pushchairs, car seats, bottles, bibs)
All adult budgets include the cost of an eye test every two years, in line with standard guidelines on eye care. However, in the past only pensioner groups had included an additional amount for the purchase of spectacles. In 2012, both review and rebase groups agreed that an amount should be added to the budgets for working-age adults (both with and without children) to cover the cost of a pair of glasses every two years.
As this was different from the decisions in 2008, we asked groups why they thought it might have changed. Participants said that people were more conscious of the need to have their eyes tested regularly, because of the prominence of opticians’ television advertising campaigns (most notably Specsavers). In this sense, the new research did not necessarily identify a new ‘need’, but rather reflected greater awareness of an existing one. There were also suggestions that, in addition to a perceived reduction in price, there was no longer any stigma attached to wearing glasses, which might have put people off in the past. Lastly, it was suggested that the change might be related to changes in people’s lifestyles.
The other thing is people are using, whether it’s in school or whether it’s in their working environment or even in the home environment, you’re using the computers more so you’re sitting in front of computers more, you’ve got a higher likelihood that their eyes are going to start to go wrong. You know, so therefore you look in 20 years’ time what the impact is going to be on people’s eyesight.– Woman, Loughborough
The budgets for working-age adults therefore now include an amount for a pair of single-focus lenses and basic frame for each person every two years. While groups acknowledged that not everyone might need this amount when they were younger, it was increasingly likely that they would need to wear glasses for at least part of the time, for example for reading or driving, as they got older. It was felt that meeting this need was essential. The pensioner review groups agreed the same level of provision (an eye test and a pair of glasses each year) but said that the cost of a basic pair of glasses with varifocal lenses had decreased over time, so they reduced the amount for this item in the budgets. (This is one of the few MIS items for which groups specify a price rather than just the item type, since this is the most practical way of specifying quality).
When budgets were developed for individuals in 2008, groups used a combination of listing specific items and allocating cash amounts for ‘topping up’ supplies of consumable items, such as toiletries. In 2012, groups chose a more systematic approach and developed detailed lists for each of the individuals (mothers, fathers and children of different ages) in the MIS households with children. The budgets created for this category by the task groups were significantly higher than those in 2008, probably as a result of this different approach. At the final group stage, the MIS budgets are compared with national data on expenditure. The MIS totals for personal goods and services were high compared with actual spending across the population, so we asked groups to look at these budgets in particular detail. They made some modifications, in some cases reducing the replacement rates of consumable items (e.g. shampoo and toothpaste). Nevertheless, the total budgets for personal goods and services, not including glasses, are significantly above what they would be if the 2008 specifications had just risen with inflation.

A minimum income standard for the UK in 201216
For example, for a couple with two children, the difference (not counting the addition of glasses) is £8 a week, representing a quarter of the personal goods and services budget and about 2 per cent of the total family budget after rent and childcare. This is a small change in the MIS total that might have been caused by a change in how groups decided to specify these particular items rather than a real change in what people need.
In terms of the relative needs of different individuals, the 2012 amounts for personal goods and services follow the same pattern as in 2008. The mother’s budget is higher than the father’s, the costs for the secondary-school child (a teenaged girl in the case study discussed) are similar to (but lower than) the mother’s – that is, her costs are similar to an adult female’s. Of the children, the under 2s’ budget is highest, principally owing to the cost of disposable nappies, followed by the 2- to 4-year-old child, (roughly half of whose budget is for disposable pull-up pants for use while the child is toilet training). The primary-school child (a boy aged 7 in the case study) has the lowest budget.
Transport
In the 2008 MIS for Britain, groups decided that the minimum acceptable means of meeting people’s transport needs was a combination of public transport and occasional taxi use, and in the 2010 review this was still thought to be the case. For the 2012 review for households without children, groups approved this model. The only change was that pensioners increased the budget for their two taxi journeys a week as they said that fares were more expensive now and the amount allocated in 2010 was no longer sufficient.
In contrast, after much discussion, the rebase groups decided that each household needed one car in order for the families with children to meet a minimum acceptable standard of living. This was clearly confirmed in successive waves of groups. Two-parent households included a bus pass, as the car would be shared and one person would still need to use public transport. They also included one bike per household and said that the lone parent might use this for exercise. In the coupled household, one parent might cycle to work some of the time, enabling the partner to use the car when necessary. The vehicles described as meeting the minimum acceptable standard would be purchased second-hand and costs for regular maintenance and breakdown cover should be included. The groups specified a Ford Focus for families with one or two children and a Vauxhall Zafira for families with three or more children.
A car was said to be essential in order to meet the needs of both parents and children and particularly to enable them to have opportunities and choices relating to work and social activities.
I’m a strong believer that every household should have a car because if the father needs it for work it broadens the aspects, it doesn’t limit them to where they can go or what jobs he can take.– Parent, Loughborough
If you think about Tom [the case-study primary-school child], obviously we want him to walk to school if possible, but if he takes part in a couple of activities is it a luxury to be able to drive Tom to swimming lessons? I couldn’t take my children, I couldn’t walk with them. If I didn’t have a car, they wouldn’t be able to swim.– Parent, Derby

17Updating the minimum in 2012 – new research
Public transport was seen as being inflexible. For parents who had to take children to school or childcare and then get to work at a certain time, buses were not a realistic option as they could not accomplish the journey in the time available. Groups also cited examples of emergencies when it would not have been possible to use public transport, or affordable to use a taxi. Bus fares were universally considered very expensive and taxis prohibitively so. Discussions suggested that, although there were costs involved in owning a car, it offered better value for money than public transport.
As well as travelling to and from work and school, the car would be used for shopping trips and would mean that families could do a weekly shop in one outing and take advantage of bulk-buying economies. It meant that there was no need for a separate budget for taxi use, and it also replaced the 2008 and 2010 use of coach travel for the family holiday.
This change in the decisions about transport reflected a qualitative shift in perspective rather than a complete change of opinion. In earlier MIS research, the requirement for a car had been hotly debated by urban groups but it was decided, on balance, that minimum needs could be met by using buses with occasional taxis. In 2012, however, the balance of opinion had tipped the other way.
This change may partly reflect long-term trends in car ownership. As shown in Figure 2a, in the past 15 years the proportion of households with no car has fallen from about a third to about a quarter, and the opposite has happened to the number with two or more cars (Department for Transport, 2011). These trends stabilised in the middle of the last decade, but such changing norms can take time to feed into social expectations.
A number of participants associated the decision about cars with the increasing costs of public transport and reduction in the availability of services. There is evidence of both these trends.
Buses have become much more expensive relative to the cost of running a car. In the past 15 years, for example, the cost of motoring has risen 50 per cent but the cost of bus travel has increased by 100 per cent, according to the RPI (see Figure 2b).
Figure 2a: Car ownership, 1995–2009
50%
45%
40%
35%
30%
25%
20%
15%
10%
5%
0%1995–97 1998–2000 2002–03 2005–06 2008–09
No car/van One car/van Two or more cars/vans
% o
f hou
seho
lds
Source: National Travel Survey, 2011

A minimum income standard for the UK in 201218
Figure 2b: The relative price of bus and car travel, 1997–2011
400
350
300
250
200
150
1001997 1998 1999 2000 2001 2002 2003 2004 2005 2006 2007 2008 2009 2010 2011
Bus fares Motoring
RPI i
ndex
val
ue: 1
987=
100
RPI annual averages, 1997–2011
Bus services in many areas of the country have been in long-term decline, which appears to be speeding up as a result of current public sector cuts. For example, between 2010/11 and 2011/12, non-metropolitan councils reported the loss of about one in five supported bus services as a result of the cutting of the Bus Services Operating Grant. Moreover, 74 per cent of councils plan to make further cuts between 2011 and 2013 (Campaign for Better Transport, 2011 and House of Commons Transport Committee, 2011).
Costing the minimum price of running a car is not straightforward, and was supported by expert knowledge from Go-Motoring, a company that provides information about the car market. Based on the specifications identified by the groups, the calculation looked for the most economical way of owning and running a second-hand car, using the lowest-cost suppliers and checking that the car was sold before rising repair bills raised the overall cost of owning it. Table 1 shows the basis on which the total annual cost was calculated.
Table 1: Estimated cost of running a second-hand Ford Focus 1.4
Lone parent, 1 child
Couple, 2 children
Annual miles 5,396.00 8,509.00
Purchase price of 5-year-old car £4,575.00 £4,575.00
Sale price of 10-year-old car £1,125.00 £975.00
Annual costs
Depreciation (difference between purchase and sale price, divided by 5 years)
£690.00 £720.00
Service, repair and maintenance £392.14 £467.37
MOT £58.24 £58.24
Fuel £766.27 £1,208.26
Insurance £376.76 £452.08
Road tax £170.00 £170.00
Breakdown cover £28.90 £28.90
Total £2,482.31 £3,104.86Source: Go-Motoring

19Updating the minimum in 2012 – new research
While the cost of a car contributes a significant amount to the increase in budgets overall, it is offset by the removal of some of the bus fares and the taxi and coach costs. For example, for a couple with two children, the 2008 transport budget uprated with inflation to 2012 would be £46 a week. The addition of a car costing £60 a week to run, combined with some remaining public transport costs, has added £29 a week, net, to the total transport budget.
Social and cultural participation
This section of the budgets includes different aspects of social and cultural participation, including:
• home entertainment (television, DVD player, computer, internet connection)• presents, toys and pocket money• leisure activities (including eating out – but note that this is part of the
‘food’ budget in tables of MIS results)• holidays
The overall effect of the changes discussed below was a reduction in the social and cultural element of the budget for both pensioners and families with children (but not for working-age households without children). The magnitude of the reduction varied according to the household composition. The main reasons for this were reductions in the amounts included for buying presents, particularly for parents and secondary school-aged children, a decrease in frequency and/or cost of leisure activities, including eating out, and the availability of lower-cost broadband packages.
In producing lower budgets for social participation as set out below, groups did not systematically link reduced minimum requirements to harsh economic times. However, in repeated research since 2009, groups have perceived the recession as having had an important effect on people’s lives. This appears to have been an underlying influence on the decisions reached about social participation. In particular, the groups discussed ways of economising while still meeting needs and not restricting choice excessively. They looked for opportunities to get good value for money, such as in cheap eating-out deals, and perceived that there were now more deals available. Thus, in this area of the budget, there appears to have been an ‘austerity effect’, although it would be difficult to quantify.
Home entertainmentThe parents’ groups included a 22-inch television, which is similar to the 21-inch model originally included in 2008. However, the pensioner review groups said that as people age they benefit from a bigger screen to be able to see better, and that this should be changed to a 32-inch model, which has now become commonplace. The televisions would all have built-in Freeview as standard. It was considered more cost effective to have a separate, cheap DVD player than one integrated into a more expensive television.
Groups said that the internet packages should be priced via online comparison websites in order to get the most competitive deal, and would include landline rental and some inclusive calls, but not cable or satellite TV channels.

A minimum income standard for the UK in 201220
Computers and internetIn the 2010 review, groups agreed that all working-age households needed to be able to have a computer in the home and connect to the internet, in contrast to the 2008 groups which said that this was only essential for families with secondary school-aged children. In 2012, parents discussed the increasingly prevalent expectation that all school-aged children would have access to a computer at home and be able to complete homework on it. They said that where there was more than one school-aged child in the household, it could be extremely difficult to meet both parents’ and children’s need for computer access with just one machine. For families in this situation, another device would be necessary. They identified a laptop rather than a desktop PC as the most suitable way to meet the family need for a computer. It offered flexibility in terms of where it could be used, allowing children to study somewhere quiet in the home, and also took up less space. Additional groups involved in researching children’s costs said that, where needed, a netbook would be the cheapest solution to providing an additional computer. In contrast, the groups of pensioners reached the same conclusion as in 2008 and 2010, that older people could access computers in libraries if necessary, but did not need to have them in their homes. After much discussion, they still felt that this was ‘nice to have’ rather than essential. Costs of internet provision have reduced over time, which was another contributory factor in the reduction of this part of the budget.
Presents, toys and pocket money
PresentsThe working-age and pensioner review groups discussed the allocations for presents at some length. There was no clear consensus that this aspect of the budget needed to be changed, except for the amount allocated for partnered pensioners to buy presents for each other to celebrate Christmas, birthdays and wedding anniversaries, which they reduced by half from £30 to £15 for each present. Groups said this reflected a change in people’s expectations in recent years.
As a couple and with the price of things nowadays, and you’re on less money, you’ve got to be sensible as well, which is buy something that both of you need, both of you want …– Pensioner, Northampton
I think nowadays the general consensus really, especially amongst my friends and my family, is that generally now it’s grandparents just buy for the grandchildren and basically restrict it to that at birthdays and Christmas.– Pensioner, Derby
For families with children there was a mixed picture, with some elements remaining relatively stable and others changing. Like the pensioner couples, coupled parents reduced the amount allocated to buying gifts for each other, and also the amount for the secondary-school children. Spending on presents was offset against weekly pocket money and fortnightly money to subsidise socialising with their peers, which was not the case in 2008. Christmas spending on the primary school-aged child’s present remained the same in cash terms (and hence lower in real terms), although the 2012 groups added a modest sum for buying small presents for friends and teachers, and for wrapping paper and cards. The under-2-year-old’s Christmas present budget

21Updating the minimum in 2012 – new research
was lower than in 2008, and the amount allocated took into account the cost of their birthday present, replacing and adding to their toys throughout the year, and the value of toys they would receive from other children on their birthday.
The total expenditure on birthdays for the younger children (that is, not the secondary school-aged child) was very similar to that described in 2008, the only difference being in the distribution of amounts between presents for the children from their parents, and money spent on the children’s behalf on gifts and cards when attending friends’ birthday parties. However, parents were conscious of using their budgets as effectively as possible and talked about buying expensive items such as bikes and games consoles second-hand in order to get good value for money while still providing the items that their children needed in order to fit in with their peers.
ToysThe budget allocated for providing craft materials was significantly reduced by the 2012 groups, changing from a separate amount for each child to a single amount per household. The 2008 budgets had also included money for parents to buy toys and games throughout the year to replace broken or worn-out toys and provide additional items.
In 2012, parents included a small number of specific toys (for example, a cuddly toy, a ball and a sit-on-and-ride toy or scooter) with any additional playthings being provided through Christmas and birthday presents.
Pocket moneyThe secondary-school child had the same £5 per week pocket money in 2008 as in 2010 and 2012, although in 2012 she also had an additional £5 for eating out on a shopping trip with her friends once a fortnight. Whereas in 2008 the primary-school child had a weekly ‘treats’ budget, which was described as being for comics, toys, rewards for good behaviour and so on, this was not something that 2012 groups felt was necessary.
Leisure activitiesThe pensioner and working-age review groups agreed with the budgets for leisure activities and felt that they were sufficient to meet a minimum standard, but certainly did not exceed this standard. The rebase groups specified slightly reduced budgets for the children, either because of changed patterns of activity or lower costs being agreed as adequate. However, the parents’ budgets for recreation were almost identical to those in 2008, and comprised money for some inexpensive activities each week, such as going to the gym, and a more expensive activity, such as a cinema trip, once a month.
For the youngest child, the groups included the same weekly parent and toddler group as in 2008, but said that they would go swimming with a parent monthly rather than weekly. Pre-school children would have the opportunity for a swim each week and a weekly playgroup session, which was cheaper than the soft-play session included in 2008. Parents in the 2012 groups thought it was still important for the primary-school child to have swimming lessons, and to be able to attend a group such as Beavers or Cubs, although the money included to cover this was less than in 2008. The secondary-school child was allocated money for one organised activity a week, such as Guides, with the possibility of using some of her pocket money to attend an additional activity at the leisure centre at the weekend. This contrasted with 2008 when parents included Guides, a music lesson and purchase of a musical instrument.

A minimum income standard for the UK in 201222
Eating outIn 2008, the groups looking at households with children specified an amount for the family to share a take-away meal once a month and the parents’ leisure budget could be used for eating out occasionally, either as a couple or as a family, if desired. In 2012 this was changed to an amount for the family to use either for a take-away meal or eating out as a family. Rather than a monthly activity, the groups said that this was an occasional treat and would only be three times a year – for example, to celebrate a family birthday. This topic was discussed in depth and the consensus was that it was essential for people to be able to go for a meal out as a family. This was seen as providing an opportunity for family time and also a way of equipping children with the social skills required when eating out in public. Participants acknowledged that some families might prefer to eat out more frequently at lower cost, for example at a fast-food restaurant, but that all families should be able to have a choice of places to go and eat rather than being restricted to looking only for special deals or budget options.
In the review groups, pensioners agreed that older people should still be able to eat out as a monthly activity, but said that the amount included for this should be reduced. They said that over the past few years, pubs and restaurants have been forced to compete for business. This had resulted in a widening range of lower-cost options for eating out, and it was therefore realistic for people of their age group to take advantage of these offers.
When people stopped going out [to pubs] so of course they concentrated on the food and had to get customers in, so now you’ve got so much choice. There might have been an odd couple of places where you could get cheap deals but now it’s more across the board.– Pensioner, Northampton
The groups of working-age people did not think the 2010 budgets needed to be changed, but talked about the increasing cost of going out to socialise. They said that it was becoming more common to socialise at home, which also reflects discussions in other groups and the emphasis on eating at home rather than eating out.
HolidaysAll groups agreed that it was essential for people to be able to have a break away from home each year. As in 2008 and 2010, groups said that this need could be met by having a one-week holiday in the UK. For pensioners, this was a half-board coach-tour package. For working-age adults without children, it included coach travel and a one-week self-catering holiday in a rented cottage. For families with children, parents specified a one-week self-catering caravan holiday at a family resort, for example on a Haven or Butlins site, to which they would travel by car. This was priced at peak time for families with school-aged children, and off-peak for families with younger children.
Housing and childcare costs: establishing baseline norms
In most of the areas of spending used to determine MIS, it is possible to calculate costs based on retailers and other suppliers with national pricing policies. Two important exceptions are housing and (for those requiring it) childcare, which need to be dealt with somewhat differently. These items comprise significant elements of household spending, but their costs can vary greatly across the country and (especially for housing) in different sectors. So how can MIS produce a single figure?
All groups agreed that it was essential for people to be able to have a break away from home each year.

23Updating the minimum in 2012 – new research
To some extent, budget standards have been able to avoid this issue by calculating budgets net of rent and childcare. This allows us to say how much a household needs in disposable income after paying rent/mortgage and childcare. However, a significant development in MIS has been its calculation of the earnings that people require in order to afford these amounts. Minimum figures for annual earnings help give meaning to the MIS results that the general public can understand. But in order to produce an earnings requirement, some assumption has to be made about rent and childcare.
When MIS was launched in 2008, its rent and childcare assumptions were based on examples of what people had to pay for these items in Loughborough, using the examples of a council rental and prevailing rates among local childminders respectively. This was used as an example of what someone with modest costs would have to spend on each of these items, although it was not anticipated how significant these would become as the earnings requirements stated in MIS became more prominent. While the Minimum Income Calculator (CRSP 2012a) allows users to adjust rent and childcare costs to reflect actual circumstances, the main MIS analysis of earnings requirements requires some core assumptions about their levels.
With the new wave of research carried out in 2012, we have reviewed the way in which we set rent for all households and childcare costs for households with children below secondary-school age. We have produced a more systematic method for doing so, and used this new basis for all published budgets.
The principle that we have applied in MIS for variable-cost items, such as housing and childcare, is to use prices in a ‘low-cost category of provision’ which shows the minimum that a household is likely to have to spend (and acknowledging that some will have to pay more if this category is not available to them). We interpreted ‘low-cost category of provision’ as meaning the cheapest sector in which provision is available, in a relatively low-cost area of the country. The idea is not to find the very cheapest case of rent or childcare, but rather one that few people will pay below.
RentApplying the low-cost category principle to rent, we have used an average of social rents for each appropriate property type in the East Midlands as a benchmark. While many people do not have the opportunity to live in council housing, a significant proportion of people, especially on low incomes, live in some form of social housing. Across the whole population, one in five families with children are social tenants, and this represents nearly three in five families who rent their homes. Among single people of working age, half of tenancies are from social landlords. (On the other hand, if we were just to take council rents, this would cover only one in ten families with children and only a minority of all tenants.) Social rents in the East Midlands are below average for the country, but this is not the cheapest region.
Switching from a council property in Loughborough to a social rental in the East Midlands provides a broader base for our rent specification, subject to less arbitrary fluctuation from year to year. The switch to the new basis changes the published rent level relatively little for most households. For example, for a couple with two children it changes by about £1 a week on the new basis, and this makes a difference of less than 1 per cent to the annual earnings requirement of the family. The exception is the accommodation for a single person, a one-bedroom flat, which costs £10 a week more on the new basis, putting the pre-tax annual earnings requirement of a single person up by about £750 or 5 per cent. When making comparisons over time in the earnings requirement for a single person, below, we correct for the effect of this change in method.

A minimum income standard for the UK in 201224
In addition to this methodological change, the rents used in MIS have increased in recent years, as social housing rents have systematically outstripped inflation. In April 2012, for example, the general increase applied across social housing was 6.1 per cent, compared with an increase of 3.0 per cent in the Consumer Prices Index (CPI). Government policy is to continue to raise social rents, and eventually to make them roughly 80 per cent of local market rents. This will put systematic upward pressure on the minimum earnings that will be needed to achieve an acceptable living standard.
Other housing costsCosts for water rates and household contents insurance were based on those for properties of the relevant size in social housing stock in the Loughborough area. Council Tax shows the East Midlands average in the relevant band.
ChildcareThe number of hours of childcare required for parents to be able to work, and the type of childcare that is acceptable, is specified in consultation with MIS groups. In 2012, we have made an adjustment to the specification of the hourly cost of childcare.2 We have used figures from the Daycare Trust’s childcare costs survey, the most extensive such survey available. In this case, we used an average from a broader geographical area than the East Midlands, which was used for social housing. The survey produces less stable figures for a single region than for several regions because of differences in the local authorities that respond to the survey from year to year. A ‘central England’ area combining the East and West Midlands and East of England provides a more stable representation of average costs in relatively cheap parts of the UK than the East Midlands alone.3 In fact, as shown in Figure 3, there has been convergence in costs across areas other than London and the South East: the most expensive region in these areas is now just 17 per cent more costly than the least expensive, compared with 30 per cent in 2008.
Figure 3 shows that the rapid rise in London childcare costs, which have been widely commented on, has been less severe in other parts of the country. However, this difference is relative. Childcare fees rose by over 50 per in London between 2008 and 2012, and by 30 per cent on average in other parts of the UK, but this latter increase was still about twice the rate of general inflation. Offsetting this increase in the MIS childcare figures for 2012 is the inclusion for the first time of the 15 hours of free childcare available for 3- and 4-year-olds. In 2008, parents did not think they could count on taking up this relatively new entitlement, which was hard to claim through a childminder. In 2012, take-up has widened and over 90 per cent of families using childminders are claiming at least some free provision (Department for Education, 2011, Table 4.18). Families in our research agreed that we should assume that it is taken up.
The childcare budgets used in MIS assume that parents who work will use a childminder for all children under 11, except at times when they are either at school or paid for by redeeming the 15 hours a week of childcare vouchers available to parents of 3- and 4-year-olds.

25Updating the minimum in 2012 – new research
Figure 3: The rising cost of childcare (25 hours of childminding, £ per week, 2008–12)
Yorkshire & Humberside North West East Midlands
160
140
120
100
80
60
40
20
02008 2009 2010 2011 2012
Inner London Outer London South East South WestWales Scotland East of England North East
“Central England” = average of East and West Midlands and East of England
West Midlands
£ pe
r w
eek
Source: Daycare Trust
Comparison with actual spending by families
The minimum budgets produced in MIS are not directly connected to actual household spending. They are what groups have decided families need, not what they are able to afford. Nevertheless, it is relevant to put these findings in the context of household spending patterns. One reason for doing so is that a minimum would not seem plausible if it consistently specified a standard of living significantly above the level that most people actually live at in the UK in 2012. As part of the MIS exercise, in any cases where initial estimates seem to indicate that ‘minimum’ spending is surprisingly high relative to the norm, we check with final groups whether this is acceptable.
Table 2 compares family MIS budgets for April 2012 with average spending of families of the same types, estimated using spending surveys.4 This analysis shows that, overall, the minimum for a couple with two children is well below the average spent by families with two children; for lone parents, the minimum is only just below average spending. This finding is consistent with those of the original 2008 study when MIS levels were well below average spending for pensioner couples, single working-age adults and couples with children, but closer to average for lone parents (Bradshaw et al., 2008, pp. 32–5). It is unsurprising that average spending is lower relative to a socially defined minimum among lone parents than the other groups considered here, since a much larger proportion of this group live in poverty and are unable to afford what they need. In 2009/10, 46 per cent of individuals in lone-parent families were living below 60 per cent of median income after housing costs, compared with 22 per cent on average (DWP, 2011). While spending patterns do not

A minimum income standard for the UK in 201226
Table 2: Comparison of MIS and average spending by category (April 2012 prices)
Category Couple, 2 children Lone parent, 1 childMean
spendingMIS
requirementMIS as % of mean
Mean spending
MIS requirement
MIS as % of mean
£ per week £ per weekFood 131.07 99.55 76.0% 61.12 51.81 84.8%Alcohol 18.38 6.84 37.2% 7.25 6.53 90.1%Tobacco 4.96 0.00 0.0% 5.46 0.00 0.0%Clothing 40.68 38.69 95.1% 18.88 19.14 101.4%Water rates 7.84 8.99 114.6% 6.76 8.55 126.5%Council tax 28.14 22.30 79.2% 21.28 16.72 78.6%Household insurances
7.70 2.40 31.2% 3.23 2.37 73.5%
Fuel* 27.85 22.88 82.2% 17.90 18.89 105.5%Other housing costs
22.30 9.76 43.7% 9.34 3.62 38.7%
Household goods
50.98 26.81 52.6% 22.11 22.57 102.1%
Household services
68.63 7.74 11.3% 32.47 7.02 21.6%
Personal goods and services
30.56 41.27 135.0% 14.51 28.13 193.8%
Motoring 110.28 60.25 54.6% 32.40 47.61 147.0%Other travel costs
10.58 13.77 130.1% 4.85 1.13 23.2%
Leisure 119.43 93.28 78.1% 40.35 41.51 102.9%Total excluding rent and childcare
679.37 454.52 66.9% 297.90 275.59 92.5%
Note: * Owing to measurement difficulties, domestic fuel spending is based on pre-2008 data, uprated by inflation.Source: Expenditure and Food Survey, Living Costs and Food Survey, Department for National Statistics.
conform exactly to income patterns, the income constraint for lone parents is bound to affect their average spending levels.
Overall, both the lone parent and the couple MIS budgets have increased markedly as a percentage of average spending since 2008. The biggest single factor has been the change in the transport budgets. In 2008, minimum transport spending specified by MIS was only about a third of average transport spending for couples with children, and only half among lone parents. This corresponds with the fact that better-off families generally devote a much higher proportion of their spending to transport than those on lower incomes. In 2012, however, the MIS budgets specify over 60 per cent of average spending by couples with children and more than the average spent by lone parents (for whom the average is influenced by the many who cannot afford a car). Clearly, this change is driven by the fact that reliance on public transport is no longer considered acceptable for families with children. It shows the importance to overall family budgets of no longer being able to use public transport to achieve an acceptable living standard more cheaply than the average family that uses a car.
When transport is taken out of the total, MIS represents a similar percentage of the average family spending in 2012 as in 2008. (This may be a slightly out of date picture, since in order to get a large enough sample, the data used spans several years, so the effect of incomes recently rising more slowly than MIS levels will not show up fully.) In most areas, budgets remain well below average spending for couples with children, and close to average for lone parents. The most important exception is personal goods and services. Even in 2008, this was relatively high in comparison with average spending,

27Updating the minimum in 2012 – new research
and a jump in specification for this area is likely to be due partly to a new method of measurement. However, as discussed above, the fact that this part of the budget is well above average spending was highlighted to the group finalising the budgets. The group looked again at how this could truly represent a necessary minimum, and the published figures are the result of this deliberation.
Results of new research: discussion
While many individual changes in the specification of MIS budgets have been noted above, it is important to emphasise the high degree of continuity that has emerged from this research. In most respects, the baskets of goods and services described as needed for a minimum acceptable standard of living in 2012 look very similar to those of four years earlier. Given that the previous research was carried out mainly in 2007, well before recession hit the UK, this finding is important. Four years of hard times have not caused people to redefine fundamentally what households need ‘in order to have the opportunities and choices necessary to participate in society’.
Nevertheless, the cost of meeting a minimum standard of living is evolving in three significant ways. One is that, in a changing world, new things become necessities. Since 2008, the most significant of these have been the spread of computers and the internet as ‘necessities’ to all non-pensioner households and the reduction of the role that public transport plays in meeting households’ minimum travel requirements. The second is that people have not changed their basic attitude to social participation, but have found more economical or modest ways of achieving a minimum level – for example, by eating out less frequently or spending less on presents. The third is that certain essential costs have gone up sharply, more so than is captured by inflation indices. In particular, the rising cost of social housing and childcare can have huge effects on minimum household spending requirements.
As will be seen in the chapters that follow, the net effect of these changes is to make it harder for families with children, in particular, to meet minimum living standards. The above comparison with spending shows that MIS is rising as a proportion of what people actually spend. Although it is still below average spending, an increasing proportion of families will not have the means to meet MIS requirements, which are growing much faster than actual incomes. In a world where the real level of family incomes has fallen, the relative stability of what people define as being needed makes it inevitable that many families will not have enough.

28
3 INCOME REQUIREMENTS AND COMPARISON WITH BENEFITS, WAGES AND THE POVERTY LINE
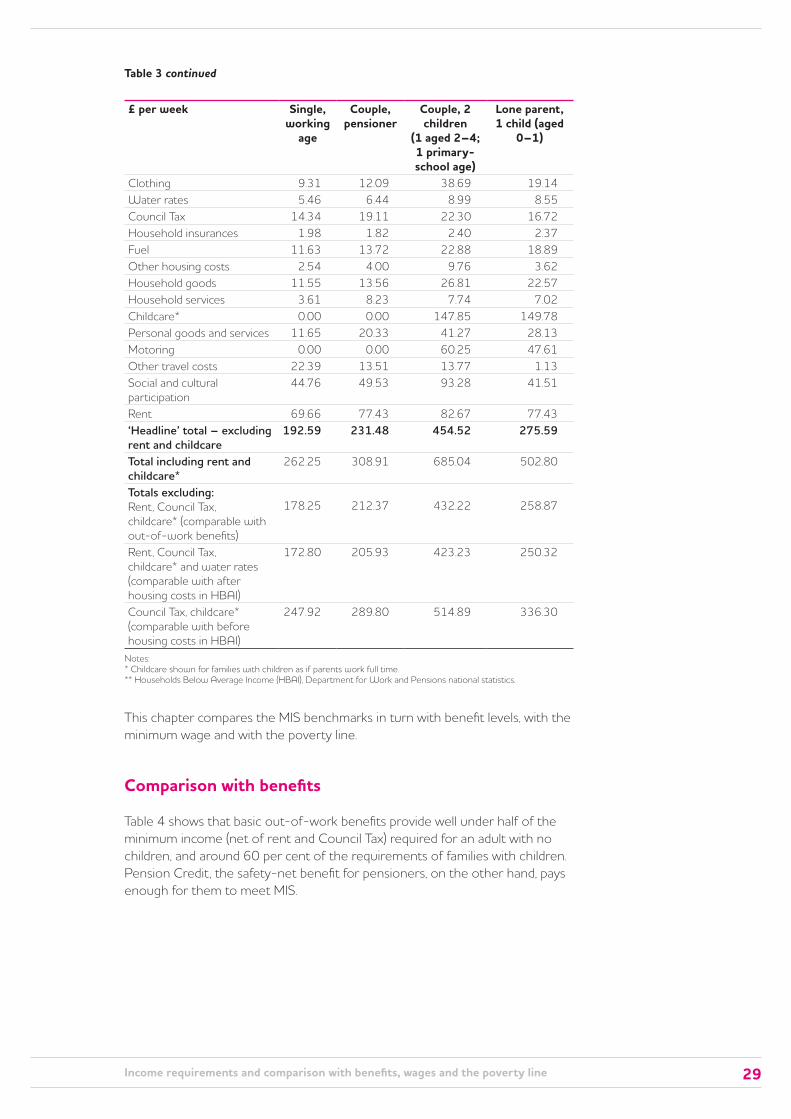
Table 3 brings together the results of the research reported in the previous chapter, summarising the MIS budgets for 2012 for four household types.
More detailed results are shown in the online Minimum Income Calculator (CRSP, 2012a), which allows budgets to be calculated for most types of household where a single adult or a couple live on their own or with up to four dependent children. The calculator also allows items such as housing costs to be adapted to individual circumstances. Spreadsheets showing the budgets for eleven different household types over time are also available online (CRSP, 2012b). In addition, Appendix I to this report gives totals for eleven household types and summarises what has happened to MIS budgets and income requirements since the first results in 2008.
Table 3: Summaries of MIS for four family types, April 2012
£ per week Single, working
age
Couple, pensioner
Couple, 2 children
(1 aged 2–4; 1 primary-school age)
Lone parent, 1 child (aged
0–1)
Food 48.25 60.46 99.55 51.81Alcohol 5.13 8.67 6.84 6.53Tobacco 0.00 0.00 0.00 0.00
29Income requirements and comparison with benefits, wages and the poverty line
£ per week Single, working
age
Couple, pensioner
Couple, 2 children
(1 aged 2–4; 1 primary- school age)
Lone parent, 1 child (aged
0–1)
Clothing 9.31 12.09 38.69 19.14Water rates 5.46 6.44 8.99 8.55Council Tax 14.34 19.11 22.30 16.72Household insurances 1.98 1.82 2.40 2.37Fuel 11.63 13.72 22.88 18.89Other housing costs 2.54 4.00 9.76 3.62Household goods 11.55 13.56 26.81 22.57Household services 3.61 8.23 7.74 7.02Childcare* 0.00 0.00 147.85 149.78Personal goods and services 11.65 20.33 41.27 28.13Motoring 0.00 0.00 60.25 47.61Other travel costs 22.39 13.51 13.77 1.13Social and cultural participation
44.76 49.53 93.28 41.51
Rent 69.66 77.43 82.67 77.43‘Headline’ total – excluding rent and childcare
192.59 231.48 454.52 275.59
Total including rent and childcare*
262.25 308.91 685.04 502.80
Totals excluding: Rent, Council Tax, childcare* (comparable with out-of-work benefits)
178.25 212.37 432.22 258.87
Rent, Council Tax, childcare* and water rates (comparable with after housing costs in HBAI)
172.80 205.93 423.23 250.32
Council Tax, childcare* (comparable with before housing costs in HBAI)
247.92 289.80 514.89 336.30
Notes:* Childcare shown for families with children as if parents work full time.** Households Below Average Income (HBAI), Department for Work and Pensions national statistics.
This chapter compares the MIS benchmarks in turn with benefit levels, with the minimum wage and with the poverty line.
Comparison with benefits
Table 4 shows that basic out-of-work benefits provide well under half of the minimum income (net of rent and Council Tax) required for an adult with no children, and around 60 per cent of the requirements of families with children. Pension Credit, the safety-net benefit for pensioners, on the other hand, pays enough for them to meet MIS.
Table 3 continued

A minimum income standard for the UK in 201230
Table 4: MIS compared with out-of-work benefits, April 2012
£ per week Single, working age
Couple, pensioner,
Couple, 2 children
Lone parent, 1 child
MIS excluding rent, Council Tax and childcare*
178.25 212.37 432.22 258.87
Income Support**/Pension Credit
71.00 221.74 258.83 153.39
Difference (negative number shows shortfall)
-107.25 9.37 -173.39 -105.48
Benefit income as % of MIS 40% 104% 60% 59%Notes: * Childcare, where appropriate.** Including Child Benefit, Child Tax Credit and Winter Fuel Payment.
In April 2012, benefits rose by 4 to 5 per cent, faster than general prices, which rose by 3 per cent. This was caused by the fact that inflation had been higher in September 2011 when the increases were set than it was seven months later. (The previous year, the reverse had been true, causing benefits to rise more slowly than general prices.) However, this small improvement in the real value of benefits has different outcomes for different family types, according to how MIS budgets have been changing for each of them:
• The pensioner couple budget has declined in real terms (in cash terms it is similar in 2012 to 2011) owing to various small changes, including modest reductions in budgets for eating out and for giving each other presents. As a consequence, the adequacy of benefits relative to the benchmark improved markedly. In 2008, the pension credit had provided 5 per cent more than a pensioner couple needed; this had slowly eroded so that by 2011 it exactly matched the income standard. In 2012, it has grown again, to 4 per cent above the requirement.
• The single adult’s budget stayed about the same in real terms, so the above-inflation increase in Income Support brought a minor improvement in benefit adequacy, which nevertheless remains at only 40 per cent of the MIS requirement.
• The substantial increase in the MIS budgets for families with children (associated especially with the rise in transport costs described in Chapter 2) has caused an erosion in the adequacy of their benefits, especially for lone parents. A lone parent with one child gets 59 per cent of what the family needs through benefits, compared with 68 per cent in 2008. For a couple with two children, the fall has been smaller, from 63 to 60 per cent.
Comparison with the poverty line
The most common definition of the ‘poverty line’ is 60 per cent of median household income. In order to compare this with the minimum required for a socially acceptable living standard, Table 5 looks at the percentage of median income represented by a MIS budget. This uses the latest available data from the Households Below Average Income (HBAI) series (Department of Work and Pensions, 2012), which is for 2010/11, and compares it with the average of the 2010 and 2011 MIS budgets.

31Income requirements and comparison with benefits, wages and the poverty line
Table 5: MIS compared with median income 2010/11
£ per week Single, working age
Couple, pensioner
Couple, 2 children
Lone parent, 1 child
a) Before housing costs: median income 2010/11 *
281 419 587 365
MIS excluding childcare and Council Tax
220 277 465.95 293
MIS as % of median 79% 66% 79% 80%
b) After housing costs: median income 2010/11 *
208 359 503 280
MIS excluding childcare, Council Tax, water rates and rent
161 203 386.23 216
MIS as % of median 77% 57% 77% 77%Note: * Adjusted for household composition (i.e. median income is shown as higher for larger households and lower for smaller ones, according to a formula that assumes greater needs for larger families).
While the data shown covers incomes both including and excluding money spent on housing, the more meaningful comparison is between net MIS budgets and income after housing costs. This is because the rent figure in the MIS budgets cannot give a single accurate representation of the ‘minimum’ cost of housing, since the housing options that are actually available vary so greatly from one household to another.
The results show, as previously, that most budgets are significantly above the official poverty line. The one exception among all the family types in MIS is pensioner couples, whose minimum requirement after housing costs is slightly below the poverty line. However, even in this group, the majority will effectively require more than the 60 per cent median because most pensioners live in houses rather than flats as assumed for the minimum, and this imposes extra expenses, such as higher heating costs.
These figures show that the percentages of median income required for MIS have been growing during the present economic period. See Section d) in the table in Appendix. This is because the MIS level has maintained and in come cases increased its value in a period when median incomes have shrunk in real terms. This trend is likely to be confirmed as more recent income data for the present period becomes available – particularly for families with children, whose MIS requirements have been growing fastest. The exception is likely to be pensioners in 2012, where for the first time a MIS budget has risen significantly slower than inflation. This means that pensioner requirements as a percentage of median income are likely to remain relatively low.
Comparison with the National Minimum Wage
Previous MIS reports have noted that few families can expect to reach a minimum income as defined by MIS as a result of having one person working full-time on the NMW. Table 6 shows that this remains the case in 2012.

A minimum income standard for the UK in 201232
Table 6: Gross earnings required to meet MIS, April 2012
Single, working
age
1-earner couple, 2 children,
no childcare
2-earner couple, 2 children, with
childcare
Lone parent, 1 child,
with childcareMIS (including rent, childcare* and Council Tax), weekly
262.25 537.19 685.04 502.80
Gross earnings required, weekly
314.19 668.95 704.37 457.61
Hourly wage rate 8.38 17.84 9.39 12.20Amount above the NMW, hourly
2.30 11.76 3.31 6.12
Annual earnings required
16,383 34,881 36,728 23,861
Note: * Childcare, where specified.
The gap between the NMW and the wage needed to reach the MIS has widened for all groups in recent years, as the NMW rises more slowly than headline inflation, but minimum living costs rise more quickly. The gap has widened especially fast for families with children in the past two years. Whereas in 2010 a couple with two children, with both parents working full-time, could reach an acceptable living standard with a wage about 30 per cent above the NMW, this has risen to over 50 per cent in 2012. Various factors have contributed to this, including the fact that the NMW is rising more slowly than inflation, cuts in tax credits and the increase in family transport needs (see Chapter 4).
The ‘gearing’ effect of the tax credit system is a crucial influence explaining why the gap between requirements for MIS and the NMW has increased so significantly for families with children. At present, for every £1 that a low-income family with children requires to meet an additional need or to make good a cut in state support, they must earn an extra £3.70, since nearly three-quarters of their additional earnings will be lost in taxation and reduction of income-dependent tax credits. Looked at another way, two-earner families in jobs paying about a third above the NMW are now falling somewhat short of meeting their needs, even with help from the state, but they would need big pay increases to make up the difference because the state will withdraw this support rapidly as their pay rises. Separate calculations about the implications for updating the level of the ‘living wage’ will be made later in 2012.

33
4 CHANGES IN MIS 2008–12 – DRIVING FORCES
The 2012 MIS represents the most thorough updating of the standard since it was launched in 2008. This is an appropriate time to review the trends in MIS as an income benchmark, and what lies behind changes in the level.
Figure 4 shows what has happened to weekly MIS budgets after rent and childcare, both in absolute terms and in relation to the general inflation rate. This indicates that although budgets have risen for all groups, the extent to which this exceeds inflation varies across household groups.
For families with children, the budgets have gone up significantly faster than inflation, rising 8 per cent for the couple and 15 per cent for the lone parent in our examples, after correcting for the CPI, the government’s preferred inflation measure. As set out in more detail below, this has been influenced by changes in the content of the MIS budgets, and also by faster than average inflation for items in the MIS baskets.
For single people, the increase has been 7 per cent after CPI, over four years. About half of this can be attributed to higher inflation rates for items such as food and public transport pushing up the extra cost of a minimum basket faster than the general inflation rate. The remaining small ‘real’ growth in the single person’s basket can be explained by the addition of a computer and the internet as necessities (representing 3 to 4 per cent of the present basket).
In the case of pensioners, the cost of the basket has grown at about the same rate as CPI. Given that this basket too is weighted towards items with relatively high inflation rates, this represents a small shrinkage in the real value of the pensioner basket. This is attributable to a range of minor revisions in the latest review of pensioner budgets, including more modest requirements for eating out and a reduction in the amount that pensioners are assumed to need for glasses, based on the use of low-cost opticians.

A minimum income standard for the UK in 201234
Figure 4: Minimum household budgets 2008–12 (£ per week after rent and childcare)
500
400
300
200
100
0 2008 2009 2010 2011 2012
SinglePensioner, coupleLone parent, 1 childCouple, 2 children
ActualSinglePensioner, coupleLone parent, 1 childCouple, 2 children
Adjusted for CPI
£ pe
r w
eek
Note: Dashed lines show after-inflation values (corrected for CPI increase since 2008).
As shown in Chapter 3, MIS can be used to consider not just the budgets that households need in order to afford MIS, but also how much they need to earn in order to afford these budgets. These ‘earnings requirements’ have changed and are influenced both by changes in the budgets and by changes in the tax and benefits system that determine the relationship between gross earnings and final take-home incomes.
For a single person, required annual earnings have increased from £13,400 to £16,400 since 2008. This increase is in line with inflation, once we take account of an alteration in the way that MIS counts housing costs (which adds £750 to the single person’s requirement: see Chapter 2). On the one hand, the cost of the budget has grown slightly faster than general inflation, for reasons explained above. In addition, social rents have risen faster than inflation, putting up minimum housing costs. On the other hand, these factors have been balanced by a substantial increase in the tax-free personal allowance, which reduces the amount of pay required to obtain a given net income. Had the personal allowance only been uprated by inflation since 2008, a single person would have needed to earn an additional £560 a year to reach the minimum.
Note that while the single person’s budget rose by a similar amount to inflation overall, it grew more than average earnings or the NMW, both of which have been falling behind price rises. Average earnings rose by just 5 per cent over the four years, and the NMW by 10 per cent, compared with a 14 per cent increase in CPI.
In the case of families with children, there has been a significantly greater increase in earnings requirements. In 2008, a couple with two children, both working full-time, each needed to earn £13,900 to reach MIS, a similar amount to single people. In 2012, this has risen to £18,400, well above the single person’s rate. For lone parents, the change has been more striking still, with the requirement rising from £12,000 to almost £24,000 a year.
In percentage terms, these steep increases in the earnings that families with children need in order to make ends meet are considerably greater than the extra costs that they are incurring. To afford such additional costs, their

35Changes in MIS 2008–12 – driving forces
earnings have to increase by a lot more than the costs themselves, since families lose benefits and tax credits while also paying additional tax whenever their earnings rise.
Figure 5 helps put the changes into context. It shows, at the left-hand side of the diagram, that, at present, households on the NMW do not reach MIS. However, helped by tax credits and housing benefits, lone parents get closer to MIS than single people or couples with children – having about 10 per cent less than what they need. But as earnings rise, this support disappears particularly rapidly for lone parents, meaning that even with double the NMW, close to the median wage, they can only just enjoy a minimum income standard. This is because every time the lone parent’s wage rises by £1, the family loses 32p in tax and national insurance and 41p in tax credits. On the lower range of earnings shown here, they also lose an additional 18p in Housing Benefit and (on earnings below £13,600 a year) 5p in Council Tax Benefit. Just to be £1 a week better off, they require an annual pay rise of over £1,000.
Note that, because lone parents’ earnings requirements are thus highly sensitive to precise spending needs, the amount that a lone parent needs to make ends meet varies considerably according to the number and age of children, which determines the required budget. The lone-parent family type used as an example in MIS reports, one child aged under 2, has seen a particularly steep percentage rise in required earnings. This has happened because the addition of a car adds proportionately more to costs for smaller families, and because an under-two is now the only case of a child with no free care from school or nursery, with the family facing the brunt of full-priced childcare and reduced support for it through tax credits. A lone parent with a primary school-aged child now requires earnings nearly £2,000 below a lone parent with a child under two. On the other hand, families with more children need higher incomes to make ends meet, and, for example, a lone parent with two children aged 3 and 7 would need to earn over £4,000 more than the one in our core example.
Figure 5 shows that, compared to lone parents, single people without children, who rely on less in-work support and have lower needs, reach MIS more quickly. The bottom line on the chart is relatively steep because single people without children keep a relatively large amount of each extra pound that they earn. If they earn more than about £7 an hour full time, they are not entitled to tax credits, and therefore do not face losing them as earnings rise further. Couples with children, who do receive tax credits (but not Housing Benefit across most of the wage rates shown in Figure 5), lose much of their extra income, but not as much as lone parents. They need to earn about 50 per cent more than the NMW to reach MIS.
This has two important implications. One is that we must be careful not to misinterpret large increases in earnings requirements for families with children. These can arise (as they do for lone parents) not because those stuck on low earnings end up with a lot less than they need, but because making up a small increase in a budget requirement would require a large increase in earnings. So having half the required earnings does not mean enduring half the required standard of living. The other point, however, is that this shows how families depending on a large amount of means-tested support have to accept severe limitations on material aspirations – on how far they might expect to improve their living standards, even with improved earnings. This point is developed in more detail in discussion of Figure 7.
Helped by tax credits and housing benefits, lone parents [on NMW] get closer to MIS than single people or couples with children.

A minimum income standard for the UK in 201236
Figure 5: Pay and net income compared with MIS, 2012 (families where all adults work full-time)
Key:
Couple 2 children: Actual net income MIS +/– 10%
600
500
400
300
200
100
0 £6.08 £7.08 £8.08 £9.08 £10.08 £11.08 £12.08
(minimumwage)
Net
inco
me
£ pe
r w
eek
afte
r ho
usin
g an
d ch
ildca
re
Hourly wage
Lone parent: Actual net income MIS +/– 10%
Single: Actual net income MIS +/– 10%
How important are different influences on changes in minimum income requirements?
The past four years have been unstable times in terms of the factors that influence MIS. Volatile prices, austere economic times, changes in levels of subsidy for services such as social housing and public transport, and reform of the benefits and tax credits system all interact with the MIS specifications.
These factors have not always had particularly large effects. As set out above, the budgets for pensioners and for working-age adults without children have changed relatively little, with some things becoming more expensive and small additions to and subtractions from the basket, but no large change in the overall budgets. For working households without children, moreover, the increase in tax allowances has helped compensate for some extra costs, so that earnings requirements are similar to those in 2008 after correcting for inflation.
In the case of families with children, on the other hand, there have been much larger changes both in budgets and in levels of help from the state. Some changes have reduced and others raised the amount that families need to earn in order to make ends meet, but the overall amount has increased by much more than inflation.
Figure 6 gives an overview of this increase in earnings requirements since 2008 and some of the factors contributing to it. Using the example of the couple with two children, it shows that the biggest single factor that increases the requirement is the addition of a car to the budget. Without this change, the earnings requirement would be reduced by about £5,000 in 2012, to a similar level to the 2008 requirement uprated by CPI. However, this does not mean that transport has been the only factor that has changed. A number of other important factors have increased earnings requirements, while others have decreased them, and these have come into play at different times. By 2011, the requirement even without the car had risen sharply, influenced by high inflation rates for items in the MIS budgets and by cuts in tax credit entitlements. In 2012, this has been offset to a considerable extent by rising tax allowances and more modest specification of leisure budgets.
Figure 7 illustrates these multiple influences in much greater detail. This is not a comprehensive account of the many small changes that affect income requirements, but identifies the influence of a number of factors that have had a marked effect on this illustrative family type.

37Changes in MIS 2008–12 – driving forces
Figure 6: Influences on minimum family income requirements, 2008–12 (summary)(example of a couple with two children, with both parents working full time)
£5,000TOTAL (inflation-adjusted)
Due to use of car
Due to additional inflation in minimumbudget
Due to reduction in Childcare Tax Credit
Due to steeper tax credit taper
Due to higher social housing cost
£5,300
£4,200
£3,000
£2,100
£700
Due to higher but subsidised childcare fees
Due to higher Child Tax Credit
Due to higher tax allowance
Due to lower cost of social participation
£0
–£800
–£2,900
–£2,100
–£4,000
Notes:Each bar compares the actual earnings requirement for this family in 2012 with what it would have been in a different scenario. The higher bars, showing positive values, indicate that families need to earn more as a result of change compared to the specified scenario. The scenarios are:Total (inflation-adjusted): if earnings requirement in 2008 had just risen with CPI.Due to use of car: if transport costs in 2012 were the same, inflation-adjusted, as in 2008, when no car was specified.Due to additional inflation in minimum budget: if the price of goods and services in the 2012 budgets had all risen in line with the whole CPI, rather than some categories inflating faster than others.Due to reduction in Childcare Tax Credit: if CCTC still paid up to 80% of childcare costs rather than 70%.Due to steeper tax credit taper: if tax credits were still reduced by 39p for each extra £ of earnings, rather than 41p.Due to higher social housing cost: if social rents had risen only by CPI.Due to higher but subsidised childcare fees: if childcare costs had only risen by CPI, but like in 2008, 15 hours’ free childcare for 3- to 4-year-olds was not subtracted from costs.Due to higher Child Tax Credit: if the Child Tax Credit had not been raised faster than CPI.Due to higher tax allowance: if tax allowances had not been raised faster than CPI.Due to lower cost of social participation: if budgets for recreation, eating out and presents were the same as in 2008, inflation-uprated.
The left-hand side of the diagram shows some of the factors that have contributed to change in the net outgoings that a family needs in order to meet an adequate living standard. The largest of these is the need for a car, which has added £29 a week to what the transport budget would now be, had it just consisted of the public transport and occasional taxi costs set in 2008, uprated by transport inflation. This accounts for the bulk of the overall increase in the family budget of £32. However, there have also been other factors at work, some raising the budget and others lowering it. In particular, the higher than average increase in the cost of food and some other essentials has meant that the 2012 basket costs £21 more than it would have, had it just gone up in line with the official inflation rate. The more modest specification of some leisure activities, such as eating out and present giving, offsets other increased costs by £25 a week. Various other smaller changes largely cancel themselves out, including some small changes in the ways in which budgets were compiled (in particular, see the section on personal goods and services in Chapter 2.)
As shown on the right-hand side of Figure 7, the overall increase in this family’s budget requirement feeds through into a proportionately much larger increase in the amount that the family needs to earn in order to afford thebudget. As shown above, this multiplier effect is due to the sharp withdrawal of a family’s additional income through taxation and reduced tax credits, so that it is difficult to make up a shortfall. The couple with two children with enough to afford MIS has income much too high to be eligible for Housing Benefit.

A minimum income standard for the UK in 201238
Figu
re 7
: Infl
uenc
es o
n m
inim
um fa
mily
inco
me
requ
irem
ents
, 200
8–12
(det
ail).
The
exa
mpl
e of
a c
oupl
e w
ith 2
chi
ldre
n, w
ith b
oth
pare
nts
wor
king
full-
time
1. In
fluen
ces
on b
udge
t lev
el
HIG
H IN
FLA
TIO
N R
ATE
FO
RES
SEN
TIA
LSC
ost o
f min
imum
bas
ket r
ises
fast
er th
an g
ener
al C
PI
HIG
HER
TRA
NSP
ORT
CO
STS
Fam
ilies
in 2
012
say
it is
no
long
er p
ossib
le to
do
with
out
a ca
r, ra
ising
tran
spor
t cos
ts
LOW
ER S
OCI
AL
PART
ICIP
ATI
ON
BU
DG
ETFa
ll in
min
imum
spe
ndin
g re
quire
men
t for
eat
ing
out,
recr
eatio
n an
d pr
esen
ts
2. T
heir
effe
ct o
n th
e w
eekl
ybu
dget
tota
l
NB
: Wee
kly
budg
et a
rrow
s sh
ow %
effe
ct o
n th
e to
tal
budg
et. C
hang
es in
tran
spor
tan
d so
cial
par
ticip
atio
n co
sts
are
net o
f infl
atio
n
3. In
fluen
ces
on e
arni
ngs
requ
ired
MIN
IMU
M B
UD
GET
RIS
ES
MO
RE T
HA
N IN
FLA
TIO
NTh
e fa
mily
nee
ds £
32 (8
%)
mor
e a
wee
k in
201
2 th
an in
20
08, a
fter
cor
rect
ing
for C
PI
infla
tion.
(Thi
s ex
clud
es re
nt
and
child
care
)
CHA
NG
ES IN
MIN
IMU
M R
ENT
AN
D C
HIL
DCA
RE C
OST
SSo
cial
rent
s ha
ve ri
sen
4% re
lativ
e to
CP
I
Chi
ldca
re c
osts
hav
e ris
en 1
5%
rela
tive
to C
PI (
in c
entr
al E
ngla
nd)
Chi
ldca
re s
ubsid
y fo
r 3-
and
4-ye
ar-o
lds
CHA
NG
ES IN
TA
XES
AN
D
BEN
EFIT
SH
ighe
r per
sona
l tax
allo
wan
ces
Hig
her t
ax c
redi
t tap
er
Chi
ld T
ax C
redi
t inc
reas
ed
Low
er c
hild
care
tax
cred
it ra
te
4. T
heir
effe
ct o
n an
nual
ea
rnin
gs r
equi
red
5. A
nnua
l ear
ning
s re
quir
ed
In e
ach
case
, how
muc
h m
ore/
less
fam
ily w
ould
nee
d to
ear
n in
201
2 w
ithou
t thi
s in
fluen
ce,
othe
r thi
ngs
bein
g eq
ual.
Tota
l for
bot
h pa
rent
s
+£6,
100
(+20
%)
+£70
0 (+
2%)
+£1,
100
(+3%
)
–£2
,100
(–5%
)
+£3,
000
(+9%
)
–£2
,100
(–7%
)
+£2,
100
(+6%
)
–£2
,100
(–5%
)
Ea
ch
pare
nt
Tota
l 20
08:
£13
,900
£
27,8
0020
12:
£18
,400
£
36,7
00
Incr
ease
rela
tive
to C
PI:
+£2
,500
+£5
,000
(in 2
012
price
s)=+
16%
abo
ve in
flatio
n
+£21
(+5%
)
+£29
(+7%
)
–£2
5 (–
5%)

39Changes in MIS 2008–12 – driving forces
However, the combined effect of being on tax credits and paying income tax and national insurance creates a ‘withdrawal rate’ of 73 per cent. This means that it takes £3.70 of additional earnings to produce each £1 of extra take-home pay. Note that under the Universal Credit (UC) being introduced from 2013, this withdrawal rate will become even more severe, rising to 76 per cent. For some families who presently face even higher rates, this will be an improvement, but anyone on UC paying tax and national insurance will need to earn over £4 more in order to produce £1 additional take-home pay.
This multiplier effect does not just apply to the increase in the net MIS budget. The amount that families pay in rent and childcare varies greatly across families and is therefore considered outside the main MIS calculations, but in order to estimate minimum earnings requirements we need to use examples of modest costs in these categories (see Chapter 2). Both social housing and childcare have become considerably more expensive in recent years, and Figure 7 shows how these increases add to the rise in earnings requirements. At the same time, some policy changes have helped increase these requirements further, while others have helped reduce them. In particular, changes to tax credits have raised the requirement substantially. Higher personal tax allowances and Child Tax Credit have partly offset these increases. The more widespread use of subsidised childcare for 3- and 4-year-olds has also helped counteract the effect of less generous subsidies through the tax credit system. Although subsidised childcare existed as a policy in 2008, it was considered too hard to take up for it to be included in MIS. Overall, the effect of changes to tax credits and subsidies is broadly neutral over the period 2008–11, although the pain has mainly come more recently than the gain.
A significant feature of the arrows at the bottom of Figure 7 is that prominent Budget measures to help families on low income can be outweighed by less well-known measures that cut entitlements. The previous government’s flagship fiscal measure for cutting child poverty – increasing the Child Tax Credit – was initially carried through into the present administration. The Coalition then shifted resources into raising the personal tax allowance. Since 2008, these two measures have helped reduce substantially the amount that families need to earn to make ends meet. However, two Budget changes introduced in 2011 worked in the other direction, instantly cancelling out the combined effect of these two flagship policies over four years. The 2011 measures increased the rate at which tax credits are withdrawn (‘tapered’) as earnings rise and reduced the proportion of childcare costs eligible for tax credit support. A couple with two children, where both partners work full-time on modest pay, and require childcare, now need to earn around £300 more a year between them to reach a minimum living standard than if none of the above four measures had been introduced.
Note that the changes shown in the arrows in Figure 7 do not add up exactly to the totals that they point to, partly because the effect of each has been considered separately, whereas in practice they interact, and partly because this is not a comprehensive list of multiple influences. However, the diagram shows that there are multiple factors at work, each of which has the potential to make a substantial difference to families’ abilities to make ends meet. With further change coming through the wholesale reform to benefits and tax credits, starting in 2013, we can expect this volatile situation to continue. The changes brought in with UC will alter entitlements for individuals, while retaining high withdrawal rates on additional earnings.

40
5 RURAL BUDGETS – SUMMARY UPDATE
The main MIS budgets apply to urban areas but in 2010 different and additional costs for rural areas of England were calculated (Smith, Davis and Hirsch, 2010). Table 7 summarises the uprated rural budgets for 2012, using the example of people living in villages (one of the three rural situations examined). Further detail is in the summary figures on the MIS website (CRSP, 2012b). The Minimum Income Calculator (CRSP, 2012a) also allows up-to-date adjustments of results for rural areas, obtained by clicking on the ‘rural’ button on the first results page.
Note that even though children’s budgets have been rebased in 2012, this change applies to urban areas, and the rural budgets continue to be uprated with inflation.
Table 7: Summary of rural budgets 2012 – requirements for village residents
a) Net weekly spending requirementSingle,
working ageCouple,
pensionerCouple, 2 children
Lone parent, 1 child
Weekly budget excluding rent and childcare* (£)
229.64 292.85 515.25 304.55
% inflation rise since 2010
4.9% 4.9% 5.4% 7.1%
% of budget** provided by Income Support/Pension Credit
33% 81% 53% 53%
(continued overleaf)

41Rural budgets – summary update
Table 7 continuedb) Total income and earnings requirements for households with full-time earners
Single One-earner couple,
+ 2 children, no childcare
Two-earner couple,
+ 2 children, with childcare
Lone parent, + 1 child,
with childcare
Weekly budget including rent and childcare* (£)
307.08 597.91 745.76 531.75
Annual earnings required
19,820 39,091 47,146 29,452
Hourly wage requirement
10.14 19.99 12.06 15.06
Notes:* Childcare, where appropriate.** Excluding Council Tax
Budgets for families with children did not rise as fast in rural as in urban areas in 2012, because the former already included cars. However, the rural budgets remain well above the urban ones, partly because of high domestic fuel costs and partly because even those urban budgets that now require cars still specify smaller mileages (although for rural towns, the mileages are similar to those of urban areas). In a village, families with children now need close to average earnings in order to make ends meet. For those out of work, benefits provide only about a third of requirements for working-age households without children, a half for families with children and substantially below requirements for pensioners.
42
6 CONCLUSIONS
MIS was designed and first calculated in 2006–08, near the end of a long period of stability and continuity in many of the factors that influence living standards in the UK. Continuous economic growth for the previous 15 years had been combined with low inflation and a high degree of continuity in policies affecting personal incomes. Some slow-moving trends, such as the growing cost of public transport and the declining value of baseline benefits relative to average earnings, meant that the world was changing continuously, but slowly.
An important objective of MIS was to keep track of the ways in which, over the long term, minimum living standards changed relative to the general level of prosperity, as well as in comparison with trends in the actual level of incomes among worse-off groups.
In the economic turmoil that followed, one striking feature has been the extent of continuity: members of the public have not changed their minds fundamentally about what comprises a minimum acceptable living standard, which remains a combination of meeting physical needs and having the means to participate fully in society. For households without children, MIS looks much as it did in 2008, with some selected changes such as the inclusion of computers and the internet as essentials for all working-age adults.
For families with children, however, changes have been more marked. Given that the labour market does not generally link rewards to family costs, it has always been harder for working people in low-paying jobs to make ends meet if they have dependents. An important long-term trend from the mid-1990s to the late 2000s had been increasing intervention by the state to help compensate families for this disadvantage, and at the same time provide them with incentives to work. By 2008, this policy had succeed in enabling some families with children to reach an adequate living standard on very similar rates of pay to those needed by a single person without children. However, this situation proved fragile, and ironically it was made so partly by

43Conclusions
the consequences of the high dependency of low-income working families on transfers from the state. Not only has this made such families vulnerable to cuts in this support, but also the effects of such cuts and of increased spending requirements have been exaggerated by the ‘trap’ of high rates of withdrawal of the support in response to increased earnings.
These factors make families with children highly vulnerable to adverse influences on the earnings they need in order to make ends meet. In recent years, high inflation rates for some essential items, cuts in some entitlements and new spending needs (influenced in part by cuts in services) are likely to have created shortfalls for many families that will be hard to make good through increased earnings. Not all influences are negative, however. For example, the acceptability of more modest leisure budgets than four years ago and increases in personal tax allowances work the other way. Nevertheless, over the four years as a whole, the adverse forces have significantly outweighed the favourable ones.
The net result is that having children has a much greater impact on households’ ability to make ends meet than it did four years ago. This is a significant social change that has emerged over a very short period. As a new benefits system is put in place, the level and structure of support offered to such families will need to be carefully thought through in light of its effect on their ability to reach an acceptable living standard.

44
NOTES
Chapter 2
1 For a more detailed description of the review process see Davis, Hirsch and Smith (2010, pp. 12–13).
2 This change does not create a significant discontinuity in our calculation of MIS: the new method produces a very similar figure to the old method in 2012. However, the old method did not have a reliable means of showing year-on-year increases in childcare costs through the inflation index; in fact, it has been underestimating price rises. The 2008 figures specified higher childcare costs than using the new method based on Daycare Trust data, but by 2012 results using the two methods had converged.
3 Figures based on an average of local authority returns across all these regions, from data kindly supplied by the Daycare Trust.
4 For each family type, this combined data from the 2006 and 2007 waves of the Expenditure and Food Survey and the 2008, 2009 and 2010 waves of the Living Costs and Food Survey uses an average of figures from these surveys, in each case uprated to 2012 equivalent prices.

45
REFERENCESBradshaw, J., Middleton. S., Davis, A., Oldfield, N., Smith, N., Cusworth, L. and Williams, J. (2008) A
Minimum Income Standard for Britain: What people think. York: Joseph Rowntree Foundation
Campaign for Better Transport (2011) ‘New figures reveal cuts to 1 in 5 council bus services’, press release, 13 October 2011. Available at: http://www.bettertransport.org.uk/media/13-oct-1-in-5-buses-cut [Accessed 28 May 2012]
Collins, M., Mac Mahon, B., Weld, G. and Thornton, R. (2012) A Minimum Income Standard for Ireland: A consensual budget standards study examining household types across the lifecycle. Available at: https://www.tcd.ie/Communications/content/pdf/PolicyInstituteBP27Feb2012.pdf [Accessed 28 May 2012]
CRSP (Centre for Research in Social Policy) (2012a) Minimum Income Calculator. Available at www.minimumincome.org.uk
CRSP (Centre for Research in Social Policy) (2012b) Minimum Income Standard for the UK. Available at www.minimumincomestandard.org
Davis, A., Hirsch, D. and Smith, N. (2010) A Minimum Income Standard for the UK in 2010. York: Joseph Rowntree Foundation
Department for Education (2011) Childcare and Early Years Providers Survey 2010
Department for Transport (2011) National Travel Survey 2009/10. Available at: http://www.dft.gov.uk/statistics/tables/nts9902
Department of Work and Pensions (2012) Households Below Average Income (HBAI) 1994/95–2010/11. Available at: http://research.dwp.gov.uk/asd/hbai/hbai2011/index.php?page=contents [Accessed 28 May 2012]
Hirsch, D., Sutton, L. and Beckhelling, J. (2012, forthcoming) The Cost of a Child in 2012. London: Child Poverty Action Group
Hirsch, D., Sutton, E.A. and Beckhelling, J. (forthcoming) The Costs of a Child. York: Joseph Rowntree Foundation
House of Commons Transport Committee (2011) Bus Services after the Spending Review: Eighth report of session 2010–12. Available at: http://www.publications.parliament.uk/pa/cm201012/cmselect/cmtran/750/750.pdf [Accessed 28 May 2012]
Smith, N., Davis, A. and Hirsch, D. (2010) A Minimum Income Standard for Rural Households. York: Joseph Rowntree Foundation and Commission for Rural Communities
Smith, N., Davis, A. and Hirsch, D. (2011) A Minimum Income Standard for Guernsey. Available at: http://www.minimumincomestandard.org/downloads/Reports/CRSP_618_A_Minimum_Income_Standard_for_Guernsey.pdf [Accessed 28 May 2012]

46
APPENDIX SUMMARY OF MIS BUDGETS 2008–12
a) Minimum requirements, not including rent or childcare, £ per week
2008 2009 2010 2011 2012Single 158.12 165.82 175.34 184.68 192.59
Couple 245.03 256.35 272.55 286.79 301.74
Single, pensioner 131.98 138.53 147.41 154.62 158.74
Couple, pensioner 201.49 210.66 222.22 232.74 231.48
Lone parent, 1 child 210.31 220.11 233.73 246.37 275.59
Lone parent, 2 children 282.69 295.49 308.90 325.90 361.99
Lone parent, 3 children 379.94 396.28 406.15 429.19 457.66
Couple, 1 child 286.64 299.83 315.38 332.27 374.17
Couple, 2 children 370.05 386.96 402.83 424.65 454.52
Couple, 3 children 465.71 485.75 496.84 524.48 554.55
Couple, 4 children 504.69 526.44 539.08 569.27 605.80

47Appendix
b) % increase in minimum requirements
i) Annual inflation upratings (based on components of RPI)
2009 2010 2011 2012 Total 2008–12
Single 4.9% 3.3% 5.3% 4.8% 19.6%
Couple 4.6% 3.5% 5.2% 4.8% 19.4%
Single, pensioner 5.0% 3.0% 4.9% 4.7% 18.7%
Couple, pensioner 4.6% 3.2% 4.7% 4.8% 18.5%
Lone parent, 1 child 4.7% 3.2% 5.4% 5.2% 19.7%
Lone parent, 2 children 4.5% 3.5% 5.5% 5.3% 20.1%
Lone parent, 3 children 4.3% 3.7% 5.7% 5.3% 20.4%
Couple, 1 child 4.6% 3.4% 5.4% 5.0% 19.6%
Couple, 2 children 4.6% 3.6% 5.4% 5.0% 19.9%
Couple, 3 children 4.3% 3.8% 5.6% 5.2% 20.2%
Couple, 4 children 4.3% 3.8% 5.6% 5.2% 20.3%
ii) Change in composition of budgets
2010 (first MIS review)
2012 (second MIS review, and rebase of children’s budgets*)
Total 2008–12
Single 2.3% –0.5% 1.9%
Couple 2.7% 0.4% 3.2%
Single, pensioner 3.3% –2.0% 1.3%
Couple, pensioner 2.2% –5.1% –3.0%
Lone parent, 1 child 2.9% 6.4% 9.4%
Lone parent, 2 children 1.0% 5.5% 6.6%
Lone parent, 3 children –1.2% 1.3% 0.0%
Couple, 1 child 1.7% 7.3% 9.1%
Couple, 2 children 0.5% 1.9% 2.4%
Couple, 3 children –1.4% 0.5% –0.9%
Couple, 4 children –1.3% 1.1% –0.2%
Note: * Change in 2012 net of inflation
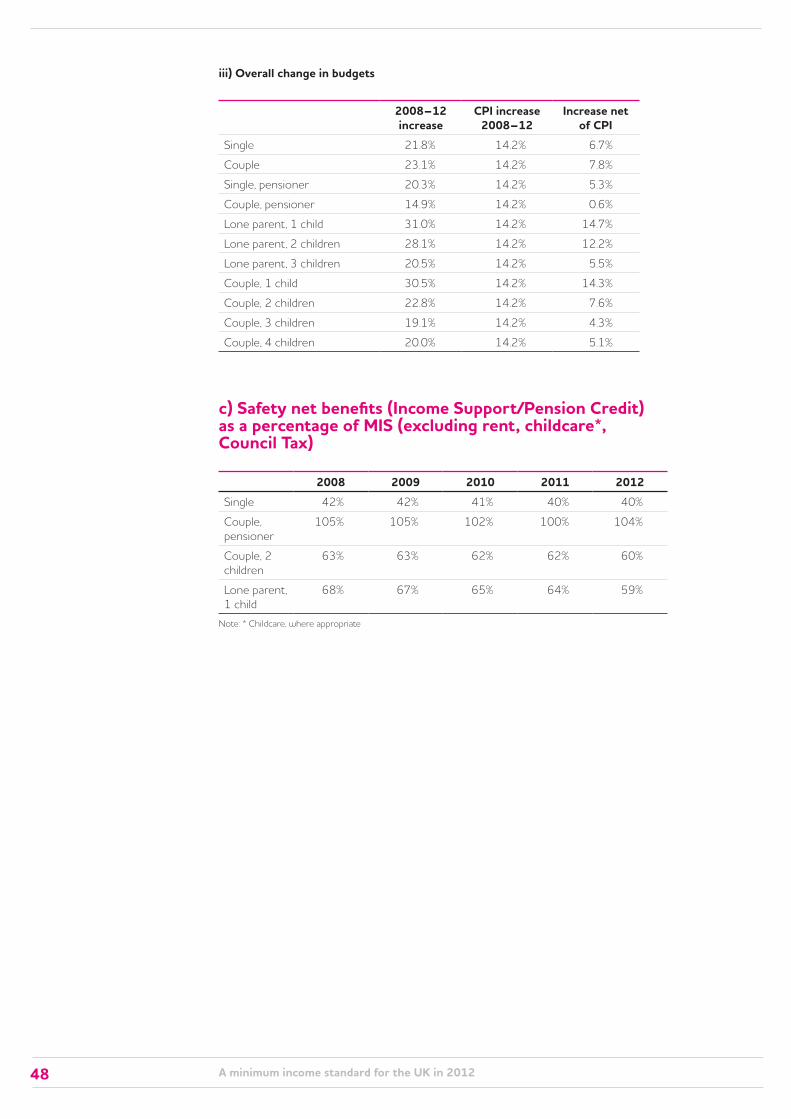
A minimum income standard for the UK in 201248
iii) Overall change in budgets
2008–12 increase
CPI increase 2008–12
Increase net of CPI
Single 21.8% 14.2% 6.7%
Couple 23.1% 14.2% 7.8%
Single, pensioner 20.3% 14.2% 5.3%
Couple, pensioner 14.9% 14.2% 0.6%
Lone parent, 1 child 31.0% 14.2% 14.7%
Lone parent, 2 children 28.1% 14.2% 12.2%
Lone parent, 3 children 20.5% 14.2% 5.5%
Couple, 1 child 30.5% 14.2% 14.3%
Couple, 2 children 22.8% 14.2% 7.6%
Couple, 3 children 19.1% 14.2% 4.3%
Couple, 4 children 20.0% 14.2% 5.1%
c) Safety net benefits (Income Support/Pension Credit) as a percentage of MIS (excluding rent, childcare*, Council Tax)
2008 2009 2010 2011 2012Single 42% 42% 41% 40% 40%
Couple, pensioner
105% 105% 102% 100% 104%
Couple, 2 children
63% 63% 62% 62% 60%
Lone parent, 1 child
68% 67% 65% 64% 59%
Note: * Childcare, where appropriate

49Appendix
d) MIS as % of median income
2008/9 2009/10 2010/11*Before housing costs
Single 74% 76% 79%
Couple, pensioner 62% 64% 66%
Couple, 2 children 75% 77% 79%
Lone parent, 1 child 75% 77% 80%
After housing costs
Single 72% 74% 77%
Couple, pensioner 53% 54% 57%
Couple, 2 children 73% 74% 77%
Lone parent, 1 child 72% 73% 77%
Note: * Survey data not available after 2010/11
e) Earnings required to reach MIS
£ per year 2008 2009 2010 2011 2012Single 13,450 13,859 14,436 15,000 16,383
Couple, 2 children, 1 earner
26,910 27,635 29,227 31,584 34,881
Couple, 2 children, 2 earners
27,792 27,940 29,727 36,800 36,728
Lone parent, 1 child 11,990 12,122 12,454 18,243 23,861
£ per hour
Single 6.88 7.09 7.38 7.67 8.38
Couple, 2 children, 1 earner
13.76 14,13 14.95 16.15 17.84
Couple, 2 children, 2 earners
7.11 7.14 7.60 9.41 9.39
Lone parent, 1 child 6.13 6.20 6.37 9.33 12.20

50
ACKNOWLEDGEMENTS
We wish to express our gratitude to the participants of the MIS groups for their diligence and hard work in helping to identify the elements of the 2012 Minimum Income Standard for the UK.
We would like to thank everyone who contributed to the construction and calculation of the budgets: Judith Paterson at the Child Poverty Action Group for updating the tax and benefit schedules for the Minimum Income Calculator; Bill Wilkinson of the Energy Audit Company, who provided expertise on social housing, fuel consumption and pricing; Sian Burr for her work on ensuring the nutritional adequacy of the food element; Nina Oldfield for her painstaking care in checking every aspect of the spreadsheets; Jill Rutter from the Daycare Trust, who provided advice and data to support the use of childcare cost calculations; Ian Hare at Go-Motoring, who calculated the cost of running a car; and Steve Wilcox for his valuable advice on the use of housing data.
At the Centre for Research in Social Policy (CRSP), Yvette Hartfree, Nicola Selby and Sharon Walker provided invaluable support, and we were grateful to BMG Research for its continuing assistance with participant recruitment.
We would like to express our appreciation to the Project Advisory Group for their insightful and constructive comments on this report: Laura Adelman (Child Poverty Unit), Alison Garnham (Child Poverty Action Group), Eddie Follan (Poverty Alliance), Dominic Fox (Association of Charitable Organisations), Alex Hurrell (Resolution Foundation), Robert Walker (University of Oxford) and John Veit-Wilson (University of Newcastle).
Thanks are also due to the Joseph Rowntree Foundation for its continuing support for MIS, and especially to Chris Goulden for his guidance, quality control and patient attention to the detail of MIS.

51
ABOUT THE AUTHORS
Abigail Davis is a Senior Research Associate at CRSP, with responsibility for leading the rebase and review elements of the MIS programme. She is a consultant on Minimum Income Standard projects in Japan and Portugal, and develops and delivers training to researchers aiming to develop budget standards in non-UK locations using the MIS approach.
Donald Hirsch is Director at CRSP, where he leads the Minimum Income Standard for the UK programme. A former journalist and writing and research consultant, he has been involved in MIS since its inception, and is responsible for the analysis of MIS data and its application in policy and practice. From 1998 to 2008 he was Poverty Adviser to JRF, where he wrote a number of major reports on child poverty, welfare reform, long-term care and the situation of older workers.
Noel Smith is professor of social policy at University Campus Suffolk. Formerly Director of CRSP, Noel has been involved in the MIS programme from the outset. As well as having an active role in the original project and subsequent review and rebase studies, he has been responsible for MIS research in rural areas, Northern Ireland and Guernsey.
Jacqueline Beckhelling joined CRSP as a Research Associate in September 2004. Her background is in statistics and operational research, and she has considerable experience of working with large and complex datasets using a wide range of statistical techniques.
Matt Padley is a Research Associate at CRSP where he works across the MIS programme, with responsibility for the management and analysis of MIS data. He is an experienced policy researcher and analyst and his principal interests lie in understanding the patterns, causes and consequences of social disadvantage.

Joseph Rowntree FoundationThe Homestead40 Water EndYork YO30 6WPwww.jrf.org.uk
© Loughborough University 2012First published 2012 by the Joseph Rowntree FoundationISBN: 978-1-85935-928-0 (pdf)Project managed and typeset by Cambridge Publishing Management Limited
The Joseph Rowntree Foundation has supported this project as part of its programme of research and innovative development projects, which it hopes will be of value to policy makers, practitioners and service users. The facts presented and views expressed in this report are, however, those of the authors and not necessarily those of JRF.
A pdf version of this publication is available from the JRF website (www.jrf.org.uk). Further copies of this report, or any other JRF publication, can be obtained from the JRF website (www.jrf.org.uk/publications) or by emailing [email protected]
A CIP catalogue record for this report is available from the British Library.
All rights reserved. Reproduction of this report by photocopying or electronic means for non-commercial purposes is permitted. Otherwise, no part of this report may be reproduced, adapted, stored in a retrieval system or transmitted by any means, electronic, mechanical, photocopying, or otherwise without the prior written permission of the Joseph Rowntree Foundation.