a methodology to determine soil moisture movement due to thermal gradients
TRANSCRIPT

A methodology to determine soil moisture movement due tothermal gradients
S. Krishnaiah a, D.N. Singh b,*
a Department of Civil Engineering, Indian Institute of Technology Bombay, Powai, Mumbai 400076, Indiab Geotechnical Engineering Division, Department of Civil Engineering, Indian Institute of Technology Bombay, Powai, Mumbai 400076, India
Received 26 February 2002; received in revised form 15 September 2002; accepted 25 October 2002
Abstract
Moisture and heat migration through the soil mass is an important consideration for the safety of electrical gadgets buried in the
soil mass. Continuous passage of current through these gadgets increases their temperature, which may result in redistribution or
migration of the moisture in the surrounding soil mass. Excessive changes in the soil moisture may lead to its thermal instability,
which may also affect the current carrying capacity of the electrical gadgets. To avoid such a situation, estimation of moisture
movement under an imposed thermal gradient becomes essential. With this in view, an attempt has been made in this paper to study
the influence of thermal gradient on moisture migration through the soil mass. Usefulness of an insertion tensiometer has been
demonstrated, for this purpose, when the soil water characteristic curve, SWCC, for the soil is already established.
� 2003 Elsevier Science Inc. All rights reserved.
Keywords: Moisture migration; Thermal gradient; Suction; Soil water characteristic curve; Soils
1. Introduction
Generally, distribution of power is accomplished with
the help of underground cables. Due to the transmission
of power through these cables, the soil mass surround-
ing them gets heated up and this may cause migration of
moisture from the soil mass. At the same time, de-
pending upon the rise in temperature of the soil mass
and its resistivity, its thermal instability may also occur[1]. Thermal instability of the soil mass refers to the
changes occurring in its thermal properties which may
affect its proper functioning for the intended purpose.
The movement of the moisture from the soil mass due to
thermal gradients is mainly responsible for its thermal
instability [1,2]. Such a situation may also be detrimental
to the buried power cables and may result in its mal-
functioning or even its melting. As such, continuousmonitoring of the moisture migration from the soil mass
becomes mandatory.
In this direction, several researchers [3–10] have de-veloped mathematical and numerical models for study-
ing heat and moisture transfer through the soil mass.
Most of these studies deal with modeling and under-
standing the fundamental process involved with the
migration of moisture through the soil mass due to the
thermal gradients [11]. Similarly, conventional [12–15]
and accelerated experiments [16], using a geotechnical
centrifuge, have been conducted to study the moisturemigration in the soil mass due to the thermal gradients.
However, as the heat and moisture migration through
the soil mass is a complex phenomenon that depends on
several parameters related to the soil properties and the
properties of the heat source [11], it is quite difficult to
apply the findings of the mathematical models as well as
the results obtained from the experiments to the real life
situations. In such a situation, direct measurement of themoisture level of the soil mass and the amount of
moisture migrating from it due to the thermal gradients
seems to be the best possible solution.
With this in view, a simple methodology that deals
with the application of an insertion tensiometer to esti-
mate the moisture migration in the soil mass, due to the
thermal gradients, has been developed and its details are
* Corresponding author. Tel.: +91-22-5767340; fax: +91-22-
5767302/5723480.
E-mail address: [email protected] (D.N. Singh).
Experimental Thermal and Fluid Science 27 (2003) 715–721
www.elsevier.com/locate/etfs
0894-1777/03/$ - see front matter � 2003 Elsevier Science Inc. All rights reserved.
doi:10.1016/S0894-1777(02)00306-0

presented in this paper. The methodology employs ap-
plication of the soil water characteristic curve, SWCC,
for a soil mass, which can be determined with the help of
insertion tensiometer [17–19]. It must be noted here that
the SWCC for a soil is the relationship between the
suction, w, exhibited by it and its volumetric water
content, hv. Though application of SWCC for estimat-
ing unsaturated soil hydraulic conductivity [20], shearstrength [21], swelling potential [22] and its compress-
ibility [23] is very well established, its application for
establishing moisture migration due to the thermal
gradients has not been explored yet. With this in view,
efforts have been made to demonstrate usefulness of the
insertion tensiometer for establishing moisture migra-
tion in the soil mass due to thermal gradients.
2. Experimental investigations
2.1. Material properties
Two soils, a locally available silty soil, SS, and
commercially available Kaolin (white clay, WC), were
chosen in the present study. The physical properties ofthese soils are presented in Table 1. Specific gravity and
the particle size characteristics of these soils have been
obtained as per the guidelines provided by ASTM-D 854
[24] and ASTM-D422 [25], respectively. The standard
Proctor compaction characteristics of these soils have
been obtained as per the guidelines provided by ASTM-
D 698 [26].
2.2. Details of the heat source
As depicted in Fig. 1, a thermal probe made of a hollow
copper tube has been used for heating the soil mass i.e.
applying the thermal gradient. The probe, which acts as a
line heat source [27] is 9.5 cm long and 6 mm in externaldiameter, and consists of a nichrome wire (exhibiting
0.044 X/cm) as a heating element. A T-type (copper–
constantan) thermocouple has been fixed on the inner
surface of middle of the probe to monitor its temperature
as a function of time. The space between the heating ele-
ment and the copper tube has been filled with a thermal
epoxy, which provides excellent thermal conduction and
acts as an electrically insulating material.
2.3. Details of the insertion tensiometer
To measure the soil suction a Jib-P Tensiometer,as depicted in Fig. 2 and with its details presented in
Nomenclature
cd dry unit weight of the soilcd max maximum dry unit weight of the soil
hs volumetric water content at saturation
hv volumetric water content
cw unit weight of water
e void ratio
hr soil suction corresponding to the residual
water content
nf , mf soil parameters
OMC optimum moisture contentr radial distance from central line of probe
w soil suction
T temperature of the soil mass
t time
w gravimetric water content
w0 initial gravimetric water content
USCS unified soil classification system
Table 1
Physical properties of the soils used in the present study
Soil property SS WC
Specific gravity 2.50 2.65
Sand size:
Coarse (4.75–2.0 mm) (%) 5 –
Medium (2.0–0.42 mm) (%) 16 –
Fine (0.420–0.074 mm) (%) 25 –
Silt size (0.074–0.002) (%) 47 39
Clay size (<0.002 mm) (%) 7 61
Consistency limits:
Liquid limit (%) 44 46
Plastic limit (%) 34 25
Plasticity index (%) 10 21
USCS classification ML CL
Standard Proctor compaction:
cd max (g/cc) 1.59 1.39
OMC (%) 20.8 21.4
} Thermocouple leads Power supply leads {
Nichrome wire
95m
m
Copper tube
Thermocouple
6mm
Fig. 1. Details of the thermal probe.
716 S. Krishnaiah, D.N. Singh / Experimental Thermal and Fluid Science 27 (2003) 715–721

Table 2, attached to a �E-sensor� has been used. The ob-
servations from the �E-sensor� are data-logged over a
period of time, in terms of mA. Later, the logged data
can be converted into the soil suction, w, values using
the following calibration equation [17]:
w ðin kPaÞ ¼ ½�22:22 þ 5:61
� Output current ðin mAÞ�: ð1Þ
2.4. Sample preparation
The oven-dried silty soil, SS, and the white clay, WC,
were mixed thoroughly with 30.55% and 37.25% distilled
water, respectively, and these soils were stored for ma-
turing in airtight polythene bags for two days. This
water content corresponds to the initial gravimetric
water content, w0, of the soil mass. Later, silty soil andthe white clay were compacted in a 12 cm high Perspex
mold (with 12 cm inner diameter) to achieve a dry unit
weight, cd, of 1.3 and 1.1 g/cc, respectively, by com-
pacting these soils in three layers, and imparting 25
blows to each layer, with the help of a hand rammer that
weighs 250 g.
Using Eq. (2), the gravimetric water content, w, can
be converted into the volumetric water content, hv:
Table 2
Details of the Jib-P insertion type tensiometer
Parameter Value
Tensiometer tube:
Material Glass
Length (mm) 130
Viewing window height 44
Diameter (mm) 16.5
Thimble (cone):
Material Ceramic
Diameter (mm) 6.5
Length of the cone (mm) 30
Insertion depth (mm) 35
Suction measurement range 0–90 kPa
Fig. 3. The experimental setup.
Fig. 2. (a) Insertion tensiometer (tube and thimble), (b) E-sensor.
S. Krishnaiah, D.N. Singh / Experimental Thermal and Fluid Science 27 (2003) 715–721 717

hv ¼ wðcd=cwÞ; ð2Þwhere cd and cw are the dry unit weights of the soil and
water, respectively. Using Eq. (2), the initial hv for the
silty soil and the white clay are found to be 39.72% and40.97%, respectively.
To monitor temperature of the soil mass, a 5 cm long
T-type thermocouple, its outer diameter being 1 mm and
which is grounded at its bottom end, has been installed
at a radial distance, r, of 1.5 cm from the axis of the
thermal probe, as depicted in Fig. 3. To measure the soil
suction, at the same radial distance, an insertion tensi-
ometer is also inserted into the soil mass, as depicted inFig. 3. A data-logger has been used to record the tem-
perature, T , in �C, and soil suction, w, in terms of mA,
of the soil mass. A 20 V constant power supply has been
used for the E-sensor. A 4 A constant current supply is
used for the thermal probe, which yields an input power
of 71 W/m.
3. Results and discussion
The variation of T and w of the soil mass with time thas been recorded as depicted in Figs. 4 and 5, respec-
tively. It can be observed from these figures that as time
increases the temperature as well as the suction of the
soil mass increases. The increase in soil suction, as a
function of time indicates depletion in moisture of thesoil mass, which can be attributed to the migration of
moisture. After a certain time the suction of the soil, w,
attains a constant value. From Figs. 4 and 5, it can also
be noted that for a certain time t the w for the white clay,
WC, is higher than the silty soil, SS. This may be at-
tributed to the fact that for fine-grained soils (i.e. WC)
suction would be higher as compared to the coarse-
grained soils (i.e. SS) [28,29]. The maximum w values of78 and 70.3 kPa for the white clay, WC, and silty soil,
SS, are noticed to occur corresponding to 39.35 and
40.16 h, respectively.
The SWCCs for the silty soil SS and the white clay
WC are depicted in Fig. 6 [17,19]. As insertion tensio-
meter cannot be used to measure soil suction higher than
90 kPa, the best-fit represented by the following equation[18] has been used to define the SWCC of the two soils.
hv
hs
� �¼ 1
24 �
ln 1 þ whr
h i
ln 1 þ 106
hr
h i35
� 1
ln expð1Þ þ waf
nfh ih imf
264
375 ð3Þ
where hv is the volumetric water content at any suction
w, hs is the volumetric water content at saturation, af is
the soil parameter which is a function of air entry value
and is equal to 32.96 and 73.78 kPa for the silty soil SS
0 500 1000 1500 2000 2500 30002830323436384042444648505254
WC
SS
t (min)
Fig. 4. Variation of the soil mass temperature with time.
0 500 1000 1500 2000 2500 30000
10
20
30
40
50
60
70
80
90
100
SS
WC78
70.3
2361 2410
ψ(k
Pa)
t (min)
Fig. 5. Variation of the soil suction with time.
Fig. 6. The soil water characteristic curve, SWCC, for the two soils.
718 S. Krishnaiah, D.N. Singh / Experimental Thermal and Fluid Science 27 (2003) 715–721
and the white clay WC, respectively, nf is the soil pa-
rameter which is a function of rate of extraction of water
from the soil beyond the air entry value and is equal to
1.29 and 13.89 for soils SS and WC, respectively, mf is
the soil parameter which is a function of the residualmoisture content and is equal to 0.67 and 0.78 for SS
and WC respectively, hr is the suction corresponding to
the residual moisture content and is equal to 699005.8
and 165613.8 kPa for SS and WC, respectively [17,19].
It can be noted from Fig. 6 that w increases as hv
decreases. As such, these curves can be employed for
establishing migration of moisture due to the thermal
gradient as discussed in the following.
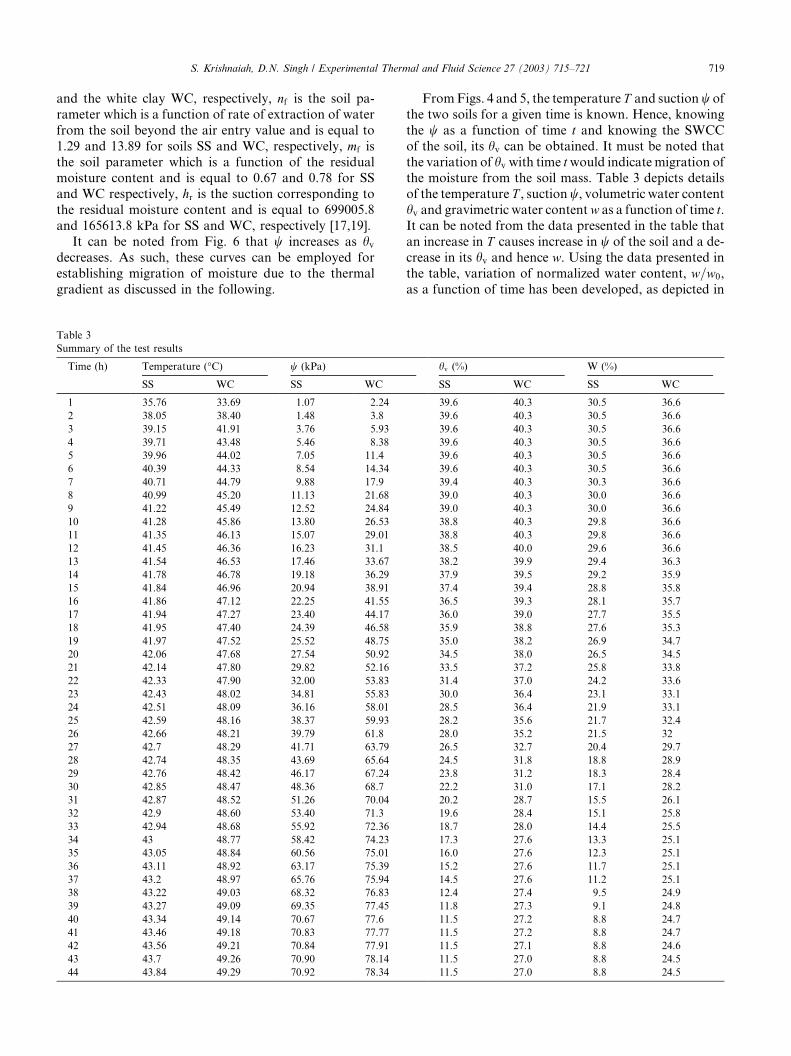
From Figs. 4 and 5, the temperature T and suction w of
the two soils for a given time is known. Hence, knowing
the w as a function of time t and knowing the SWCC
of the soil, its hv can be obtained. It must be noted that
the variation of hv with time t would indicate migration ofthe moisture from the soil mass. Table 3 depicts details
of the temperature T , suction w, volumetric water content
hv and gravimetric water content w as a function of time t.It can be noted from the data presented in the table that
an increase in T causes increase in w of the soil and a de-
crease in its hv and hence w. Using the data presented in
the table, variation of normalized water content, w=w0,
as a function of time has been developed, as depicted in
Table 3
Summary of the test results
Time (h) Temperature (�C) w (kPa) hv (%) W (%)
SS WC SS WC SS WC SS WC
1 35.76 33.69 1.07 2.24 39.6 40.3 30.5 36.6
2 38.05 38.40 1.48 3.8 39.6 40.3 30.5 36.6
3 39.15 41.91 3.76 5.93 39.6 40.3 30.5 36.6
4 39.71 43.48 5.46 8.38 39.6 40.3 30.5 36.6
5 39.96 44.02 7.05 11.4 39.6 40.3 30.5 36.6
6 40.39 44.33 8.54 14.34 39.6 40.3 30.5 36.6
7 40.71 44.79 9.88 17.9 39.4 40.3 30.3 36.6
8 40.99 45.20 11.13 21.68 39.0 40.3 30.0 36.6
9 41.22 45.49 12.52 24.84 39.0 40.3 30.0 36.6
10 41.28 45.86 13.80 26.53 38.8 40.3 29.8 36.6
11 41.35 46.13 15.07 29.01 38.8 40.3 29.8 36.6
12 41.45 46.36 16.23 31.1 38.5 40.0 29.6 36.6
13 41.54 46.53 17.46 33.67 38.2 39.9 29.4 36.3
14 41.78 46.78 19.18 36.29 37.9 39.5 29.2 35.9
15 41.84 46.96 20.94 38.91 37.4 39.4 28.8 35.8
16 41.86 47.12 22.25 41.55 36.5 39.3 28.1 35.7
17 41.94 47.27 23.40 44.17 36.0 39.0 27.7 35.5
18 41.95 47.40 24.39 46.58 35.9 38.8 27.6 35.3
19 41.97 47.52 25.52 48.75 35.0 38.2 26.9 34.7
20 42.06 47.68 27.54 50.92 34.5 38.0 26.5 34.5
21 42.14 47.80 29.82 52.16 33.5 37.2 25.8 33.8
22 42.33 47.90 32.00 53.83 31.4 37.0 24.2 33.6
23 42.43 48.02 34.81 55.83 30.0 36.4 23.1 33.1
24 42.51 48.09 36.16 58.01 28.5 36.4 21.9 33.1
25 42.59 48.16 38.37 59.93 28.2 35.6 21.7 32.4
26 42.66 48.21 39.79 61.8 28.0 35.2 21.5 32
27 42.7 48.29 41.71 63.79 26.5 32.7 20.4 29.7
28 42.74 48.35 43.69 65.64 24.5 31.8 18.8 28.9
29 42.76 48.42 46.17 67.24 23.8 31.2 18.3 28.4
30 42.85 48.47 48.36 68.7 22.2 31.0 17.1 28.2
31 42.87 48.52 51.26 70.04 20.2 28.7 15.5 26.1
32 42.9 48.60 53.40 71.3 19.6 28.4 15.1 25.8
33 42.94 48.68 55.92 72.36 18.7 28.0 14.4 25.5
34 43 48.77 58.42 74.23 17.3 27.6 13.3 25.1
35 43.05 48.84 60.56 75.01 16.0 27.6 12.3 25.1
36 43.11 48.92 63.17 75.39 15.2 27.6 11.7 25.1
37 43.2 48.97 65.76 75.94 14.5 27.6 11.2 25.1
38 43.22 49.03 68.32 76.83 12.4 27.4 9.5 24.9
39 43.27 49.09 69.35 77.45 11.8 27.3 9.1 24.8
40 43.34 49.14 70.67 77.6 11.5 27.2 8.8 24.7
41 43.46 49.18 70.83 77.77 11.5 27.2 8.8 24.7
42 43.56 49.21 70.84 77.91 11.5 27.1 8.8 24.6
43 43.7 49.26 70.90 78.14 11.5 27.0 8.8 24.5
44 43.84 49.29 70.92 78.34 11.5 27.0 8.8 24.5
S. Krishnaiah, D.N. Singh / Experimental Thermal and Fluid Science 27 (2003) 715–721 719

Fig. 7. It can be noted from the figure that as time in-
creases, w=w0 for a soil decreases. From the figure it is
quite apparent that the drop in w=w0 as a function of time
is much more for the silty soil as compared to the whiteclay. This is consistent with the fact that water-holding
capacity of white clay (and hence its suction) is higher
than the silty soil. This indicates that due to the thermal
gradient the volumetric water content of the soil samples
decreases as a function of time. This demonstrates use-
fulness of the methodology discussed in the paper for
determining migration of the soil moisture due to the
thermal gradient.
4. Conclusions
The present study demonstrates the usefulness of in-
sertion tensiometer and the soil water characteristiccurve, SWCC, for establishing migration of moisture
due to thermal gradients quite easily. It has been ob-
served that the soil suction for the white clay is higher as
compared to the silty soil. As such, the moisture-holding
capacity of the white clay is higher than the silty soil. It
has been observed that with increase in temperature,
suction in the soil mass increases, which indicates de-
crease in its water content. Though the proposedmethodology is found to be working quite efficiently for
establishing migration of moisture due to thermal gra-
dient in the laboratory tests, its validity under in situ
conditions must be investigated.
References
[1] T.L. Brandon, J.K. Mitchell, J.T. Cameron, Thermal instability in
buried cable backfills, J. Geotech. Eng., ASCE 115 (1) (1989) 38–55.
[2] A.M. Abdel-Hadi, J.K. Mitchell, Coupled heat and water flows
around buried cables, J. Geotech. Eng., ASCE 107 (1981) 1461–
1487.
[3] B.J. Dempsey, A mathematical model for predicting coupled heat
and water movement in unsaturated soil, Int. J. Numer. Anal.
Meth. Geomech. 2 (1978) 319–324.
[4] J.R. Philip, D.A. De Vries, Moisture movement in porous
materials under temperature gradients, Trans. Am. Geophys.
Union 38 (2) (1957) 222–232.
[5] H.R. Radhakrishna, K.-C. Lau, A.M. Crawford, Coupled heat
and moisture flow through soils, J. Geotech. Eng., ASCE 110 (12)
(1984) 1766–1784.
[6] H.R. Thomas, C.L.W. Li, An assessment of model of heat and
moisture transfer in unsaturated soil, Geotechnique 47 (1) (1997)
113–131.
[7] H.R. Thomas, W.F. Ferguson, A fully coupled heat and mass
transfer model incorporating contaminate gas transfer in an
unsaturated porous medium, Comput. Geotech. 24 (1) (1999) 65–
87.
[8] D.S. Freitas, A.T. Prata, A.J. De Lima, Thermal performance of
underground cables with constant and cyclic currents in presence
of moisture migration in the surrounding soil, Trans. Power
Delivery, IEEE 11 (3) (1996) 1159–1170.
[9] G.P. Newman, G. Ward Wilson, Heat and mass transfer in
unsaturated soils during freezing, Can. Geotech. J. 3 (1997) 63–70.
[10] H.A. Basha, A.P.S. Selvadurai, Heat-induced moisture transport
in the vicinity of a spherical heat source, Int. J. Numer. Anal.
Meth. Geomech. 22 (1998) 969–981.
[11] R.E.S. Moya, A.T. Prata, J.A.B. Cunha Neto, Experimental
analysis of unsteady heat and moisture transfer around a heated
cylinder buried into a porous medium, Int. J. Heat Mass Transfer
42 (1999) 2187–2198.
[12] A.J. Raudkivi, V.V. Nguyen, Soil moisture movement by
temperature gradient, J. Geotech. Eng., ASCE 102 (GT12)
(1976) 1225–1244.
[13] J.C. Hartley, W.J. Black, Transient simultaneous heat and mass
transfer in moist, unsaturated soils, J. Heat Transfer, ASME. 103
(1981) 376–382.
[14] J.Y. Baladi, D.L. Ayers, R.J. Schoenhals, Transient heat and
mass transfer in soils, Int. J. Heat Mass Transfer 24 (1981) 449–
458.
[15] J. Ewen, Thermal instability in gently heated unsaturated sand,
Int. J. Heat Mass Transfer 31 (1988) 1701–1710.
[16] A.M. Britto, C. Savvidou, D.V. Maddocs, M.J. Gunn, J.R.
Booker, Numerical and centrifuge modelling of the coupled heat
flow and consolidation around hot cylinders buried in clay,
Geotechnique. 39 (1) (1989) 13–25.
[17] S.J. Kurian, Hydraulic conductivity of unsaturated soils: some
laboratory investigations, M.Tech. Thesis, submitted to the De-
partment of Civil Engineering, Indian Institute of Technology––
Bombay, Mumbai, India, 2001.
[18] D.G Fredlund, A. Xing, Equations for the soil–water character-
istic curve, Can. Geotech. J. 31 (3) (1994) 521–532.
[19] S. Sreedeep, Laboratory investigations on soil suction measure-
ment, M.Tech. Thesis, submitted to the Department of Civil
Engineering, Indian Institute of Technology––Bombay, Mumbai,
India, 2002.
[20] M.T. Van Genuchten, A closed form equation for predicting the
hydraulic conductivity of unsaturated soils, Soil Soc. Am. J. 44
(1980) 892–898.
[21] D.G. Fredlund, S.K. Vanapalli, A. Xing, D.E. Pufahl, Predict-
ing the shear-strength function for unsaturated soils using the
soil–water characteristic curve, in: E.E. Alonzo, P. Delage
(Eds.), Proceedings of the First International Conference on
Unsaturated Soils, vol. 1, Balkema Publishers, Rotterdam, 1995,
pp. 63–69.
[22] K. Garbulewski, S. Zakowicz, Suction as an indicator of soil
expansive potential, in: E.E. Alonzo, P. Delage (Eds.), Proceed-
ings of the First International Conference on Unsaturated Soils,
vol. 2, Balkema Publishers, Rotterdam, 1995, pp. 593–597.
Fig. 7. Variation of the normalized moisture content with time for the
two soils.
720 S. Krishnaiah, D.N. Singh / Experimental Thermal and Fluid Science 27 (2003) 715–721

[23] M.R. Sudhakar, K. Revanasiddappa, Role of matric suction in
collapse of compacted clay soil, J. Geotech. Geoenviron. Eng.,
ASCE 126 (1) (2000) 85–90.
[24] ASTM D 854-92, Test method for specific gravity of soils, Annual
Book of ASTM Standards, ASTM, Philadelphia, USA, 04.08
(1994), 80–83.
[25] ASTM D 422-63, Test method for particle size analysis of soils,
Annual Book of ASTM Standards, ASTM, Philadelphia, USA,
04.08 (1994), 10–16.
[26] ASTM D 698-91, Test method for laboratory compaction
characteristics of soils using standard effort, 600 kN-m/m3,
Annual Book of ASTM Standards, ASTM, Philadelphia, USA,
04.08 (1994), 69–76.
[27] D.N. Singh, K. Devid, Generalized relationships for estimating
soil thermal resistivity, Exp. Thermal Fluid Sci. 22 (2000) 133–
143.
[28] D.G. Fredlund, M.G. Fredlund, G.W. Wilson, Prediction of the
soil water characteristic curve from grain-size distribution and
volume–mass properties, in: 3rd Brazilian Symposium on Unsat-
urated Soils, Rio de Janeiro, Brazil, 1998, pp. 1–12.
[29] K. Terzaghi, R.B. Peck, Soil Mechanics in Engineering Practice,
John Wiley and Sons, 1962.
S. Krishnaiah, D.N. Singh / Experimental Thermal and Fluid Science 27 (2003) 715–721 721