a method of microwave soil moisture inversion without
TRANSCRIPT

A Method of Microwave Soil Moisture Inversion without Dependence on the Field
Measurement Data
HAN Lin 1, CHEN Luwan 1*, ZHANG Yancheng 1, QIN Xiaobao 1
1 College of Geology Engineering and Geomatics, Chang’an University, Shanxi Xi’an, 710064 China – [email protected]
Commission III, WG III/1
KEY WORDS: LUT, AIEM, Optimal effective roughness, Pixel scale, ASAR;
ABSTRACT:
In the process of retrieving soil moisture(vM ) by active microwave, surface roughness is an important parameter affecting the
accuracy of mv retrieval.Using effective roughness to replace the original measurement value of surface roughness can effectively
avoid the error. In the existing methods of soil water inversion, the value of fixed mean square root height (S) was used to retrieve
the surface of different types and vegetation coverage, neglecting the difference of different ground surface. This paper proposed a
LUT (look up table) soil moisture inversion method based on the pixel scale effective roughness. First, the effective roughness was
obtained by using the measured soil moisture value of the sampling point based on the LUT method. And then the empirical function
between the optimum roughness (S, Correlation length-l) and the backscattering coefficient of VV/HH polarization was obtained.
The value of each pixel's S and L was obtained by using the empirical function. Finally, the soil moisture was retrieved by the LUT
method. Using the measured data of the Linze sample area to verify, the results showed that the proposed method was superior to the
LUT inversion method using the S fixed value without dependence on the measured data of the roughness. It was also proved that
the inversion method proposed in this paper is not only applicable to the bare soil area, but still maintained a high precision in the
soil moisture inversion results in the area with large vegetation coverage.
* Corresponding author: CHEN Luwan, 1980.11, student pursuing a PhD degree of Chang’an University, Photogrammetry and remote sensing,
The main research area is soil moisture retrieval by active microwave. Email:[email protected]
1. INTRODUCTION
The spatial distribution of soil moisture is of great importance
for drought detection, agricultural production, and field
irrigation management, especially in the arid and semi-arid
regions of northwest China. Active microwave remote sensing
has the advantages of all-weather, multi-polarization, high
resolution, penetration, and sensitive to moisture content.
Therefore, active microwave remote sensing inversion of soil
moisture is currently a research hotspot. In the field of active
microwave remote sensing, Synthetic Aperture Radar (SAR) has
become one of the most important frontier technologies in the
field of Earth observation.
Surface roughness is an important parameter in soil moisture
inversion. Prior studies (Li Zhen, 2011) showed that the effect
of soil moisture on the backscatter coefficient is 5-7dB, but the
effect of surface roughness on backscattering has reached 10dB
or more. The study of some researchers (Toan T L, 1999) shows
that the error of soil moisture inversion mainly comes from the
uncertainty of the measured roughness parameters. Verhoest
and Lievens et al (Verhoest N E C, 2008; Lievens H, 2010a)
also study on the effect of soil surface roughness measurement
error on the inversion results of soil moisture, comprehensively
described the method of characterization of surface roughness
and related issues, and evaluated the effect of configuration
parameters (single frequency, single polarization) with the SAR
image on the inversion of soil moisture. Baghdadi et al
conducted a sensitivity analysis of the radar frequency to soil
parameters and found that the frequency has little effect on soil
moisture and roughness parameters (Baghdadi N, 2002a). In
order to achieve accurate inversion of soil moisture, it is
necessary to accurately describe roughness and eliminate the
influence of roughness.
In some studies, calibrated roughness parameters were used
in place of the original soil roughness measurements. Baghdadi
et al proposed scaling of roughness parameters, established the
root mean square height s under multiple incident angle
conditions, and optimized the correlation length Lopt (Baghdadi
N, 2002b, 2005, 2011, 2012). The relationship maked the
backscatter coefficient value simulated by the IEM model closer
to the true value of the radar image, and the method for
calculating the correlation length after the calibration by
Baghdadi required the actually measured root mean square
height to participate in the calculation. So the result of
roughness parameter calibration would introduce measurement
error; Lievens et al proposed an effective roughness method
(Lievens H, 2010b). The C-band and L-band radar data were
used to invert the soil moisture in the vegetation coverage area.
This method could avoid the measurement error of the
roughness. However, in calculating the effective correlation
length, the root mean square height of the inversion region was
fixed at a certain value, and then Effective correlation length
was obtained by LUT method combined with measured soil
moisture. Lievens considers that better accuracy of the inversion
results could be obtained when S=1cm for C-band, which
neglected the difference of the different surface and would
affect the accuracy of the inversion results.
To solve this problem, a LUT soil moisture inversion method
based on pixel scale and effective roughness is proposed in this
The International Archives of the Photogrammetry, Remote Sensing and Spatial Information Sciences, Volume XLII-3, 2018 ISPRS TC III Mid-term Symposium “Developments, Technologies and Applications in Remote Sensing”, 7–10 May, Beijing, China
This contribution has been peer-reviewed. https://doi.org/10.5194/isprs-archives-XLII-3-459-2018 | © Authors 2018. CC BY 4.0 License.
459

paper. First, using a large number of field measured data and
multiple SAR images, in view of the sampling points of
different surface types and different vegetation coverage, the
effective roughness is retrieved by LUT method and the
measured soil moisture value at the sampling point in the range
of (0.5 ,3.0 )S cm cm and (5 ,200 )l cm cm . The optimal
effective roughness of every sampling point is obtained
according to the principle of the backscattering coefficient and
the closest measurement of soil moisture in the LUT table. Then,
it is found that there is a good empirical function among the
optimal effective S value, the optimal effective l value and the
VV/HH polarization backscattering coefficient of the bare soil
and the vegetation cover. Through the empirical function, the
optimal values of S and l of each pixel in the SAR image can be
determined, and then the soil moisture is retrieved by LUT
method. Using the measured data, the results show that the soil
moisture inversion method based on the pixel scale effective
roughness and the LUT proposed in this paper is suitable for the
soil moisture inversion of the bare soil and the vegetation
surface in arid and semi-arid areas. It can get high accuracy soil
moisture retrieval results without relying on the measured data
of surface roughness.
2. STUDY AREA
The study area in this paper is located in Gansu Province in
northwestern China. The sample plots are located in the Linze
plot in the middle reaches of the Heihe River, Arou Township,
Ebao and Biandukou plots in the upper reaches of the Heihe
River. The SAR image acquired by the ASAR sensor on the
ESA's Envisat-1 satellite was selected as the data source for soil
moisture inversion. The incident waveband of the ASAR image
is C-band ( 5.331GHzf ), and there are 7 patterns of incident
angles, covering the range of incident angles as 15 45 , and 5
operating modes (Image, Alternating Polarization, Wide Swath,
Global Monitoring, and Wave). According to the radar angle of
incidence, land cover type and month, seven scenes of
ENVISAT ASAR images were selected. The images were
acquired in October of 2007 and March, May, June and July of
2008. Table 1 shows the SAR data used in this study.
ID
Number
of
sampling
points
Date
Radar
incidence
angle (°)
1 50 2007.10.17 23
2 75 2007.10.18 41
3 41 2008.03.12 23
4 75 2008.06.19 41
5 25 2008.07.05 44
6 231 2008.07.11 33.5
7 132 2008.05.24 19
Table 1. Introduction of ASAR images
The ground surface measurement data synchronized with the
SAR satellite used in the experiment was derived from the
"Watershed Allied Telemetry Experimental Research" (WATER)
project. From the surface measured data provided by WATER
project, the data of soil water content, root mean square height
and correlation length observed synchronously with ASAR
images were selected. A total of 18 samples and 629 sets of
observations were selected for different areas, different months
and different land cover types. There are many kinds of surface
types in the sample area, including grassland, sparse vegetation,
saline alkali land, alfalfa field, barley field, reed field, rape field,
corn field and bare soil.
3. STUDY ON THE OPTIMAL VALUE OF S IN LUT
METHOD
At present, in the process of retrieving soil moisture by using
LUT method, a fixed S was used to establish LUT table for
inversion. The surface difference was not taken into account. In
fact, the results of soil moisture retrieval using different S
values in the same area were quite different. Figure 1 was the
result of Soil Moisture Retrieval Based on the May 24, 2008
ASAR image and different S values in Linze area.
(a)S=0.8cm,RMSE=0.1422
The International Archives of the Photogrammetry, Remote Sensing and Spatial Information Sciences, Volume XLII-3, 2018 ISPRS TC III Mid-term Symposium “Developments, Technologies and Applications in Remote Sensing”, 7–10 May, Beijing, China
This contribution has been peer-reviewed. https://doi.org/10.5194/isprs-archives-XLII-3-459-2018 | © Authors 2018. CC BY 4.0 License.
460
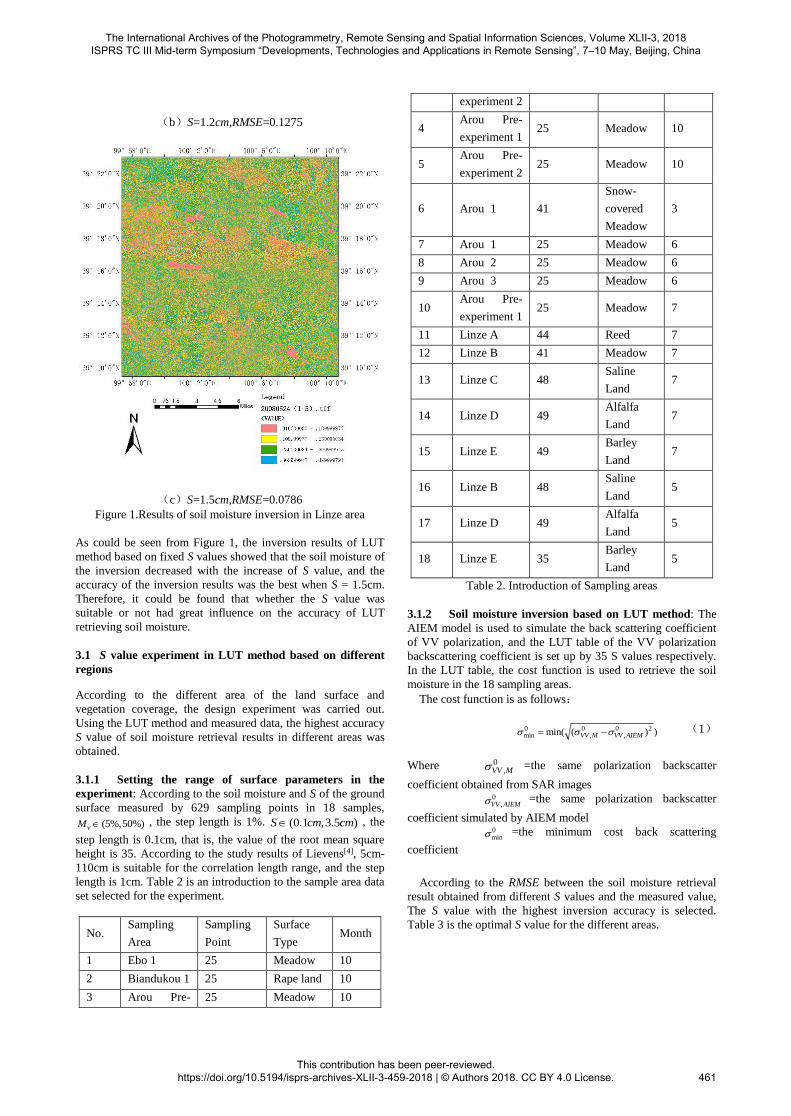
(b)S=1.2cm,RMSE=0.1275
(c)S=1.5cm,RMSE=0.0786
Figure 1.Results of soil moisture inversion in Linze area
As could be seen from Figure 1, the inversion results of LUT
method based on fixed S values showed that the soil moisture of
the inversion decreased with the increase of S value, and the
accuracy of the inversion results was the best when S = 1.5cm.
Therefore, it could be found that whether the S value was
suitable or not had great influence on the accuracy of LUT
retrieving soil moisture.
3.1 S value experiment in LUT method based on different
regions
According to the different area of the land surface and
vegetation coverage, the design experiment was carried out.
Using the LUT method and measured data, the highest accuracy
S value of soil moisture retrieval results in different areas was
obtained.
3.1.1 Setting the range of surface parameters in the
experiment: According to the soil moisture and S of the ground
surface measured by 629 sampling points in 18 samples,
(5%,50%)vM , the step length is 1%. (0.1 ,3.5 )S cm cm , the
step length is 0.1cm, that is, the value of the root mean square
height is 35. According to the study results of Lievens[4], 5cm-
110cm is suitable for the correlation length range, and the step
length is 1cm. Table 2 is an introduction to the sample area data
set selected for the experiment.
No. Sampling
Area
Sampling
Point
Surface
Type Month
1 Ebo 1 25 Meadow 10
2 Biandukou 1 25 Rape land 10
3 Arou Pre- 25 Meadow 10
experiment 2
4 Arou Pre-
experiment 1 25 Meadow 10
5 Arou Pre-
experiment 2 25 Meadow 10
6 Arou 1 41
Snow-
covered
Meadow
3
7 Arou 1 25 Meadow 6
8 Arou 2 25 Meadow 6
9 Arou 3 25 Meadow 6
10 Arou Pre-
experiment 1 25 Meadow 7
11 Linze A 44 Reed 7
12 Linze B 41 Meadow 7
13 Linze C 48 Saline
Land 7
14 Linze D 49 Alfalfa
Land 7
15 Linze E 49 Barley
Land 7
16 Linze B 48 Saline
Land 5
17 Linze D 49 Alfalfa
Land 5
18 Linze E 35 Barley
Land 5
Table 2. Introduction of Sampling areas
3.1.2 Soil moisture inversion based on LUT method: The
AIEM model is used to simulate the back scattering coefficient
of VV polarization, and the LUT table of the VV polarization
backscattering coefficient is set up by 35 S values respectively.
In the LUT table, the cost function is used to retrieve the soil
moisture in the 18 sampling areas.
The cost function is as follows:
0min ,
0 2,
0min( ( ) )VV M VV AIEM (1)
Where 0,VV M =the same polarization backscatter
coefficient obtained from SAR images
0,VV AIEM =the same polarization backscatter
coefficient simulated by AIEM model
0min =the minimum cost back scattering
coefficient
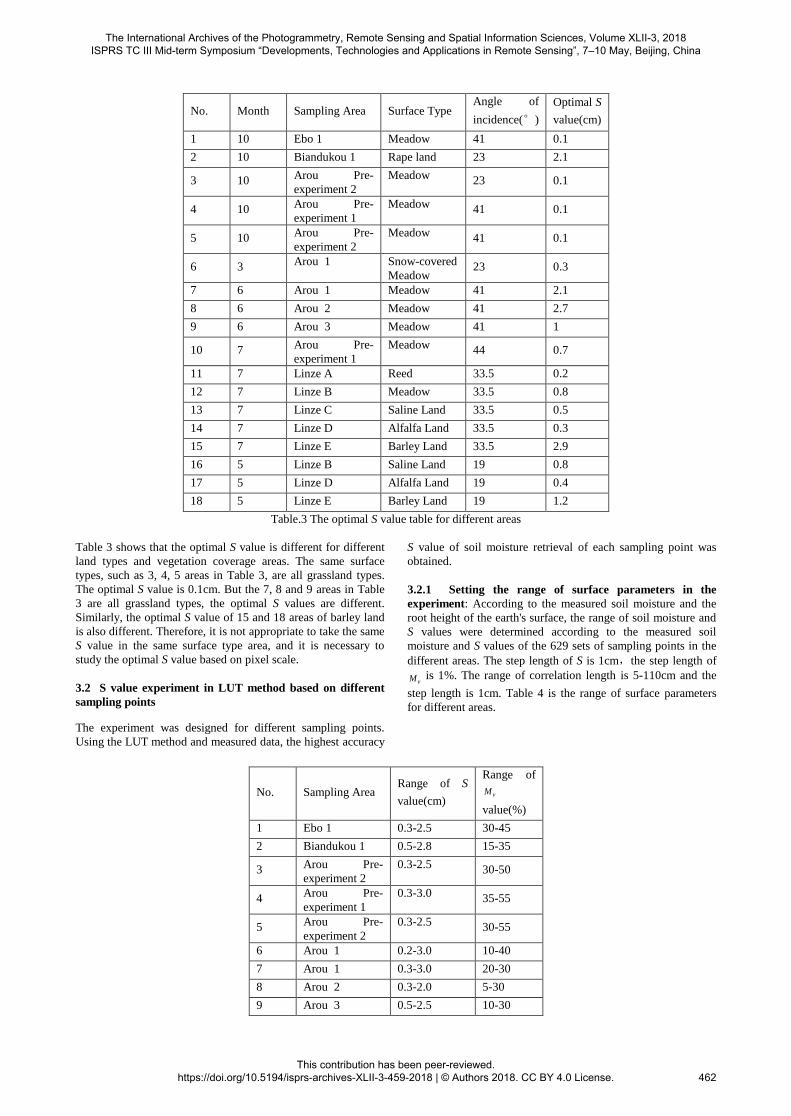
According to the RMSE between the soil moisture retrieval
result obtained from different S values and the measured value,
The S value with the highest inversion accuracy is selected.
Table 3 is the optimal S value for the different areas.
The International Archives of the Photogrammetry, Remote Sensing and Spatial Information Sciences, Volume XLII-3, 2018 ISPRS TC III Mid-term Symposium “Developments, Technologies and Applications in Remote Sensing”, 7–10 May, Beijing, China
This contribution has been peer-reviewed. https://doi.org/10.5194/isprs-archives-XLII-3-459-2018 | © Authors 2018. CC BY 4.0 License.
461
No. Month Sampling Area Surface Type Angle of
incidence(°)
Optimal S
value(cm)
1 10 Ebo 1 Meadow 41 0.1
2 10 Biandukou 1 Rape land 23 2.1
3 10 Arou Pre-
experiment 2
Meadow 23 0.1
4 10 Arou Pre-
experiment 1
Meadow 41 0.1
5 10 Arou Pre-
experiment 2
Meadow 41 0.1
6 3 Arou 1 Snow-covered
Meadow 23 0.3
7 6 Arou 1 Meadow 41 2.1
8 6 Arou 2 Meadow 41 2.7
9 6 Arou 3 Meadow 41 1
10 7 Arou Pre-
experiment 1
Meadow 44 0.7
11 7 Linze A Reed 33.5 0.2
12 7 Linze B Meadow 33.5 0.8
13 7 Linze C Saline Land 33.5 0.5
14 7 Linze D Alfalfa Land 33.5 0.3
15 7 Linze E Barley Land 33.5 2.9
16 5 Linze B Saline Land 19 0.8
17 5 Linze D Alfalfa Land 19 0.4
18 5 Linze E Barley Land 19 1.2
Table.3 The optimal S value table for different areas
Table 3 shows that the optimal S value is different for different
land types and vegetation coverage areas. The same surface
types, such as 3, 4, 5 areas in Table 3, are all grassland types.
The optimal S value is 0.1cm. But the 7, 8 and 9 areas in Table
3 are all grassland types, the optimal S values are different.
Similarly, the optimal S value of 15 and 18 areas of barley land
is also different. Therefore, it is not appropriate to take the same
S value in the same surface type area, and it is necessary to
study the optimal S value based on pixel scale.
3.2 S value experiment in LUT method based on different
sampling points
The experiment was designed for different sampling points.
Using the LUT method and measured data, the highest accuracy
S value of soil moisture retrieval of each sampling point was
obtained.
3.2.1 Setting the range of surface parameters in the
experiment: According to the measured soil moisture and the
root height of the earth's surface, the range of soil moisture and
S values were determined according to the measured soil
moisture and S values of the 629 sets of sampling points in the
different areas. The step length of S is 1cm,the step length of
vM is 1%. The range of correlation length is 5-110cm and the
step length is 1cm. Table 4 is the range of surface parameters
for different areas.
No. Sampling Area Range of S
value(cm)
Range of
vM
value(%)
1 Ebo 1 0.3-2.5 30-45
2 Biandukou 1 0.5-2.8 15-35
3 Arou Pre-
experiment 2
0.3-2.5 30-50
4 Arou Pre-
experiment 1
0.3-3.0 35-55
5 Arou Pre-
experiment 2
0.3-2.5 30-55
6 Arou 1 0.2-3.0 10-40
7 Arou 1 0.3-3.0 20-30
8 Arou 2 0.3-2.0 5-30
9 Arou 3 0.5-2.5 10-30
The International Archives of the Photogrammetry, Remote Sensing and Spatial Information Sciences, Volume XLII-3, 2018 ISPRS TC III Mid-term Symposium “Developments, Technologies and Applications in Remote Sensing”, 7–10 May, Beijing, China
This contribution has been peer-reviewed. https://doi.org/10.5194/isprs-archives-XLII-3-459-2018 | © Authors 2018. CC BY 4.0 License.
462

10 Arou Pre-
experiment 1
0.3-3.0 20-40
11 Linze A 0.3-3.0 20-65
12 Linze B 0.5-3.0 20-50
13 Linze C 0.5-3.0 30-50
14 Linze D 0.5-3.0 30-60
15 Linze E 0.5-3.0 10-60
16 Linze B 0.5-3.0 10-55
17 Linze D 0.5-3.0 10-55
18 Linze E 0.5-3.0 10-55
Table.4 The range of surface parameters for different areas
According to the measured soil moisture and root mean square
height of the 629 sampling points, the soil moisture range is
5%-50% and the step length is 1%. The height of the square
root is 0.1-3.5cm and the step length is 0.1cm, that is, the
number of root mean square heights is 35.According to
Lievens's experiment results[198], it is appropriate to use a range
of 5 to 10 cm for the relevant length, with a step length of 1 cm.
Major headings are to be centered, in bold capitals without
underlining, after two blank lines and followed by a one blank
line.
3.2.2 Optimal roughness inversion based on LUT method:
The AIEM model was used to simulate the VV/HH polarization
backscattering coefficient, and the LUT table of the VV/HH
polarization direction scattering coefficient was established by
the value of each square root height in the different region
respectively. In the LUT table, when the value of different S
was taken, the cost function was first used to select the record
which was closest to the true backscatter coefficient of the
backscatter coefficient and the sampling point in the LUT
table.Then the simulated soil moisture was compared with the
measured soil moisture in these records. The values of S and l in
these records closest to the measured soil moisture were
selected, which was the optimal value of S and l.
The cost function is as follows:
2 2
min , , , ,0 0 0 0 0min( ( ) ( ) )VV M VV AIEM HH M HH AIEM (2)
where 0,VV M =the VV polarization backscatter
coefficient obtained from SAR images
0,VV AIEM =the VV polarization backscatter
coefficient simulated by AIEM model
0,HH M =the HH polarization backscatter
coefficient obtained from SAR images
0,HH AIEM =the HH polarization backscatter
coefficient simulated by AIEM model
0min =the minimum cost back scattering
coefficient
Table 5 is the optimal roughness values for partial
sampling points.
Sampling
Area
Sampling
Point ID
the optimal
effective S
the
optimal
effective l
Linze
A(11)
1 0.4 18
2 1 32
3 1.1 46
4 0.2 5
5 1.8 57
6 0.5 9
7 0.4 5
8 0.5 10
9 1.1 29
10 1 16
Linze
B(12)
1 1.80 5.00
2 1.00 24.00
3 0.70 14.00
4 1.90 67.00
5 0.70 5.00
6 1.20 34.00
7 2.50 27.00
8 1.30 16.00
9 0.50 5.00
10 1.70 17.00
Table.5 The optimal roughness values for partial sampling
points
3.2.3 Construction of the best roughness inversion
experience function: The relationship among the optimal S
value, the optimal l value, the backscatter coefficient 0vv and
0hh in various areas was studied. Through multiple regression
statistics, it was found that there was the following relationship
among S, l , 0vv and
0hh :
0vv AS Bl C (3)
0hh DS El F (4)
where 0vv = the backscattering coefficient of VV
polarization modes
0hh =the backscattering coefficient of HH
polarization modes
A , B , C , D , E , F =the empirical
coefficients
By using the optimal S and l values obtained by inversion
and backscatter coefficients, we can get the empirical
coefficients A , B , C , D , E , F in the formula(3) and (4)
The International Archives of the Photogrammetry, Remote Sensing and Spatial Information Sciences, Volume XLII-3, 2018 ISPRS TC III Mid-term Symposium “Developments, Technologies and Applications in Remote Sensing”, 7–10 May, Beijing, China
This contribution has been peer-reviewed. https://doi.org/10.5194/isprs-archives-XLII-3-459-2018 | © Authors 2018. CC BY 4.0 License.
463

by multiple linear regression analysis.Formula (3) and (4)
join together could get the optimal S and l values of each
pixel.
3.3 Soil moisture inversion based on LUT method
In the inversion region of the measured data without roughness,
the optimal S and l values of each pixel in the image are
obtained by the back scattering coefficient and the formula (3)
and (4). The parameters in the AIEM model are soil moisture, S,
l and backscatter coefficient. The coefficient of backscattering
coefficient can be obtained by processing radar images, and S
and l have been obtained. At this time, the unknown parameter
is soil moisture, and LUT method is used to solve the soil
moisture.
4. RESULTS AND ANALYSIS
4.1 Verification result
The A, B and C of Linze sample area in July 11, 2008 were
selected for verification. The surface area of A was reed and the
range of NDVI value was 0.3-0.9. The surface type of B is
grassland, and the range of NDVI value is 0.1-0.35. The C in
the sample area is saline alkali soil, and the range of NDVI
value is 0.1-0.3. Using the LUT method based on fixed S value,
the soil moisture is retrieved from the selected three sample
regions, and the fixed S values can be obtained according to
table 3. The S values of the three samples of A, B and C are
0.2cm, 0.8cm and 0.5cm respectively. Then, soil moisture
retrieval in three sampling areas is carried out by using the
method proposed in this paper.
Figure 2 is the result of soil moisture inversion of the two
methods. (a) is the inversion result of the LUT method when the
S value is fixed based on area A. (b) is the inversion result using
the new method of this paper based on area A. (c) is the
inversion result of the LUT method when the S value is fixed
based on area B. (d) is the inversion result using the new
method of this paper based on area B. (e) is the inversion result
of the LUT method when the S value is fixed based on area C. (f)
is the inversion result using the new method of this paper based
on area C.
(a)S=0.2cm(A) (b)new method(A)
(c)S=0.8cm (B) (d)new method(B)
(e)S=0.5cm(C) (f)new method(C)
Figure 2.Result of soil moisture inversion of the two methods in
Linze area
4.2 Analysis
The accuracy is verified by the verification points in the sample
area. In Table 6, the correlation coefficient 2R and RMSE
between the soil moisture inversion and the measured values are
given.The test results show that the inversion results obtained
by the proposed method are consistent with the measured values,
and the inversion accuracy is higher.
Sampling
Area
Fixed S
value(2R )
Fixed S
value
(RMSE)
New
method
( 2R )
New
method
(RMSE)
Linze A 0.5922 0.1081 0.7101 0.0712
Linze B 0.6623 0.1183 0.7891 0.0681
Linze C 0.6912 0.1005 0.8440 0.0525
Table.6 Comparison of inversion accuracy
Table 6 shows that the inversion method based on the pixel
scale effective roughness and LUT based on the pixel scale
proposed in this paper has high inversion accuracy. It is not
only applicable to the inversion of soil moisture on the bare soil
surface in arid and semi-arid areas, but also suitable for the
areas with higher vegetation coverage, and the results of high
precision soil moisture inversion can be obtained.
5. CONCLUSION
In view of the problem of neglecting different surface
differences in the existing effective roughness inversion method,
this paper selects several kinds of surface types common in arid
and semi-arid areas to carry out a large number of experiments,
obtain the optimum roughness values of different types of areas,
and then construct the empirical function between S, l and
backscatter coefficients. Soil moisture inversion was carried out
by LUT method. After verification, the inversion accuracy of
this method is high, and it can be applied to arid and semi-arid
bare soil and vegetation covered surface.
(1) It is found that when using different S values in the same
area, the soil water retrieval value based on LUT method
decreases with the increase of S value through experiments,.
The International Archives of the Photogrammetry, Remote Sensing and Spatial Information Sciences, Volume XLII-3, 2018 ISPRS TC III Mid-term Symposium “Developments, Technologies and Applications in Remote Sensing”, 7–10 May, Beijing, China
This contribution has been peer-reviewed. https://doi.org/10.5194/isprs-archives-XLII-3-459-2018 | © Authors 2018. CC BY 4.0 License.
464

(2) Through a lot of experiments, it is found that when the LUT
method is used for inversion, the value of fixed S is not always
the same in the same coverage area.
(3) There is a good correlation between the optimal effective S,
l value and backscatter coefficient based on pixel scale.
(4) The inversion method of soil moisture based on pixel scale
effective roughness and LUT is proposed in this paper. The
high precision inversion results can be obtained in the area with
large vegetation coverage, and the effect of vegetation cover on
soil moisture inversion accuracy is avoided to some extent.
(5) The inversion method based on the optimal effective
roughness proposed in this paper can effectively avoid the error
of the measured roughness value.
ACKNOWLEDGEMENTS (OPTIONAL)
Thanks for the Envisat ASAR data and synchronous field
observation data from the "Watershed Allied Telemetry
Experimental Research" project provided by “Heihe Plan
Science Data Center, National Natural Science Foundation of
China”(http://www.heihedata.org).
REFERENCES
Baghdadi, N., 2002a. An empirical calibration of the integral
equation model based on SAR data, soil moisture and surface
roughness measurement over bare soils. International Journal
of Remote Sensing, 23(20), pp. 4325-4340.
Baghdadi, N., 2002b. Gaultier S, King C. Retrieving surface
roughness and soil moisture from synthetic aperture radar (SAR)
data using neural networks. Canadian Journal of Remote
Sensing, 28(5), pp. 701-711.
Baghdadi, N., 2005. King C, Bonnifait A. An empirical
calibration of the integral equation model based on SAR data
and soil parameters measurements. In: Geoscience and Remote
Sensing Symposium, IEEE International. IEEE, Vol.5, pp.
2646-2650.
Baghdadi, N., 2011. Chaaya J A, Zribi M. Semiempirical
Calibration of the Integral Equation Model for SAR Data in C-
Band and Cross Polarization Using Radar Images and Field
Measurements. IEEE Geoscience & Remote Sensing Letters,
8(1), pp. 14-18.
Baghdadi, N., 2012. Dubois-Fernandez P, Dupuis X, et al.
Sensitivity of Main Polarimetric Parameters of Multifrequency
Polarimetric SAR Data to Soil Moisture and Surface Roughness
Over Bare Agricultural Soils. IEEE Geoscience & Remote
Sensing Letters, 10(4), pp. 731-735.
Li,Zhen., 2011. Inversion model and method of SAR
parameters.Sc ience Press, pp. 32-34.
Lievens, H., 2010a. Effective roughness modelling as a tool for
soil moisture retrieval from C- and L-band SAR. Hydrology &
Earth System Sciences Discussions, 7(4), pp. 151-162.
Lievens, H., 2010b. Soil moisture retrieval from C- and L-band
SAR using modeled effective roughness. In: EGU General
Assembly. Vol. 12, pp. 3163-3167.
Toan,T,L.,1999. Improved Observation and Modelling of Bare
Soil Surfaces for Soil Moisture Retrieval. Geophysical
Research Abstracts,12(1),pp.112-117..
Verhoest, N., 2008. On the Soil Roughness Parameterization
Problem in Soil Moisture Retrieval of Bare Surfaces from
Synthetic Aperture Radar. Sensors, 8(7), pp. 4213-4218.
APPENDIX (OPTIONAL)
Any additional supporting data may be appended, provided the
paper does not exceed the limits given above.
Revised March 2018
The International Archives of the Photogrammetry, Remote Sensing and Spatial Information Sciences, Volume XLII-3, 2018 ISPRS TC III Mid-term Symposium “Developments, Technologies and Applications in Remote Sensing”, 7–10 May, Beijing, China
This contribution has been peer-reviewed. https://doi.org/10.5194/isprs-archives-XLII-3-459-2018 | © Authors 2018. CC BY 4.0 License.
465