a method for determining the strength of z- and c-purlin
TRANSCRIPT

Missouri University of Science and Technology Missouri University of Science and Technology
Scholars' Mine Scholars' Mine
International Specialty Conference on Cold-Formed Steel Structures
(1990) - 10th International Specialty Conference on Cold-Formed Steel Structures
Oct 23rd, 12:00 AM
A Method for Determining the Strength of Z- and C-purlin A Method for Determining the Strength of Z- and C-purlin
Supported Standing Seam Roof Systems Supported Standing Seam Roof Systems
Steven D. Brooks
Thomas M. Murray
Follow this and additional works at: https://scholarsmine.mst.edu/isccss
Part of the Structural Engineering Commons
Recommended Citation Recommended Citation Brooks, Steven D. and Murray, Thomas M., "A Method for Determining the Strength of Z- and C-purlin Supported Standing Seam Roof Systems" (1990). International Specialty Conference on Cold-Formed Steel Structures. 3. https://scholarsmine.mst.edu/isccss/10iccfss/10iccfss-session4/3
This Article - Conference proceedings is brought to you for free and open access by Scholars' Mine. It has been accepted for inclusion in International Specialty Conference on Cold-Formed Steel Structures by an authorized administrator of Scholars' Mine. This work is protected by U. S. Copyright Law. Unauthorized use including reproduction for redistribution requires the permission of the copyright holder. For more information, please contact [email protected].

Tenth International Specialty Conference on Cold·formed Steel Structures St. Louis, Missouri, U.S.A., October 23-24,1990
SUMMARY
A METHOD FOR DETERMINING THE STRENGTH
OF Z- AND C-PURLIN SUPPORTED
STANDING SEAM ROOF SYSTEMS
Steven D. Brooks 1
Thomas M Murray2
The considerable variation in deck profile, seam configuration and clip details in standing seam roof systems make it difficult, if not impossible, to develop analytical methods to predict the strength of these systems. However, it is possible to predict the strength of complete roof systems from the results of two purlin line, simple span tests. To verify the approach, twenty one sets of tests were conducted. Each set consisted of one, tWo purlin line simple span test and one, two to four purlin line, two or three span test. Failure loads for the multiple span tests were predicted using results from the simple span tests for the positive (sagging) moment region strength and AISI provisions for the negative (hogging) moment region strength. Comparison of pedicted and actual failure loads show that the strength of Z- and C-purlin supported standing seam roof systems can be predicted from single span tests and conventional design assumptions.
1 Steven D. Brooks, Formerly Graduate Research Assistant, The Charles E Via, Jr. Department of Civil Engineering, Virginia PolytechniC Institute and State University, Blacksburg, VA 24061.
2Thomas M. Murray, Montague·Betts Professor of Structural Steel DeSign, The Charles E Via, Jr. Department of Civil Engineering, Virginia Polytechnic Institute and State University, Blacksburg, VA 24061.
421

422
1. INTRODUCTION
1.1 Background
Because of the complex structural behavior of Z- and C-purlin supported standing seam roof systems, an experimental procedure to determine system strength under gravity loading has been proposed [Carballo, et al 1989]. The procedure is referred to as the "base test method" and uses the results of single span tests to predict the capacity of continuous multi-span systems. The primary objective of the research reported here was to validate the method through full scale testing of sets of two purlin line, simple span systems (the base tests) and three purlin line, three continuous span systems (the confirming tests).
The testing program consisted of two sequences of tests categorized by the bracing of the system. The first sequence used purlins braced at the rafters only and included six sets of tests, one with opposed Z-purlins, four with Z-purlins facing the same direction, and one with C-purlins facing the same direction. The second sequence of tests used purlins braced at the third points and included three sets of tests with Z-purlins facing the same direction. Each set of tests consisted of a single span test and a three span test. In addition, two sets of similar test results, as reported by Carballo et al [1989], were used in the valuation phase. Test details, test results, and conclusions are found in later sections.
1.2 The Base Test Method
The basic concept of the base test method is to predict the flexural failure load of a multi-span, multi-purlin line standing seam roof system from the experimental failure load of a single span. The basic component of the method is the failure load of the single span test called the "base test". From this failure load, the corresponding moment capacity of the standing seam roof system braced purlin is calculated for the single span. This phase of the method must be completed in the laboratory by loading a full scale single span system to failure.
A stiffness analysis with a nominal uniform load (say 100 pit) on a mUltispan system is then performed. The stiffness analysis results in maximum positive and maximum negative moments. For gravity loading, a positive moment is defined as a moment which causes compression in the purlin flange which is attached to the roof panel. A negative moment is a moment which causes tension in the same purlin flange.
Two failure loads are then calculated using the data thus obtained and two assumptions: (1) the positive moment capacity of standing seam roof system braced purlins is limited to that determined from the base test, and (2) the negative moment capacity is limited to that of a fully-braced purlin. The first failure load is the nominal uniform load used in the stiffness analysis multiplied by the ratio of the single span failure moment to the maximum positive moment from the stiffness analysis. The second failure load is the nominal uniform load multiplied by the ratio of the fully-braced theoretical flexural capacity of the cross section-tothe maximum negative moment from the stiffness analysis. The predicted failure load of the multi-span system is the minimum of the two calculated loads. Figure 1 summarizes the procedure.

423
Wus
P -C=I= I t~ ~-L--'·_L-.....L--.l-..L...,---L..-L-ht-n Wus = failure load of single span test
~ I ::;;'\ Mus = I --- Mus
Maximum moment of single span correspo.nding to wus.
a) Single Span Base Test
, W= 100p/!
~ i J I J .1 I l Mmax + = Maximum positive moment at a nominal load of 100 pit.
ft:M~ Mmax- = Maximum negative moment at a nominal load of 100 pit., at either the interior or exterior of the lap splice.
b) Multi-Span Stiffness AnalysIs
MAISI = 1986 AISI Allowable flexural capacity x 1.67
Wp3 = Predicted failure load of the multi-span system
Wp3 = minimum of
M M~ x 100 pit
max+
or
~ x100plf Mmax-
c) Predicted Failure load
FIGURE 1 BASE TEST METHOD

424
The following restriction applies to the method: the panels, clips, purl ins, and bracing configuration used in the base test must be identical to those which will be used in the multi-span systems. For this reason, a base test must be performed for each combination of deck, clip, bracing, and purlin size that will be designed using the method.
2. TEST DETAILS
2.1 Test Components
Components used in the testing were supplied by several different manufacturers belonging to the Metal Building Manufacturers Association. Identical panels, clips, and purlins were used in constructing the single span and three span tests that composed each test set. Table 1 shows the configurations used in the test program.
Test Identification System. The following are examples of the method used to identify the tests.
Example 1: C-R-R/8-1
Example 2: Z-T-P/F-3 (0)
A C or Z indicates a C- or a Z-purlin.
The second letter is R or T, indicating rafter only bracing (R) or rafter and third point bracing (T).
The third letter is R or P, indicating rib (R) or pan (P) type panels.
The fourth letter is 8 or F, indicating a two piece sliding clip (8) or a one piece fixed clip (F).
The number at the end indicates the number of spans (1 or 3).
(0) at the end of an identification indicates that the purlin flanges were opposing each other, otherwise the flanges were facing the same direction.
Purlins. Two types of purlins were used in the test sequences; Z-purlins and C-purlins. Depth, flange width, edge stiffener, thicknesses and other dimensions varied between test sets. Tensile coupon tests were conducted using material taken from the web area of representative purlins for each set of tests.
Panels. The panels used in the tests were of two basic configurations; "pan" type panels, Figure 2, or "rib" type panels, Figure 3. The panel widths" depths, corrugations, joint details, and seaming requirements varied between test sets. The palJellengths were 7 ft. 0 in. for the single spans and 14 ft. 43/4 in. for the three span tests.
Clips. The "standing seam clips" used in the tests were of two types; one piece fixed clips and two piece sliding clips. The exact clip detail varied among the sets of tests; representative configurations are shown in Figure 4.

425
TABLEt
MATRIX OF TEST CONF1GURATIONS
Test Purlirl - Panel Clip Purlin Identification Type- Bracing Type Type Orrentation
Z-R-R/S Z- Rafter Rib Sliding Facing
Z-R-R/F z- Rafter Rib Fixed Facing
Z~P/F Z- Rafter Pan FIXed Facing
Z-R-P/S z- Rafter Pan Sliding Facing
C~R-P!S C- Rafter Pan Sliding Facing
Z-R~R/F (Of Z- Rafter Rib Fixed Opposed
Z-T-P/F Z- Third* Pan Fixed Facing
Z-T-P/S Z- Third* Pan Sliding Facing
. Z-T-RjS z- Third* Rib Sliding Facing
*Bracing at rafters and intermediate. third points of span.
Note: lap' length is total overlap at inferior rafter location.
lap Length in 3-Span Tests
4 ft. a in.
3 ft. a in.
3 ft. g in.
3 ft. 4 3/4 in_
4 ft. 9 in.
3 ft. a in.
5 ft. 4 in.
4 ft. 5 1/2 in.
4 ft. e in.

426
FIGURE 2 PAN TYPE PANEL PROFILES TESTED
FIGURE 3 RIB TYPE PANEL PROFILES TESTED

427
a) Two Piece Sliding Clip
b) One Piece Fixed Clip
FIGURE 4 REPRESENTATIVE CLIP CONFIGURATIONS

428
Bracing. The bracin\} at the rafters consisted of 1 (2: in. diameter tension rods connected to the pUFlin webs near the top flange and anchored to a rigid stand attached to the rafter. Figu~e 5 shows details of the rafter braCing system.
Bracing used in the interior of the spans consisted of a continuous angle bolted to the bottom flanges of the purrms. A set of rolfers was attached to each end of the angles. The falters were restricfed to vertical movement by channels anchored to the laboratory floor. This system allowed the. purlins to detrect in a vertical direction while providing lateral bracing at the third points of the spans. Figure 6 is a- schematic of the bracing system.
2:.2 Test Setup
The simulated gravity loading was app6ed by means of a vacuum chamber. Air is evacuated by a motor driven blower and auxiliary "shop-type" vacuum cleaners. When testing a single span, a telTT!)orary wall was constructed forming a 25 ft. box within the larger ehamber.
The single span base tests consisted of two lines of purlins 5 ft. a in. on center with a span of 25 ft. frin. The purfins were bolted through the bottom flanges tOe-the rafter. The panets used were 7 ft. 0 in. in length. This permitted a t ft. 0 in. overhang beyond the webs of the purlins- In some: tests, the panel-to~ purlin c1fps- were boLted to- the purlins with 1/4" bolts to simplify removal 01 the panels after testing, otherwise, self-drilling fasteners were used. A coltHormed angle was attached continuously fo one edge of the panels to- simulate the stiffness provided by an eave strut. Figure 7 is a cross section of the single span test.
The three span tests consisted of three or foUl" lines of purlins depending on whether the purlin flanges were facing the same direction or opposing- each other, respectfve~y. Each of the three spans were 23 ft. 6 in. between rafters. The lap splices over the interior rafters varied between tests and were set by the manufacturer of the purlins. lap lengths ar.e listed in Tabre 1. The purlins were connected througfEtheir bottom flanges to the rafter. The panels were 14 ft. 4 3J4 in. in length. When three lines of purfins were used, the purfins were spaced 5 fl o in. on center with a 2 ft. 2 3/8 in. overhang of the panets. When-fourpurlin lines were used, the purlins were- on a 3: ft. 7 in. spacing with an overhang of 1 ft 93:/4 in. The: clips were bolted to the purlfns with 1/4 in. bolts to simplffy remowof the panefs after testing. A cold-formed angle was attached continuously to one ecfge onhe panels to act as an eave. Figure 8 is a: cross section of the three span test setup.
The simulated gravity foading was- measured by- a U"tube manometer. linear 9ispJacement transducers were used to measure the midspan- vertical deflections- of- the purlins. Measurements were made for both purim In the- single span tests and al[ p\;Jrlins In-both exterior bays orthe-three span- tests.
lateral movement of the system was measured at ttle midspan of the singre span tests and at the midspan of both end bays of the three span- tests.

429
.s"tS Tension Rods
FIGURE 5 RAFTER BRACING DETAILS
FIGURE 6 THIRD POINT BRACING DETAILS
Channels Used to Resist Lateral Movementd Purlins

430
.5" 0 Tension R()ds Lateral Bracing at Rafters
FIGURE 7 CROSS-SECTION OF SINGLE SPAN BASE TEST SETUP
I.. configuration. to be Tested~
,II '" 5'-0" 2'-0"1 Ang~e Used ~-O ~ I'" 5 -0 __ I'" _I" -I to Simulate I
Eo .. of StrucMe l~i =:::t-=i=r=_=_= __ =3=\=_~=i==-=--=-=--=-= __ =::=e====i :5 JC \5" Rods for =:I
Lateral Bracing at Rafters
FIGURE 8 CROSS-SECTION OF THREE-SPAN TEST SETUP

431
3. TEST RESULTS
3.1 Rafters Braced Test Results
The rafter braced sequence of tests consisted of six sets of tests with each set of tests including a single span base test and a three span confirming test. The bracing of the system was as shown in Figures 5 and 7. Four of the six sets of tests were conducted using Z-purlins facing the same direction. One set of tests was conducted using C-purlins facing the same direction in each bay, but opposite in adjoining bays. For these five test sets, three lines of purlins were used in the three span tests and two lines in the single span tests. The sixth set of tests used opposed Z-purlins. Two lines were used in the single span test and four lines of purlins were used in the three span test. Table 2 shows the failure load and failure mode for each test.
The failure mode for the Z-purlin tests that were conducted with flanges facing in the same direction, except Test Z-R-R/S-3, was cross-section failure after considerable lateral movement. The failure mode for Test Z-R-R/S-3 was local buckling approximately 1 ft. into the interior span from the end of the continuity lap. On close inspection of the failed purlins it was determined that damage during shipping or handling had occurred at this location which caused premature local buckling. Cross-section failure occurred near midspan in the base tests and approximately 10ft. from one of the exterior rafter supports in the three continuous span tests (that is, in the positive moment region of an exterior span). Failure of the C-purlin and opposed Z-purlin tests was local lip/flange/web buckling. Relatively little lateral movement occurred before failure in these tests.
3.2 Third Point Braced Test Results
The third point braced sequence of tests consisted of three sets of tests with each set containing a single span base test and a three span confirming test. The bracing of the systems was as shown in Figures 6 and 8. The three sets of tests used Z-purlins facing the same direction. Two lines of purlins were used in the single span tests and three lines of purlins were used in the three span confirming test. Table 3 is a summary of the test results, showing failure loads and failure modes.
The failure mode for all of the base tests was local lip/flange/web buckling after some lateral movement. Failure occurred near the midspan in each test.
The failure mode for the confirming tests Z-T-P /F and Z-T-R/S was local lip/flange/web buckling after some lateral movement. In confirming test Z-T-P IS, a lateral brace-to-purlin flange connection failed causing premature failure of the system.

432
TABLE 2
SUMMARY OF RAFTER BRACED T£ST ReSULTS
Failure Test No. of Load Fa~ure
Designation Spans (pIt) Mode
Z-R-R/S one 136.5 LM
three 152.9 -LM
Z-R-R/F one 64.5 LM
three 1{)7~ 1 LM
Z-R-P/S one 130.0 LM
three 128.2 LM
Z-R-P/F one 60.48 t.M
three 102.5 LM
CoR-PIS one 119.0 LB
three 217.0 LB
Z-R-R/F (0) one SU) LB
three 158.0 LB
LB = Local buckling of fip. flange, web.
LM = Failure of cross-section after considerable lateral movement.

433
TABLE 3
SUMMARY OF THIRD POINTS BRACED TEST RESULTS
Failure Test No.d Load Failure
Designation Spans (PIt) Mode
Z-T-PjF one 126.0 LB
'three 223.0 LB
Z-T-PjS one 120 LB
three 188.-0 BR
ZcT-R/S one 126:0 LB
three 238;0 LB
LB = Local buckling of lip, flange, web.
LM Failure of cross-section after considerable lateral movement.
SR = Failure of a ~ateral brace-to-purlin flange connection.

434
4. EVALUATION OF RESULTS AND RECOMMENDATIONS
4.1 Evaluation of Results
Tables 4 and 5 show the predicted three continuous span failure loads, the actual failure loads, and the ratio of actual-to-predicted failure I.oads. The predicted failure loads were calculated using measured cross-section and material properties and the procedure described in Section 1.2. For all tests, the predicted failure location was at the maximum moment location in the exterior spans of the three span confirming tests, that is, in the positive moment region. This location is also the location of the actual pOint of failure except for tests Z-RR/S and Z-T-P IS. As previously described, the failure modes for the three span continuous tests in sets Z-R-R/S and Z-T-P /S were unrelated to the purposes of this study. Except for test sets Z-R-R/S and Z-T-P IS, the ratio of actual-topredicted failure loads was between 0.87 and 1.02 with an average value of 0.95.
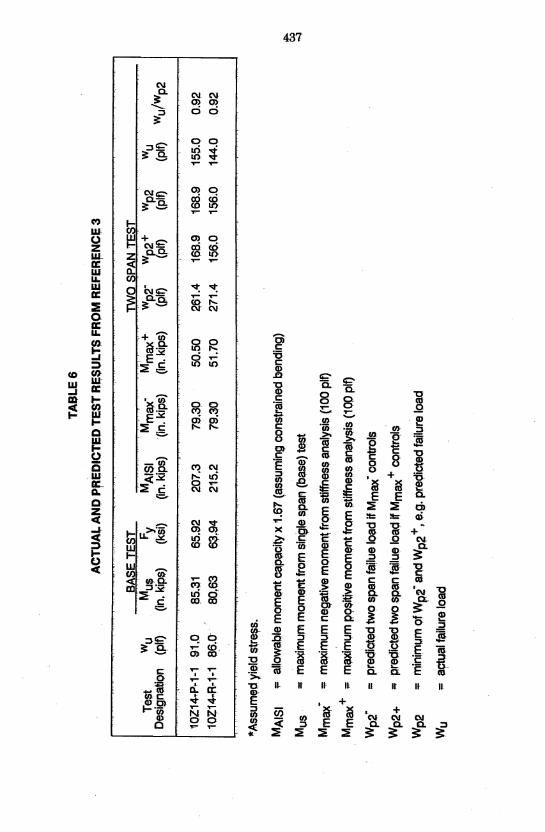
Table 6 shows results for two sets of base/confirming tests as reported by Carballo et al [1989]. The confirming tests were two span continuous tests. The failure mode for all four tests was cross-section failure after considerable lateral movement. The failure location was near midspan, that is, the positive moment region, for all tests. The ratio of actual-to-predicted failure load for the two sets of tests was 0.92.
In summary, from the results of the nine valid sets of base/confirming tests shown in Tables 4, 5, and 6, the range of the ratio of actual-to-predicted failure loads was 0.87 to 1.02 with an average value of 0.94.
4.2 Recommendation
The testing programs described in this study encompassed a wide range of metal building standing seam roof systems. Pan-type and rib-type panels, sliding and fixed clips, and C- and Z-purlins were included in the study. The test results clearly show that the "base test method" is a valid experimental/analytical procedure to determine the strength of C- and Z-purlin supported standing seam roof systems. Its use is recommended with the following limitations:
1. The base test must be conducted using nominally identical panel, clip, insulation, and purlin components as are used in the actual standing seam roof system.
2. The failure moment determined from the base test can only be used to determine the capacity of roof systems using identical purlins.
3. The span of the base test must be greater than or equal to the largest span in the actual roof system.
4. The purlin line spacing in the base test must be greater than or equal to the purlin spacing in the actual roof system.

TA
BL
E 4
AC
TU
AL
AN
D P
RE
DIC
TE
D R
AF
TE
R B
RA
CE
D T
ES
T R
ES
UL
TS
BA
SE
TE
ST
Te
st
Wu
Mu
s F
y M
AIS
I M
ma>
c M
ma
x+
De
sig
na
tion
(p
it)
(in.
kip
s)
(ksi
) (in
. ki
ps)
(in
. ki
ps)
O
n. k
ips)
Z-R
-R/S
1
36
.5
128.
0 59
.80
197.
0 4
0.1
0
50
.70
Z-R
-R/F
6
4.5
6
0.5
68
.51
10
9.9
5
1.1
0
51
.40
Z-R
-P/F
6
0.5
56
.7
59.9
3 1
05
.4
46
.40
5
1.2
0
Z-R
-P/S
8
0.0
7
5.0
59
.02
174.
1 4
7.2
0
51
.00
C-R
-P/S
1
19
.0
11
1.6
6
6.0
0
143.
2 4
2.7
0
50
.40
Z-R
-R/F
(0)
8
7.0
8
1.6
6
1.5
7
118.
1 5
0.9
0
51
.20
*Ass
um
ed
yie
ld s
tre
ss.
MA
ISI
Mu
s
Mm
ax
+
Mm
ax
Wp3
-
Wp3
+
Wp
3
Wu
allo
wa
ble
mo
me
nt c
ap
aci
ty x
1.6
7 (
ass
um
ing
co
nst
rain
ed
be
nd
ing
)
ma
xim
um
mo
me
nt f
rom
sin
gle
spa
n (
base
) te
st
ma
xim
um
ne
ga
tive
mo
me
nt f
rom
stif
fne
ss a
na
lysi
s (1
00 p
it)
ma
xim
um
po
sitiv
e m
om
en
t fro
m s
tiffn
ess
an
aly
sis
(100
pit)
pre
dic
ted
thre
e s
pa
n fa
ilue
loa
d if
Mm
ax-
con
tro
ls
pre
dic
ted
th
ree
sp
an
failu
e lo
ad
if M
ma
x +
co
ntr
ols
min
imu
m o
f Wp
3-
an
d W
p3+
, e.
g. p
red
icte
d fa
ilure
loa
d
act
ua
l fai
lure
lo
ad
TH
RE
E ~PAN T
ES
T
wp
3-
wp3
+
(pit)
(p
it)
49
1.3
2
52
.4
215.
1 11
7.7
22
7.2
11
0.7
36
8.9
14
7.0
33
5.4
2
21
.4
23
2.0
15
9.3
wp
3
Wu
wu
/wp
3
(pit)
(p
it)
25
2.4
15
2.9
0.61
11
7.7
10
7.1
0.91
11
0.7
10
2.5
0.9
3
14
7.0
12
8.2
0.8
7
22
1.4
2
17
.0
0.9
8
15
9.3
1
58
.0
0.9
9
""" ~
en

TAB
LES
A
CTU
AL
AN
D P
RE
DIC
TED
tH
IRD
PO
INT
BA
AC
ED
rE
st
RE
SU
LTS
BASE
TES
T . T
HR
EE S
PAN
TE
S'"
Tes
t W
u De
slgn
~tlo
n (p
it)
Mus
I
Fy
(In. k
ips)
(k
si)
MA
ISI
Mm
ax-
Mm
ax+
w
p3-
wp
3+
w
p3
Wu
(in.
kips
) (In
. ki
ps)
(in.
kips
) (p
it)
(pit)
(p
it)
(pit)
w
u/W
ps
Z-T-
P/F
126.
0 11
8.1
52.4
4 13
3.2
40.1
0 50
.26
z-t-P
/S
120.
0 11
2.5
62.2
9 17
7.1
48.1
0 50
.50
Z-T-
R/S
12
6.0
118.
1 62
.57
196.
8 46
.20
50.7
0
*Ass
umed
yie
ld s
tress
.
MA
ISI
allo
wab
le m
omen
t cap
aoity
)( 1
.(37
(ass
umin
g co
nstr
aine
d be
ndin
g)
Mus
=
m
axim
um m
omen
t fro
m s
ingl
e sp
an (
base
) te
st
Mm
a£
'"
m
axim
um n
egat
ive
mom
ent f
rom
stif
fnes
s an
alys
is (
100
pit)
Mm
ax +
==
max
imum
pO
Sitiv
e m
omen
t tro
m s
tiffn
ess
anal
ysis
(10
0 pi
t)
Wp3
-==
pred
icte
d th
ree
span
failu
e lo
ad if
Mm
a£
con
trol
s
Wp
3+
pr
edic
ted
thre
e S
pan
failu
e lo
ad if
Mm
ax +
oon
trolS
Wp3
=
m
inim
um o
f Wp3
" an
d W
p3 +
, e.
g. p
redi
cted
failu
re lo
ad
Wu
== ac
tual
failu
re lo
ad
332.
2 23
5.3
235.
3 22
3.0
0.95
368.
2 22
2.8
222.
8 18
8.0
0.84
426.
0 23
2.9
232.
9 23
8.0
1.02
"'" CIj
~
TAB
LE 6
AC
TUA
L A
NP
PflE
DIC
TED
TE
ST
RES
ULT
S FR
OM
REF
ERJ:
NC
E 3
BASE
TE
ST
TWO
SPA
N T
EST
Test
W
u D
esig
natio
n (p
it)
Mu:~
Fy
(in
. ~ip
$)
(ksi
) M
AISI
.
Mm~-
M;"
ax+
Wp2
-w
p2+
w
p2
Wu
(in. k
ips)
(in
. kip
s)
(in. k
ips)
(p
it)
(pit)
(p
it)
(pit)
w
u/w
P2
10Z
14.P
.1-1
91
.0
10Z
14-R
-1-1
66
,0
~AssumeP y
ield
stre~s.
135.
31
80,6
3 65
.92
~,94
207.
3 21
5,2
79.3
0
79.3
0 50
.50
51.7
0
MAI
SI
;=
allo
waQ
le m
omen
t cap
acity
x 1
.67
(ass
l,Jm
ins
cons
train
ed b
endi
ng)
Mus
""
max
imum
mO
mel
'lt fro
m s
ingl
e sp
an (
base
) tes
t
Mm
S)("
:;;: m
axim
um n
eQat
ive momen~ fr
Qm
stif
fnes
s an
alys
is (
100
pit)
Mm
ax +
""
max
imum
PQ
sitive
mom
ent f
ram
stif
fnes
s an
alys
is (
100
pit)
Wp2
" ""
preq
ictt;
ld tw
o sp
an fa
ilue
load
if M
max
" con
trols
Wp2
+
;:;:p
rt;lQ
iota
d tw
oapa
n fa
ilu!,
load
if M
max
+ c
ontro
ls
Wp2
""
min
imum
of W
pf a
nd W
p2 + ,
l;I.g
. pre
dict
ed fa
ilure
load
Wu
"" a9
lual
failu
re lo
ad
ge1.
4 16
8,9
168.
9 15
5.0
0.92
27
1.4
156.
0 15
6.0
144.
0 0.
92
~

438
4.3 Example Calculations
A proposed roof system is to be supported by six lines of equally spaced Z8 x 3 x 0.074, Fy = 50 ksi, purlins. Each purlin line consists of four equal 25 ft. spans. The purlin lines are 5 ft. 0 in. on center. Full moment continuity is assumed at each rafter. The top flanges of all purlins are facing in the direction of the ridge. The standing seam panels are connected to the eave strut with selfdrilling fasteners at 12 in. on center. Four inch "metal building insulation" is specified for the project.
A simple span base test was conducted using two purlin lines spaced 5 ft. o in. on center. The purlins were oriented with top flanges facing in the same direction. A cold-formed base angle was attached at the "eave" end of the panels using self-drilling fasteners at 12 in. on center. The base angle was used to simulate eave strut effects. The base test was constructed using standing seam panels, clips and insulation identical to what will be used in the proposed building. The base test span was 25 ft. and the fail~e load per purlin line was 110 plf. The corresponding failure moment is 110 (25) /8 = 8,594 ft-Ibs = 103.1 in-kips. The allowable capacity is then 103.1/1.67 = 61.7 in-kips.
The flexural cross-section strength was determined using the provisions of the AISI Specification [1986]. The allowable moment capacity for the section is 82.1 in-kips.
Next, a stiffness analysiS of a four span purlin line was conducted. The resulting moment diagram for a 100 plf nominal load is shown in Figure 9. The controlling positive moment is 57.9 in-kips and the controlling negative moment is 64.9 in-kips both per purlin.
Using the base test method, the allowable capacity of the proposed roof system is then
w = min
Positive moment region: 61.7/57.9 x 100 = 106.6plf
Negative moment region: 82.1/64.9 x 100 = 126.5 plf
Assuming the positive moment region controls (106.6 pit), the negative moment region capacity is recalculated considering shear plus bending effects and found to be 119.7 plf. Thus, the capacity of the proposed standing seam roof system per purlin line is 106.E>plf.

439
IOOpif
t i i i ! i ! ! i i I i I r I t i r i I r ~ 251 1/ 251
+ 251 ~ 251
+ 1 1
FIGURE 9 MOMENT DIAGRAM FOR EXAMPLE CALCULATIONS

440~
ACKNOWLEGEMENTS
The research described in this paper was sponsored by the Metat BuDdingManufacturers Association and the AmerIcan Iron and Steel Insfltute. The vBluabie guidance of the MBMA Secondary Framing Subcommittee is recogntzed.
APPENDIX - REFERENCES
Carballo, M., S. Holzer and- T. M. Murray (1989}, "Strength of Z-Purlin Supported Standing Seam Roof S~tems undel' Gravity loading', Research Progress Report CE/VPJ:.ST89{03. The Charres E. Via Department of CIvil Engineering. Virginia Polytechnic Institute and State University, Blacksburg, Virginia. (unpublished).
"Specification for 'the Design of Cold-Formed-Members", American Iton and Steel Institute (1986), Washington, D.C.