a metal-free organic-inorganic aqueous flow...
TRANSCRIPT

LETTERdoi:10.1038/nature12909
A metal-free organic––inorganic aqueous flow batteryBrian Huskinson1*, Michael P. Marshak1,2*, Changwon Suh2, Suleyman Er2,3, Michael R. Gerhardt1, Cooper J. Galvin2,Xudong Chen2, Alan Aspuru-Guzik2, Roy G. Gordon1,2 & Michael J. Aziz1
As the fraction of electricity generation from intermittent renew-able sources—such as solar or wind—grows, the ability to store largeamounts of electrical energy is of increasing importance. Solid-electrodebatteries maintain discharge at peak power for far too short a time tofully regulate wind or solar power output1,2. In contrast, flow batteriescan independently scale the power (electrode area) and energy (arbit-rarily large storage volume) components of the system by maintainingall of the electro-active species in fluid form3–5. Wide-scale utiliza-tion of flow batteries is, however, limited by the abundance and costof these materials, particularly those using redox-active metals andprecious-metal electrocatalysts6,7. Here we describe a class of energystorage materials that exploits the favourable chemical and electro-chemical properties of a family of molecules known as quinones.The example we demonstrate is a metal-free flow battery based on theredox chemistry of 9,10-anthraquinone-2,7-disulphonic acid (AQDS).AQDS undergoes extremely rapid and reversible two-electron two-proton reduction on a glassy carbon electrode in sulphuric acid. Anaqueous flow battery with inexpensive carbon electrodes, combin-ing the quinone/hydroquinone couple with the Br2/Br2 redox cou-ple, yields a peak galvanic power density exceeding 0.6 W cm22 at1.3 A cm22. Cycling of this quinone–bromide flow battery showed.99 per cent storage capacity retention per cycle. The organic anthra-quinone species can be synthesized from inexpensive commoditychemicals8. This organic approach permits tuning of important prop-erties such as the reduction potential and solubility by adding func-tional groups: for example, we demonstrate that the addition of twohydroxy groups to AQDS increases the open circuit potential of thecell by 11% and we describe a pathway for further increases in cellvoltage. The use of p-aromatic redox-active organic molecules insteadof redox-active metals represents a new and promising direction forrealizing massive electrical energy storage at greatly reduced cost.
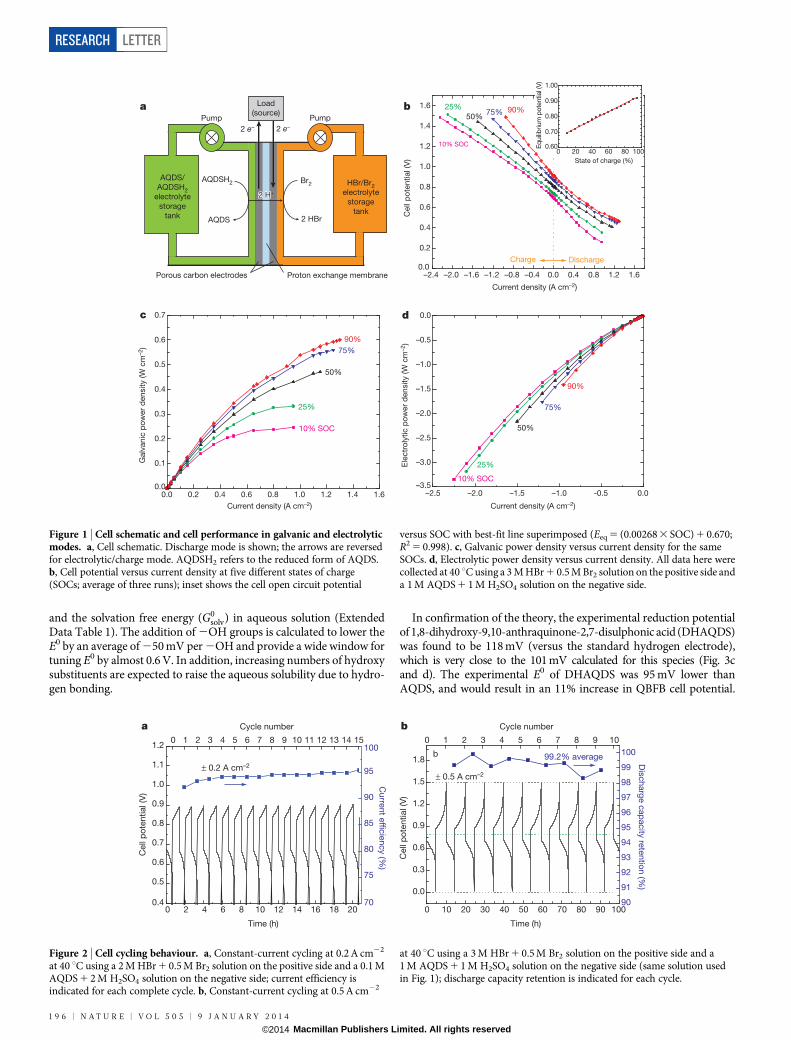
Solutions of AQDS in sulphuric acid (negative side) and Br2 in HBr(positive side) were pumped through a flow cell as shown schematicallyin Fig. 1a. The quinone–bromide flow battery (QBFB) was constructedusing a Nafion 212 membrane sandwiched between Toray carbon paperelectrodes (six stacked on each side) with no catalysts; it is similar to acell described elsewhere (see figure 2 in ref. 7). We report the potential–current response (Fig. 1b) and the potential–power relationship (Fig. 1cand d) for various states of charge (SOCs; measured with respect tothe quinone side of the cell). As the SOC increased from 10% to 90%,the open-circuit potential increased linearly from 0.69 V to 0.92 V. Inthe galvanic direction, peak power densities were 0.246 W cm22 and0.600 W cm22 at these same SOCs, respectively (Fig. 1c). To avoidsignificant water splitting in the electrolytic direction, we used a cut-off voltage of 1.5 V, at which point the current densities observedat 10% and 90% SOCs were 22.25 A cm22 and 20.95 A cm22, respect-ively, with corresponding power densities of 23.342 W cm22 and21.414 W cm22.
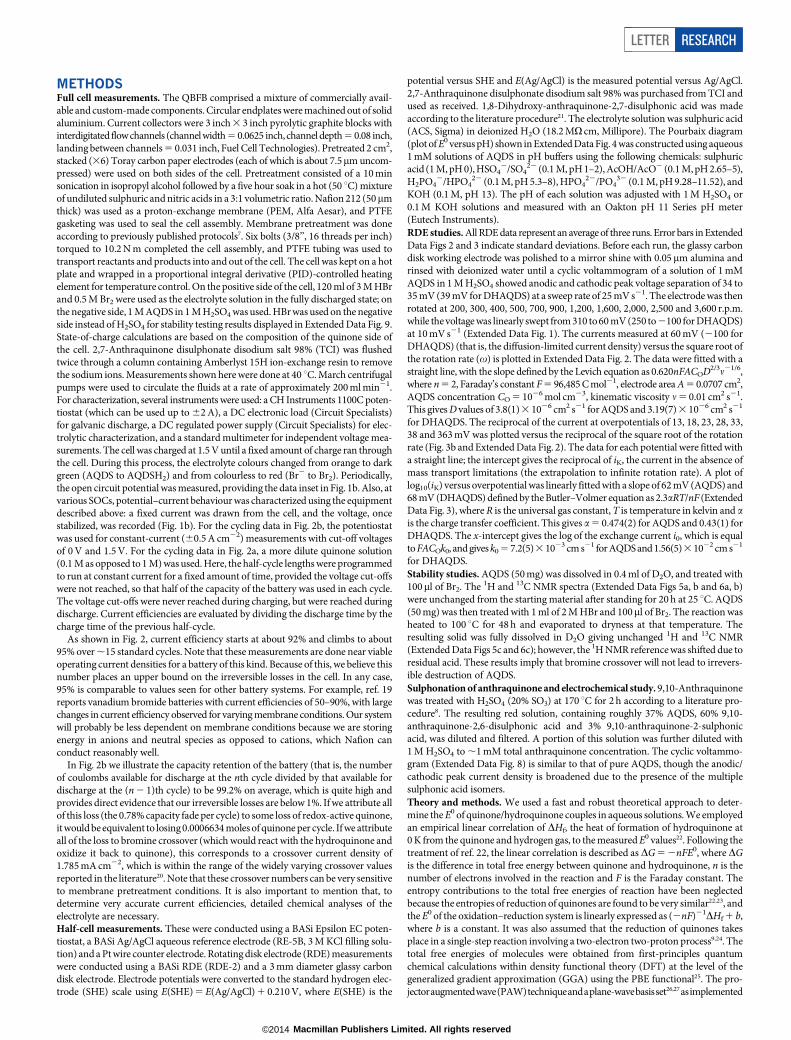
In Fig. 2 we report the results of initial cycling studies for this battery,to test for consistent performance over longer timescales. Figure 2ashows cycling data at 60.2 A cm22 using 50% of the total capacity of
the battery. The cycles are highly reproducible and indicate that currentefficiencies for the battery are around 95%. Figure 2b shows constant-current cycling data, collected at 60.5 A cm22, using voltage cut-offs of0 V and 1.5 V. These tests were done using the identical solutions usedin the battery for Fig. 1b–d. The galvanic discharge capacity retention(that is, the number of coulombs extracted in one cycle divided by thenumber of coulombs extracted in the previous cycle) is above 99%,indicating the battery is capable of operating with minimal capacityfade and suggesting that current efficiencies are actually closer to 99%.Full characterization of the current efficiency will require slower cyc-ling experiments and chemical characterization of the electrolyte solu-tions after extended cycling.
To gain a better understanding of the quinone half-reaction oncarbon, AQDS was subjected to half-cell electrochemical measure-ments. Cyclic voltammetry of a 1 mM solution of AQDS in 1 M sulphuricacid on a glassy carbon disk working electrode shows current peaks cor-responding to reduction and oxidation of the anthraquinone species9–11
(Fig. 3d, solid trace). The peak separation of 34 mV is close to the valueof 59 mV/n, where n is the number of electrons involved, expected fora two-electron process. Rotation of this disk at a variety of rates yieldsmass-transport-limited currents (Fig. 3a) from which the AQDS dif-fusion coefficient (D 5 3.8(1)3 1026 cm2 s21) can be determined; through-out this paper, the numbers reported in parentheses indicate thestandard deviation in the last reported digit. Koutecky–Levich analysisat low overpotentials (Fig. 3b) can be extrapolated to infinite rotationrate and fitted to the Butler–Volmer equation (Extended Data Fig. 3a) togive the kinetic reduction rate constant k0 5 7.2(5) 3 1023 cm s21. Thisrate constant is greater than that found for other species used in flowbatteries such as V31/V21, Br2/Br2 and S4
22/S222 (see table 2 in ref. 3).
It implies that the voltage loss due to the rate of surface electrochemicalreactions is negligible. The high rate is apparently due to an outer-sphere two-electron reduction into the aromatic p system requiringlittle reorganizational energy. The electrochemical reversibility of thetwo-electron redox reaction was confirmed by fitting the slope to theButler–Volmer equation (Extended Data Fig. 3a), giving the transfercoefficient a 5 0.474(2), which is close to the value of 0.5 expected foran ideally reversible reaction. The Pourbaix diagram (Extended DataFig. 4) confirms that a two-electron, two-proton reduction occurs inacidic solution, and yields approximate pKa values of 7 and 11 for thereduced AQDS species11.
Functionalization of the anthraquinone backbone with electron-donating groups such as hydroxy can be expected lower the reductionpotential of AQDS (E0), thereby raising the cell voltage12. Hydroxy-substituted anthraquinones are synthesized through oxidation reac-tions that may be performed at minimal cost. They are also naturalproducts that have been extracted for millennia from common sourcessuch as rhubarb and could even provide a renewable source for futureanthraquinone-based electrolyte solutions.
Quantum chemical calculations of un-substituted and hydroxy-substituted AQDS were performed to predict how substitution patternswould change both E0 of the quinone/hydroquinone couples (Fig. 3c)
1Harvard School of Engineering and Applied Sciences, 29 Oxford Street, Cambridge, Massachusetts 02138, USA. 2Department of Chemistry and Chemical Biology, Harvard University, 12 Oxford Street,Cambridge, Massachusetts 02138, USA. 3Molecular Materials and Nanosystems, Eindhoven University of Technology, PO Box 513, 5600 MB Eindhoven, The Netherlands.*These authors contributed equally to this work.
9 J A N U A R Y 2 0 1 4 | V O L 5 0 5 | N A T U R E | 1 9 5
Macmillan Publishers Limited. All rights reserved©2014
and the solvation free energy (G0solv) in aqueous solution (Extended
Data Table 1). The addition of 2OH groups is calculated to lower theE0 by an average of 250 mV per 2OH and provide a wide window fortuning E0 by almost 0.6 V. In addition, increasing numbers of hydroxysubstituents are expected to raise the aqueous solubility due to hydro-gen bonding.
In confirmation of the theory, the experimental reduction potentialof 1,8-dihydroxy-9,10-anthraquinone-2,7-disulphonic acid (DHAQDS)was found to be 118 mV (versus the standard hydrogen electrode),which is very close to the 101 mV calculated for this species (Fig. 3cand d). The experimental E0 of DHAQDS was 95 mV lower thanAQDS, and would result in an 11% increase in QBFB cell potential.
–2.4 –2.0 –1.6 –1.2 –0.8 –0.4 0.0 0.4 0.8 1.2 1.60.0
0.2
0.4
0.6
0.8
1.0
1.2
1.4
1.6b
Cell
po
tential (V
)
Current density (A cm–2)
Charge Discharge
10% SOC
25%
50%75% 90%
0.0 0.2 0.4 0.6 0.8 1.0 1.2 1.4 1.60.0
0.1
0.2
0.3
0.4
0.5
0.6
0.7c
Galv
anic
po
wer
density (W
cm
–2)
Current density (A cm–2)
10% SOC
25%
50%
75%
90%
–2.5 –2.0 –1.5 –1.0 -0.5 0.0–3.5
–3.0
–2.5
–2.0
–1.5
–1.0
–0.5
0.0d
Ele
ctr
oly
tic p
ow
er
density (W
cm
–2)
Current density (A cm–2)
10% SOC
25%
50%
75%
90%
2 HBr
Br2
2 e–2 e–
AQDS/
AQDSH2
electrolyte
storage
tank
Porous carbon electrodes Proton exchange membrane
Pump
AQDS
AQDSH2 HBr/Br2
electrolyte
storage
tank
Pump
Load
(source)a
2 H+2 H2 H+2 H+
0 20 40 60 80 1000.60
0.70
0.80
0.90
1.00
Eq
uili
brium
pote
ntial (
V)
State of charge (%)
Figure 1 | Cell schematic and cell performance in galvanic and electrolyticmodes. a, Cell schematic. Discharge mode is shown; the arrows are reversedfor electrolytic/charge mode. AQDSH2 refers to the reduced form of AQDS.b, Cell potential versus current density at five different states of charge(SOCs; average of three runs); inset shows the cell open circuit potential
versus SOC with best-fit line superimposed (Eeq 5 (0.00268 3 SOC) 1 0.670;R2 5 0.998). c, Galvanic power density versus current density for the sameSOCs. d, Electrolytic power density versus current density. All data here werecollected at 40 uC using a 3 M HBr 1 0.5 M Br2 solution on the positive side anda 1 M AQDS 1 1 M H2SO4 solution on the negative side.
0.4
0.5
0.6
0.7
0.8
0.9
1.0
1.1
1.2
Cell
po
tential (V
)
0 2 4 6 8 10 12 14 16 18 20
Time (h)
± 0.2 A cm–2
70
75
80
85
90
95
100
Cu
rrent e
fficie
ncy (%
)
0 1 2 3 4 5 6 7 8 9 10 11 12 13 14 15
Cycle number
0 10 20 30 40 50 60 70 80 90 100
0.0
0.3
0.6
0.9
1.2
1.5
1.8
Cell
po
tential (V
)
Time (h)
± 0.5 A cm–2
90
91
92
93
94
95
96
97
98
99
100
Dis
ch
arg
e c
ap
acity
rete
ntio
n (%
)
99.2% average
0 1 2 3 4 5 6 7 8 9 10
Cycle number
b
a b
Figure 2 | Cell cycling behaviour. a, Constant-current cycling at 0.2 A cm22
at 40 uC using a 2 M HBr 1 0.5 M Br2 solution on the positive side and a 0.1 MAQDS 1 2 M H2SO4 solution on the negative side; current efficiency isindicated for each complete cycle. b, Constant-current cycling at 0.5 A cm22
at 40 uC using a 3 M HBr 1 0.5 M Br2 solution on the positive side and a1 M AQDS 1 1 M H2SO4 solution on the negative side (same solution usedin Fig. 1); discharge capacity retention is indicated for each cycle.
RESEARCH LETTER
1 9 6 | N A T U R E | V O L 5 0 5 | 9 J A N U A R Y 2 0 1 4
Macmillan Publishers Limited. All rights reserved©2014

DHAQDS was also found to have faster reduction kinetics (k0 5 1.56(5)3 1022 cm s21), possibly due to intramolecular hydrogen bonding ofthe 2OH to the ketone (Extended Data Fig. 3b).
The organic approach liberates battery redox chemistry from the con-straints of the limited number of elemental redox couples of the peri-odic table. Although quinones have been used previously in batteriesusing redox-active solids13–15, their incorporation into all-liquid flowbatteries offers the following advantages over current flow-battery tech-nologies. First, scalability: AQDS contains only the Earth-abundant atomscarbon, sulphur, hydrogen and oxygen, and can be inexpensively manu-factured on large scales. Because some hydroxy-anthraquinones arenatural products, there is also the possibility that the electrolyte materialcan be renewably sourced. Second, kinetics: quinones undergo extre-mely rapid two-electron redox on simple, inexpensive carbon electro-des and do not require a costly precious-metal catalyst. Furthermore,this electrode permits higher charging voltages by suppressing the para-sitic water-splitting reactions. Third, stability: quinones should exhibitminimal membrane crossover owing to their relatively large size andcharge in aqueous solution as a sulphonate anion. Furthermore, althoughbromine crossover is a known issue in zinc-bromine, vanadium-brom-ine and hydrogen-bromine cells, AQDS is stable to prolonged heating inconcentrated Br2/HBr mixtures (Extended Data Figs 5 and 6), and theQBFB can be cycled in HBr electrolyte solutions (Extended Data Fig. 9).Fourth, solubility: AQDS has an aqueous solubility greater than 1 M atpH 0, and the quinone solution can thus be stored at relatively high energydensity—volumetric and gravimetric energy densities exceed 50 W h l21
and 50 W h kg21, respectively. Last, tunability: the reduction potentialand solubility of AQDS can be further optimized by introduction offunctional groups such as 2OH. Use of DHAQDS is expected to leadto an increase in cell potential, performance and energy density.
These features lower the capital cost of storage chemicals per kilowatthour, which sets a floor on the ultimate system cost per kilowatt hourat any scale. The precursor molecule anthracene is abundant in crudepetroleum and is already oxidized on large scale to anthraquinone. Sul-phonated anthraquinones are used on an industrial scale in wood pulpprocessing for paper16, and they can be readily synthesized from thecommodity chemicals anthraquinone and oleum8. In fact, a cyclic vol-tammogram of the crude sulphonation product of these two reagents isvirtually identical to that of pure AQDS (Extended Data Fig. 8). Basedon this simple electrolyte preparation that requires no further productseparation, we estimate chemical costs of $21 per kilowatt hour for AQDSand $6 per kilowatt hour for bromine17 (see Methods for informationon cost calculations). The QBFB offers major cost improvements overvanadium flow batteries with redox-active materials that cost $81 perkilowatt hour (ref. 18). Optimization of engineering and operating para-meters such as the flow field geometry, electrode design, membrane sepa-rator and temperature—which have not yet even begun—should leadto significant performance improvements in the future, as it has forvanadium flow batteries, which took many years to reach the powerdensities we report here6. The use of redox processes in p-aromaticorganic molecules represents a new and promising direction for cost-effective, large-scale energy storage.
METHODS SUMMARYThe QBFB comprised a mixture of commercially available and custom-madecomponents. Pretreated 2 cm2, stacked (36) Toray carbon paper electrodes (eachof which is about 7.5mm uncompressed) were used on both sides of the cell. Nafion212 (50mm thick) was used as a proton-exchange membrane, and PTFE gasketingwas used to seal the cell assembly. On the positive side of the cell, 120 ml of 3 MHBr and 0.5 M Br2 were used as the electrolyte solution in the fully discharged state;
–100 0 100 200 300 400
–300
–200
–100
0
100
200
50 100 150 200 250 300
Cu
rren
t d
en
sity (μA
cm
–2)
–1,400
–1,200
–1,000
–800
–600
–400
–200
0
Potential (mV vs SHE)
200 r.p.m.
3,600 r.p.m.
0.00 0.04 0.08 0.12 0.16 0.20 0.240
–10
–20
–30
–40
–50
–60
–300 –200 –100 0 100 200 300
0
1
2
3
4
5
6
AQDS
DHAQDS
Potential (mV vs SHE)Potential (mV vs SHE)
(Rotation rate)–1/2 (s1/2 rad–1/2)
Cu
rren
t d
en
sity (μA
cm
–2)
Nu
mb
er
of
−O
H g
rou
ps
i–1 (m
A–1)
a
η (mV) 13 18 23 28 33 38 363
b
c d
O
O
SO3HHO3S
OH OH
O
O
SO3HHO3S
AQDS
DHAQDS
500
Figure 3 | Half-cell measurements and theory calculations. a, Rotatingdisk electrode (RDE) measurements of AQDS using a glassy carbon electrode in1 M H2SO4 at 11 rotation rates ranging from 200 r.p.m. (red) to 3,600 r.p.m.(black). b, Koutecky–Levich plot (current21 versus rotation rate21/2) derivedfrom a at seven different AQDS reduction overpotentials, g. c, Calculated
reduction potentials of AQDS substituted with –OH groups (black), calculatedAQDS and DHAQDS values (blue), and experimental values for AQDS andDHAQDS (red squares). d, Cyclic voltammogram of AQDS and DHAQDS(1 mM) in 1 M H2SO4 on a glassy carbon electrode (scan rate 5 25 mV s21).
LETTER RESEARCH
9 J A N U A R Y 2 0 1 4 | V O L 5 0 5 | N A T U R E | 1 9 7
Macmillan Publishers Limited. All rights reserved©2014

on the negative side, 1 M 2,7-AQDS in 1 M H2SO4 was used. AQDS disodium saltwas flushed twice through a column containing Amberlyst 15H ion-exchange resinto remove the sodium ions. Half-cell measurements were conducted using a Ag/AgCl aqueous reference electrode (3 M KCl filling solution), a Pt wire counterelectrode and a 3-mm-diameter glassy carbon disk electrode. For theoretical calcu-lations, the total free energies of molecules were obtained from first-principlesquantum chemical calculations within density functional theory at the level ofthe generalized gradient approximation (GGA) using the PBE functional. Three-dimensional conformer structures for each quinone/hydroquinone molecule were gen-eratedusing the ChemAxon suite with up to 25 generated conformers per moleculeusing the Dreiding force field. Generated conformers were used as input structuresfor the density functional theory geometry optimization employed for determiningthe formation energy, which in turn is used to evaluate the reduction potential. Inthe QBFB cost calculation, a price of $4.74 per kilogram (eBioChem) was used foranthraquinone. To get the sulphonated form actually used here, anthraquinonemust be reacted with oleum (H2SO4/SO3), which adds a negligible cost at scale; thiscost is not included here. The price of bromine was $1.76 per kilogram, based onestimates from the US Geological Survey17. The cell voltage used to calculate costshere was 0.858 V.
Online Content Any additional Methods, Extended Data display items and SourceData are available in the online version of the paper; references unique to thesesections appear only in the online paper.
Received 26 June; accepted 25 November 2013.
1. Rugolo, J.&Aziz,M. J. Electricity storage for intermittent renewable sources.EnergyEnviron. Sci. 5, 7151–7160 (2012).
2. Yang, Z. et al. Electrochemical energy storage for green grid. Chem. Rev. 111,3577–3613 (2011).
3. Weber, A. Z. et al. Redox flow batteries: a review. J. Appl. Electrochem. 41,1137–1164 (2011).
4. Leung, P. et al. Progress in redox flow batteries, remaining challenges and theirapplications in energy storage. RSC Adv. 2, 10125–10156 (2012).
5. Nguyen, T. & Savinell, R. F. Flow batteries. Electrochem. Soc. Interface 19, 54–56(2010).
6. Skyllas-Kazacos, M., Chakrabarti, M. H., Hajimolana, S. A., Mjalli, F. S. & Saleem, M.Progress in flow battery research and development. J. Electrochem. Soc. 158,R55–R79 (2011).
7. Huskinson, B., Rugolo, J., Mondal, S. K. & Aziz, M. J. A high power density, highefficiency hydrogen–chlorine regenerative fuel cell with a low precious metalcontent catalyst. Energy Environ. Sci. 5, 8690–8698 (2012).
8. Crossley, M. L. The separation of mono-b, 2,6- and 2,7-sulfonic acids ofanthraquinone. J. Am. Chem. Soc. 37, 2178–2181 (1915).
9. Conant, J. B., Kahn, H. M., Fieser, L. F. & Kurtz, S. S. An electrochemical study of thereversiblereductionoforganiccompounds. J.Am.Chem.Soc.44,1382–1396(1922).
10. Kelsall, G. H. & Thompson, I. Redox chemistry of H2S oxidation by the British GasStretford process. Part III: Electrochemical behaviour of anthraquinone 2,7disulphonate in alkaline electrolytes. J. Appl. Electrochem. 23, 296–307 (1993).
11. Forster, R. J. & O’Kelly, J. P. Protonation reactions of anthraquinone-2,7-disulphonic acid in solution and within monolayers. J. Electroanal. Chem. 498,127–135 (2001).
12. Song, Y. & Buettner, G. R. Thermodynamic and kinetic considerations for thereaction of semiquinone radicals to form superoxide and hydrogen peroxide. FreeRadic. Biol. Med. 49, 919–962 (2010).
13. Xu, Y. et al. in World Non-Grid-Connected Wind Power and Energy Conference 1–4(IEEE, 2009).
14. Wang, W. et al. Anthraquinone with tailored structure for a nonaqueous metal-organic redox flow battery. Chem. Commun. 48, 6669–6671 (2012).
15. Yao, M. et al. High capacity organic positive-electrode material based on abenzoquinonederivative foruse in rechargeable lithiumbatteries. J.PowerSources195, 8336–8340 (2010).
16. Gordon, O. W., Plattner, E. & Doppenberg, F. Production of pulp by the soda-anthraquinone process (SAP) with recovery of the cooking chemicals. US patent5,595,628 (1997).
17. USGeological Survey2010Minerals Yearbook: Bromine (2010); available athttp://minerals.usgs.gov/minerals/pubs/commodity/bromine/myb1-2010-bromi.pdf.
18. US Geological Survey Vanadium Mineral Commodities Summary (2013); availableat http://minerals.usgs.gov/minerals/pubs/commodity/vanadium/mcs-2013-vanad.pdf.
Acknowledgements This work was partially funded through US Department ofEnergy ARPA-E Award DE-AR0000348 and partially funded through the HarvardSchool of Engineering and Applied Sciences. Theoretical work was funded in partthrough the Extreme Science and Engineering Discovery Environment (XSEDE),which is supported by National Science Foundation grant number OCI-1053575.B.H. was supported by an NSF Graduate Research Fellowship. S.E. performed workaspart of theFellowships for YoungEnergyScientists programmeof theFoundation forFundamental Research on Matter (FOM), which is part of the Netherlands Organizationfor Scientific Research (NWO). We thankT. Betley, L.Hartle, R. Burton andR.Duncan fordiscussions.
Author Contributions B.H. and M.P.M. contributed equally to this work.B.H. and M.P.M.designed and tested the battery, with direction from M.J.A. Both M.P.M. and M.R.G.conducted electrochemistry experiments, with direction from M.J.A. M.P.M. and C.J.G.synthesizedchemicalswithdirection fromR.G.G. Theoretical calculationsweredonebyC.S. and S.E., with input from M.P.M. and R.G.G. and direction from A.A.-G. X.C.contributed NMR results. B.H., M.P.M., C.S., M.R.G., S.E., A.A.G., R.G.G. and M.J.A. allcontributed to writing the manuscript.
Author Information Reprints and permissions information is available atwww.nature.com/reprints. The authors declare competing financial interests: detailsare available in the online version of the paper. Readers are welcome to comment onthe online version of the paper. Correspondence and requests for materials should beaddressed to M.J.A. ([email protected]).
RESEARCH LETTER
1 9 8 | N A T U R E | V O L 5 0 5 | 9 J A N U A R Y 2 0 1 4
Macmillan Publishers Limited. All rights reserved©2014
METHODSFull cell measurements. The QBFB comprised a mixture of commercially avail-able and custom-made components. Circular endplates were machined out of solidaluminium. Current collectors were 3 inch 3 3 inch pyrolytic graphite blocks withinterdigitated flow channels (channel width 5 0.0625 inch, channel depth 5 0.08 inch,landing between channels 5 0.031 inch, Fuel Cell Technologies). Pretreated 2 cm2,stacked (36) Toray carbon paper electrodes (each of which is about 7.5mm uncom-pressed) were used on both sides of the cell. Pretreatment consisted of a 10 minsonication in isopropyl alcohol followed by a five hour soak in a hot (50 uC) mixtureof undiluted sulphuric and nitric acids in a 3:1 volumetric ratio. Nafion 212 (50mmthick) was used as a proton-exchange membrane (PEM, Alfa Aesar), and PTFEgasketing was used to seal the cell assembly. Membrane pretreatment was doneaccording to previously published protocols7. Six bolts (3/8’’, 16 threads per inch)torqued to 10.2 N m completed the cell assembly, and PTFE tubing was used totransport reactants and products into and out of the cell. The cell was kept on a hotplate and wrapped in a proportional integral derivative (PID)-controlled heatingelement for temperature control. On the positive side of the cell, 120 ml of 3 M HBrand 0.5 M Br2 were used as the electrolyte solution in the fully discharged state; onthe negative side, 1 M AQDS in 1 M H2SO4 was used. HBr was used on the negativeside instead of H2SO4 for stability testing results displayed in Extended Data Fig. 9.State-of-charge calculations are based on the composition of the quinone side ofthe cell. 2,7-Anthraquinone disulphonate disodium salt 98% (TCI) was flushedtwice through a column containing Amberlyst 15H ion-exchange resin to removethe sodium ions. Measurements shown here were done at 40 uC. March centrifugalpumps were used to circulate the fluids at a rate of approximately 200 ml min21.For characterization, several instruments were used: a CH Instruments 1100C poten-tiostat (which can be used up to 62 A), a DC electronic load (Circuit Specialists)for galvanic discharge, a DC regulated power supply (Circuit Specialists) for elec-trolytic characterization, and a standard multimeter for independent voltage mea-surements. The cell was charged at 1.5 V until a fixed amount of charge ran throughthe cell. During this process, the electrolyte colours changed from orange to darkgreen (AQDS to AQDSH2) and from colourless to red (Br2 to Br2). Periodically,the open circuit potential was measured, providing the data inset in Fig. 1b. Also, atvarious SOCs, potential–current behaviour was characterized using the equipmentdescribed above: a fixed current was drawn from the cell, and the voltage, oncestabilized, was recorded (Fig. 1b). For the cycling data in Fig. 2b, the potentiostatwas used for constant-current (60.5 A cm22) measurements with cut-off voltagesof 0 V and 1.5 V. For the cycling data in Fig. 2a, a more dilute quinone solution(0.1 M as opposed to 1 M) was used. Here, the half-cycle lengths were programmedto run at constant current for a fixed amount of time, provided the voltage cut-offswere not reached, so that half of the capacity of the battery was used in each cycle.The voltage cut-offs were never reached during charging, but were reached duringdischarge. Current efficiencies are evaluated by dividing the discharge time by thecharge time of the previous half-cycle.
As shown in Fig. 2, current efficiency starts at about 92% and climbs to about95% over ,15 standard cycles. Note that these measurements are done near viableoperating current densities for a battery of this kind. Because of this, we believe thisnumber places an upper bound on the irreversible losses in the cell. In any case,95% is comparable to values seen for other battery systems. For example, ref. 19reports vanadium bromide batteries with current efficiencies of 50–90%, with largechanges in current efficiency observed for varying membrane conditions. Our systemwill probably be less dependent on membrane conditions because we are storingenergy in anions and neutral species as opposed to cations, which Nafion canconduct reasonably well.
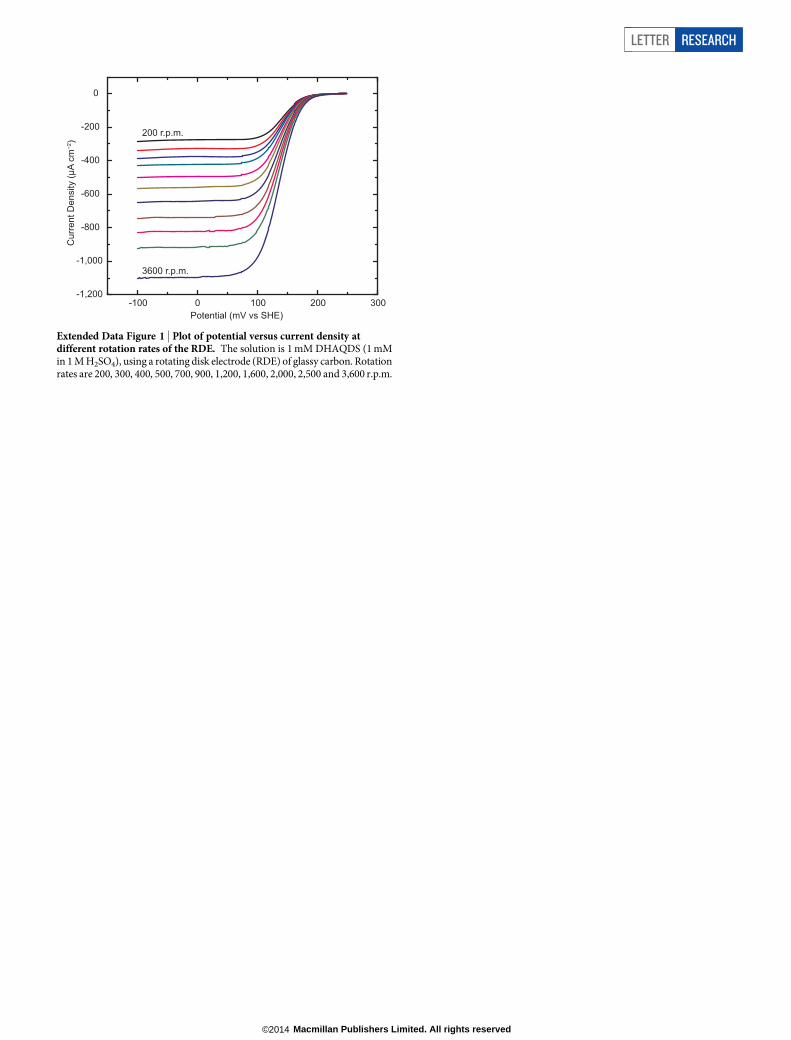
In Fig. 2b we illustrate the capacity retention of the battery (that is, the numberof coulombs available for discharge at the nth cycle divided by that available fordischarge at the (n 2 1)th cycle) to be 99.2% on average, which is quite high andprovides direct evidence that our irreversible losses are below 1%. If we attribute allof this loss (the 0.78% capacity fade per cycle) to some loss of redox-active quinone,it would be equivalent to losing 0.0006634 moles of quinone per cycle. If we attributeall of the loss to bromine crossover (which would react with the hydroquinone andoxidize it back to quinone), this corresponds to a crossover current density of1.785 mA cm22, which is within the range of the widely varying crossover valuesreported in the literature20. Note that these crossover numbers can be very sensitiveto membrane pretreatment conditions. It is also important to mention that, todetermine very accurate current efficiencies, detailed chemical analyses of theelectrolyte are necessary.Half-cell measurements. These were conducted using a BASi Epsilon EC poten-tiostat, a BASi Ag/AgCl aqueous reference electrode (RE-5B, 3 M KCl filling solu-tion) and a Pt wire counter electrode. Rotating disk electrode (RDE) measurementswere conducted using a BASi RDE (RDE-2) and a 3 mm diameter glassy carbondisk electrode. Electrode potentials were converted to the standard hydrogen elec-trode (SHE) scale using E(SHE) 5 E(Ag/AgCl) 1 0.210 V, where E(SHE) is the
potential versus SHE and E(Ag/AgCl) is the measured potential versus Ag/AgCl.2,7-Anthraquinone disulphonate disodium salt 98% was purchased from TCI andused as received. 1,8-Dihydroxy-anthraquinone-2,7-disulphonic acid was madeaccording to the literature procedure21. The electrolyte solution was sulphuric acid(ACS, Sigma) in deionized H2O (18.2 MV cm, Millipore). The Pourbaix diagram(plot of E0 versus pH) shown in Extended Data Fig. 4 was constructed using aqueous1 mM solutions of AQDS in pH buffers using the following chemicals: sulphuricacid (1 M, pH 0), HSO4
2/SO422 (0.1 M, pH 1–2), AcOH/AcO2 (0.1 M, pH 2.65–5),
H2PO42/HPO4
22 (0.1 M, pH 5.3–8), HPO422/PO4
32 (0.1 M, pH 9.28–11.52), andKOH (0.1 M, pH 13). The pH of each solution was adjusted with 1 M H2SO4 or0.1 M KOH solutions and measured with an Oakton pH 11 Series pH meter(Eutech Instruments).RDE studies. All RDE data represent an average of three runs. Error bars in ExtendedData Figs 2 and 3 indicate standard deviations. Before each run, the glassy carbondisk working electrode was polished to a mirror shine with 0.05mm alumina andrinsed with deionized water until a cyclic voltammogram of a solution of 1 mMAQDS in 1 M H2SO4 showed anodic and cathodic peak voltage separation of 34 to35 mV (39 mV for DHAQDS) at a sweep rate of 25 mV s21. The electrode was thenrotated at 200, 300, 400, 500, 700, 900, 1,200, 1,600, 2,000, 2,500 and 3,600 r.p.m.while the voltage was linearly swept from 310 to 60 mV (250 to 2100 for DHAQDS)at 10 mV s21 (Extended Data Fig. 1). The currents measured at 60 mV (2100 forDHAQDS) (that is, the diffusion-limited current density) versus the square root ofthe rotation rate (v) is plotted in Extended Data Fig. 2. The data were fitted with astraight line, with the slope defined by the Levich equation as 0.620nFACOD2/3n21/6,where n 5 2, Faraday’s constant F 5 96,485 C mol21, electrode area A 5 0.0707 cm2,AQDS concentration CO 5 1026 mol cm23, kinematic viscosity n 5 0.01 cm2 s21.This gives D values of 3.8(1) 3 1026 cm2 s21 for AQDS and 3.19(7) 3 1026 cm2 s21
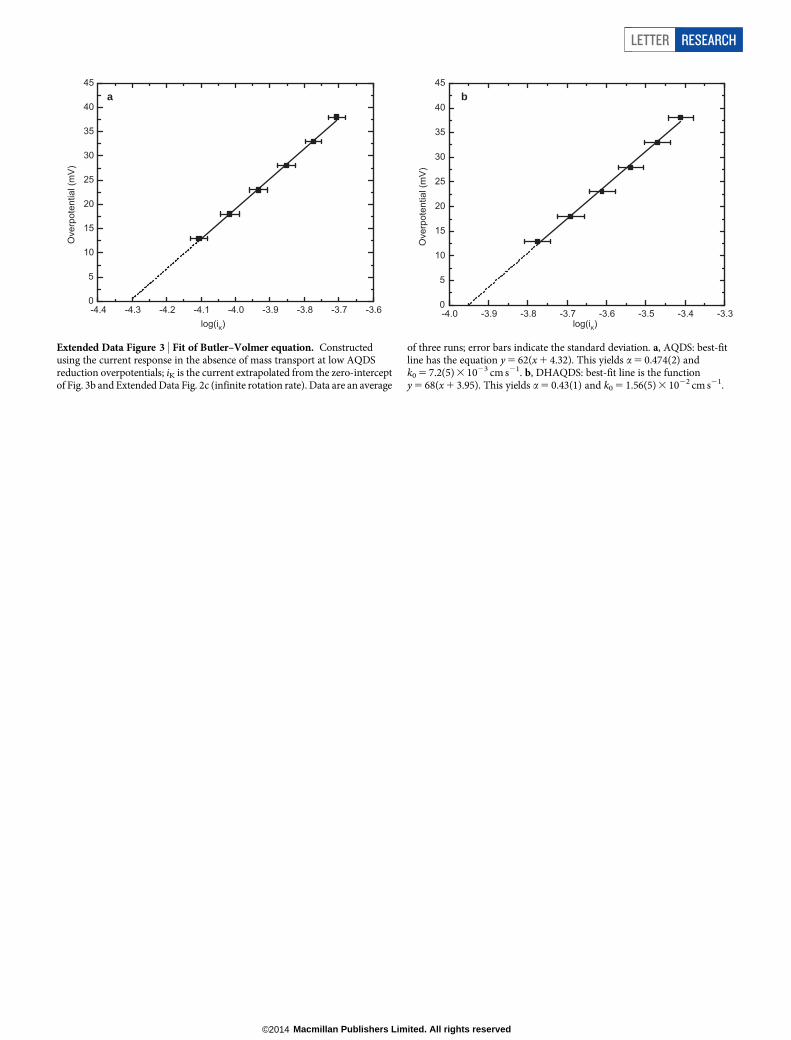
for DHAQDS. The reciprocal of the current at overpotentials of 13, 18, 23, 28, 33,38 and 363 mV was plotted versus the reciprocal of the square root of the rotationrate (Fig. 3b and Extended Data Fig. 2). The data for each potential were fitted witha straight line; the intercept gives the reciprocal of iK, the current in the absence ofmass transport limitations (the extrapolation to infinite rotation rate). A plot oflog10(iK) versus overpotential was linearly fitted with a slope of 62 mV (AQDS) and68 mV (DHAQDS) defined by the Butler–Volmer equation as 2.3aRT/nF (ExtendedData Fig. 3), where R is the universal gas constant, T is temperature in kelvin and ais the charge transfer coefficient. This gives a 5 0.474(2) for AQDS and 0.43(1) forDHAQDS. The x-intercept gives the log of the exchange current i0, which is equalto FACOk0, and gives k0 5 7.2(5)3 1023 cm s21 for AQDS and 1.56(5)3 1022 cm s21
for DHAQDS.Stability studies. AQDS (50 mg) was dissolved in 0.4 ml of D2O, and treated with100ml of Br2. The 1H and 13C NMR spectra (Extended Data Figs 5a, b and 6a, b)were unchanged from the starting material after standing for 20 h at 25 uC. AQDS(50 mg) was then treated with 1 ml of 2 M HBr and 100ml of Br2. The reaction washeated to 100 uC for 48 h and evaporated to dryness at that temperature. Theresulting solid was fully dissolved in D2O giving unchanged 1H and 13C NMR(Extended Data Figs 5c and 6c); however, the 1H NMR reference was shifted due toresidual acid. These results imply that bromine crossover will not lead to irrevers-ible destruction of AQDS.Sulphonation of anthraquinone and electrochemical study. 9,10-Anthraquinonewas treated with H2SO4 (20% SO3) at 170 uC for 2 h according to a literature pro-cedure8. The resulting red solution, containing roughly 37% AQDS, 60% 9,10-anthraquinone-2,6-disulphonic acid and 3% 9,10-anthraquinone-2-sulphonicacid, was diluted and filtered. A portion of this solution was further diluted with1 M H2SO4 to ,1 mM total anthraquinone concentration. The cyclic voltammo-gram (Extended Data Fig. 8) is similar to that of pure AQDS, though the anodic/cathodic peak current density is broadened due to the presence of the multiplesulphonic acid isomers.Theory and methods. We used a fast and robust theoretical approach to deter-mine the E0 of quinone/hydroquinone couples in aqueous solutions. We employedan empirical linear correlation of DHf, the heat of formation of hydroquinone at0 K from the quinone and hydrogen gas, to the measured E0 values22. Following thetreatment of ref. 22, the linear correlation is described as DG 5 2nFE0, where DGis the difference in total free energy between quinone and hydroquinone, n is thenumber of electrons involved in the reaction and F is the Faraday constant. Theentropy contributions to the total free energies of reaction have been neglectedbecause the entropies of reduction of quinones are found to be very similar22,23, andthe E0 of the oxidation–reduction system is linearly expressed as (2nF)21DHf 1 b,where b is a constant. It was also assumed that the reduction of quinones takesplace in a single-step reaction involving a two-electron two-proton process9,24. Thetotal free energies of molecules were obtained from first-principles quantumchemical calculations within density functional theory (DFT) at the level of thegeneralized gradient approximation (GGA) using the PBE functional25. The pro-jectoraugmentedwave(PAW)techniqueandaplane-wavebasisset26,27asimplemented
LETTER RESEARCH
Macmillan Publishers Limited. All rights reserved©2014

in VASP28,29 were employed. The kinetic energy cut-off for the plane-wave basiswas set at 500 eV, which was sufficient to converge the total energies on a scale of1 meV per atom. To obtain the ground-state structures of molecules in the gasphase, we considered multiple initial configurations for each molecule and opti-mized them in a cubic box of 25 A using C-point sampling. The geometries wereoptimized without any symmetry constraints using the conjugate gradient (CG)algorithm, and the convergence was assumed to be complete when the totalremaining forces on the atoms were less than 0.01 eV A21.
The search for conformational preference through theoretical calculations for eachhydroxylated quinone is crucial because of the significant effects of intramolecularhydrogen bonds on the total free energies of the molecules30. Three-dimensionalconformer structures for each quinone/hydroquinone molecule were generated usingthe ChemAxon suite (Marvin 6.1.0 by ChemAxon, http://www.chemaxon.com)with up to 25 conformers generated per molecule using the Dreiding force field31.The conformers generated were used as input structures for the DFT geometryoptimization employed for determining DHf, which in turn is used to estimate E0
and G0solv .
To calculate the E0 of the hydroxy-substituted AQDS molecules (Fig. 3c), thecorrelation betweenDHf and E0 was calibrated from experimental data on six well-characterized quinones32. Specifically, we used the experimental values of the aqueousE0 and computedDHf of 1,2-benzoquinone, 1,4-benzoquione, 1,2-naphthoquinone,1,4-naphthoquinone, 9,10-anthraquinone and 9,10-phenanthrene33. The trainingset ensures that the calibration plot addresses most classes and aspects of quinones,including two quinones each from 1-ring (benzoquinone), 2-ring (naphthoquinone)and 3-ring (anthraquinone and phenanthrene) structures. In addition, the experi-mental values of E0 of the training set spanned 0.09 V (9,10-anthraquinone) to0.83 V (1,2-benzoquinone), providing a wide range for E0 (Extended Data Fig. 7).The linear calibration plot for E0 yields an R2 5 0.97 between the calculated DHf
and E0 (Extended Data Fig. 7).The G0
solv values of the quinones in water were calculated using the Jaguar 8.0program in the Schrodinger suite 2012 (Jaguar, version 8.0, Schrodinger). Thestandard Poisson–Boltzmann solver was employed34,35. In this model, a layer ofcharges on the molecular surface represents the solvent. G0
solv was calculated as thedifference between the total energy of the solvated structure and the total energy ofthe molecule in vacuum. A more negative value for G0
solv corresponds to a quinonethat is likely to have a higher aqueous solubility. An absolute prediction of thesolubility is not readily available, as the accurate prediction of the most stable formsof molecular crystal structures with DFT remains an open problem36.Cost calculations. These were done using the following formula: C 5 (3.6 3 103) 3
(PM)/(nFE), where C is the cost in US dollars of the compound per kilowatt hour, Pis the cost in US dollars per kilogram, M is the molecular mass of the compound,F is Faraday’s constant (96,485 C mol21), n is the number of moles of electronstransferred per mole of storage compound (two for the QBFB) and E is the open-circuit voltage (V) of the storage device. In calculating the price for the anthraquinone-bromine battery, a price of $4.74 per kilogram (eBioChem) was used for anthraquinone
(note that, to get the sulphonated form actually used here, anthraquinone must bereacted with oleum (H2SO4/SO3), which adds a negligible cost at scale; this cost isnot included here). The price of bromine was $1.76 per kilogram, based on esti-mates from the US Geological Survey17. The cell voltage used to calculate costs herewas 0.858 V. For vanadium, costs were calculated from USGS prices from 201118 ofvanadium pentoxide at $14.37 per kilogram, and the cell voltage used was 1.2 V.Balance-of-system costs have not been estimated because the technology is tooimmature.
19. Skyllas-Kazacos, M., Milne, N. A. & Kazacos, G. C. Membrane properties andbehavior in the Generation 2 vanadium bromide redox flow batteries. MaterialsForum 32, 72–77 (2008).
20. Yeo, R. S. & McBreen, J. Transport properties of Nafion membranes inelectrochemically regenerative hydrogen/halogen cells. J. Electrochem. Soc. 126,1682–1687 (1979).
21. Haase, J., Baudys, J., Obruba, K. & Panek, J. Dihydroxyanthraquinone disulfonicacids. Czechoslovakian patent 148,977 (1973).
22. Dewar, M. J. S. & Trinajstic, N. Ground states of conjugated molecules-XIV: redoxpotentials of quinones. Tetrahedron 25, 4529–4534 (1969).
23. Pullman, B. & Pullman, A. Quantum Biochemistry 475 (Interscience, 1963).24. Guin, P. S., Das, S. & Mandal, P. C. Electrochemical reduction of quinones in
different media: a review. Int. J. Electrochem. 816202 (2011).25. Perdew, J. P., Burke, K. & Ernzerhof, M. Generalized gradient approximation made
simple. Phys. Rev. Lett. 77, 3865–3868 (1996).26. Blochl, P. E. Projector augmented-wave method. Phys. Rev. B 50, 17953–17979
(1994).27. Kresse, G. & Joubert, D. From ultrasoft pseudopotentials to the projector
augmented-wave method. Phys. Rev. B 59, 1758–1775 (1999).28. Kresse, G. & Hafner, J. Ab initio molecular dynamics for liquid metals. Phys. Rev. B
47, 558–561 (1993).29. Kresse, G. & Furthmuller, J. Efficient iterative schemes for ab initio total-energy
calculations using a plane-wave basis set. Phys. Rev. B 54, 11169–11186 (1996).30. Qu, R., Liu, H., Feng, M., Yang, X. & Wang, Z. Investigation on intramolecular
hydrogen bond and some thermodynamic properties of polyhydroxylatedanthraquinones. J. Chem. Eng. Data 57, 2442–2455 (2012).
31. Mayo, S. L., Olafson, B. D. & Goddard, W. A. III Dreiding: a generic force field formolecular simulations. J. Phys. Chem. 94, 8897–8909 (1990).
32. Wang, J. & Hou, T. Recent advances on aqueous solubility prediction. Comb. Chem.High Throughput Screen. 14, 328–338 (2011).
33. Johnsson Wass, J. R. T., Ahlberg, E., Panas, I. & Schiffrin, D. J. Quantumchemicalmodeling of the reduction ofquinones. J. Phys. Chem. A 110,2005–2020(2006).
34. Tannor, D. J. et al. Accurate first principles calculation of molecular chargedistributions and solvation energies from ab initio quantum mechanics andcontinuum dielectric theory. J. Am. Chem. Soc. 116, 11875–11882 (1994).
35. Marten, B. et al. New model for calculation of solvation free energies: correction ofself-consistent reaction field continuum dielectric theory for short-rangehydrogen-bonding effects. J. Phys. Chem. 100, 11775–11788 (1996).
36. Hongo,K.,Watson, M.A., Sanchez-Carrera,R. S., Iitaka, T.&Aspuru-Guzik, A. Failureof conventional density functionals for the prediction of molecular crystalpolymorphism: a quantum Monte Carlo study. J. Phys. Chem. Lett. 1, 1789–1794(2010).
RESEARCH LETTER
Macmillan Publishers Limited. All rights reserved©2014
-100 0 100 200 300-1,200
-1,000
-800
-600
-400
-200
0
Cur
rent
Den
sity
(μA
cm−2
)
Potential (mV vs SHE)
3600 r.p.m.
200 r.p.m.
Extended Data Figure 1 | Plot of potential versus current density atdifferent rotation rates of the RDE. The solution is 1 mM DHAQDS (1 mMin 1 M H2SO4), using a rotating disk electrode (RDE) of glassy carbon. Rotationrates are 200, 300, 400, 500, 700, 900, 1,200, 1,600, 2,000, 2,500 and 3,600 r.p.m.
LETTER RESEARCH
Macmillan Publishers Limited. All rights reserved©2014

0 2 4 6 8 10 12 14 16 18 200
-10
-20
-30
-40
-50
-60
-70
-80
-90
-100
Lim
iting
Cur
rent
(μA
)
ω1/2 (Rad/s)1/20 2 4 6 8 10 12 14 16 18 20
0
-10
-20
-30
-40
-50
-60
-70
-80
Li
miti
ng C
urre
nt (μ
A)
ω1/2 (Rad/s)1/2
0.00 0.02 0.04 0.06 0.08 0.10 0.12 0.14 0.16 0.18 0.20 0.22 0.240
-10
-20
-30
-40
-50
-60
-70
η / mV131823283338236
i−1 (m
A−1
)
ω−1/2 (Rad/s)−1/2
a b
c
Extended Data Figure 2 | Levich and Koutecky–Levich plots obtainedusing the RDE. a, Levich plot (limiting current versus square root ofrotation rate v) of 1 mM AQDS in 1 M H2SO4 (the fitted line has a slope of4.53(2)mA s1/2 rad21/2, giving D 5 3.8(1) 3 1026 cm2 s21). Data are an averageof three runs; error bars indicate the standard deviation. b, As a but for
DHAQDS in 1 M H2SO4 (slope of 3.94(6)mA s1/2 rad21/2
gives D 5 3.19(7)3 1026 cm2 s21). c, Koutecky–Levich plot (i21 versus v21/2)of 1 mM DHAQDS in 1 M H2SO4. The current response, i, is shown forseven different AQDS reduction overpotentials g.
RESEARCH LETTER
Macmillan Publishers Limited. All rights reserved©2014
-4.0 -3.9 -3.8 -3.7 -3.6 -3.5 -3.4 -3.30
5
10
15
20
25
30
35
40
45
Ove
rpot
entia
l (m
V)
log(iK)-4.4 -4.3 -4.2 -4.1 -4.0 -3.9 -3.8 -3.7 -3.60
5
10
15
20
25
30
35
40
45
Ove
rpot
entia
l (m
V)
log(iK)
a b
Extended Data Figure 3 | Fit of Butler–Volmer equation. Constructedusing the current response in the absence of mass transport at low AQDSreduction overpotentials; iK is the current extrapolated from the zero-interceptof Fig. 3b and Extended Data Fig. 2c (infinite rotation rate). Data are an average
of three runs; error bars indicate the standard deviation. a, AQDS: best-fitline has the equation y 5 62(x 1 4.32). This yields a 5 0.474(2) andk0 5 7.2(5) 3 1023 cm s21. b, DHAQDS: best-fit line is the functiony 5 68(x 1 3.95). This yields a 5 0.43(1) and k0 5 1.56(5) 3 1022 cm s21.
LETTER RESEARCH
Macmillan Publishers Limited. All rights reserved©2014

0 2 4 6 8 10 12 14
-300
-200
-100
0
100
200
300E
0 (m
V v
s S
HE
)
pH
Extended Data Figure 4 | Pourbaix diagram (E0 vs pH) of AQDS. Data arefitted to three solid lines indicating slopes of 259 mV pH21, 230 mV pH21
and 0 mV pH21, corresponding to two-, one- and zero-proton processes,respectively. Dashed lines linearly extrapolate the one- and zero-protonprocesses to give E0 values of 18 mV (2e2/1H1) and 2296 mV (2e2/0H1).
RESEARCH LETTER
Macmillan Publishers Limited. All rights reserved©2014
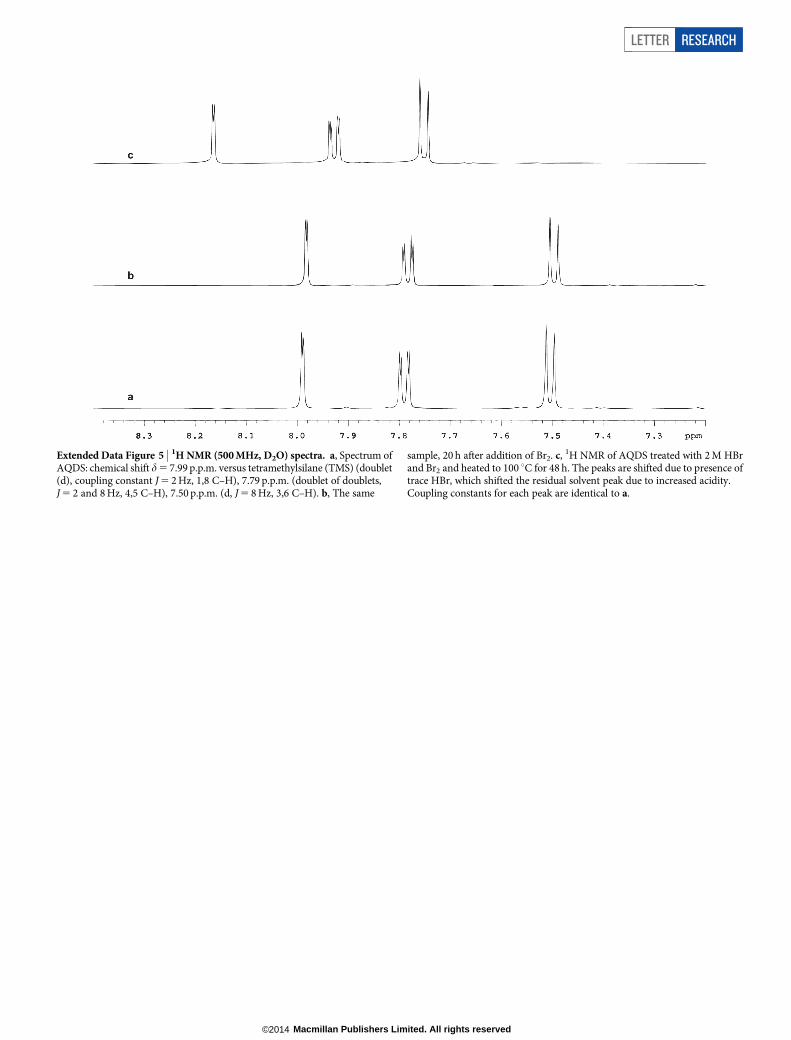
Extended Data Figure 5 | 1H NMR (500 MHz, D2O) spectra. a, Spectrum ofAQDS: chemical shift d 5 7.99 p.p.m. versus tetramethylsilane (TMS) (doublet(d), coupling constant J 5 2 Hz, 1,8 C–H), 7.79 p.p.m. (doublet of doublets,J 5 2 and 8 Hz, 4,5 C–H), 7.50 p.p.m. (d, J 5 8 Hz, 3,6 C–H). b, The same
sample, 20 h after addition of Br2. c, 1H NMR of AQDS treated with 2 M HBrand Br2 and heated to 100 uC for 48 h. The peaks are shifted due to presence oftrace HBr, which shifted the residual solvent peak due to increased acidity.Coupling constants for each peak are identical to a.
LETTER RESEARCH
Macmillan Publishers Limited. All rights reserved©2014
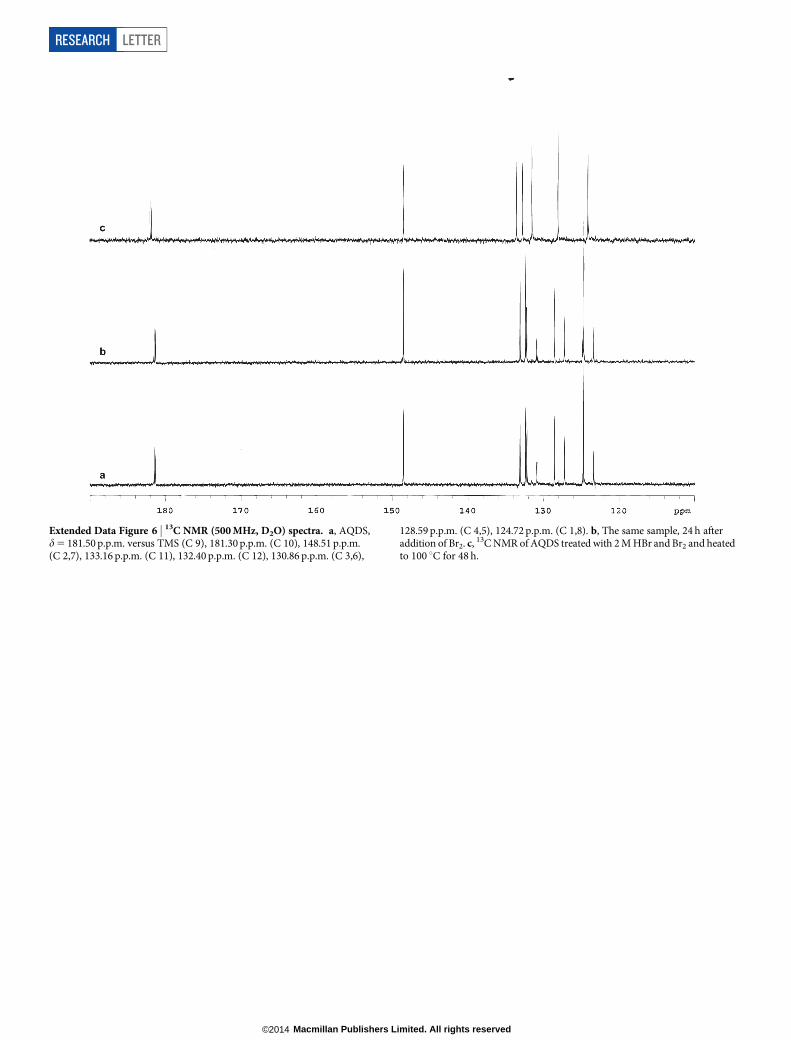
Extended Data Figure 6 | 13C NMR (500 MHz, D2O) spectra. a, AQDS,d 5 181.50 p.p.m. versus TMS (C 9), 181.30 p.p.m. (C 10), 148.51 p.p.m.(C 2,7), 133.16 p.p.m. (C 11), 132.40 p.p.m. (C 12), 130.86 p.p.m. (C 3,6),
128.59 p.p.m. (C 4,5), 124.72 p.p.m. (C 1,8). b, The same sample, 24 h afteraddition of Br2. c, 13C NMR of AQDS treated with 2 M HBr and Br2 and heatedto 100 uC for 48 h.
RESEARCH LETTER
Macmillan Publishers Limited. All rights reserved©2014

-2.5 -2.0 -1.5 -1.0 -0.50.0
0.1
0.2
0.3
0.4
0.5
0.6
0.7
0.8
0.9 E
0 fro
m L
itera
ture
(V)
ΔHf (eV)
1,2-BQ
1,4-BQ
1,2-NQ
9,10-PQ
1,4-NQ
9,10-AQ
R2 = 0.97
Extended Data Figure 7 | Calibration model for DHf and experimental E0.This shows a linear relationship (red dashed line; R2 5 0.97) between calculatedDHf (this work) and experimental E0 (from the literature) of six quinonesin aqueous solutions: BQ, benzoquinone; NQ, naphthoquinone; AQ,anthraquinone; and PQ, phenanthraquinone.
LETTER RESEARCH
Macmillan Publishers Limited. All rights reserved©2014
-100 0 100 200 300 400 500-300
-200
-100
0
100
200
Cur
rent
Den
sity
(μA
cm−2
)
Potential (mV vs. SHE)
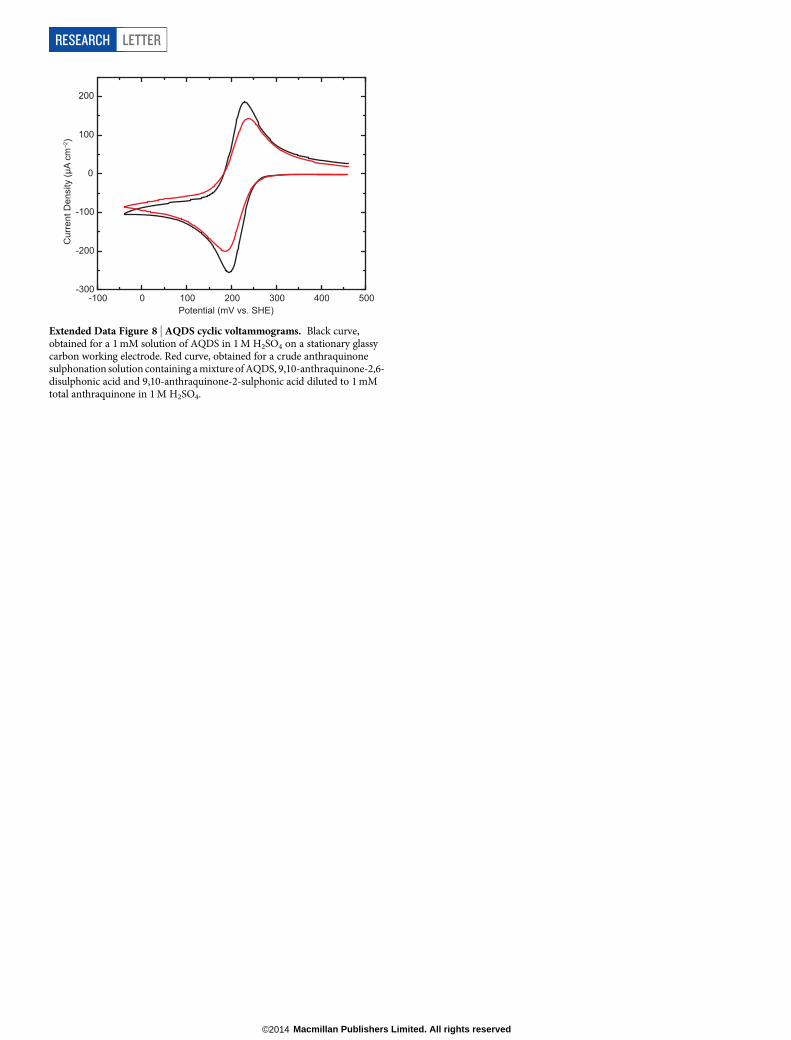
Extended Data Figure 8 | AQDS cyclic voltammograms. Black curve,obtained for a 1 mM solution of AQDS in 1 M H2SO4 on a stationary glassycarbon working electrode. Red curve, obtained for a crude anthraquinonesulphonation solution containing a mixture of AQDS, 9,10-anthraquinone-2,6-disulphonic acid and 9,10-anthraquinone-2-sulphonic acid diluted to 1 mMtotal anthraquinone in 1 M H2SO4.
RESEARCH LETTER
Macmillan Publishers Limited. All rights reserved©2014
0.0 0.5 1.0 1.5 2.0 2.5 3.0 3.5 4.0 4.5 5.0 5.50.0
0.3
0.6
0.9
1.2
1.5C
ell P
oten
tial (
V)
Time (hrs)
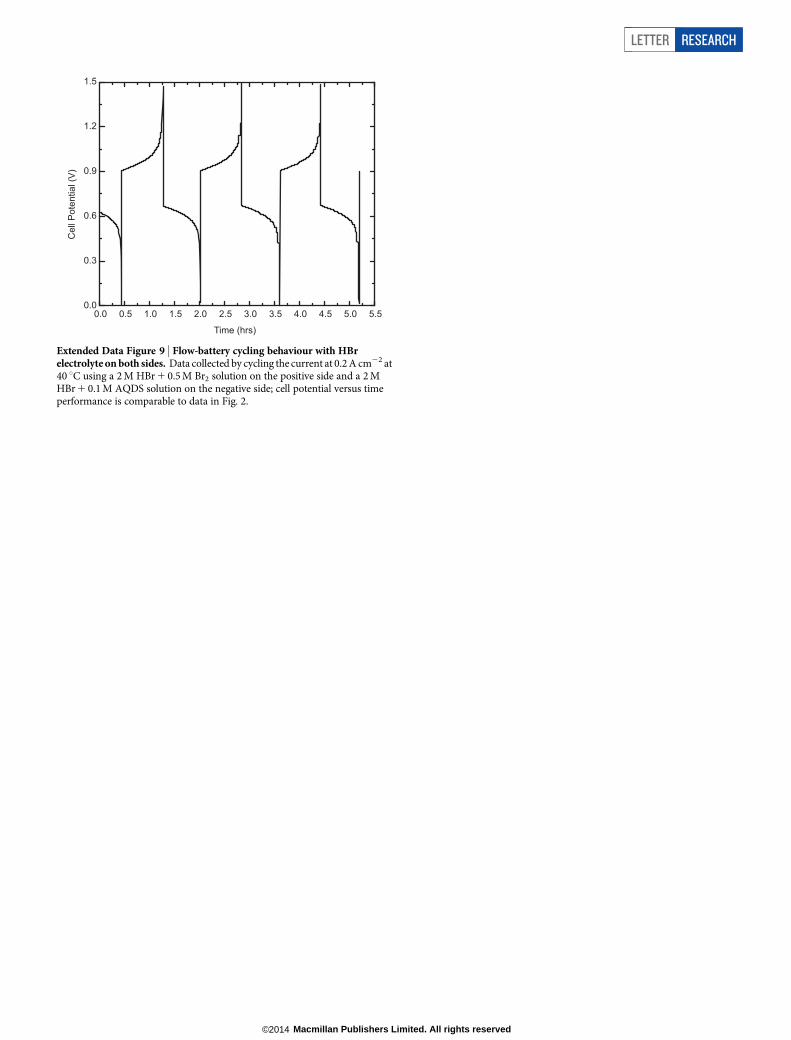
Extended Data Figure 9 | Flow-battery cycling behaviour with HBrelectrolyte on both sides. Data collected by cycling the current at 0.2 A cm22 at40 uC using a 2 M HBr 1 0.5 M Br2 solution on the positive side and a 2 MHBr 1 0.1 M AQDS solution on the negative side; cell potential versus timeperformance is comparable to data in Fig. 2.
LETTER RESEARCH
Macmillan Publishers Limited. All rights reserved©2014
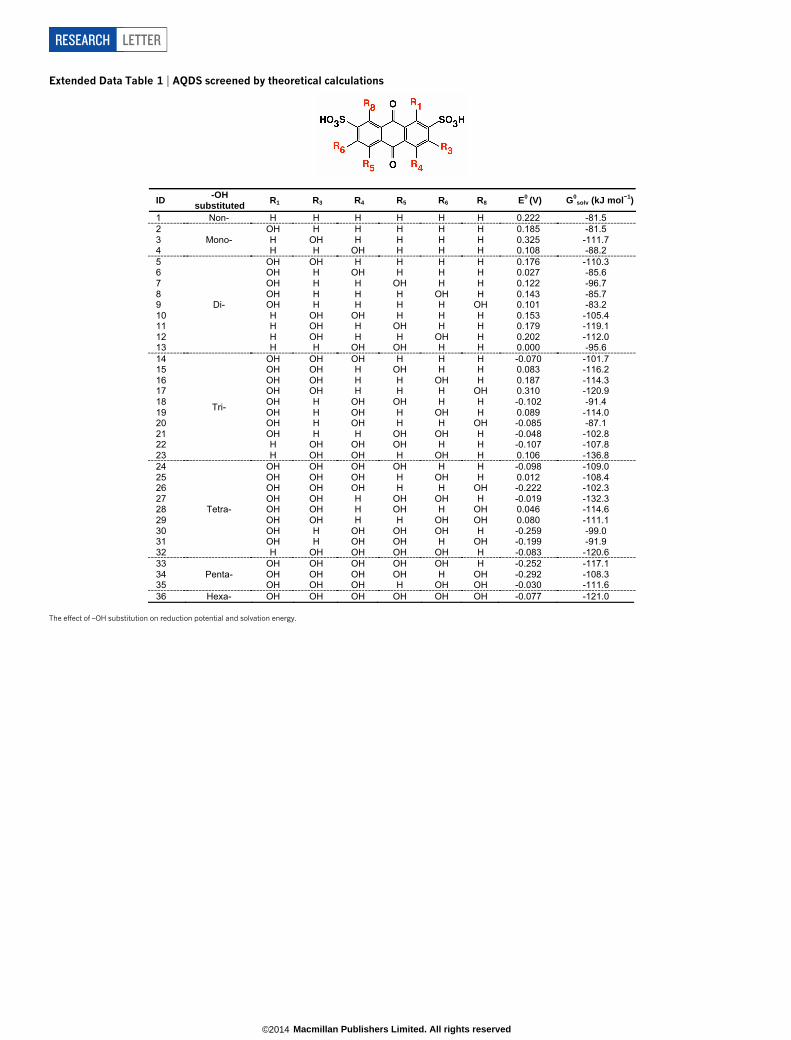
Extended Data Table 1 | AQDS screened by theoretical calculations
ID -OH substituted R1 R3 R4 R5 R6 R8 E0 (V) G0
solv (kJ mol 1)
1 Non- H H H H H H 0.222 -81.5 2
Mono- OH H H H H H 0.185 -81.5
3 H OH H H H H 0.325 -111.7 4 H H OH H H H 0.108 -88.2 5
Di-
OH OH H H H H 0.176 -110.3 6 OH H OH H H H 0.027 -85.6 7 OH H H OH H H 0.122 -96.7 8 OH H H H OH H 0.143 -85.7 9 OH H H H H OH 0.101 -83.2 10 H OH OH H H H 0.153 -105.4 11 H OH H OH H H 0.179 -119.1 12 H OH H H OH H 0.202 -112.0 13 H H OH OH H H 0.000 -95.6 14
Tri-
OH OH OH H H H -0.070 -101.7 15 OH OH H OH H H 0.083 -116.2 16 OH OH H H OH H 0.187 -114.3 17 OH OH H H H OH 0.310 -120.9 18 OH H OH OH H H -0.102 -91.4 19 OH H OH H OH H 0.089 -114.0 20 OH H OH H H OH -0.085 -87.1 21 OH H H OH OH H -0.048 -102.8 22 H OH OH OH H H -0.107 -107.8 23 H OH OH H OH H 0.106 -136.8 24
Tetra-
OH OH OH OH H H -0.098 -109.0 25 OH OH OH H OH H 0.012 -108.4 26 OH OH OH H H OH -0.222 -102.3 27 OH OH H OH OH H -0.019 -132.3 28 OH OH H OH H OH 0.046 -114.6 29 OH OH H H OH OH 0.080 -111.1 30 OH H OH OH OH H -0.259 -99.0 31 OH H OH OH H OH -0.199 -91.9 32 H OH OH OH OH H -0.083 -120.6 33
Penta- OH OH OH OH OH H -0.252 -117.1
34 OH OH OH OH H OH -0.292 -108.3 35 OH OH OH H OH OH -0.030 -111.6 36 Hexa- OH OH OH OH OH OH -0.077 -121.0
The effect of –OH substitution on reduction potential and solvation energy.
RESEARCH LETTER
Macmillan Publishers Limited. All rights reserved©2014