a meta-analytic review of selected adverse drug events ... · a meta-analytic review of selected...
TRANSCRIPT

A Meta-Analytic Review of Selected Adverse Drug Events (ADEs) of Long-Term
Prescription Opioids for Chronic Non-Cancer Pain (CNCP)
By
Matthew J Pelcowitz
A thesis submitted in conformity with the requirements
for the degree of Master of Science
Institute of Medical Science
University of Toronto
© Copyright by Matthew J Pelcowitz 2016

ii
A Meta-Analytic Review of Selected Adverse Drug Events (ADEs) of Long-Term
Prescription Opioids for Chronic Non-Cancer Pain (CNCP)
Matthew J Pelcowitz
Master of Science
Institute of Medical Science
University of Toronto
2016
Abstract
Background: Opioids are considered one of the most effective analgesics. However,
knowledge on opioid adverse drug events (ADEs) is limited and the current state of the literature
has remained elusive. Purpose: This meta-analytic review focused on five selected adverse drug
events (SADEs) (misuse, abuse, addiction, overdose, and death) of prescription opioids to
surmise the overall state of this literature and evaluate quality of reporting and risk of bias.
Methods: Studies were acquired from research databases, including: MEDLINE, EMBASE,
CINAHL, PsycINFO, CENTRAL, and Business Source Premier. Results: Ninety studies
satisfied inclusion and exclusion criteria and were included. Quality of reporting of SADEs,
determined via McHarm, risk of bias, assessed using a Cochrane guideline, and overall event
rates of SADEs are reported. Conclusion: Results revealed that quality of reporting was poor
and risk of bias was high. Findings suggest that quality of reporting of SADEs and risk of bias
must be improved.
iii
Acknowledgements
I am grateful to Professor Andrea Furlan for her guidance and support, both of which
have been integral to my progress in this thesis and my academic development. I would also like
to acknowledge the feedback and suggestions provided by the members of my Progress Advisory
Committee: Professor Claire Bombardier and Professor Carlo Ammendolia, both of which
helped refine the scope and goals of my thesis.
I would like to express my sincere gratitude to my parents, Audrey and David, for their
continued love and support; they inspire me to constantly try to better myself and be tenacious. I
also wish to thank my siblings, Sam and Ilana, my grandparents, Sheila and Harry Nozetz, and
Gertie Pelcowitz. I am grateful to have shared good times with my siblings and grandparents and
I have learned a lot from them.
I would like to thank Cynthia Chen for her statistical guidance and assistance with the
meta-analytic parts of my thesis. I would also like to thank Quenby Mahood, a librarian at the
Institute for Work & Health who greatly contributed to the literature search conducted for my
thesis.
Lastly, I would like to thank Jonathan Shilo Lipszyc; more affectionately known as “Big
J”. His life-long mentorship, guidance and wisdom has been instrumental in my growth as a
person and academic progression, in particular for this Master of Science.

iv
Summary of Contributions
Claire Bombardier and Carlo Ammendolia helped refine the scope and goals of the thesis
and offered continued feedback to enhance the manuscript. Quenby Mahood executed the initial
literature search that captured studies up until August 2012. Similarly, Quenby Mahood provided
assistance with the retrieval of studies when necessary (i.e. could not be retrieved from an
electronic database). Andrea Furlan et al. constructed the risk of bias guideline used to assess the
five types of bias (performance bias, selection bias, measurement bias, attrition bias, and
confounding bias). Jaemin Kim provided assistance when necessary for the risk of bias
assessment. Cynthia Chen provided statistical assistance for the meta-analysis and subsequent
meta-regressions.

v
Table of Contents
Contents
Abstract ........................................................................................................................................... ii
Acknowledgements ........................................................................................................................ iii
Summary of Contributions ............................................................................................................. iv
Table of Contents ............................................................................................................................ v
List of Tables ............................................................................................................................... viii
List of Figures ................................................................................................................................ ix
List of Acronyms ............................................................................................................................ x
1 Literature Review....................................................................................................................... 1
1.1 Overview ........................................................................................................................... 1
1.2 Prescription medication: efficacy, effectiveness and safety .............................................. 1
1.3 Beneficial reporting bias .................................................................................................... 4
1.3.1 Research on beneficial reporting bias ......................................................................... 5
1.4 Beneficial reporting bias in systematic reviews and meta-analyses .................................. 8
1.5 Impact of poor quality of reporting and high risk of bias .................................................. 9
1.6 PRISMA – standardized guideline for systematic reviews and meta-analyses ............... 11
1.7 Brief background of opioids and the ADE of prescription opioids ................................. 13
1.8 Literature on ADEs of prescription opioids .................................................................... 15
1.9 Explanation and aim of meta-analytic review ................................................................. 16
1.9.1 Explanation of McHarm ........................................................................................... 17
1.9.2 Explanation of risk of bias instrument ...................................................................... 20
1.9.3 Research questions, hypotheses, and objectives ....................................................... 23
2 Methods.................................................................................................................................... 27
2.1 Types of studies ............................................................................................................... 27
2.2 Participants ...................................................................................................................... 27
2.3 Interventions .................................................................................................................... 29
2.4 Outcomes ......................................................................................................................... 29
2.5 Electronic searches .......................................................................................................... 31
2.6 Manual searches .............................................................................................................. 31

vi
2.7 Selection of studies .......................................................................................................... 32
2.8 Data extraction ................................................................................................................. 32
2.9 Quality of reporting of SADEs ........................................................................................ 39
2.10 Risk of bias .................................................................................................................... 40
2.11 Event rates ..................................................................................................................... 42
2.12 Synthesis of results ........................................................................................................ 43
2.12.1 Additional analyses ................................................................................................. 46
3 Results ...................................................................................................................................... 49
3.1 Study Characteristics ....................................................................................................... 51
3.2 McHarm ........................................................................................................................... 54
3.3 Risk of bias ...................................................................................................................... 55
3.4 Meta-analyses and meta-regressions: All studies ............................................................ 56
3.5 Length of participant opioid exposure ............................................................................. 58
3.6 Distribution of studies ..................................................................................................... 60
3.7 Misuse .............................................................................................................................. 62
3.7.1 Participant opioid exposure of 3- to 11- months ....................................................... 62
3.7.2 Participant opioid exposure of 12- months or longer ................................................ 64
3.8 Abuse ............................................................................................................................... 66
3.8.1 Participant opioid exposure of 3- to 11- months ....................................................... 66
3.8.2 Participant opioid exposure of 12- months or longer ................................................ 67
3.9 Addiction ......................................................................................................................... 69
3.9.1 Participant opioid exposure of 3- to 11- months ....................................................... 69
3.9.2 Participant opioid exposure of 12- months or longer ................................................ 71
3.10 Overdose ........................................................................................................................ 72
3.11 Death .............................................................................................................................. 74
3.12 Cohen’s Kappa Coefficient ........................................................................................... 75
3.13 Intraclass correlation coefficient ................................................................................... 76
4 Discussion ................................................................................................................................ 77
5 Conclusion ............................................................................................................................... 92
6 Future Directions ..................................................................................................................... 93
References ..................................................................................................................................... 96

vii
Appendix A - Risk of Bias Table ................................................................................................ 113
Appendix B – Risk of Bias Flow Chart ...................................................................................... 116
Appendix C – Search Terms and Strategy .................................................................................. 117
viii
List of Tables
Table 1. Examples of common ADRs and ADEs of opioids .......................................................... 2
Table 2. Length of participant opioid exposure: R² and p-value for each SADE outcome ......... 59
Table 3. Misuse 3- to 11- months: R² and p-value for each moderator variable .......................... 63
Table 4. Misuse 12- months or longer: R² and p-value for each moderator variable ................... 64
Table 5. Abuse 3- to 11- months: R² and p-value for each moderator variable ............................ 66
Table 6. Abuse 12- months or longer: R² and p-value for each moderator variable .................... 68
Table 7. Addiction 3- to 11- months: R² and p-value for each moderator variable ...................... 70
Table 8. Addiction 12- months or longer: R² and p-value for each moderator variable ............... 71
Table 9. Overdose: R² and p-value for each moderator variable .................................................. 72
Table 10. Death: R² and p-value for each moderator variable ...................................................... 74

ix
List of Figures
Figure 1. PRISMA checklist ......................................................................................................... 12
Figure 2. Flowchart of included studies ........................................................................................ 50
Figure 3. Number of Studies Published by Year .......................................................................... 51
Figure 4. Number of Studies by Country ...................................................................................... 52
Figure 5. Distribution of McHarm scores across all 90 included studies ..................................... 55
Figure 6. Weighted event rate by attrition bias ............................................................................. 57
Figure 7. Weighted event rate by measurement bias .................................................................... 57
Figure 8. Weighted event rate by selection bias ........................................................................... 57
Figure 9. Weighted event rate by performance bias ..................................................................... 58
Figure 10. Weighted event rate by confounding bias ................................................................... 58
Figure 11. Weighted event rate by adverse drug event outcomes ................................................ 61

x
List of Acronyms
ADEs Adverse Drug Events
SADEs Selected Adverse Drug Events
ADRs Adverse Drug Reactions
CNCP Chronic Non-Cancer Pain
RCTs Randomized Controlled Trials
COs Controlled Observational Studies
NCOs Non-Controlled Observational Studies
ROB Risk of Bias
PRISMA Preferred Reporting Items for Systematic Reviews
CMA Comprehensive Meta-Analyses Software
I² Study heterogeneity
R² Coefficient of determination

1
1 Literature Review
1.1 Overview
The current meta-analytic review commences with a review of the literature on adverse
drug events (ADEs) and prescription opioids. The Literature review discusses the overall
quality of the ADE literature in general, and then subsequently frames this discussion of ADE
literature in the context of prescription opioids. Subsequently, the Methods section follows,
which was structured using Preferred Reporting Items for Systematic Reviews and Meta-
Analyses (PRISMA). Next, results are explicated in the Results section, which includes both the
meta-analyses and meta-regressions that were performed. Findings are further considered and
examined in the Discussion section, followed by closing thoughts in the Conclusion section and
then future considerations in the Future Directions section.
1.2 Prescription medication: efficacy, effectiveness and safety
Prescription medication is an integral part of healthcare and medicine and is a convenient
treatment modality that help alleviate patient symptoms. In a 2007-2008 National Health and
Nutrition Examination Survey, in the United States, 48% of the population had taken at least one
prescription medication. Similarly, in Canada, results from the 2007 to 2011 Canadian Health
Measures Survey revealed that 41% of 6- to 79- year olds had taken at least one prescription
medication. However, the widespread use of prescription medications has resulted in increased
health care costs, and prescription medications account for the second most costly component of
healthcare in Canada, with an annual expenditure of $29 billion (14% of the healthcare budget)1.
A substantial portion of this annual expenditure stemming from prescription medication has been
attributed to complications regarding patient safety, and a difficulty in understanding and
addressing these complications. Clinicians face challenges in distinguishing what characteristics

2
are associated with greater risks to safety among patients, and efforts have been primarily
reactive rather than preventive. Unfortunately, this reflects a systematic problem among the
studies that investigate patient safety of prescription medications2.
Prior to employing a drug into medical practice, its efficacy (the extent to which a drug
has the ability to bring about beneficial change in the practice of medicine under predetermined
circumstances), effectiveness (the extent to which a drug achieves its intended result in the
traditional clinical setting), and safety must be assessed. The safety of a drug is a term that is
often used in the literature to encompass both adverse drug reactions (ADRs) and adverse drug
events (ADEs). ADRs are defined as: a patient injury resulting from a medication, either because
of a pharmacological reaction to a normal dose, or because of a preventable adverse reaction to a
drug resulting from an error (i.e. nausea)3. ADEs are defined as: unintended, undesirable, or
unexpected effects of prescribed medications or of medication errors that require discontinuing a
medication or modifying the dose; require initial or prolonged hospitalization; result in disability;
require treatment with a prescription medication; result in cognitive deterioration or impairment;
are life-threatening; result in death; or result in congenital anomalies3. ADEs are least examined
in the literature (less than efficacy, effectiveness, and ADRs)4 and will be the focus of this
review.
A table below is provided for review with common ADRs and ADEs of prescription
opioids. Both the listed ADRs and ADEs were informed from extant literature using the
definitions provided above.
Table 1. Examples of common ADRs and ADEs of opioids
Adverse Drug Reactions (ADRs) of opioids Adverse Drug Events (ADEs) of opioids

3
Nausea Misuse
Vomiting Abuse
Constipation Addiction
Drowsiness Overdose
Fatigue Death
Insomnia Dependence
Dizziness Aberrant Behaviour(s)
Diarrhea Selling medication(s)
Pain Hording medication(s)
Allergic reaction Double doctoring
Inflammation Alternative route of administration (i.e.
snorting medication)
Scarring Medically/self- induced coma
Randomized controlled trials (RCTs) are generally considered the gold standard for
scientific research and clinical trials and are thus regularly used to assess the efficacy,
effectiveness, and safety of medical interventions5. Stolberg, Norman and Trop (2004) purport
that the strength of RCTs derive from the four hallmarks of the study methodology that
collectively elucidate the efficacy and effectiveness of medical interventions. These hallmarks
include: random assignment of patients to treatment conditions, a control, or comparison group,
blinding the patients, care providers, and evaluators about which treatment each participant is
receiving, and low participant attrition rates. These characteristics of RCTs are predominantly
focused on the examination of the efficacy or effectiveness of a medical intervention and
overlook potential ADEs that threaten patient safety6. Indeed, Hammad, Pinheiro, and
4
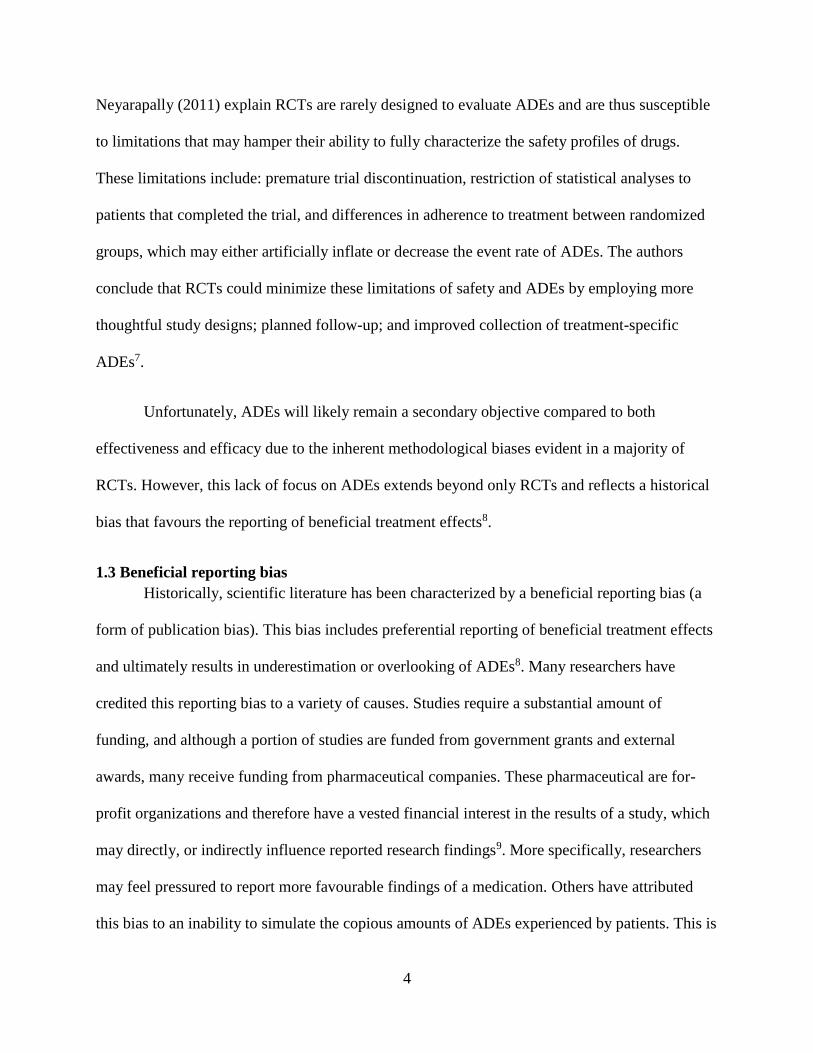
Neyarapally (2011) explain RCTs are rarely designed to evaluate ADEs and are thus susceptible
to limitations that may hamper their ability to fully characterize the safety profiles of drugs.
These limitations include: premature trial discontinuation, restriction of statistical analyses to
patients that completed the trial, and differences in adherence to treatment between randomized
groups, which may either artificially inflate or decrease the event rate of ADEs. The authors
conclude that RCTs could minimize these limitations of safety and ADEs by employing more
thoughtful study designs; planned follow-up; and improved collection of treatment-specific
ADEs7.
Unfortunately, ADEs will likely remain a secondary objective compared to both
effectiveness and efficacy due to the inherent methodological biases evident in a majority of
RCTs. However, this lack of focus on ADEs extends beyond only RCTs and reflects a historical
bias that favours the reporting of beneficial treatment effects8.
1.3 Beneficial reporting bias
Historically, scientific literature has been characterized by a beneficial reporting bias (a
form of publication bias). This bias includes preferential reporting of beneficial treatment effects
and ultimately results in underestimation or overlooking of ADEs8. Many researchers have
credited this reporting bias to a variety of causes. Studies require a substantial amount of
funding, and although a portion of studies are funded from government grants and external
awards, many receive funding from pharmaceutical companies. These pharmaceutical are for-
profit organizations and therefore have a vested financial interest in the results of a study, which
may directly, or indirectly influence reported research findings9. More specifically, researchers
may feel pressured to report more favourable findings of a medication. Others have attributed
this bias to an inability to simulate the copious amounts of ADEs experienced by patients. This is
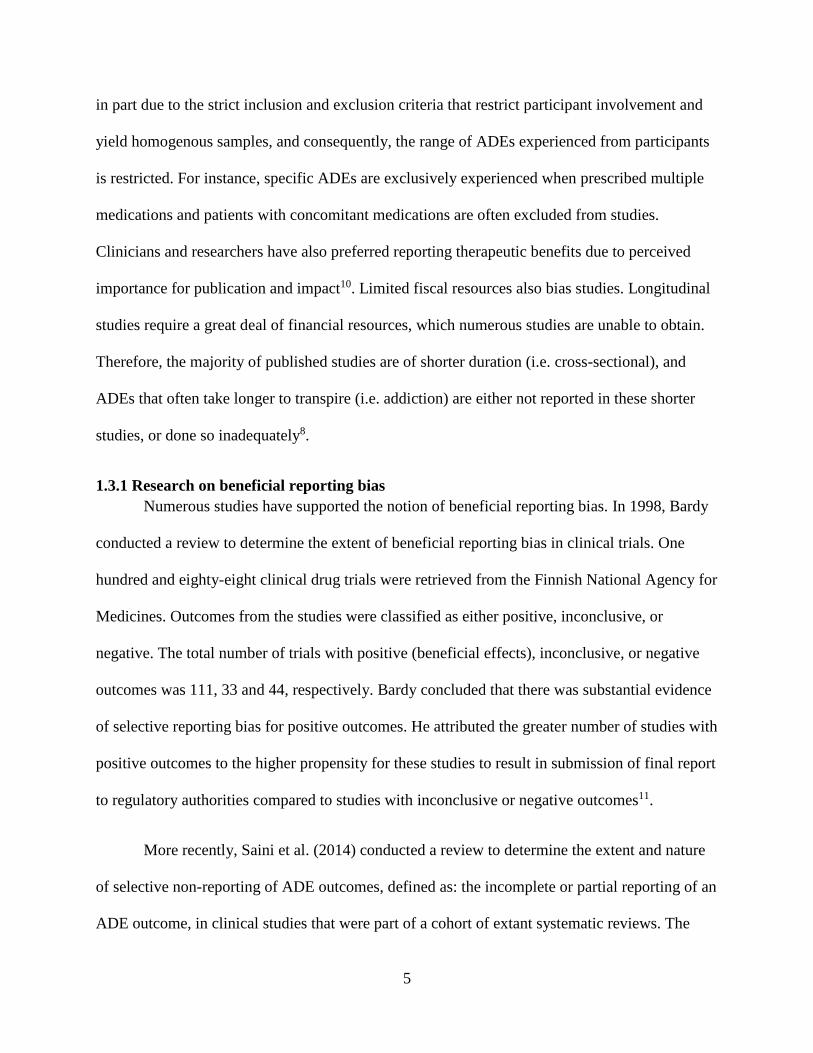
5
in part due to the strict inclusion and exclusion criteria that restrict participant involvement and
yield homogenous samples, and consequently, the range of ADEs experienced from participants
is restricted. For instance, specific ADEs are exclusively experienced when prescribed multiple
medications and patients with concomitant medications are often excluded from studies.
Clinicians and researchers have also preferred reporting therapeutic benefits due to perceived
importance for publication and impact10. Limited fiscal resources also bias studies. Longitudinal
studies require a great deal of financial resources, which numerous studies are unable to obtain.
Therefore, the majority of published studies are of shorter duration (i.e. cross-sectional), and
ADEs that often take longer to transpire (i.e. addiction) are either not reported in these shorter
studies, or done so inadequately8.
1.3.1 Research on beneficial reporting bias
Numerous studies have supported the notion of beneficial reporting bias. In 1998, Bardy
conducted a review to determine the extent of beneficial reporting bias in clinical trials. One
hundred and eighty-eight clinical drug trials were retrieved from the Finnish National Agency for
Medicines. Outcomes from the studies were classified as either positive, inconclusive, or
negative. The total number of trials with positive (beneficial effects), inconclusive, or negative
outcomes was 111, 33 and 44, respectively. Bardy concluded that there was substantial evidence
of selective reporting bias for positive outcomes. He attributed the greater number of studies with
positive outcomes to the higher propensity for these studies to result in submission of final report
to regulatory authorities compared to studies with inconclusive or negative outcomes11.
More recently, Saini et al. (2014) conducted a review to determine the extent and nature
of selective non-reporting of ADE outcomes, defined as: the incomplete or partial reporting of an
ADE outcome, in clinical studies that were part of a cohort of extant systematic reviews. The

6
review included 92 systematic reviews of RCTs and non-randomized studies published in the
Cochrane Library between 2012 and 2013, and 230 systematic reviews published between 2007
and 2011 from other databases (i.e. DARE). Eighty-six percent of reviews from the Cochrane
Library did not include full data from the main ADE of interest. Furthermore, sub-group analysis
of the individual studies included in the systematic reviews from Cochrane Library revealed that
primary ADEs were inadequately reported in 76% of these included primary studies. In a
subsequent sub-group analysis, which included the primary studies from the 230 systematic
reviews from various other databases, primary ADEs were inadequately reported in 47% of
included primary studies. The authors also examined outcome reporting bias, which was defined
as selection (on the basis of the results) of a subset of the original variables recorded for
inclusion in a study publication. The authors reported that outcome reporting bias was found in
86% of all systematic reviews (from Cochrane Library and various other databases). Overall, the
authors concluded that the majority of primary studies in their sub-group analyses inadequately
reported ADE outcomes. Additionally, the number of reviews that contained selective non-
reporting of ADEs was significantly high. The authors further added that the declaration of
important ADEs and the quality of the reporting of ADEs must be improved in both primary
studies and systematic reviews12.
Systematic reviews similar to Bardy and Saini et al. have spurred increased research on
ADEs and researchers have started to acknowledge this overwhelming bias in reporting
beneficial treatment effects. Indeed, many researchers are encouraging the responsible reporting
of study results and greater inclusion of ADE outcomes, and numerous researchers have
suggested methods for improving the reporting of ADEs13.

7
Leape (2002) examined both voluntary external reporting systems (regulated by the
individual/researcher) and mandatory external reporting systems (reporting systems run by state
departments of health). He concluded that on the basis of either evidence of changes made to
improve patient safety, or the number of reports received, current voluntary and mandatory
reporting systems are ineffective and problematic. In place of these ineffective reporting systems,
Leape argues to emulate reporting systems such as the Aviation Safety Reporting System, of
which Charles Billings is the architect. Systems such as these promote safe (pilots are immune
from disciplinary action if they report promptly), simple (a one-page report), and worthwhile
(experts analyze the 30,000 confidential annual reports and disseminate recommendations to
pilots and the Federal Aviation Administration) reporting14.
Molokhia, Tanna, and Bell (2009) echo Lucian’s criticisms. These authors reviewed the
reporting of ADEs across a comprehensive set of studies using four data sources, which
included: MEDLINE, EMBASE, Cochrane Library, and National Library. The authors argue that
there is much improvement needed in the ADEs literature and suggest that there are numerous
limitations with the current methods for the reporting of ADEs. The authors purport numerous
inconsistent findings between studies and suggest utilizing computerized techniques. These
computerized techniques should include web-based reporting and computerization of medical
health records with prescription data to improve reliability and consistency13.
Edwards et al. (1999) assessed the quality of assessment and reporting of ADEs in the
pain context. These researchers examined 52 randomized, double-blind clinical trials of single-
dose acetaminophen, or ibuprofen compared with a placebo in moderate-to-severe postoperative
pain. The authors noted that many trials reported incomplete findings of ADEs and that different
methods of assessing ADEs resulted in different reported event rates. For instance, patient diaries

8
yielded significantly more ADEs when compared to other ADE collections. The inconsistency in
findings and the lack of methodological rigor employed by these studies lead the researchers to
conclude that much improvement is needed in the reporting of ADEs in clinical trials. The
authors believe that the first line of attack should be implementing guidelines for the reporting of
ADEs to improve consistency between studies15.
McGauran et al. (2010) also examined reporting bias of ADEs in the pain context. These
researchers examined a wide spectrum of pain, including: acute pain, such as migraines and
vaccinations, and more enduring chronic pain, such as pain experienced during Alzheimer’s
disease and HIV/AIDS. The authors concluded that there was an overwhelming amount of
reporting bias of ADEs in the pain literature, both for acute and chronic pain, and across a
variety of medical interventions. The authors also discuss pragmatic concerns regarding this
reporting bias. They comment: “reporting bias is widespread in the medical literature and has
harmed patients in the past.”8.
1.4 Beneficial reporting bias in systematic reviews and meta-analyses
Beneficial reporting bias is not only evidenced in primary studies, but also occurs in
systematic reviews and meta-analyses. In 2013, Golder, Loke and Zorzela conducted a
systematic review assessing the literature on adverse effects (which included both ADRs and
ADEs) from 1994 to 2011. A total of 849 reviews, published from 1994 to 2011 were included in
the systematic review. All records in the Cochrane Database of Systematic Reviews (CDSR) and
Database of Abstracts of Reviews of Effects (Dare) were scanned for publications that had
harm(s) (which included numerous ADRs and ADEs) as a main outcome of interest. CDSR and
Dare were chosen for this systematic review due to their major collection of systematic reviews
on health care, which includes systematic reviews from MEDLINE and EMBASE. From 4656

9
CDSR reviews and 11062 DARE abstracts screened, 918 full reports were retrieved and 849 met
the established inclusion criteria (799 from DARE, 50 from CDSR). Overall, 1% (50/4656) of
CDSR reviews and 7% (799/11062) of DARE systematic reviews were exclusively focused on
ADRs and ADEs. The authors claim that this low proportion of total reviews is consistent with
metrics of ADR and ADE data reported in the published literature and argue that there is a need
for more reviews on ADRs and ADEs. Additionally, the authors purport that there was a
universal dominance of systematic reviews limiting search strategies to MEDLINE and only
including primary studies that were RCTs16. The inclusion of predominantly RCTs is
problematic as the majority of studies that examine ADRs and ADEs are non-controlled
observational studies17.
Golder, Zorzela and Loke have also examined quality of reporting of ADRs and ADEs in
systematic reviews. In a 2014 article published by Golder, Zorezela, Loke et al. the researchers
examined quality of reporting of ADRs and ADEs in systematic reviews. The authors searched
CDSR and DARE databases for systematic reviews published from January 2008 to April 2011
that had ADRs and ADEs as their main outcome. For the purposes of their review, ADRs were
defined as: adverse reactions, and ADEs were defined as: unintended complications associated
with a healthcare intervention. Of 4644 reviews identified, 309 were systematic reviews or meta-
analyses primarily assessing ADRs and/or ADEs. The authors noted that these 309 systematic
reviews compounded the poor reporting of ADR and ADE data evidenced in primary studies,
either by failing to report ADRs and/or ADEs, or doing so inadequately18.
1.5 Impact of poor quality of reporting and high risk of bias
The lack of rigor and systematic approach among the majority of studies that examine
ADEs often results in poor quality of reporting and high risk of bias, and numerous studies have
10
demonstrated that poor quality of reporting and/or high risk of bias inflate/overestimate the event
rate of ADEs19.
Abdel-Sattar, Krauth, Anglemyer, and Bero (2014) conducted a meta-analysis to examine
the relationship between risk of bias criteria, research outcomes, and study sponsorship in a
cohort of preclinical thiazolidinedione (TZD) animal studies. One hundred and twelve studies
satisfied inclusion criteria and were subsequently included. The authors concluded that most
studies reported favourable results (88 of 112) and conclusions (95 of 112) supporting TZD.
Overall, studies that were of poorer quality and contained higher risk of bias reported more
favourable efficacy findings and contained significantly larger ADE estimates. Additionally, the
authors noticed that there was poor conflict of interest reporting across all included studies20.
Similarly, Dantas (2007) conducted a systematic review of the quality of homeopathic
pathogenetic trials (HPTs) published from 1945 to 1995. The literature was comprehensively
searched and 156 HPTs satisfied inclusion criteria and were included in the review. The authors
noted that a significant majority of HPTs were of low methodological quality and most studies
contained design flaws, which resulted in poor quality of reporting. The authors further explicate
that more patient symptoms and ADEs were reported in studies of poorer quality compared to
higher quality studies21.
Tan et al. (2014) also conducted a review on what they referred to as: “unhelpful
information about ADRs and ADEs”. The authors noted that there was poor quality of reporting
across the majority of studies they reviewed. Furthermore, both ADRs and ADEs were over-
reported in studies with poorer quality of reporting; this was especially true for ADRs, but still a
prominent factor in the reporting of ADEs. The authors argue that there needs to be less
11
heterogeneity in reported studies and a more systematic approach must be utilized to improve
study quality and report more accurate estimates of ADRs and ADEs19.
To combat this overestimation caused by poor quality of reporting and high risk of bias,
researchers have suggested that primary studies, systematic reviews, and meta-analyses employ
standardized terms and guidelines for ADR and ADE data. This standardized approach may help
improve the quality of reporting of ADRs and ADEs and lower risk of bias in studies, ultimately
resulting in more accurate event rates of ADRs and ADEs22.
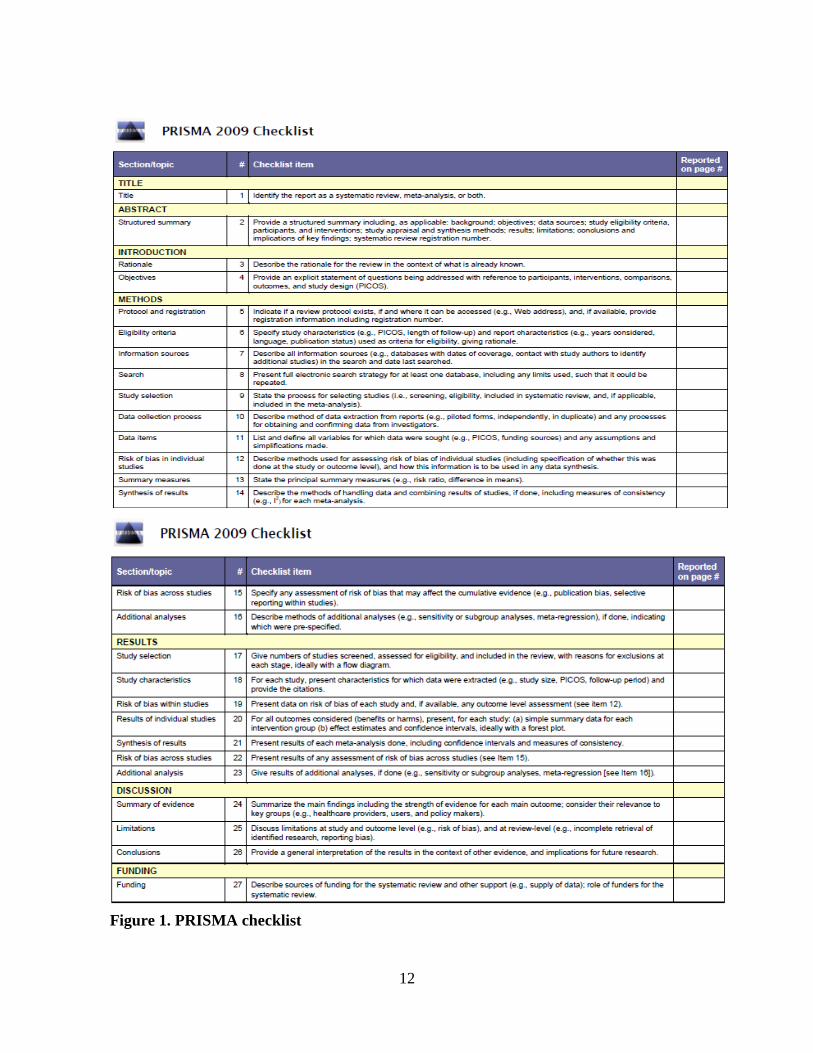
1.6 PRISMA – standardized guideline for systematic reviews and meta-analyses
Preferred Reporting Items for Systematic Reviews and Meta-Analyses (PRISMA) is a
standardized guideline that consists of an evidenced-based minimum set of items/guidelines for
reporting in systematic reviews and meta-analyses. PRISMA comprises of a 27-item checklist
and four-phase flow diagram. In following these reporting items and diagrams PRISMA hopes to
encourage transparency and improved reporting in systematic reviews and meta-analyses.
PRISMA has been increasingly used in numerous systematic reviews and meta-analyses and is
thought to be an effective resource23. Below the PRISMA checklist is included for review.
12
Figure 1. PRISMA checklist
13
In 2010, Moher et al. assessed PRISMA and quality of reporting in systematic reviews.
The authors reviewed previously published systematic reviews on the quality of reporting of
systematic reviews prior to the development of PRISMA, and subsequent to its release. The
authors reported that systematic reviews contained improved quality of reporting, especially
improvement in reporting biases following the development of PRISMA. However, the authors
conclude that the quality of reporting in systematic reviews is still not optimal, which is likely
due to a majority of systematic reviews not utilizing PRISMA. The authors believe if PRISMA
were used more consistently across systematic reviews the quality of these reviews would
drastically improve. Therefore, future systematic reviews and meta-analyses are encouraged to
utilize PRISMA24.
Similarly, Knobloch, Yoon and Vogt (2011) believe PRISMA can lower risk of bias in
systematic reviews and meta-analyses on ADEs. The authors claim publication bias is a major
problem in evidenced based medicine, which is in part due to positive outcome studies and
systematic reviews and meta-analyses being preferentially published. This unequal distribution
of studies has dire consequences on healthcare and often leads to a systematic failure in clinical
decisions. Furthermore, Knobloch, Yoon and Vogt report that the majority of publication bias
that occurs in systematic reviews and meta-analyses emerges mostly during the study-selection
process. The authors recommend that subsequent systematic reviews and meta-analyses use
PRISMA due to its transparency and precision during the study-selection process in systematic
reviews and meta-analyses25.
1.7 Brief background of opioids and the ADE of prescription opioids
In medicine, opioids represent chemicals that produce pharmacological effects similar to
opiates (i.e. morphine). The oldest known opioid is opium (a Greek name which means juice),

14
which is extracted from the opium poppy. Opium is thought to have been known since prehistory
(from when humans first appeared until recorded history) and archeologists have found ample
evidence to suggest opium was extensively used in ancient historical eras. However, it was a
Swiss physician, Paracelsus (1493-1541) that reintroduced opium for medicinal purposes in
Western Europe. Soon after, practitioners quickly noticed many ADRs and ADEs that
manifested following the use of opium and cautioned the public of its use26.
Throughout the 17th and 18th century, numerous opium-specific books were published
that exposed the risks associated with opioids. However, the 19th century was focused on further
understanding the therapeutic benefits of opium, while ADRs and ADEs remained largely
unexamined. In 1804, Friedrich Sertürner, a German pharmacist assistant discovered morphine
along with its analgesic properties. In 1808, William Collen furthered Sertürner research and
noted that opium interrupts message flow (impulses) from the nerves to the brain and vice-versa,
which ultimately results in the abolishment of all painful sensitivity26.
The discovery of morphine and the analgesic effects of opium lead to a plethora of
medical and social problems. According to mortality data, one third of all lethal poisonings were
due to opium and morphine overdose; taken both as a source of pleasure and for medicinal
purposes. Historians attribute opium’s effects on increased mortality to a lack of understanding
and investigation on the ADEs associated with opium. Indeed, many historians often refer to the
19th century as: “the war on opium”26.
Despite the increased mortality spurred from opium and morphine, concepts of tolerance,
withdrawal symptoms, addiction, and psychic and physical dependence were only widely
discussed later, in the 20th century26.

15
1.8 Literature on ADEs of prescription opioids
As previously discussed, the ADEs of prescription opioids remained largely unstudied
until the 20th century (Duarte, 2005). Following which, numerous studies have been published
that have elucidated the great number of ADEs associated with prescription opioids. However,
many researchers have expressed concern regarding the literature that has been published27.
Oosten et al. (2015) conducted a systematic review of studies that reported on ADEs of
commonly prescribed opioids for cancer-related pain. Twenty-five studies were included that
examined one or more of the following prescription opioids: morphine, oxycodone, fentanyl,
methadone, or hydromorphone. Oosten and his colleagues concluded that studies on the ADEs of
prescription opioids were severely lacking, and among studies that have been published, there
was an immense amount of heterogeneity. They further add, due to the lack of systematic
assessment and reporting, the relative rates of ADEs per type of opioid are unknown, and
therefore, there is an urgent need for studies with standardized outcome measures and
reporting28.
Similarly, Moore and McQuay (2005) conducted a systematic review to examine the
event rate of ADEs of oral prescription opioids for chronic non-malignant pain in RCTs. Thirty-
four trials with 5,546 patients were included and almost all opioids used were for treating
moderate rather than severe pain. The authors noted that there was a large amount of clinical
heterogeneity in condition, opioid, opioid dose, duration, and use of titration across all included
studies. Additionally, most trials were of shorter duration, often less than four weeks, and few
titrated the dose of opioids, which means that results generated from these studies are of limited
applicability to longer-term use of opioids in clinical practice. Moore and McQuay suggest that
subsequent studies employ standardized outcome measures and reporting and aspire to examine

16
longer-term implications of prescription opioids in order to limit heterogeneity and produce more
generalizable results29.
Baladini, Von Korff, and Lin (2012) conducted one of the few systematic reviews on the
long-term ADEs of prescription opioids. Studies published in peer-reviewed journals from 2005
to 2011 were retrieved using major databases, including: MEDLINE, Agency for Healthcare
Research and Quality Clinical Guidelines and Evidence Reports, and the Cochrane Database of
Systematic Reviews. Seventy-four studies satisfied inclusion criteria and were included in the
systematic review. The authors’ purported that chronic opioid therapy is associated with
numerous ADEs, including: overdose and death. However, significant gaps remain regarding the
spectrum of potentially long-term opioid-related ADEs. As a result, the authors suggest that
better constructed systematic trials be completed to address these gaps and to strengthen our
knowledge of long-term ADEs of prescription opioids30.
1.9 Explanation and aim of meta-analytic review
Explanation: Opioids are considered one of the most effective analgesics with well-
established therapeutic benefits. Furlan et al. (2012) published a met-analysis of 62 RCTs that
examined the benefits of prescription opioids and concluded that there was ample evidence of
therapeutic benefits from patients prescribed opioids. Moreover, while the therapeutic benefits of
opioids have been copiously documented, ADEs that result from prescription opioids have not
received similar scrutiny31. Indeed, many researchers have voiced their concern on the need for
more studies and studies of greater quality and low risk of bias that examine the ADEs of
prescription opioids; a widely prescribed drug that causes many ADEs32.
Accordingly, the current meta-analytic review focused on five selected adverse drug
events (SADEs), which included: misuse, abuse, addiction, overdose and death. These five

17
SADEs were selected due to their dangerous, often life-threatening consequences, and due to
their event rates being largely unknown. In addition, the five SADEs are among the most serious
to occur while taking prescription opioids, and consequently, most literature and discussion has
been focused around them33. Finally, it was not feasible to include other ADEs as there has not
been an adequate amount of literature published.
Aim of meta-analytic review: To extract the event rate of SADEs (misuse, abuse,
addiction, overdose and death) and evaluate each primary study’s quality of reporting and risk of
bias to inform patients and healthcare professionals of the risk of potential serious, life-
threatening SADEs associated with prescription opioids and to ameliorate ADE studies. In
addition, specific moderator variables (quality of reporting of SADEs, risk of bias, study design,
active versus passive collection of SADEs, current or previous mental health disorder(s) and/or
substance use disorder, and length of participant opioid exposure) were examined to determine if
they explain variance in SADEs between studies. (The aforementioned moderator variables were
selected due to their purported significance in relation to the ADEs of prescription opioids)34.
1.9.1 Explanation of McHarm
Numerous instruments have been developed to evaluate the methodological quality of
primary studies and systematic reviews. However, these instruments do not adequately address
the evaluation of ADEs, and the few quality-rating instruments that do consider ADEs merely
evaluate the presence or absence of reporting and do not evaluate the quality of reporting.
Indeed, recognizing and evaluating ADEs may require methodological considerations that differ
from those used for assessing the benefits of treatment interventions. For instance, many ADEs
are not easily anticipated, and consequently, are not adequately screened in trials. Conversely,

18
some ADEs are so common that their presence alone is of no consequence, rather the severity of
the symptom is of relevance. Thus, McMaster University Evidence-based Practice Centre
(commonly referred to as McHarm), sponsored by CCOHTA, developed a quality assessment
checklist specific to ADE outcomes for primary studies35.
The McHarm is the only instrument that evaluates both the quality of reporting of ADEs
and the methodology used in the collection of ADEs data. This comprehensiveness is an
important strength of the McHarm as the methodology and reporting of ADEs are directly
related. For instance, if a study employs a flexible methodology where participants report ADEs
experienced in a spontaneous manner, some participants may experience less severe ADEs (i.e.
misuse of a prescribed drug) but not report them. As an example, a participant may accidentally
misuse (forget to take medication on numerous occasions) their medication and believe that
doing so was a minor event that is of no consequence and should not be reported. Conversely,
studies that employ more rigid methodologies ensure participants are aware of the ADEs being
examined and consequently if these ADEs are experienced the principal investigator is made
aware. Unfortunately, studies with robust methodologies are often not exhaustive and only
investigate specific ADEs (overlooking other ADEs). In both cases, the methodology employed
by a study influences which ADEs are collected and subsequently reported.
The current meta-analytic review used the McHarm, to assess the quality of reporting of
SADEs (misuse, abuse, addiction, overdose and death) of prescription opioids. The McHarm is
comprised of 15 questions that are answered in the format of “yes”, “no”, or “unsure” – with an
overall score ranging from 0 to 15 points (higher scores signify better ADE quality of
reporting)35.

19
The McHarm has also been proven to be a highly reliable and valid instrument.
Santaguida et al. (2011) tested the reliability and the validity of the McHarm instrument. These
researchers used a Delphi Consensus exercise with six experts to assess the reliability and
construct validity of the McHarm. The researchers concluded that reliability testing demonstrated
acceptable levels (internal consistency all studies= 0.82; 95% CI 0.79 to 0.85, and intra-class
correlation= 0.95, 95% CI 0.91 to 0.98). Construct validity was evaluated with the Chou and
Helfand scale and received a score of 0.66. Discriminant validity was also assessed with the
Jadad scale and received a score of 0.22. Both construct and discriminant validity were deemed
acceptable. However, reliability and validity measures varied between surgical and
pharmacological studies, which suggests that the type of medical intervention may be a potential
influence. More specifically, Santaguida et al. purported that the McHarm demonstrated higher
ratings of reliability and validity for pharmacological studies compared to studies that examined
surgical interventions. Nonetheless, reliability and validity ratings suggested that the McHarm
contains high inter-rater and intra-rater reliability and high construct and discriminant validity
when used to assess both surgical and pharmacological studies35.
The McHarm is the ideal instrument to assess the quality of SADEs in the current meta-
analytic review. The current review focused on opioid medications, which are pharmacological
in nature. Therefore, the higher ratings of reliability and validity the McHarm exemplifies for
pharmacological studies further strengthens results generated from the McHarm in the current
meta-analytic review. In addition, the more inclusive aspects of the McHarm: the evaluation of
the methodology used for ADE collection and the reporting of ADEs ensures that the current
meta-analytic review accurately and completely assesses the quality of SADEs in each included
primary study.

20
1.9.2 Explanation of risk of bias instrument
Systematic reviews and meta-analyses allow researchers to review and evaluate extant
literature in a specific area of study. The inferential strength and validity of these reviews is
contingent on the level of quality of the primary studies being assessed. More specifically,
systematic reviews and meta-analyses that include more rigorous studies may report more robust
research findings. Conversely, reviews that contain lower quality studies often report confounded
or inconsistent findings that may be invalid. Many researchers agree that the most important
factor in determining the level of quality and validity of a study’s reported findings is risk of
bias.
In systematic reviews and meta-analyses, bias occurs when there is a systematic error, or
deviation from empirically valid results or inferences. Biases can lead researchers to either
underestimate (minimize the true effect of an intervention) or overestimate (overstate the true
effect of an intervention) the actual effect of an intervention. Overestimation often leads
researchers to report findings which are considered false positive (erroneously concluding an
intervention is effective if the less rigorous studies are biased toward overestimating an
intervention’s effect). Conversely, underestimation leads researchers to publish findings which
are considered false negative (erroneously concluding no effect if the less rigorous studies are
biased towards underestimating an intervention’s effect). Biases also differ in magnitude –
different biases influence the outcome of interest in varying degrees. “Small” biases are much
less likely to influence the outcome of interest and are minor compared with the observed
(actual) effect. Conversely, “large” biases have a significant effect on the outcome of interest,
which may result in the publication of an invalid finding (the reported finding is entirely due to
bias). Unfortunately, it is impossible to know to what extent biases have affected the results of a
particular study. However, studies have suggested that flaws in experimental design,

21
care/treatment administration, data collection, and the statistical analyses carried out may render
a study’s findings biased. Although these flaws may contribute to the development of a bias, the
presence of a bias is not certain. Indeed, the results of a study may be unbiased despite a
methodological flaw. Therefore, it is considered more appropriate to report a study’s risk of bias
than conclude with certainty that a bias exists within a given study.
Despite the development of numerous risk of bias instruments, many researchers fail to
assess risk of bias in their systematic reviews and meta-analyses. This is in part due to the
specificity of each of these instruments. For the most part, the risk of bias tools available
examine a single form of bias and fail to provide guidelines for assessing other forms of bias.
Additionally, current risk of bias tools often only determine risk of bias for a single study design
(i.e. RCTs). A comprehensive tool that assesses all forms of bias is currently lacking in the
literature36.
There are five major forms of risk of bias. All five of these biases may significantly
influence the reported results of a study. These biases include: selection bias, performance bias,
measurement bias, attrition bias, and confounding bias. Selection bias refers to the inclusion
criterion used to select for participants included in a study. Selection bias occurs when the
participants in a study are not a representative sample of the population of interest and
participants contain systematic differences in baseline characteristics. Performance bias refers to
the care or treatment being provided to participants. This bias occurs when there are systematic
differences between participants in either the care that is being provided, or in exposure to
factors other than the intervention(s) of interest. Measurement bias refers to poor measuring of
the outcome of interest, which may either be systematically or randomly executed. This bias may
22
occur when either blinding is not implemented, the instruments used to assess the outcome of
interest(s) is not reliable and/or valid, or the timing when the outcome of interest is assessed
differs between participants included in the study. Attrition bias refers to the attrition, or
retention of participants over the course of a study. This bias occurs when there are systematic
differences in withdrawals from a study between the groups being compared. Intention-to-treat is
another aspect of attrition bias and occurs when the results of a study are based on all
participants that were randomized at the start of a study, regardless of participant withdrawal.
This is done to avoid the effects of crossover and dropout, which may break the random
assignment to the treatment groups in a study; therefore, reducing the risk of attrition bias. The
final major form of bias is confounding bias. Confounding bias refers to whether the
measurement of confounders are reliable and valid. This bias occurs when a variable, which acts
as a confounder has not been adequately adjusted for in a study’s analysis37.
Furlan et al. (2015) developed a comprehensive risk of bias instrument that measures all
five major forms of risk of bias across three prominent study designs, which include: RCTs,
observational-controlled trials, and non-controlled observational trials (the risk of bias
instrument is available for review in Appendix A and Appendix B). This risk of bias instrument
was created by combining and adjusting previous risk of bias instruments that have proven
reliable and valid. In doing so, Furlan et al. have created a risk of bias tool that is comprehensive,
reliable and valid. More specifically, each risk of bias instrument’s criterion (question) for the
assessment of risk of bias was considered and adaptations and additions were made. The end
result was a comprehensive, precise, accurate, reliable and valid criterion (question(s)) for each
of the five major forms of risk of bias. The risk of bias instrument has also been published as a
Cochrane methodology further lending support to its credibility37.

23
1.9.3 Research questions, hypotheses, and objectives
Primary research question: What is the overall quality of reporting of SADEs and risk
of bias in primary studies that investigate SADEs (misuse, abuse, addiction, overdose, and death)
of prescription opioids?
Secondary research question: Does quality of reporting of SADEs and risk of bias
explain the variance between event rates of SADEs in primary studies?
Tertiary research question: Do moderator variables, including: active versus passive
collection of SADEs, study design, participant length of exposure to opioids, and prior and/or
current mental health disorder(s) and substance use disorder explain the variance between event
rates of SADEs in primary studies?
The hypotheses for the current meta-analytic review were developed a priori and include:
Hypothesis 1: Overall, quality of reporting of SADEs, assessed by McHarm will be low
and risk of bias, assessed by Furlan et al. (2015) risk of bias instrument will be high in studies
that investigate SADEs of long-term prescription opioids.
Hypothesis 2: Studies with inferior quality of reporting of SADEs, assessed by McHarm
and/or risk of bias, assessed by Furlan et al. (2015) risk of bias instrument will yield higher
event rates compared to studies with superior quality of reporting of SADEs and/or no risk of
bias.

24
Hypothesis 3: If moderator variables are found to explain variance of event rates
between studies (statistically significant associations with moderator variable(s)), SADEs should
be:
Hypothesis 3 a): higher in studies with inferior quality of reporting (lower McHarm)
compared to studies with superior quality of reporting (higher McHarm).
Hypothesis 3 b): higher in studies as risk of bias (risk of bias via Furlan et al. (2015)
risk of bias instrument) compared to studies that are not at risk of bias (no risk of bias via Furlan
et al. (2015) risk of bias instrument).
Hypothesis 3 c) higher in studies with active collection (question 5 of the McHarm) of
SADEs compared to passive collection (question 6 of the McHarm).
Hypothesis 3 d): higher in non-controlled observational studies and lower in RCTs
(observational controlled studies will be in-between the two).
Hypothesis 3 e): higher in studies where participants were exposed to opioids for longer.
Hypothesis 3 f): higher in studies with prior or current mental health disorder(s) and/or
substance use disorder.
Primary objective: evaluate the overall quality of reporting of SADEs, risk of bias, and
event rates of SADEs (misuse, abuse, addiction, overdose, and death) in studies that investigate
SADEs of prescription opioids in CNCP patients, and subsequently inform clinical practice by
promoting safer prescribing of opioids.

25
Secondary objective: examine whether specific moderator variables explain variance in
reported event rates of SADEs and subsequently disclose whether any of the moderator variables
help predict patient characteristics that increase risk of SADEs of prescription opioids.
Tertiary objective: provide recommendations for subsequent studies to improve quality
of reporting of ADEs and lower risk of bias and encourage further research on ADEs of
prescription opioids.

26
27
2 Methods
The methods section of this meta-analytic review followed the Preferred Reporting Items for
Systematic Reviews and Meta-Analyses) PRISMA guidelines. The guideline promotes
transparency and precision to ensure that all necessary information is made available to
reviewers in a concise and coherent structure.
2.1 Types of studies
Included primary studies were either randomized controlled trials (RCTs), controlled
observational studies, or non-controlled observational studies. Letters, editorials, commentaries,
conference proceedings, meeting abstracts, lectures and addresses, narrative reviews, and
qualitative research were excluded. This review was limited to studies published in English, and
only studies that examined the event rate of selected adverse drug events (SADEs) (misuse,
abuse, addiction, overdose, and death) over a minimum of 3 months or longer were included to
ensure consistency across included studies and to allow for cross study comparisons. In addition,
adverse drug events (ADEs) in general, especially the five included in the current review, require
longer to transpire and certain ADEs may be transient in nature (i.e. misuse/abuse of an opioid
medication intermittently). Therefore, studies that examined event rates at one given point in
time were excluded.
2.2 Participants
Patients suffering from chronic non-cancer pain (CNCP) - defined as pain persisting for 3
months or longer - that are over the age of 17 and not pregnant were included. Seventeen years
of age was selected based on extant literature on prescription opioids and ADEs38. A list of
conditions associated with CNCP is provided for review below, and includes conditions such as:
low back pain and other musculoskeletal pain, neuropathic pain, osteoarthritis, rheumatoid

28
arthritis, fibromyalgia, headaches and migraines, complex regional pain syndrome, reflex
sympathetic dystrophy, and causalgia.
Studies that focused exclusively on cancer, acute post-operative pain, ischemic pain due
to vascular disease, pancreatitis, abdominal pain, sickle cell disease, and Crohn’s disease were
excluded due to the broad differences in patient profiles and treatment.
List of conditions associated with CNCP
Complete Body:
Arthritis
Bursitis
Central Sensitization and
Opioid Induced Hyperalgesia
Chronic Fatigue Syndrome
Complex Regional Pain Syndrome
Diabetes and Diabetic Neuropathy
Fibromyalgia
Multiple Sclerosis
Myofascial Pain Syndrome
Nephritis
Non Specified Neuropathic Pain
(Mono or Poly Neuropathy)
Osteoarthritis
Osteoporosis
Phantom Limb Pain
Pinched Nerve
Post-Spinal Chord Injury Pain
Post-Surgical Chronic Pain
Rheumatoid Arthritis
Shingles (Herpes Zoster) and
Post-Herpetic Neuralgia
Sickle Cell Disease
Stroke Pain
Tendonitis
Lower Leg, Ankle and Foot Conditions:

29
Achilles Tendon Rupture
Paraplegia
Phantom Limb Pain
Quadriplegia (Tetraplegia)
Sciatica
Shin Splints
Spinal Disc Herniation
Spinal Stenosis
Stroke Pain
Lower Back:
Chronic Lower Back Pain
Degenerative Disc Disease
Facet Arthropathy
Sacro-Iliac Joint Pain
Sciatica
Spinal Disc Herniation
Spinal Stenosis
2.3 Interventions
A prescribed opioid had to be taken daily or almost daily for a duration of three months
or longer. Opioids were operationalized as: any opiumlike drug prescribed for the alleviation of
chronic pain; common medications that fall within this class of drug (opioids) include:
hydrocodone, oxycodone, morphine, codeine, and related drugs27.
Studies that used common modes of administration for chronic pain populations were
included, such as: oral, transdermal, transmucosal or rectal routes of administration. Studies that
focused on opioids administered intrathecally, intramuscularly, or intravenously with pumps
were not included due to their infrequent use outside of specialized pain clinics, and patients
treated in tertiary care (i.e. specialized pain clinics) are considered different from patients treated
in primary or secondary care.
2.4 Outcomes
Studies with one or more of the following outcomes of interest were included: misuse,
abuse, addiction, overdose, and/or death.

30
Misuse, defined as: use of an opioid in ways other than those intended by the prescribing
physician (synonyms in the literature: problematic opioid use, absence of prescribed opioid in
urine, injecting or snorting an opioid, crushing an opioid, non-compliant with opioid medication,
non-compliance, and failure to adhere to PRN dose of prescribed opioids)39.
Abuse, defined as: the intentional self-administration of a medication for a non-medical
purpose such as altering one’s state of consciousness (i.e. 'getting high') (synonyms: using an
opioid for purposes other than pain, using an unsanctioned dose of an opioid for recreational
purposes, elevating one’s prescribed opioid for non-pain related reasons without knowledge of
the prescribing physician, and aberrant drug-related behaviour due to likely association with drug
abuse)40.
Addiction, defined as: a diagnosis via DSM-V, or comparable diagnostic criteria (i.e.
ICD-9-CM) and characterized by behaviours that include one or more of the following: impaired
control over drug use, compulsive use, continued use despite harm/adverse reactions, and
craving (the 4 Cs)40.
Overdose, defined as: central nerve system depression caused from a prescribed opioid
with the following characteristics: impaired level of consciousness, low respiratory rate, and
myosis. Intentional and accidental overdose were included, and fatal and non-fatal overdose were
included as well40.
Death, defined as: cessation of life caused from prescription opioid(s), commonly
determined from a death certificate40.
As an important note, fatal overdose was classified as both overdose and death as the
outcome is relevant for both.
31
2.5 Electronic searches
The sample of studies included in the current meta-analytic review were obtained from
major research databases, including: MEDLINE, EMBASE, CINAHL, PsycINFO, CENTRAL,
and Business Source Premier, using a comprehensive search strategy; all databases were
exhaustively searched from their inception dates.
Two separate electronic searches were conducted using the same standardized search
strategy via the OVID platform. The first electronic search was conducted by a librarian at the
Institute for Work & Health with extensive experience in literature searches. The initial
electronic search retrieved studies from the aforementioned databases until August 2012. The
second electronic search was conducted by the author in October 2015 with the supervision from
the same librarian. This subsequent search was conducted to update included studies until
October 2015.
The search terms used for both electronic searches were informed from extant literature
and were developed by a group of researchers with expertise in opioids and systematic reviews
and meta-analyses. The search terms are available for review in Appendix C.
2.6 Manual searches
Reference lists of retrieved studies and recently published (less than 5 years) studies and
reviews were manually searched. Searchers were also supplemented by persons involved in the
meta-analytic review that searched their personal files for relevant studies that had not been
captured by the electronic searches. Conference proceedings, lectures and newsletters in the field
of opioids and ADEs were also consulted to ensure an exhaustive list of included studies. If a
study was retrieved from one of the manual searchers listed above, it was included in the current
review.

32
2.7 Selection of studies
Studies were first reviewed using titles and abstracts to ensure their relevance to the
current meta-analytic review. If deemed relevant, the full text of a study was reviewed and a
decision was made of whether the study satisfied inclusion and exclusion criteria. At each stage
of the study selection process, two independent reviewers were involved in study selection, and
if disagreement arose, concordance was achieved through dialogue and discussion. However, if
disagreement persisted, a third reviewer was consulted to mediate over the disagreement and
provide resolution.
Pilot tests were conducted to ensure both reviewers had a similar understanding of
inclusion criteria. This process was done prior to the first level of screening of titles and abstracts
and again prior to the full text screening. The same concordance process was used during the
pilot stage.
2.8 Data extraction
A detailed data extraction protocol was created a priori, which included: the
process/methods for extracting data, which data would be extracted, and the protocol for missing,
or insufficient data. The data that were selected to be extracted was informed from extant ADE
systematic reviews and meta-analyses that have suggested their significance in the ADE
literature. Subsequently, each study was thoroughly reviewed and all relevant outcomes were
noted. The studies were then read a second time (and subsequently, if needed) and the reviewer
actively searched for relevant information/data for extraction. Data which were extracted
included: reference ID, reviewer date, author, year, language, journal/source, where a study was
conducted, ethnicity/race, source(s) of funding, conflict of interest statement, interpretation of
conflict of interest statement, mean age, age range, gender, prior treatment, population of
interest, recruited participants, drop-outs/discontinuation, final sample, number of groups,

33
previous or current mental health disorder(s) and/or substance use disorder(s), diagnosis of
cancer, study design, length of chronic pain, length of participant opioid use, length of
participant opioid use over study, active versus passive collection of SADEs, outcome of interest
(misuse, abuse, addiction, overdose, and/or death), event rate of outcome of interest, and
additional thoughts.
If during the data extraction process data was unclear, or not provided, then a decision
was made on which information to include, or the field on the data extraction table was filled
with N/A (non-applicable to the current study). For instance, if an average length of chronic pain,
or opioid duration was included in the article, along with a range (i.e. 3 months – 3 years), the
study was included if the range satisfied the minimum length for inclusion (3 months).
Additionally, the average length reported in the study was entered in the data extraction table.
Another example of insufficient data occurred when a study did not include a conflict of interest
statement. When such an issue arose, “N/A” was entered into the data extraction table and a
decision was made - based on the reviewer’s interpretation of the article – if the study contained
any indication of conflicts of interest. Similarly, when the event rate of SADE outcomes was
extracted, if only a percentage was included in the study (i.e. not the number of participants that
experienced the SADE outcome), then estimation was used to determine the number of
participants that most closely approximated the percentage recorded in the study.
Below is the data extraction guideline for review.
Data Extraction Guideline

34
RefID: Unique identifier for each article generated by Reference Manager. If the study was
published in more than one article, we considered only one study with multiple publications, but
the primary study is the main RefID.
Reviewer, Date: Two dates are included; the date the first reviewer extracted data from an
article and the date the second reviewer extracted the data.
STUDY CHARACTERISTICS
Author, Year: The surname of the first author listed in a publication and the year in which the
article was published. The author and year were used along with each article’s RefID to identify
individual articles/publications.
Language: Language in which the full article was written. If the study provided an English
abstract but the text was in a non-English, then the language of the full text was extracted.
Journal/Source: The name of the journal, or source (i.e. book, website) the article was
published. If an article was published in numerous sources the earliest publication was used.
Where study was conducted: The country where the article/study was conducted. If the study
spanned across several countries, all of them were included.
Source(s) of funding (copy from the paper): The source of funding listed in each publication,
which included both monetary and nonmonetary (facilities, equipment) sources of funding.
Conflict of interest statement: In each publication, if a conflict of interest statement was found
it was included. “None” was used for publications that did comment on conflict of interest.
35
Conflict of interest (our interpretation): The reviewer’s interpretation of whether a publication
contains conflict of interest. The reviewer’s interpretation is based on his/her overall impression
of a publication and its conflict of interest statement.
Study design: The way in which the study was conducted (methodology)/design of a study.
Study designs included: randomized controlled trials, double-blind randomized trials,
single-blind randomized trials, adaptive clinical trials, nonrandomized trials, observational
trials, cohort trials, case-control trials, cross-sectional trials, and ecological trials.
POPULATION
Ethnicity, Race (copy from the paper): The number of participants of each ethnicity/race
(referred to differently across studies) included in the study (ethnicities/races were copied
verbatim).
Age (mean): Mean age of all participants. If the study provided mean age by subgroup of
patients, we calculated the weighted mean.
Age (range): The age range of participants included in the study sample (youngest and oldest
age). If the study provided range by subgroup of participants, we calculated the weighted
mean/average of all included age ranges.
Gender: The percentage of male participants included in the study sample. If another numerical
value was included instead of percent it was adjusted and changed. In addition, if the percentage
of female participants was listed the percentage of male participants was deduced/calculated and
included.
36
Prior treatment: Pain treatments/therapies prescribed to patients prior to study involvement. If
numerous treatments/therapies were included all of them were listed. Additionally, the treatment
had to have been related to the ailment the researchers were examining. For instance, if chronic
pain was the area of interest only treatments/therapies for chronic pain were included.
How was chronic pain defined (months): How long did the pain condition have to be present
for participants to receive a diagnosis of chronic pain?
Population of interest: The population which the authors/researchers would like to examine for
their study. From this population, the study sample is recruited.
Recruited participants: The participants/patients recruited to participate in the study from the
population of interest.
Dropouts/Discontinuation: The number of participants that had participated in the study and
voluntarily withdrew from, or were asked to leave the study before its conclusion. If drop-outs
were not discussed in a publication “0” was assigned.
Final sample: The total number of participants that participated from the start of the study until
its conclusion. These participants were recruited from the population of interest and satisfied the
study’s inclusion and exclusion criteria. If the final sample for each individual group was used
each group’s final sample was added and their sum was included.
Number of groups: The number of samples included in a study. If this number differed
depending on which variables/measures were examined the largest number of samples was used.
OPIOIDS

37
Duration of opioid use (months): Total duration of opioid use prior to study involvement. This
includes the minimum amount of time a participant had to be prescribed opioids prior to study
inclusion.
Duration of opioid use (over study, measured in months): The length of time participants
used opioids during the study. If a range was given then the minimum length of opioid use was
used. Moreover, if the duration varied depending on the study group then the minimum length of
opioid use was used.
OUTCOMES
Outcome(s) assessed: Five outcomes were considered in this systematic review: opioid misuse,
abuse, addiction, overdose, and death. Each study’s outcomes/results were assessed and
categorized under these five outcome measures. Outcomes were assessed independently by two
reviewers, both of which used the aforementioned definitions for each outcome.
Results: The data authors collected from the participants during the study. Absolute values were
used. Therefore, if percentages were used they were changed to absolute values. In addition, if a
range was used the middle/mean of the range was used as the absolute value from the study.
MISSING OR INSUFFICIENT DATA
Length of chronic pain and/or opioid(s): If an average length of chronic pain, or opioid
duration was included in the article, along with a range (i.e. 3 months – 3 years), the study was
included if the range satisfied the minimum length for inclusion (3 months), and the average
length reported in the study was entered in the data extraction table. If the average length could

38
not be calculated or was not reported in the journal article, then the minimum length of chronic
pain and/or exposure to opioids was used.
Conflict of interest statement: When a study did not include a conflict of interest
statement, “N/A” was entered into the data extraction table and a decision was made - based on
the reviewer’s interpretation of the article – if the study contained any indication of conflicts of
interest.
Event rate of SADE: When the event rate of SADE outcomes was extracted, if only a
percentage was included in the study (i.e. not the number of participants that experienced the
SADE outcome), then estimation was used to determine the number of participants that most
closely approximated the percentage recorded in the study.
Participant race/ethnicity: If participant ethnicity/race was not reported in a study, then
“N/A” was entered into the data extraction table under “Ethnicity/Race”. In addition, the way in
which “Ethnicity/Race” was reported in the article was copied verbatim into the
“Ethnicity/Race” column of the data extraction table. However, “Ethnicity/Race” was
reclassified according to pre-specified categories in adjacent columns following the
“Ethnicity/Race” column. More specifically, “White” was reclassified as “Caucasian” “Black
was reclassified as “African American”, and “N/A” was reclassified as “Uknown”.
Current or previous mental health disorder(s) and/or substance use disorder(s): All
studies only indicated whether current or previous mental health disorder(s) and/or substance use
disorder(s) were present among the entire included sample of participants. However, studies did
not specify the exact number of participants from the sample that currently have, or had been
diagnosed with a previous mental health disorder and/or substance use disorder. Therefore, if the

39
study mentioned that previous or current mental health disorder(s) and/or substance use disorders
were present among the entire sample, “Yes” was included in the data extraction table. If none of
these disorders were reported at all, then “No” was listed.
Seven variables from the data extracted, which were selected a priori, were included in
subsequent meta-regressions as moderator variables, and included: McHarm score, active versus
passive collection of SADEs, risk of bias, study design, length of participant opioid exposure,
and current or previous mental health disorder(s) and SUD. These variables were included as
moderator variables due to their significance in extant literature on the SADEs (specifically,
misuse, abuse, addiction, overdose, and death) of prescription opioids34.
To ensure that the data were extracted accurately and completely, a second reviewer, that
has experience with scientific literature and study-methodology read all included studies and
checked the completed data extraction to ensure there were no errors. If disagreement arose
between reviewers regarding data extracted, the reviewers met and expressed their opinions
regarding the disagreement. If consensus was reached between the reviewers then the data
decided on was included in the data extraction table. However, if disagreement persisted, a third
reviewer was consulted to mediate over the disagreement and provide resolution.
2.9 Quality of reporting of SADEs
Following data extraction, the McHarm instrument was completed for each included
study35. The McHarm is an instrument/checklist that evaluates the quality of reporting of ADEs
in studies, systematic reviews, and meta-analyses. The instrument/checklist evaluates both the
quality of reporting of ADEs and the methodology used in the collection of ADEs data. The
checklist is comprised of 15 questions that are answered in the format of “yes”, “no”, or “unsure”
– with an overall score ranging from 0 to 15 points (higher scores signify better ADEs reporting).

40
Scores from the McHarm are normally provided as an integer (i.e. 8)35. However, for the current
study, scores from the McHarm were reported as a percentage instead of an integer. This
adaptation was necessary due to the diversity of studies included in the current meta-analytic
review. For instance, question 12 of the McHarm: “Was the NUMBER of participants that
withdrew or were lost to follow-up specified for each study group?” was not applicable to studies
that employed a retrospective design (i.e. examined previously recorded patient charts). These
studies were therefore provided a McHarm score out of 14, instead of the possible 15 for other
studies. To accommodate for these studies, a percentage either out of 14, or 15 was used for each
study’s McHarm score.
A second reviewer was also involved in the assessment with the McHarm. Both
reviewers attended a training session with Dr. Andrea Furlan. After both reviewers had an
understanding of the McHarm instrument, and consensus was reached on McHarm exercises, the
reviewers scored each study independently. After each reviewer completed 10 studies throughout
the scoring process, the reviewers randomly selected 5 and compared their scores. If the scores
were identical then another 10 studies were assessed using the McHarm. If there were
disagreements, resolution was reached, either through conversation between the reviewers, or if
necessary, through mediation with a third reviewer.
As previously discussed in the introduction, in the “Rationale of McHarm” subsection,
the McHarm is considered highly reliable and valid, especially when used to assess
pharmacological interventions (i.e. opioids)35.
2.10 Risk of bias
Risk of bias was assessed using a comprehensive risk of bias guideline constructed by
Furlan et al. (2015)37. The risk of bias guideline is comprised of numerous risk of bias

41
assessment tools, including: Cochrane, Downs & Black, Sign Methodology Checklist 3: Cohort
Studies, McHarm, Newcastle-Ottawa, and Jill Hayden’s prognosis tool. This risk of bias
instrument assesses five major forms of risk of bias, including: selection bias, performance bias,
measurement bias, attrition bias, and confounding bias. The type of bias examined is contingent
on the design of the study being assessed. This is due to certain biases being more likely to
occur, or incapable of occurring in specific study designs. To be more specific, selection bias,
performance bias, measurement bias, and attrition bias were assessed for all RCTs. For
controlled observational studies, selection bias, measurement bias, attrition bias, and
confounding bias were measured. Finally, for non-controlled observational studies, only
measurement bias was assessed37.
The risk of bias guideline used in the current meta-analytic review is comprised of risk of
bias tools that have repeatedly demonstrated excellent validity and reliability, and therefore
Furlan et al. (2015) risk of bias guideline is considered to have high validity and reliability.
However, to further ensure both reliability and validity, a second reviewer also assessed risk of
bias37.
To ensure reliability and accuracy of risk of bias assessment, a second reviewer also
assessed risk of bias. The two reviewers participated in training sessions with Dr. Andrea Furlan.
After each reviewer completed 10 studies throughout the assessment process, the
reviewers randomly selected 5 and compared their scores. If the risk of bias assessments were
identical then another 10 studies were assessed and the process was repeated. However, if
disagreement arose between the reviewers on a risk of bias measure, the two reviewers discussed
the disagreement and each provided their rationale. If consensus was reached then the agreed
42
upon risk of bias outcome was used. However, if disagreement persisted, a third reviewer was
consulted for consensus.
After all included studies were assessed using the risk of bias guideline, both reviewers
interpreted the results using a table and flow chart, which were also constructed by Furlan et al.
(2015)37 (see Appendix A for the table and Appendix B for the flow chart). Furlan et al.’s
(2015)37 guideline for interpreting risk of bias was also created from the same risk of bias
materials used for their guideline for assessing risk of bias. The table ranks the questions used to
assess risk of bias with a rank, ranging from 1 to 3 (1 is important, 2 is more important, and 3 is
very important). Using the ranking criterion established in the risk of bias table, the flow chart
was followed to determine a study’s risk of bias. The overall theme of the flow chart follows that
higher ranked/more important questions have more of an influence in determining if risk of bias
is present in a study37.
2.11 Event rates
The event rate for each outcome of interest was determined in each study. To do so, the
number of participants prescribed opioids with CNCP that experienced either misuse, abuse,
addiction, overdose, and/or death were divided by the total number of CNCP patients prescribed
opioids (some studies included separate samples, one of which included CNCP patients and the
other with cancer patients with chronic pain). In studies that included multiple study-groups of
interest, separate event rates were calculated for each group and included in the analyses. As
discussed previously, if only a percentage was included in the study (i.e. not the number of
participants that experienced the SADE outcome), then estimation was used to determine the
number of participants that most closely approximated the percentage recorded in the study. Two
reviewers calculated the event rates for each study to ensure reliability and validity. If

43
disagreement occurred, consensus was reached through discussion, or if necessary, a third
reviewer was consulted.
If a study reported an event rate for more than one SADE of interest (i.e. misuse and
abuse), then the study was included in both analyses for which an event rate was extracted.
Therefore, although there were 90 included studies, the amount of event rates reported across all
five SADE outcomes (misuse, abuse, addiction, overdose, and death) could be greater than 90.
2.12 Synthesis of results
The current meta-analytic review used Comprehensive Meta-analysis Software
(CMA) to analyse data. CMA is a statistics software that is specifically designed for meta-
analyses and enables the user to conduct specific meta-analytic techniques, including meta-
regressions. CMA software also allows for analyses to be performed in either a fixed effects
model or a random effects model, sometimes referred to as a mixed effects model. The random
effects model was ultimately selected as it is better suited for the data and purported results from
the current meta-analytic review. The random effects model assumes that the studies/data
included in a meta-analysis and meta-regression are a random sample and do not include all
possible “levels” of studies/data available41. Although the current meta-analytic review has
exhaustively searched the literature on chronic pain and opioids, it must be acknowledged that
some studies may have not been retrieved. In addition, the inclusion criteria used for this meta-
analytic review were deliberately specific (the primary objective of this review was to examine
pain and long-term opioid use in chronic populations), and therefore, all “levels” of pain and
opioids (i.e. acute pain, nonconventional routes of opioid administration) were not included in
this review.
44
For each SADE (misuse, abuse, addiction, overdose, and death) outcome a meta-analysis
was conducted to determine the amount of heterogeneity of reported event rates between studies.
For each SADE outcome, two separate meta-analyses were planned to be conducted, which were
contingent on participant opioid exposure. Studies that included participants with opioid
exposure from 3- to 11- months were analysed together, and studies with participant opioid
exposure of 12- months or longer were included in a separate meta-analysis. This was informed
from extant literature that purports length of participant opioid exposure significantly influences
the event rates of the SADEs examined in the current meta-analytic review42. However, when the
moderator variable: length of participant opioid exposure was examined, studies for the SADE
outcomes (misuse, abuse, addiction, overdose, and death) were combined and analysed only
according to outcome (and not further divided contingent on length of opioid exposure). This
was to ensure that length of opioid exposure could be accurately assessed.
Heterogeneity between studies was assessed using the I2 statistic. I2 is traditionally used
in meta-analyses and it measures the percentage of total variation (heterogeneity) across studies
that is due to heterogeneity rather than chance (i.e. sampling error)43. Percentages of 25%
(I2=25), 50% (I2=50), and 75% (I2=75) represent low, medium, and high heterogeneity,
respectively43. The statistic is calculated using 100%x(Q-df)/Q, where Q is the Cochran’s
heterogeneity statistic, which is chi-squared distributed43. In the current meta-analytic review, if
an I2 value of 75% or greater was evidenced then subsequent meta-regressions were executed
using specified moderator variables, which were determined a priori, and include: quality of
reporting of SADE (McHarm score), active versus passive collection of SADEs, risk of bias,
study design, length of participant opioid exposure, and current or previous mental health
disorder(s) and SUD to examine whether one or more of the aforementioned moderator variables

45
explained the heterogeneity reported from I2. These variables were included as moderator
variables due to their purported significance in the SADEs (specifically misuse, abuse, addiction,
overdose, and death) of prescription opioids.
An R2 value and p-value were reported for each meta-regression conducted. The R2
statistic is a number that indicates the proportion of the variance in the dependent variable (event
rates of SADEs) that is predictable from the independent variable (moderator variable being
examined)44. An R2 value can either be low, medium, or high. More specifically, an R2 of 0-0.5
is considered low and represents a weak correlation between the dependent and independent
variable, an R2 of 0.51-0.74 is considered medium and represents a moderate correlation, and an
R2 value of 0.75-1 is considered high and represents a strong correlation44.
The reported p-value indicates whether a meta-regression is statistically significant (the
probability of obtaining a result equal to or more extreme than what was actually observed, when
the null hypothesis is true), and it is important to report as it is an independent measure from
R2 44. More specifically, a high R2 value may not represent a statistically significant p-value,
whereas a low R2 value may be statistically significant44. To determine whether a p-value is
statistically significant an alpha level (level of significance) must be established (a priori). The
most common alpha level in scientific literature is 0.05 (5%) and this alpha was used in the
current meta-analytic review as well44.
If a statistically significant p-value (0.05 or less) was reported for a meta-regression (a
continuous moderator variable (i.e. McHarm) was found to be statistically significant), then a
correlation coefficient was calculated to determine the impact and direction of impact that each
moderator variable had on reported SADE event rates 45. For categorical variables (i.e. risk of

46
bias), predicted event rate was used to compare 45the dichotomies of each categorical variable.
Predicted event rate determines the event rate that is expected within a given sample of studies.
Therefore, by comparing the predicted event rate for studies that are grouped in one dichotomy
of a categorical variable (i.e. risk of bias) to studies that are grouped in the other dichotomy (i.e.
no risk of bias) conclusions can be drawn regarding how a categorical variable influences event
rate. More specifically, the dichotomy of the categorical variable with the higher predicted event
rate results in higher expected event rates, and vice versa.
For each moderator variable, a multivariate analysis was planned to be used. A
multivariate analysis, compared to a univariate analysis, allows for multiple variables to be
analysed concurrently in one meta-regression. Multivariate analysis is the preferred approach as
it allows for more variables to be analysed, using fewer meta-regressions, which decreases the
chance of a type 1 error occurring (false positive – incorrect rejection of the null hypothesis)46.
To examine whether inferior (low) overall quality of reporting of SADEs and high risk of
bias resulted in inflated/higher event rates of SADEs (hypothesis #2), a correlation coefficient
and p-value were reported45. For risk of bias (a categorical variable), two correlation coefficients
were reported and compared to determine whether risk of bias resulted in higher or lower event
rates of SADEs, and vice versa45. However, for quality of reporting, one coefficient was reported
as it was measured using a continuous variable (McHarm score) and the direction (+ versus -)
was examined to determine the direction of the relationship (if higher McHarm scores result in
higher or lower event rates, and vice versa)45.
2.12.1 Additional analyses
Descriptive statistics were also utilized. More specifically, overall event rates were
reported on the five included SADE outcomes (misuse, abuse, addiction, overdose, and death).
47
Additionally, demographic data were reported and figures and graphs were utilized to represent
these data.
Cohen’s kappa coefficient was another statistical technique that was used in the current
meta-analytic review. This statistic measures inter-rater agreement between two individuals
when comparing a categorical variable, and Cohen’s kappa coefficient is generally thought to be
one of the more robust statistics due to its ability to account for agreement that may occur by
chance47. Therefore, concordance rates between the two reviewers on the risk of bias assessment
(categorical variable; either yes (presence of bias), or no (absence of bias)) were determined
using Cohen’s kappa coefficient. A coefficient of 0 to 0.5 is considered low inter-rater
agreement, 0.5 to 0.8 is considered moderate inter-rater agreement, and 0.8 to 1 is considered
higher inter-rater agreement47.
Concordance on the McHarm was measured using the Intraclass correlation coefficient.
This coefficient is used to measure concordance between two reviewers when comparing
quantitative measurement48. The coefficient is considered highly reliable and valid when
comparing quantitative data48, and is therefore suitable to assess concordance on the McHarm,
which is measured on a scale from 0 to 15, and 14 in the current meta-analytic review. Similar to
Cohen’s kappa coefficient, a coefficient of 0 to 0.5 is considered low inter-rater agreement, 0.5
to 0.8 is considered moderate inter-rater agreement, and 0.8 to 1 is considered higher inter-rater
agreement48.

48
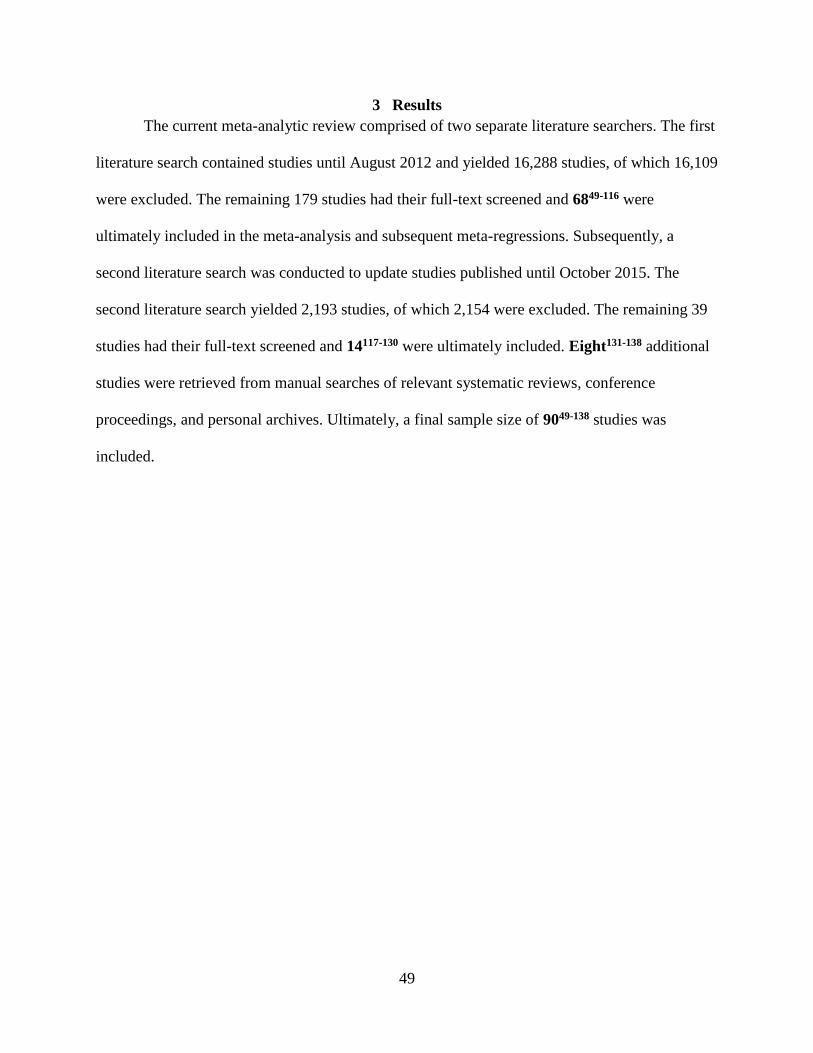
49
3 Results
The current meta-analytic review comprised of two separate literature searchers. The first
literature search contained studies until August 2012 and yielded 16,288 studies, of which 16,109
were excluded. The remaining 179 studies had their full-text screened and 6849-116 were
ultimately included in the meta-analysis and subsequent meta-regressions. Subsequently, a
second literature search was conducted to update studies published until October 2015. The
second literature search yielded 2,193 studies, of which 2,154 were excluded. The remaining 39
studies had their full-text screened and 14117-130 were ultimately included. Eight131-138 additional
studies were retrieved from manual searches of relevant systematic reviews, conference
proceedings, and personal archives. Ultimately, a final sample size of 9049-138 studies was
included.
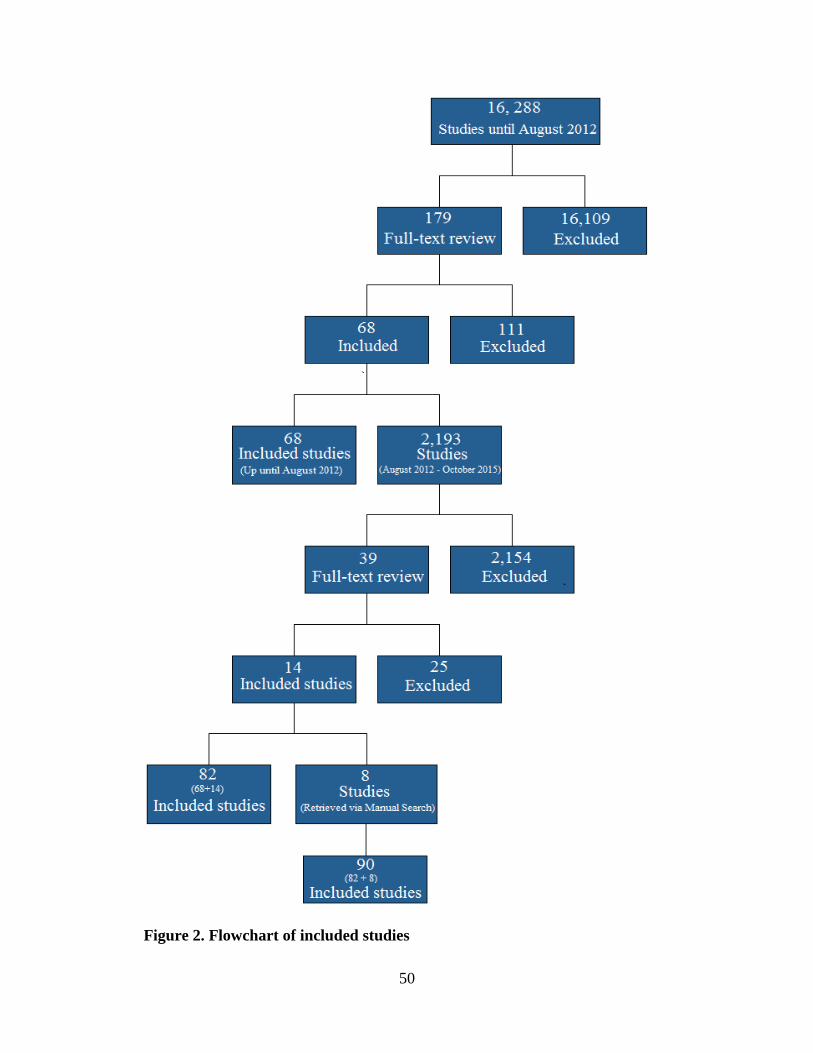
50
Figure 2. Flowchart of included studies
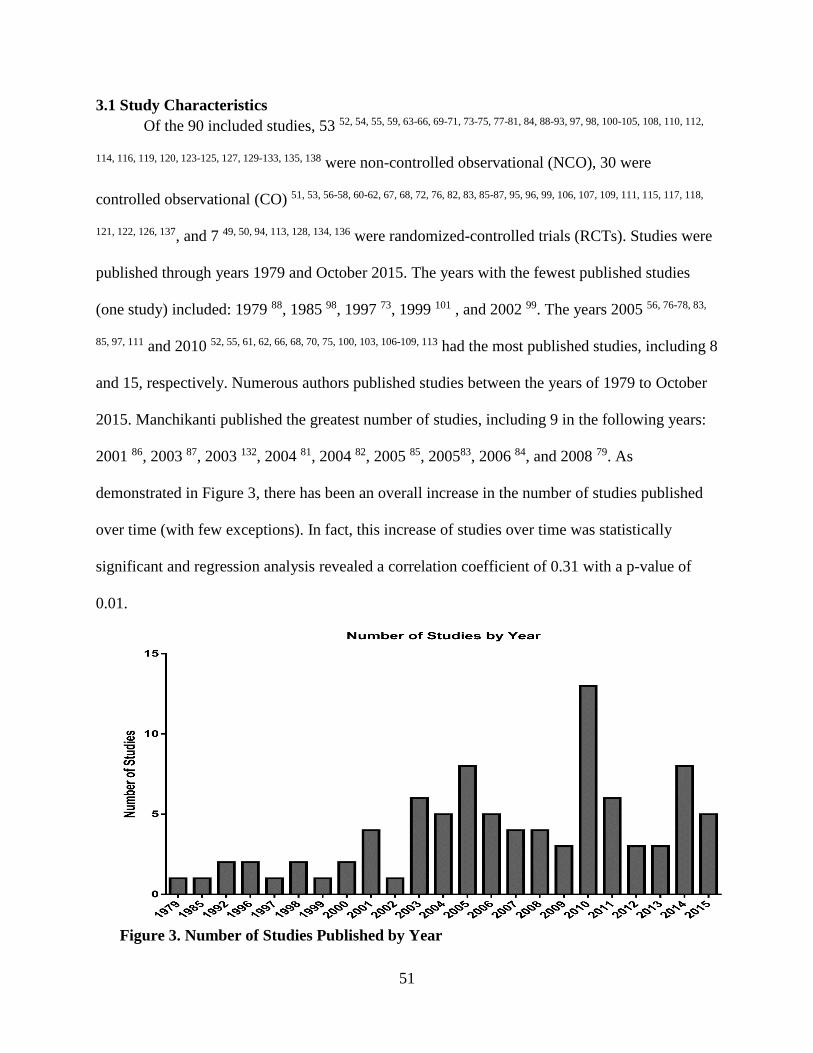
51
3.1 Study Characteristics
Of the 90 included studies, 53 52, 54, 55, 59, 63-66, 69-71, 73-75, 77-81, 84, 88-93, 97, 98, 100-105, 108, 110, 112,
114, 116, 119, 120, 123-125, 127, 129-133, 135, 138 were non-controlled observational (NCO), 30 were
controlled observational (CO) 51, 53, 56-58, 60-62, 67, 68, 72, 76, 82, 83, 85-87, 95, 96, 99, 106, 107, 109, 111, 115, 117, 118,
121, 122, 126, 137, and 7 49, 50, 94, 113, 128, 134, 136 were randomized-controlled trials (RCTs). Studies were
published through years 1979 and October 2015. The years with the fewest published studies
(one study) included: 1979 88, 1985 98, 1997 73, 1999 101 , and 2002 99. The years 2005 56, 76-78, 83,
85, 97, 111 and 2010 52, 55, 61, 62, 66, 68, 70, 75, 100, 103, 106-109, 113 had the most published studies, including 8
and 15, respectively. Numerous authors published studies between the years of 1979 to October
2015. Manchikanti published the greatest number of studies, including 9 in the following years:
2001 86, 2003 87, 2003 132, 2004 81, 2004 82, 2005 85, 200583, 2006 84, and 2008 79. As
demonstrated in Figure 3, there has been an overall increase in the number of studies published
over time (with few exceptions). In fact, this increase of studies over time was statistically
significant and regression analysis revealed a correlation coefficient of 0.31 with a p-value of
0.01.
Figure 3. Number of Studies Published by Year

52
Studies were retrieved from a wide variety of journals; Pain Medicine contained the most
published studies with 12 58, 59, 74, 92, 100, 104, 111, 112, 122-124, 137 . Seventy-four 49, 51-54, 56, 57, 61-67, 69-72,
74, 76, 77, 79-92, 94, 96-104, 106-109, 111-132, 135-137 studies were conducted in America, 11 50, 55, 58, 59, 68, 73, 78,
93, 105, 133, 138 in Europe, 4 60, 95, 110, 134 in Canada, and 1 75 in China (see Figure 2). Participant
races/ethnicities included: Caucasian, African American, Hispanic, Other, Native American,
Asian, Multiracial, Native Hawaiian/Pacific Islander, and Unknown. Data on participant
race/ethnicity was only available in 39 studies 49-53, 56, 57, 63, 64, 66, 67, 69-74, 79, 96, 97, 100, 104, 106, 108, 109,
113-115, 118, 120-123, 125, 127, 129, 130, 133, 137.
Participants had a mean age of 51.6 years, a median age of 50.6 years, with a standard
deviation (SD) 8 years, and ranged in age from 18 to 105 years. Data on age was only available
in 69 50-52, 54-56, 58-61, 64-78, 80-85, 87, 90-98, 100, 102-106, 108-110, 115, 116, 119-126, 128-130, 133-138 studies, and 21 49,
53, 57, 62, 63, 79, 86, 88, 89, 99, 101, 107, 111-114, 117, 118, 127, 131, 132 did not contain mean age of participants and
Figure 4. Number of Studies by Country
53
32 51, 52, 55, 63, 66, 72, 74-76, 82, 84, 86-89, 94, 95, 99, 104-106, 109-112, 116, 119, 128, 131-133, 135 did not contain
information on range of age of participants. Overall, there was a mean of 41.4% of participants
that were male. There was wide variability between studies, which ranged from sample sizes of
95% male to 16% male. Fourteen studies 62, 63, 65, 75, 79, 82, 88, 89, 98, 99, 101, 112, 113, 131 did not include
information on participant sex.
Funding sources were disclosed for 5849-54, 56, 59, 61-65, 67, 68, 70, 72-74, 76, 80-85, 87, 94, 96, 97, 100, 102,
104, 106-109, 113-130, 133, 134, 137 studies. Additionally, 4649-51, 53, 54, 56, 59, 61, 62, 64, 65, 67, 68, 72, 74, 76, 80-82, 84, 85,
89, 94, 96, 97, 100, 102, 105-107, 109, 113, 115, 117-122, 124-129, 137 studies contained a conflict of interest
statement, and among these, 9 49, 106, 113, 120, 122, 123, 125, 127, 137 studies were deemed to have conflict
of interest, which was a decision made from both reviewers based on pre-specified criteria,
created a priori. The total sample size across all 90 studies was 2467,677, with a mean sample
size across studies was 27,418, median of 198.5 and a SD of 117,728, which ranged from a
sample size of 20 to a sample size of 840,606 people. Participants had numerous chronic pain
diagnoses/conditions, including: neuropathic pain, osteoarthritis, rheumatoid arthritis, chronic
neck pain, chronic back pain, sacroiliac joint dysfunction, chronic headaches, irritable bowel
syndrome, fibromyalgia, degenerative disc disease, inflammatory bowel disease, lumbar spinal
stenosis, and chronic fatigue syndrome.
Studies had a mean length of opioid exposure of 11.68 months; 52 50, 54-56, 58, 62-66, 70, 73-76,
78, 80, 82-86, 90-92, 95, 97-99, 101, 105, 106, 108, 114-116, 118-123, 125, 127, 128, 130, 134, 135, 137, 138 studies with
participant opioid exposure between 3- to 11- months and 38 49, 51-53, 57, 59-61, 67, 69, 71, 72, 77, 79, 81, 86,
88, 89, 93, 94, 96, 100, 102-104, 107, 109-113, 117, 124, 126, 129, 131-133, 136 studies with participant opioid exposure of
12- months or longer. Sixty-nine studies employed active collection of selected adverse drug
events (SADEs) (participants are asked about the occurrence of specific SADEs in structured

54
questionnaires or interviews at pre-specified intervals, question number 5 of the McHarm),
whereas 21 studies employed a passive approach to the collection of SADEs (participants report
SADEs on their own initiative and are not probed with active ascertainment, question number 6
of the McHarm). Compared to NCO and CO studies, RCTs were much more likely to employ
active collection of SADEs, with only one RCT using a passive approach to the collection of
SADEs.
3.2 McHarm
The McHarm instrument is comprised of 15 questions, fifty-four 52, 54, 57, 60, 61, 63, 65, 66, 69-74,
76, 78-81, 84, 85, 87-92, 95, 98, 101, 103, 105-107, 111, 114-121, 123-127, 129, 130, 135, 137 studies were marked out of 14
due to question 12 of the McHarm (Was the NUMBER of participants that withdrew or were lost
to follow-up specified for each study group?) not being applicable. More specifically, these 54 52,
54, 57, 60, 61, 63, 65, 66, 69-74, 76, 78-81, 84, 85, 87-92, 95, 98, 101, 103, 105-107, 111, 114-121, 123-127, 129, 130, 135, 137 studies
were retrospective in nature and therefore do not contain participant withdrawals. The remaining
36 49-51, 53, 55, 56, 58, 59, 62, 64, 67, 68, 75, 77, 82, 86, 93, 94, 96, 97, 99, 100, 102, 104, 108-110, 112, 113, 122, 128, 131, 133, 134, 136,
138 studies were marked out of the full 15 questions on the McHarm instrument. To accommodate
for these differences, a percentage either out of 14 or 15 was used for each primary study’s
McHarm score.
Studies had a mean McHarm score of 57%, a SD of 9.5%, and ranged from the highest
McHarm score of 80% (12 out of 15), which was a RCT, to the lowest score of 28.6% (4 out of
14), which was a NCO. Questions 2 (Were SERIOUS events precisely defined?) and 3 (Were
SEVERE events precisely defined?) were most problematic across studies with only 10 studies
receiving a “yes” for question 2, and 4 studies receiving a “yes” for question 3. Conversely,
question 14 of the McHarm (Did the author(s) specify the NUMBER for each TYPE of harmful

55
event for each study group?) was least problematic with all studies receiving a “yes” on this
question. Overall, RCTs had a mean McHarm score of 66%, compared to CO and NCO studies,
which had a mean McHarm score of 56%.
3.3 Risk of bias
Risk of bias assessment showed that 71.4% (5 out of 7) RCTs were at risk for
performance bias, 34.4% (31 out of 90) of studies were at risk for measurement bias, 40.5%
(15 out of 37) were at risk for selection bias, 8.1% (3 out of 37) were at risk for attrition bias,
and 90% (27 out of 30) were at risk for confounding bias.
Measurement bias was the only form of bias measured across all three (RCT, CO, NCO)
study designs, and when compared to RCTs, NCO and CO studies had a much higher risk for
measurement bias. More specifically, 36.1% (30 out of 83) of NCO and CO studies were at risk
of measurement bias, whereas 14.3% (1 out of 7) RCTs were at risk for measurement bias.
Figure 5. Distribution of McHarm scores across all 90 included studies

56
3.4 Meta-analyses and meta-regressions: All studies
Across all 90 included studies, the McHarm had an inverse relationship with all five
(misuse, abuse, addiction, overdose, and death) SADEs of -0.003 and a p-value of 0.99.
Moreover, studies that were at risk of performance bias had a predicted event rate of 0.15 and a
p-value of 0.44, whereas studies that were not at risk of performance bias had a predicted event
rate of 0.01 and a p-value of 0.44. Studies that were at risk of selection bias had a predicted
event rate of 0.24 and a p-value of 0.43, whereas studies that were not at risk of selection bias
had a predicted event rate of 0.18 and a p-value of 0.43. Studies that were at risk of
measurement bias had a predicted event rate of 0.18 and a p-value of 0.68, whereas studies that
were not at risk of measurement bias had a predicted event rate of 0.19 and a p-value of 0.68.
Studies that were at risk of attrition bias had a predicted event rate of 0.02 and a statistically
significant p-value of 0.004, whereas studies that were not at risk of attrition bias had a
predicted event rate of 0.29 and a p-value of 0.004. Studies that were at risk of confounding bias
had a predicted event rate of 0.26 and a p-value of 0.7, whereas studies that were not at risk of
confounding bias had a predicted event rate of 0.22 and a p-value of 0.7.
Below are graphs for each type of risk of bias. The graphs demonstrate overall observed
weighted event rate for all SADE outcomes for studies with risk of bias versus studies without
risk of bias. These graphs illustrate the predicted event rates reported above. More specifically,
types of bias that contain greater predicted event rates for studies at risk contain higher observed
event rates (evidenced via taller bars in the graphs) compared to studies not at risk, and vice
versa.

57
Figure 6. Weighted event rate by selection bias
Figure 7. Weighted event rate by measurement bias
Figure 8. Weighted event rate by attrition bias
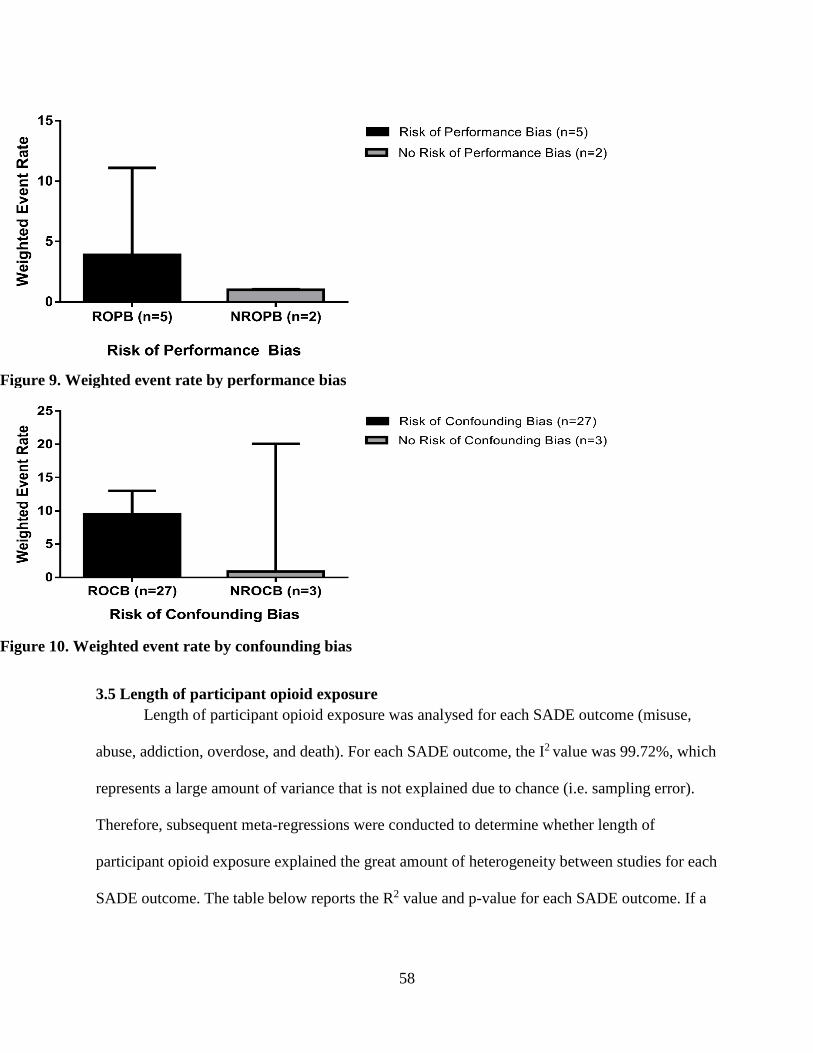
58
3.5 Length of participant opioid exposure
Length of participant opioid exposure was analysed for each SADE outcome (misuse,
abuse, addiction, overdose, and death). For each SADE outcome, the I2 value was 99.72%, which
represents a large amount of variance that is not explained due to chance (i.e. sampling error).
Therefore, subsequent meta-regressions were conducted to determine whether length of
participant opioid exposure explained the great amount of heterogeneity between studies for each
SADE outcome. The table below reports the R2 value and p-value for each SADE outcome. If a
Figure 9. Weighted event rate by performance bias
Figure 10. Weighted event rate by confounding bias

59
statistically significant p-value was reported for any of the SADE outcomes, the correlation
coefficient (with its p-value) is reported underneath the table.
Table 2. Length of participant opioid exposure: R² and p-value for each SADE outcome
SADE outcome R2 p-value
Misuse: 0.05 0.8
Abuse: 0.10 0.05
Addiction: 0 0.5
Overdose: 0.09 0.11
Death: 0.49 0.04
Length of participant opioid exposure was found to be a statistically significant
moderator variable for abuse and death, with a p-value of 0.05 and 0.004, respectively. Further
regression analysis revealed that the coefficient for abuse was 0.28 with a p-value of 0.05, and
the coefficient for death was 0.24 with a p-value of 0.04.
The remaining moderator variables examined: study design, current or previous mental
health disorder, current or previous substance use disorder (SUD), active versus passive
collection of SADEs, McHarm, performance bias, measurement bias, selection bias, attritions
bias, and confounding bias studies were separated into specific SADE outcomes (misuse, abuse,
addiction, overdose, and death) and further divided by length of participant opioid exposure.
More specifically, studies that contained participant opioid exposure ranging from 3- to 11-

60
months were grouped together, conversely, studies with participant opioid exposure of 12-
months or longer were grouped.
3.6 Distribution of studies
Of the 90 included studies, 41 51, 52, 55-57, 66, 69-74, 77, 81-83, 85, 89-91, 94, 100, 102, 104, 105, 107, 109, 111,
112, 118-120, 122-125, 127, 128, 130, 134, 136 contained a misuse outcome, 28 49, 54, 62-64, 67, 75, 76, 80, 84, 86-88, 92, 97,
99, 100, 103, 108-110, 114-117, 131, 132contained an abuse outcome, 9 54, 59, 60, 68, 95, 101, 103, 112, 135contained an
addiction outcome, 13 53, 58, 61, 65, 96, 98, 113, 121, 126, 129, 133, 137, 138 contained an overdose outcome, and
11 50, 61, 78, 79, 93, 96, 106, 113, 133, 137, 138contained a death outcome. Overall, there were 102 reported
outcomes and 12 studies contained two reported SADE outcomes of interest. Subsequent meta-
analyses and regressions are reported below. In addition, a figure is provided below that depicts
the overall weighted event rate by adverse drug event outcome and length of participant opioid
exposure. This graph is explored in further detail below.
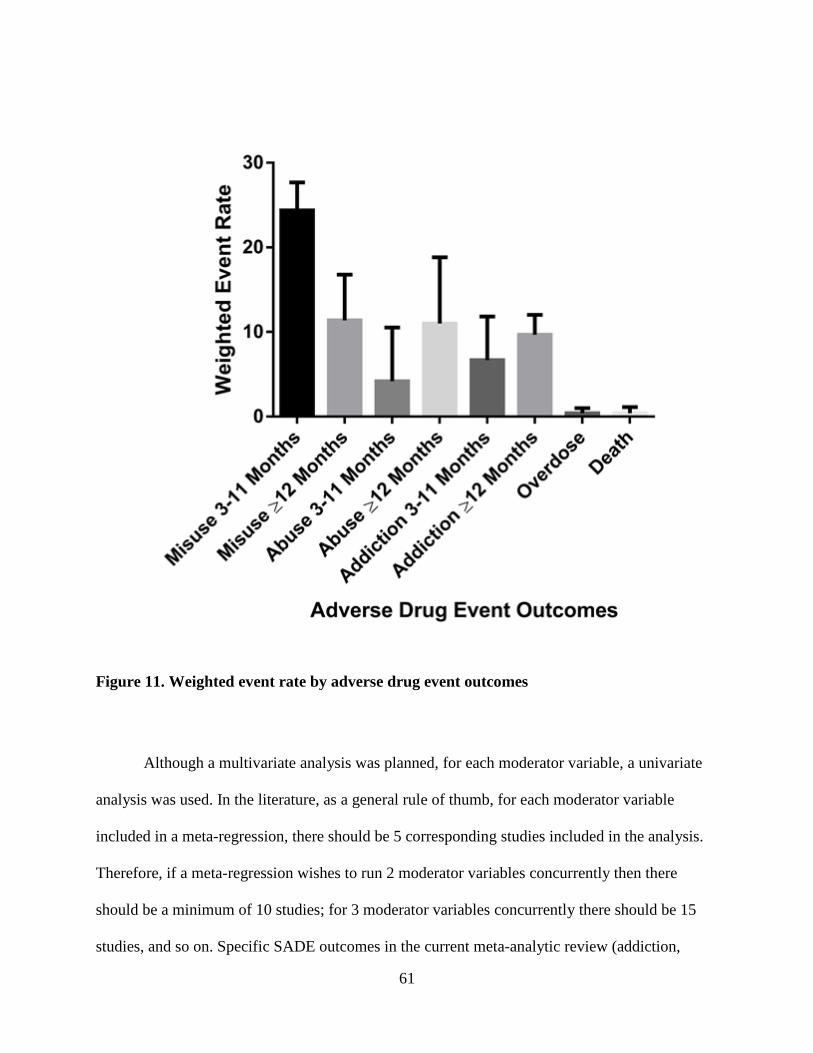
61
Figure 11. Weighted event rate by adverse drug event outcomes
Although a multivariate analysis was planned, for each moderator variable, a univariate
analysis was used. In the literature, as a general rule of thumb, for each moderator variable
included in a meta-regression, there should be 5 corresponding studies included in the analysis.
Therefore, if a meta-regression wishes to run 2 moderator variables concurrently then there
should be a minimum of 10 studies; for 3 moderator variables concurrently there should be 15
studies, and so on. Specific SADE outcomes in the current meta-analytic review (addiction,

62
overdose, and death) could not support more than one moderator variable analysed at a time.
Therefore, to ensure consistency across outcomes, and to allow for cross-outcome comparisons,
a univariate approach was utilized and each moderator variable was examined in a separate meta-
regression.
3.7 Misuse
Overall, there were 41 42, 43, 46-48, 57, 60-65, 68, 72-74, 76, 80-82, 85, 91, 93, 95, 96, 98, 100, 102, 103, 109-111, 113-
116, 118, 119, 121, 125, 12 studies that contained a misuse outcome. Twenty-three 51, 55, 56, 66, 70, 73, 74, 82, 83,
85, 90, 91, 105, 118-120, 122, 123, 125, 127, 128, 130, 134 contained participants that were exposed to opioids for a
length of between 3- to 11- months and 18 52, 57, 69, 71, 72, 77, 81, 89, 94, 100, 102, 104, 107, 109, 111, 112, 124, 136
contained participants with opioid exposure of 12- months or longer. For the current meta-
analytic review, misuse was defined as: use of an opioid in ways other than those intended by the
prescribing physician39. However, there was a lot of heterogeneity between studies on which
misuse behaviours were examined, which included: negative urine drug screenings,
administration of prescription opioid in ways other than prescribed (i.e. snorting), problematic
opioid use (either using more than prescribed, or less), and obtaining more of the prescribed
opioid from other physicians (sometimes referred to as “double doctoring”).
3.7.1 Participant opioid exposure of 3- to 11- months
The weighted event rate of misuse was 24.4%, with a standard error of mean (SEM) of
3.3, and a confidence interval of 14.2% to 38.6%. The lowest reported event rate of misuse
across studies was 0.1% and the highest was 71.4%. The meta-analysis had a p-value of 0.001,
and an I2 value of 99.63%. Due to the great amount of heterogeneity evidenced from the I2 value,
subsequent meta-regression were conducted with specific moderator variables in an attempt to
explain the heterogeneity. The table below contains each examined moderator variable, the

63
amount of variance explained from the variable (R2), and whether the variance explained is
statistically significant (p-value).
Table 3. Misuse 3- to 11- months: R² and p-value for each moderator variable
Variable R2 p-value
Study design (n=23): 0 0.39
Current or previous mental
health diagnosis (n=23):
0 0.67
Current or previous SUD
(n=23):
0 0.82
Active versus Passive collection
of SADEs (n=23):
0.18 0.008
McHarm (n=23): 0 0.50
Performance bias (n=2): 0.68 0.02
Measurement bias: Insufficient data Insufficient data
Selection bias (n=8): 0.68 0.02
Attrition bias: Insufficient data Insufficient data
Confounding bias: Insufficient data Insufficient data

64
Active versus passive collection of SADEs, performance bias and selection bias were
statistically significant moderator variables for misuse with participant opioid exposure from 3-
to 11- months. Further regression analysis revealed that active collection of SADEs had a
predicted event rate of 0.32 and a p-value of 0.008, whereas passive collection of SADEs has a
predicted event rate of 0.18 and a p-value of 0.008, risk of performance bias had a predicted
event rate of 0.42 and a p-value of 0.02, whereas studies that were not at risk for performance
bias had a predicted event rate of 0.01 and a p-value of 0.02, and risk of selection bias had a
predicted event rate of 0.42 and a p-value of 0.02, whereas studies that were not at risk for
performance bias had a predicted event rate of 0.3 and a p-value of 0.02.
3.7.2 Participant opioid exposure of 12- months or longer
The weighted event rate of misuse in studies with participant opioid exposure of 12-
months or longer was 11.4%, with a SEM of 5.4, and a confidence interval of 8.1% to 15.8%.
The lowest reported event rate across studies was 0.9% and the highest was 98.8%. The meta-
analysis had a p-value of 0, and an I2 value of 98.15. Due to the great amount of heterogeneity
evidenced from the I2 value, subsequent meta-regression were conducted with specific moderator
variables in an attempt to explain the heterogeneity.
Table 4. Misuse 12- months or longer: R² and p-value for each moderator variable
Variable R2 p-value
Study design (n=18): 0 0.12
Current or previous mental
health diagnosis (n=18):
0.08 0.07

65
Current or previous SUD
(n=18):
0 0.87
Active versus Passive collection
of SADEs (n=18):
0.16 0.03
McHarm (n=18): 0 0.9
Performance bias: Insufficient data Insufficient data
Measurement bias (n=18): 0.16 0.03
Selection bias (n=7): 0 0.23
Attrition bias: Insufficient data Insufficient data
Confounding bias (n=6): 0.23 0.05
Active versus passive collection of SADEs, measurement bias, and confounding bias
were statistically significant moderator variables for misuse with participant opioid exposure of
12- months and longer. Further regression analysis revealed that active collection of SADEs had
a predicted event rate of 0.22 and a p-value of 0.03, whereas passive collection of SADEs had a
predicted event rate of 0.05 and a p-value of 0.03, risk of measurement bias had a predicted event
rate of 0.06 and a p-value of 0.03, whereas studies that were not at risk of measurement bias had
a predicted event rate of 0.24 and a p-value of 0.03, and risk of confounding bias had a predicted
event rate of 0.2 and a p-value of 0.05, and studies that were not at risk for confounding bias had
a predicted event rate of 0.66 and a p-value of 0.05.

66
3.8 Abuse
Overall, there were 28 49, 54, 62-64, 67, 75, 76, 80, 84, 86-88, 92, 97, 99, 100, 103, 108-110, 114-117, 131, 132studies
that contained an abuse outcome. Seventeen 54, 62-64, 75, 76, 80, 84, 86, 92, 97, 99, 108, 114-116contained
participants that were exposed to opioids for a length of between 3- to 11- months and 11 49, 67, 86-
88, 100, 103, 109, 110, 117, 131 contained participants with opioid exposure of 12 months or longer. For
the current meta-analytic review, abuse was defined as: the intentional self-administration of a
medication for a non-medical purpose such as altering one’s state of consciousness (i.e. getting
high)40. However, there was heterogeneity between studies on which abuse behaviours were
examined, which included: the use of an opioid to alter one’s state of consciousness, taking a
prescribed opioid for reasons other than prescribed (pain), and continuing to use an opioid
despite relief of pain symptoms or ineffectiveness.
3.8.1 Participant opioid exposure of 3- to 11- months
The weighted event rate of abuse in studies with participant opioid exposure of 3- to 11-
months was 4.2%, with a SEM of 6.33, and a confidence interval of 4% to 4.4%. The lowest
reported event rate across studies was 0.5% and the highest was 90%. The meta-analysis had a p-
value of 0, and an I2 value of 98.94. Due to the great amount of heterogeneity evidenced from the
I2 value, subsequent meta-regression were conducted with specific moderator variables in an
attempt to explain the heterogeneity.
Table 5. Abuse 3- to 11- months: R² and p-value for each moderator variable
Variable R2 p-value
Study design (n=17): 0 0.48

67
Current or previous mental
health diagnosis (n=17):
0 0.56
Current or previous SUD
(n=17):
0 0.33
Active versus Passive collection
of SADEs (n=17):
0.01 0.21
McHarm (n=17): 0.05 0.15
Performance bias: Insufficient data Insufficient data
Measurement bias (n=17): 0.15 0.05
Selection bias (n=4): 0.04 0.33
Attrition bias: Insufficient data Insufficient data
Confounding bias: Insufficient data Insufficient data
Measurement bias was a significant moderator variable for abuse in participants with
opioid exposure of 3- to 11- months. Further regression analysis revealed that risk of
measurement bias had a predicted event rate of 0.35 and a p-value of 0.05, whereas studies that
were not at risk for measurement bias had a predicted event rate of 0.14 and a p-value of 0.05.
3.8.2 Participant opioid exposure of 12- months or longer
The weighted event rate of abuse in studies with participant opioid exposure of 12-
months or longer was 11%, with a SEM of 7.84, and a confidence interval of 2.4% to 39%. The

68
lowest reported event rate across studies was 0.1% and the highest was 94%. The meta-analysis
had a p-value of 0.013, and an I2 value of 99.82. Due to the great amount of heterogeneity
evidenced from the I2 value, subsequent meta-regression were conducted with specific moderator
variables in an attempt to explain the heterogeneity.
Table 6. Abuse 12- months or longer: R² and p-value for each moderator variable
Variable R2 p-value
Study design (n=11): 0 0.59
Current or previous mental
health diagnosis (n=11):
0 0.85
Current or previous SUD
(n=11):
0 0.85
Active versus Passive collection
of SADEs (n=11):
0 0.55
McHarm (n=11): 0 0.84
Performance bias: Insufficient data Insufficient data
Measurement bias (n=11): 0 0.1
Selection bias (n=6): 0 0.86
Attrition bias: Insufficient data Insufficient data
Confounding bias (n=5): 0.43 0.03
69
Confounding bias was a significant moderator variable for abuse in participants with
opioid exposure 12- months and longer. Further regression analysis revealed that risk of
confounding bias had a predicted event rate of 0.26 and a p-value of 0.03, whereas studies that
were not at risk of bias had a predicted event rate of 0.001 and a p-value of 0.03.
3.9 Addiction
Overall, there were 9 54, 59, 60, 68, 95, 101, 103, 112, 135 studies that contained addiction outcome.
Four 54, 95, 101, 135 contained participants that were exposed to opioids for a length of between 3- to
11- months and 5 50, 59, 60, 103, 112 contained participants with opioid exposure of 12- months or
longer. For the current meta-analytic review, addiction was defined as: diagnosed via DSM-V (or
comparable diagnostic assessments (i.e. International Statistical Classification of Diseases and
Related Health Problems (ICD)) and characterized by behaviours that include one or more of the
following: impaired control over drug use, compulsive use, continued use despite harm, and
craving40. There was not much heterogeneity in how addiction was operationalized and all
studies either used a current or previous version of DSM or ICD-9-CM.
3.9.1 Participant opioid exposure of 3- to 11- months
The weighted event rate of addiction in studies with participant opioid exposure of 3- to
11- months was 6.7%, with a SEM of 5.14, and a confidence interval of 2.3% to 17.7%. The
lowest reported event rate across studies was 1.2% and the highest was 23.7%. The meta-
analysis had a p-value of 0, and an I2 value of 86.78%. Due to the great amount of heterogeneity
evidenced from the I2 value, subsequent meta-regression were conducted with specific moderator
variables in an attempt to explain the heterogeneity.

70
Table 7. Addiction 3- to 11- months: R² and p-value for each moderator variable
Variable R2 p-value
Study design (n=4): 0 0.55
Current or previous mental
health diagnosis (n=4):
0.24 0.18
Current or previous SUD (n=4): 0 0.80
Active versus Passive collection
of SADEs (n=4):
0.60 0.04
McHarm (n=4): 0.56 0.05
Performance bias: Insufficient data Insufficient data
Measurement bias: Insufficient data Insufficient data
Selection bias: Insufficient data Insufficient data
Attrition bias: Insufficient data Insufficient data
Confounding bias: Insufficient data Insufficient data
Active versus passive collection of SADEs and McHarm were significant moderator
variables for addiction in participants with opioid exposure from 3- to 11- months. Further
regression analysis revealed that active collection of SADEs had a predicted event rate of 0.24
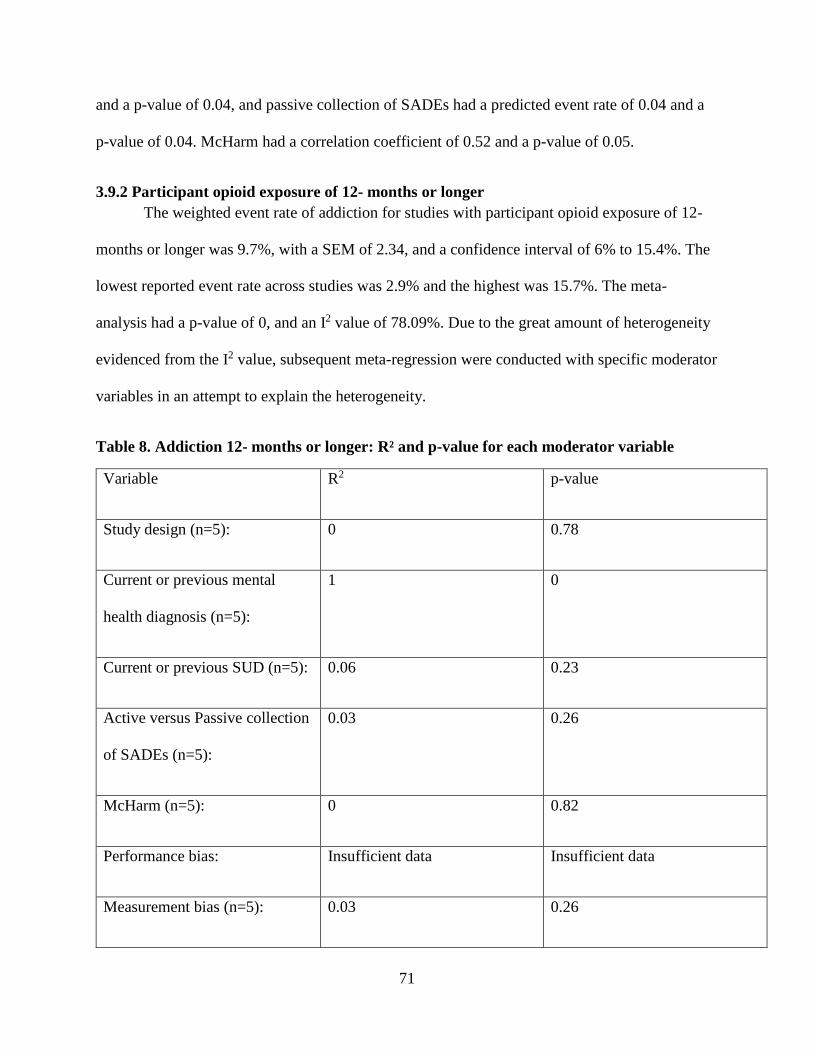
71
and a p-value of 0.04, and passive collection of SADEs had a predicted event rate of 0.04 and a
p-value of 0.04. McHarm had a correlation coefficient of 0.52 and a p-value of 0.05.
3.9.2 Participant opioid exposure of 12- months or longer
The weighted event rate of addiction for studies with participant opioid exposure of 12-
months or longer was 9.7%, with a SEM of 2.34, and a confidence interval of 6% to 15.4%. The
lowest reported event rate across studies was 2.9% and the highest was 15.7%. The meta-
analysis had a p-value of 0, and an I2 value of 78.09%. Due to the great amount of heterogeneity
evidenced from the I2 value, subsequent meta-regression were conducted with specific moderator
variables in an attempt to explain the heterogeneity.
Table 8. Addiction 12- months or longer: R² and p-value for each moderator variable
Variable R2 p-value
Study design (n=5): 0 0.78
Current or previous mental
health diagnosis (n=5):
1 0
Current or previous SUD (n=5): 0.06 0.23
Active versus Passive collection
of SADEs (n=5):
0.03 0.26
McHarm (n=5): 0 0.82
Performance bias: Insufficient data Insufficient data
Measurement bias (n=5): 0.03 0.26

72
Selection bias: Insufficient data Insufficient data
Attrition bias: Insufficient data Insufficient data
Confounding bias: Insufficient data Insufficient data
3.10 Overdose
Studies for overdose and death were not separated by length of participant opioid
exposure due to an insufficient number of studies with participant exposure from 3- to 11-
months. Therefore, studies were analysed in one group, and one meta-analysis was performed for
all studies that examined overdose and one for all studies that examined death.
Overall, there were 13 53, 58, 61, 65, 96, 98, 113, 121, 126, 129, 133, 137, 138 studies that contained
overdose outcome. For the current meta-analytic review, overdose was defined as: respiratory
depression characterized by fatal or non-fatal overdose, both intentional and accidental40.
The weighted event rate of overdose was 0.4%, with a SEM of 0.62, and a confidence
interval of 0.1% to 1.2%. The lowest reported event rate across studies was 0% and the highest
was 10%. The meta-analysis had a p-value of 0, and an I2 value of 99.9. Due to the great amount
of heterogeneity evidenced from the I2 value, subsequent meta-regression were conducted with
specific moderator variables in an attempt to explain the heterogeneity.
Table 9. Overdose: R² and p-value for each moderator variable
Variable R2 p-value
Study design (n=13): 0 0.24

73
Current or previous mental
health diagnosis (n=13):
0 0.61
Current or previous SUD
(n=13):
0 0.98
Active versus Passive collection
of SADEs (n=13):
0 0.76
McHarm (n=13): 0 0.71
Performance bias: Insufficient data Insufficient data
Measurement bias (n=13): 0.01 0.37
Selection bias (n=7): 0.59 0.001
Attrition bias (n=7): 0 0.65
Confounding bias (n=7): 0.02 0.28
Selection bias was the only statistically significant moderator variable for overdose.
Further regression analysis revealed that risk of selection bias had a predicted event rate of 0.06
and a p-value of 0.001, whereas studies that were not at risk of selection bias had a predicted
event rate of 0.002 and a p-value of 0.001.
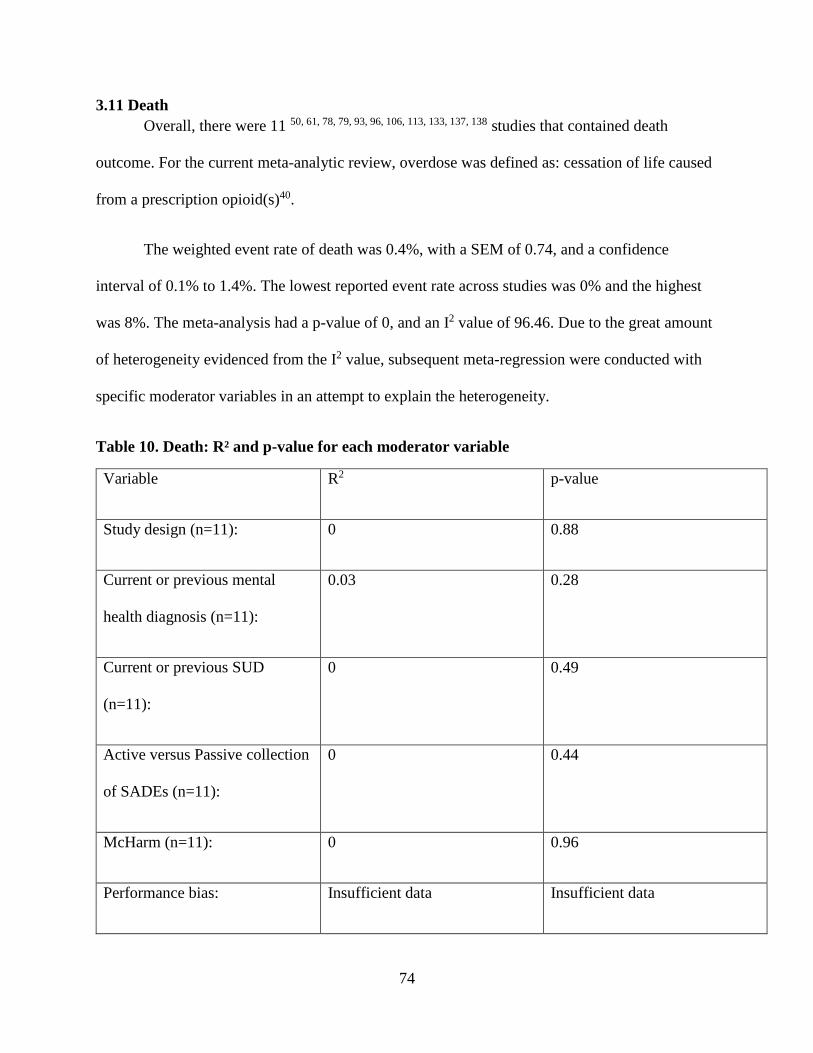
74
3.11 Death
Overall, there were 11 50, 61, 78, 79, 93, 96, 106, 113, 133, 137, 138 studies that contained death
outcome. For the current meta-analytic review, overdose was defined as: cessation of life caused
from a prescription opioid(s)40.
The weighted event rate of death was 0.4%, with a SEM of 0.74, and a confidence
interval of 0.1% to 1.4%. The lowest reported event rate across studies was 0% and the highest
was 8%. The meta-analysis had a p-value of 0, and an I2 value of 96.46. Due to the great amount
of heterogeneity evidenced from the I2 value, subsequent meta-regression were conducted with
specific moderator variables in an attempt to explain the heterogeneity.
Table 10. Death: R² and p-value for each moderator variable
Variable R2 p-value
Study design (n=11): 0 0.88
Current or previous mental
health diagnosis (n=11):
0.03 0.28
Current or previous SUD
(n=11):
0 0.49
Active versus Passive collection
of SADEs (n=11):
0 0.44
McHarm (n=11): 0 0.96
Performance bias: Insufficient data Insufficient data
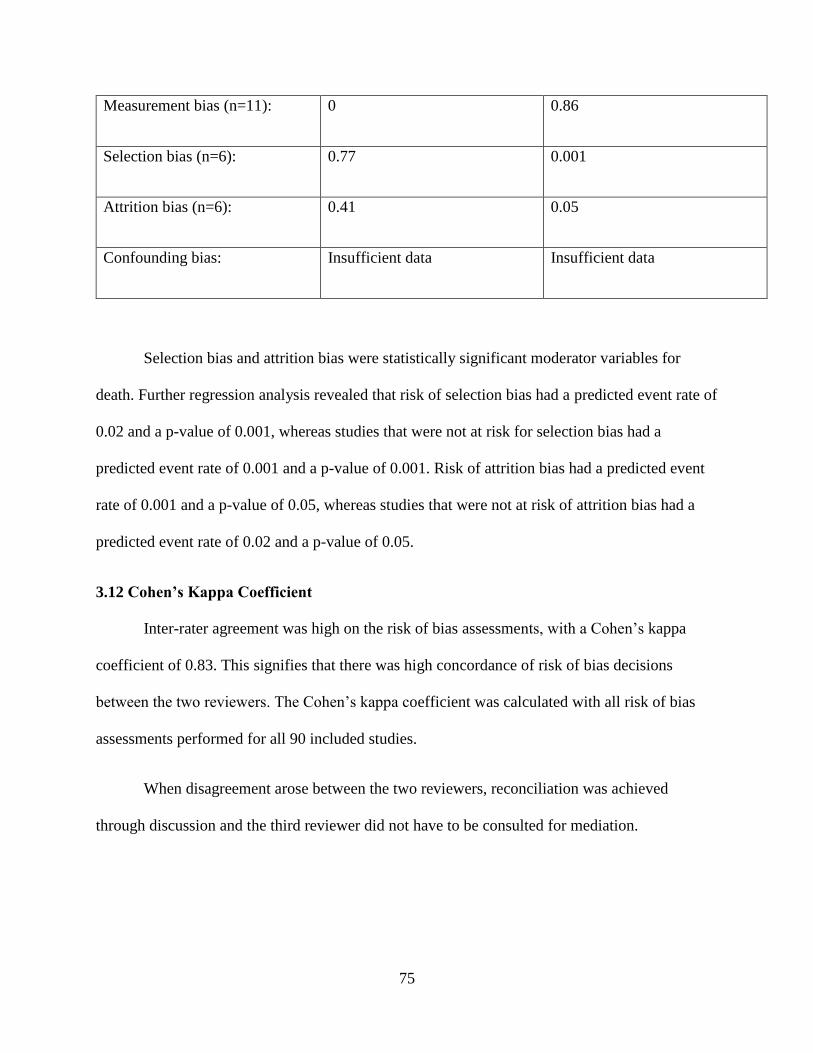
75
Measurement bias (n=11): 0 0.86
Selection bias (n=6): 0.77 0.001
Attrition bias (n=6): 0.41 0.05
Confounding bias: Insufficient data Insufficient data
Selection bias and attrition bias were statistically significant moderator variables for
death. Further regression analysis revealed that risk of selection bias had a predicted event rate of
0.02 and a p-value of 0.001, whereas studies that were not at risk for selection bias had a
predicted event rate of 0.001 and a p-value of 0.001. Risk of attrition bias had a predicted event
rate of 0.001 and a p-value of 0.05, whereas studies that were not at risk of attrition bias had a
predicted event rate of 0.02 and a p-value of 0.05.
3.12 Cohen’s Kappa Coefficient
Inter-rater agreement was high on the risk of bias assessments, with a Cohen’s kappa
coefficient of 0.83. This signifies that there was high concordance of risk of bias decisions
between the two reviewers. The Cohen’s kappa coefficient was calculated with all risk of bias
assessments performed for all 90 included studies.
When disagreement arose between the two reviewers, reconciliation was achieved
through discussion and the third reviewer did not have to be consulted for mediation.

76
3.13 Intraclass correlation coefficient
Inter-rater agreement was high on the McHarm, with an Intraclass correlation coefficient
of 0.91. This signifies that there was high concordance of quality of reporting of SADEs between
the two reviewers. The Intraclass correlation coefficient was calculated using all quality of
reporting of SADEs performed for all 90 included studies.
When disagreement arose between the two reviewers, reconciliation was achieved
through discussion and the third reviewer did not have to be consulted for mediation.

77
4 Discussion
The current meta-analytic review contained 3 hypotheses. Hypothesis 1: Overall, quality
of reporting of selected adverse drug events (SADEs) will be low and risk of bias will be high in
studies that investigate SADEs of long-term prescription opioids. Hypothesis 2: Studies with
inferior quality of reporting of SADEs and/or risk of bias will yield higher event rates compared
to studies with superior quality of reporting of SADEs and/or no risk of bias. Hypothesis 3: If
moderator variables are found to explain variance of event rates between studies (statistically
significant associations with moderator variable(s)), SADEs should be influenced accordingly.
Hypothesis 1 was confirmed, and in the opioid literature, the overall quality of reporting
is low and the risk of bias is high among studies that examined selected adverse drug events
(SADEs) (misuse, abuse, addiction, overdose, and death).
Overall, quality of reporting was low with a mean McHarm score of 57% across all 90
included studies. However, scores ranged widely from the highest McHarm score of 80% (12 out
of 15), which was a RCT, to the lowest McHarm score of 28.6% (4 out of 14), which was a non-
controlled observational study. Similarly, risk of bias was also problematic across the 90 studies.
More specifically, 71.4% of RCTs were at risk for performance bias, 34.4% of studies (RCTs,
CO, NCO) were at risk for measurement bias, 40.5% of RCTs and CO were at risk for selection
bias, 8.1% of RCTs and CO were at risk for attrition bias, and 90% of CO were at risk for
confounding bias. Confounding bias was most concerning with 90% of CO studies at risk for this
bias, whereas attrition bias was least concerning with only 8.1% of studies at risk for this bias.
However, this low percentage of studies at risk of attrition bias reflects the retrospective nature
of a majority of studies, for which participant dropout/withdrawal is not relevant. Therefore,

78
these studies are considered not at risk for attrition bias and artificially decrease the risk for
attritions bias.
Fifty-four 52, 54, 57, 60, 61, 63, 65, 66, 69-74, 76, 78-81, 84, 85, 87-92, 95, 98, 101, 103, 105-107, 111, 114-121, 123-127, 129,
130, 135, 137 studies, which is 60% of all included studies, used some form of retrospective
methodology, and while retrospective studies are considered not at risk of attrition bias,
participant attrition is not very relevant for these studies. In this literature (SADEs of prescription
opioids) then, attrition bias is not as pertinent as other risks of bias, which should receive greater
attention and consideration. However, the seven included RCTs employed prospective
methodologies. Therefore, if RCTs become a more prominent study design attrition bias would
become more relevant. But, as evidenced from the current meta-analytic review, RCTs are
significantly lacking in the SADE literature of prescription opioids, and only comprised of 7.8%
(7 out of 90) of the sample of studies.
Hypothesis 2 was confirmed and studies with inferior (lower) quality of reporting of
SADEs purported higher event rates of SADEs compared to studies with superior quality of
reporting, which purported lower event rates. However, hypothesis 2 was partially confirmed for
risk of bias and three forms of risk of bias (performance bias, selection bias and confounding
bias) had higher event rates compared to studies that were not at risk for theses biases.
For all SADEs (misuse, abuse, addiction, overdose, and death), across the 90 included
studies, quality of reporting of SADEs was inversely related (-0.003) to event rates. This means
that studies with superior quality of reporting of SADEs purported lower event rates, compared
to studies with inferior quality of reporting, which purported higher event rates. However, this
finding was not statistically significant (p-value of 0.99) and a coefficient of -0.003 represents a

79
weak correlation. Perhaps specific components/questions from the McHarm would be more
strongly correlated with the event rates of SADEs, and in turn, may have more predictive value
than the entire instrument.
Studies that were at risk for either, or all of performance bias, selection bias, and/or
confounding bias purported higher event rates for all SADEs compared to studies that were not
at risk for these biases. However, studies at risk for the remaining two forms of bias, which
included: measurement bias and attrition bias purported lower event rates for all SADEs
compared to studies that were not at risk for these biases. This finding demonstrates that risk of
bias should not be thought of as one outcome measure, but that specific kinds of bias influence
reported event rates differently.
Risk of attrition bias was the only risk of bias that had a statistically significant p-value of
0.004, and the largest difference between reported coefficients (studies at risk of attrition bias
had a predicted event rate of 0.02, whereas studies that were not at risk of attrition bias had a
predicted event rate of 0.29). This finding contradicts the earlier thought of attrition bias not
being as relevant as other forms of bias in the SADE literature of opioids. However, this finding
suggests that among studies where attrition bias is relevant (i.e. studies that are at risk of attrition
bias), this form of bias is an important factor in reported event rates of SADEs.
While it may not seem especially concerning that studies at risk of performance bias,
selection bias, and confounding bias overestimate/inflate event rates of SADEs as this would
cause practitioners to be vigilant of these SADEs; overestimation has grievous consequences. In
practitioners being especially cognizant of an overestimated SADE other ADEs may go
unnoticed. Additionally, healthcare resources would be overused and potentially wasted when
80
these resources could have been allocated more effectively. Finally, overestimation of SADEs
may cause patients to refuse otherwise effective medications. Therefore, it is of the utmost
importance for the event rates of these SADEs to be accurately represented.
Hypothesis 3 was partially confirmed when moderator variables were found to be
statistically significant/explain the variance in reported event rates of SADE outcomes.
Quality of reporting was only statistically significant for addiction only in participants
with shorter opioid exposure, and had a correlation coefficient of 0.52 and a p-value of 0.05. This
means that reported event rates of addiction were positively correlated with quality of reporting
of SADEs in participants with shorter opioid exposure; indicating that studies with superior
quality of reporting of SADEs purported higher event rates of addiction, whereas studies with
inferior quality of reporting of SADEs purported lower event rates of addiction. This finding,
while in contrast with the overall reported coefficient for the McHarm (-0.003), comprises of a
larger/stronger coefficient and is statistically significant.
The more robust methodologies (i.e. DSM-V, or ICD-9-CM) used in studies that examine
addiction may explain the positive relationship quality of reporting of SADEs has with addiction.
Misuse and abuse were defined more diversely compared to addiction, and both contained the
most studies, 41 and 28, respectively. Therefore, both misuse and abuse influenced the overall
inverse correlation (-0.003) with quality of reporting of SADEs significantly more than
addiction, which contained the least number of studies (n=9).
Overall, risk of bias explained more of the variance in reported SADE event rates than
quality of reporting of SADEs. Selection bias was found to explain the most variance, with 3
statistically significant outcomes, and measurement bias and confounding bias followed with 2

81
statistically significant outcomes each. Selection bias was statistically significant for misuse in
participants with shorter opioid exposure, and overdose and death. For all three of these
outcomes, risk of selection bias resulted in a higher predicted event rate than studies that were
not at risk. This indicates that risk of selection bias results in higher reported event rates across
these outcomes (misuse, overdose and death) compared to studies not at risk.
Measurement bias was statistically significant and accounted for variance in misuse in
participants with longer opioid exposure and abuse in participants with shorter opioid exposure.
Findings for measurement bias varied, and for misuse, risk of measurement bias had a lower
predicted event rate (0.06) compared to studies not at risk (0.24). Conversely, for abuse, studies
that were at risk of measurement bias contained a higher predicted event rate (0.35) compared to
studies not at risk (0.14). This suggests that due to the diverse ways in which misuse and abuse
were measured (both contained the most diversity in the ways in which they were
operationalized across studies), the way in which measurement bias influences event rates may
be contingent on what SADE is being examined and how.
Confounding bias was statistically significant for misuse and abuse in participants with
longer opioid exposure. It was the only risk of bias that was exclusively statistically significant
for SADEs with longer participant opioid exposure. Intuitively, this make sense as the longer a
patient is prescribed opioids, there are more potential confounders that can occur in the patient’s
life (i.e. change in lifestyle, or a patient’s health may be an underlying cause for an SADE
instead of the prescribed opioids). Therefore, while confounding bias was found to be the most
concerning bias across all included studies, with 90% of studies at risk, controlling for
confounding may not be as pertinent in studies that examine SADE outcomes in participants with
shorter exposure to opioids.
82
The ways in which SADEs were collected and measured explained the most variance
across SADE outcomes. More specifically, active versus passive collection of SADEs was
significant for both misuse with shorter and longer participant opioid exposure and for addiction
with shorter participant opioid exposure. For all three of these significant outcomes, passive
collection of SADEs had a lower predicted event rate compared to active collection of SADEs,
which indicates that active collection of SADEs results in higher reported event rates for misuse
and addiction, whereas passive collection of SADEs results in lower reported event rates.
As previously discussed, measurement bias was statistically significant and accounted for
variance in misuse with longer participant opioid exposure and abuse in participants with shorter
opioid exposure. Collectively, the way in which SADEs are measured and collected are directly
related. For instance, if a study employs a passive approach to the collection of ADEs, where
participants report ADEs experienced in a spontaneous manner, then the way in which the ADE
outcome is measured is not well-defined and there would be potential for risk of measurement
bias. Conversely, studies that employ an active approach to the collection of ADEs also employ
more rigidly defined measures of ADE outcomes and the potential for risk of measurement bias
is significantly reduced. Therefore, results from the current meta-analytic review suggest that
how SADEs are collected and measured/defined collectively explain a large portion of the
variance in event rates of SADEs.
Active versus passive collection of SADEs also explained more variance in reported
SADE event rates (statistically significant moderator variable for 3 SADE outcomes) than the
entire McHarm score (quality of reporting of SADEs), which was only a statistically significant
moderator variable for one SADE outcome. Therefore, it may be more worthwhile to focus on
83
the ways in which SADEs are collected; one aspect of quality of reporting of SADEs, instead of
utilizing a comprehensive assessment of quality of reporting.
Length of opioid exposure was statistically significant for abuse and death, with a
correlation coefficient of 0.28 and p-value of 0.05, and 0.24 and 0.04, respectively. These
coefficients signify that studies with shorter length of participant opioid exposure resulted in
lower event rates for abuse and death, and vice versa. Intuitively, this makes sense as both abuse,
and especially death, often take time to transpire. Furthermore, it is believed that if a greater
number of studies were included for addiction and overdose, length of participant opioid
exposure would too be statistically significant. Finally, length of opioid exposure was least
correlated with misuse (correlation coefficient of 0.01 and a p-value of 0.8), which is considered
the least severe of the 5 SADE outcomes examined (misuse, abuse, addiction, overdose, and
death); in fact, misuse was the only SADE outcome that had a higher event rate for participants
with longer opioid exposure (24.4%), compared to participants with shorter opioid exposure
(11.4%).
Findings from the current meta-analytic review on previous or current mental health
disorders and/or substance use disorder contradict purported findings from extant literature.
More specifically, previous studies have purported that patient’s with a current or previous
mental health disorder(s) and/or substance use disorder are at an increased risk of ADEs139.
Therefore, it should be expected that the current meta-analytic review would replicate these
findings and report that the moderator variables: current or previous mental health disorder(s)
and/or substance use disorder were statistically significant and resulted in higher reported SADE
event rates. However, participant mental health and substance use did not explain variance for
any of the SADE outcomes examined. Unfortunately, a clear majority of studies specified

84
whether participants included in the study could have potentially had a mental health disorder or
substance use disorder. However, these studies did not discuss whether the entire sample had
been diagnosed in the past, or currently have a mental health disorder and/or substance use
disorder, nor do studies specify the number of participants. Therefore, if this information was
made available and/or current or previous mental health disorder(s) and substance use disorder
were reported in a more transparent manner, then it is expected that findings from the current
review would support extant literature.
These problems with reporting are important to consider when reflecting on the purported
event rates in the current meta-analytic review. While the event rates for all five of the SADE
outcomes (misuse, abuse, addiction, overdose, and death) are consistent with extant literature,
these event rates should be interpreted cautiously140. Further studies are needed to replicate
findings to lend more support to these findings. Additionally, the studies included in this review
contained low overall quality of reporting (comparable quality of reporting assessments for
therapeutic benefit studies range from 65% to 90%, with most in-between the 70%-80%
range141) and high risk of bias (for risk of bias, 50% and above is considered high142). The large
amount of heterogeneity between these studies also demonstrates that an overall event rate for
any of the SADE outcomes is not a representative measure, and instead, it is important to
understand the cause behind this large amount of heterogeneity to gain insight on why the event
rates of these SADEs vary significantly. Finally, the number of studies included in this review, in
specific, for addiction, overdose and death were limited and a greater number of studies must be
available to yield robust findings.
Despite problems with transparency and reporting, there has been an overwhelming
increase in the number of ADE studies published, and Aronson, Derry and Loke (2002) noted
85
that there are roughly 3000 new studies each year143. The authors further explicate that most of
the primary studies published are in the form of anecdotal reports (30%) and informal studies
(i.e. case reports) (30%). RCTs are significantly lacking in the ADE literature and Aronson et al.
encourage prospective studies to utilize RCT methodologies. However, they explain it is
important that RCTs that examine ADEs recruit large sample sizes and are conducted for longer
periods of time to produce robust findings143. Indeed, the literature included in the current meta-
analytic review often contained large sample sizes, with a mean sample size of 27,418, and it is
well-documented in extant literature that ADEs require longer periods of time to transpire.
Studies are also encouraged to examine opioid-related ADEs globally. Of the 90 studies
included in the current-meta-analytic review, 74 were published in America, and 78 were
conducted in North America. While the “opioid crisis” is most prevalent in America, studies
published more broadly may shed light on novel approaches to alleviate ADEs experienced from
patients144. Additionally, the prevalence of opioid-related problems in America may reflect bias
in the literature of studies being more frequently conducted and published in America.
Researchers are also encouraged to explore whether systematic differences are exhibited in
studies that have been conducted outside of America, specifically differences on the way in
which ADE outcome measures are being operationalized and the collection of ADEs, both of
which were found to be statistically significant and influence event rates for numerous ADE
outcomes in the current meta-analytic review.
The poor quality of reporting of SADEs evidenced in the current meta-analytic review is
consistent with extant literature. While specific studies have not been conducted on opioids,
Edwards et al. (1999) assessed the quality of reporting of ADEs in the pain context15. These
researchers examined 52 RCTs that were double-blind clinical trials of single–dose
86
acetaminophen or ibuprofen compared with placebo in moderate-to-severe postoperative pain.
They noted that many trials reported incomplete findings of ADEs and that different methods of
assessing ADEs resulted in different reported event rates. For instance, patient diaries yielded
significantly more ADEs compared to other ADE collection. The inconsistency in findings and
the lack of methodological rigor employed by these studies lead Edwards et al. to conclude that
much improvement and higher quality of reporting is necessary in the pain literature15.
Kane-Gill et al. (2015) examined quality of reporting of ADEs more broadly and whether
improvements of quality had been made over time145. The authors searched MEDLINE,
including dates from March 2013 to March 2014 and limited inclusion to studies that contained
human participants and were published in English. One hundred studies were included in the
review. Kane-Gill et al. noted that when they had compared their results with reviews previously
published two decades earlier quality of reporting of both ADEs had improved over time.
However, they noted that more improvement was required to ensure data are understandable and
relatable to patient care – an objective the authors believe is strongly related to the how ADEs
are collected and reported. In a separate analysis of the same study, Kane-Gill et al. examined
quality of reporting of active diseases, social history, weight, race, other drugs and dose in the
same 100 studies. They noted improvement in the overall quality of reporting of these variables,
however, they explain that further improvement can be made regarding the frequencies in which
they are reported, which ranged from 25% to 80%145.
This finding is consistent with data retrieved from the current meta-analytic review. Data
on participant race/ethnicity was only available in 39 studies. Similarly, data on age was only
available in 69 studies, and 21 did not contain mean age of participants and 32 did not report the

87
age range of participants. Fourteen studies did not include information on participant gender, and
only 43 studies contained a conflict of interest statement.
The high risk of bias reported in the current meta-analytic review is consistent with
previous ADE literature. Bilandzic et al. (2016) conducted a systematic review on the risk of bias
of non-randomized studies of adverse cardiovascular effects of thiazolidinedione (TZD) and
cyclooxygenase-2 (COX-2) inhibitors38. They examined two systematic reviews of population-
based, controlled non-randomized studies of the relationship between the use of TZDs and COX-
2 inhibitors and major cardiovascular events. Two epidemiologists applied the Cochrane Risk of
Bias Tool and made assessments. Bilandzic et al. purported 2 studies had low overall risk of bias,
14 had moderate risk of bias, and 5 had serious risk of bias38. Similar to the current meta-analytic
review, confounding bias was most problematic/prevalent and was found to be either moderate
or severe in 76.2% of studies.
Importantly, while measurement bias was one of the less problematic biases in both
Bilandzic et al. (2016)38 systematic review (14.3%) and the current meta-analytic review
(34.4%), the great amount of variability in how ADE outcomes were defined and measured,
especially the five (misuse, abuse, addiction, overdose, and death) included in the current meta-
analytic review is a problem.
Perhaps RCTs may provide a solution to this problem. RCTs employ more definitive and
standardized approaches when defining ADE outcomes. Additionally all 7 RCTs in the current
meta-analytic review employed a standardized questionnaire when assessing a SADE outcome,
providing further consistency.

88
The current meta-analytic review is one of the most comprehensive meta-analysis on the
ADEs of prescription opioids. Previous systematic reviews and meta-analyses have focused on
fewer ADE outcomes, specifically only abuse and addiction. Additionally, all have limited study
inclusion to studies that contain higher quality of reporting and lower risk of bias; completely
excluding poorly conducted studies. The current-meta-analytic review is exhaustive and used a
comprehensive search strategy to ensure results and conclusions were robust and provide a
representative narrative on the SADEs (misuse, abuse, addiction, overdose, and death) literature
of prescription opioids. This is further reflected in the sample of studies included: 90, which is
significantly higher than previous systematic reviews and meta-analyses which normally only
include 10-50. Additionally, major databases were exhaustively searched, which included:
MEDLINE, EMBASE, CINHAL, PsycINFO, CENTRAL, and Business Source Premier. The
search strategy was developed and executed from a librarian at the Institute for Work & Health
that has extensive experience with systematic reviews and meta-analyses.
Another strength of the current meta-analytic review is that it solely focused on SADEs
of prescription opioids, and therefore, the methodology employed was strictly applicable to ADE
outcomes. A majority of previous ADE reviews, especially ones focused on opioids, report on
both the benefits and the ADEs of prescription opioids and this conflates specific methodologies
that are meant for only ADEs or benefits. Consequently, these reviews are at risk of reporting
inaccurate findings, or using less ideal methodologies and tools/instruments (i.e. McHarm can
only be used to examine ADEs and adverse drug reactions (ADRs)). Additionally, the current
meta-analytic review employed a risk of bias tool that is comprehensive and assesses five major
risks of bias, including: performance bias, measurement bias, selection bias, attrition bias, and
confounding bias. The risk of bias tool has also been published as a Cochrane methodology –

89
Cochrane is a key resource and world leader in risk of bias of ADEs. Finally, the current meta-
analytic review examined important moderator variables that may influence the event rates of
misuse, abuse, addiction, overdose, and/or death and may help inform clinical practice,
specifically which patients are at increased risk for specific SADEs.
This review also contained a number of limitations. Only studies published in English
were included and therefore relevant studies published in other languages may have been
excluded. Moreover, for three outcomes: addiction, overdose and death there were a limited
number of studies, which weakened the results and conclusions from these outcomes.
Additionally, the limited number of studies required each moderator variable to be analysed
separately (need 5 studies per moderator variable), which resulted in numerous regressions,
increasing the chance of a type 1 error (false positive – incorrect rejection of the null hypothesis)
occurring. There were also a very limited amount of RCTs included - only 7 RCTs satisfied
inclusion criteria and were ultimately included in the meta-analysis and subsequent meta-
regressions. In addition, while there were concrete definitions used for SADE outcomes,
consistency in how outcomes were defined study to study were poor. Therefore, some studies
that may contain pertinent information may have been excluded; this was especially pertinent for
studies that included overdose as an outcome. More specifically, some studies did not expand on
whether overdose events were fatal or non-fatal, and if this information was made available then
overdoses that were fatal would have also been classified as a death outcome. Therefore, the
number of studies that examine death may be underrepresented.
The way in which event rates were reported was another limitation. For numerous
studies, only a percentage was reported as the event rate for an SADE outcome and the number
of participants that experienced the SADE outcome was not available. In this case, estimation
90
was used to determine the number of participants that most closely approximated the percentage
recorded in the study. Similarly, the moderator variables: current or previous mental health
disorder and/or substance use disorder were not clearly defined in numerous studies. A clear
majority of studies specified whether participants included in the study could have potentially
had a mental health disorder or substance use disorder. However, these studies do not discuss
whether the entire sample has been diagnosed in the past, or currently have a mental health
disorder and/or substance use disorder, nor do studies specify the number of participants.
Therefore, these moderator variables could have been confounded due to inaccurate data from
studies. Additionally, only information from studies was used and no contact was made with
authors from the studies. This was done to ensure that reported findings reflect what any
layperson would retrieve from only the literature. However, if authors from the studies were
contact then more accurate information may have been provided.
Notwithstanding these limitations, the findings from the current meta-analytic review
provide a comprehensive assessment of the literature on the SADEs of prescription opioids,
which was previously lacking. The review also elucidated the event rates of misuse, abuse,
addiction, overdose, and death, which can help inform patients and healthcare providers of the
risks of these SADEs. Recommendations can also be provided to improve the poor quality of
reporting and high risk of bias in this literature. More specifically, RCTs that are of longer length
with larger sample sizes should be executed to produce robust and valid findings. Results from
the current meta-analytic review can also help inform clinical practice. Length of participant
opioid exposure was an important factor that explained variance in reported event rates of abuse
and death. Practitioners and clinicians should be cognizant of the length that a patient is
prescribed an opioid and remain highly alert for signs of abuse, or potential risks for death the

91
longer a patient is prescribed an opioid. Although not statistically significant, length of patient
opioid exposure should also be considered for addiction and overdose as extant literature has
demonstrated that patients on opioids for longer are more likely to experience these ADEs. It is
believed that these findings would have been replicated in the current meta-analytic review if
more studies were available for these outcomes.
Prospective studies are encouraged to produce standardized definitions of ADE outcomes
to provide consistency across the literature. It is difficult to draw strong general conclusions
when ADE outcomes are defined and measured with an overwhelming amount of diversity. One
way to improve consistency across studies is to use more precise and/or standardized language,
which would allow for more generalized findings.
Perhaps, most importantly, conduct more studies. Literature on the ADEs of prescription
opioids, especially addiction, overdose and death is significantly lacking and well-conducted
studies with high quality of reporting and low risk of bias will help further advance our
knowledge on prescription opioids and their ADEs, knowledge that can be used to inform
clinical practice and improve patient care.
92
5 Conclusion
Overall, there has been an increase in the number of studies published on the adverse
drug events (ADEs) of prescription opioids. However, further studies are required, especially
studies with better quality of reporting and lower risk of bias in order to produce robust and
accurate findings. In addition, studies were significantly lacking for three selected adverse drug
event (SADE) outcomes, which included: addiction, overdose, and death, and more literature
should focus on these serious, life-threatening ADEs of prescription opioids.
Rather than quality of reporting of SADEs as a whole, the specific assessment of active
versus passive collection of SADEs from the McHarm explained variance across numerous
SADE outcomes. Conversely, risk of bias explained more variance between studies, and each of
the five risk of biases (performance bias, selection bias, measurement bias, attrition bias, and
confounding bias) were statistically significant for at least one SADE outcome. However, the
way in which risk of bias influenced the event rates of the SADE outcomes varied. Therefore,
risk of bias should not be thought of as one outcome measure, but specific kinds of bias should
be thought of independently.
Selection bias accounted for the most variance across SADE outcomes, with three
statistically significant findings. However, measurement bias and confounding bias were not far
behind with two statistically significant findings each. Length of participant opioid exposure was
also statistically significant and explained variance in reported event rates of abuse and death.
However, if more studies were available for addiction and overdose, both of which are serious
ADEs, it is expected that length of participant opioid exposure would have also been statistically
significant and account for the variance in reported event rates of addiction and overdose
between studies.
93
6 Future Directions
The current meta-analytic review has explicated the event rates of five SADEs (misuse,
abuse, addiction, overdose, and death) and provides a benchmark of the overall quality of
reporting and risk of bias in this literature; both of which were previously unexplored. However,
subsequent meta-analyses and systematic reviews are needed to replicate findings and support
discoveries from this meta-analytic review. Besides the need for replication, primary studies on
the SADEs of prescription opioids must comprise of better quality of reporting and lower risk of
bias. Primary studies should also aspire to include larger sample sizes (~500 patients or greater)
and examine SADEs for longer periods of time; ideally, 12- months or longer due to the five
SADEs, and ADEs in general often requiring longer to transpire.
Prospective studies are encouraged to utilize tools such as PRISMA (Preferred Reporting
Items for Systematic Reviews and Meta-Analyses) to ameliorate quality of reporting and lower
risk of bias. PRISMA consists of a 27-item checklist and four-phase flow diagram that is focused
on promoting transparent and consistent reporting in systematic reviews and meta-analyses146.
Similarly, primary ADE studies should use comparable tools, such as CONsolidated Standards of
Reporting Trials (CONSORT)147 for randomized controlled trials (RCTs) and Strengthening the
reporting of observational studies in epidemiology (STROBE)148 for observational studies. In
doing so, prospective systematic reviews and meta-analyses will yield robust and meaningful
findings.
An overwhelming majority of studies (74 out of 90 or 82.2%) from the current meta-
analytic review were conducted in America. This is concerning as Canada has some of the
highest rates of prescription-opioid consumption, and from 2006 to 2011, use of opioids in
Canada rose by 32 percent149. Prospective studies should consider more diverse countries besides

94
America as both healthcare and patients drastically vary on a global scale. Looking towards the
future, it would be worthwhile to compare the event rates of opioid ADEs globally, which could
perhaps provide valuable insight into why opioid consumption and ADEs are particularly salient
in North America.
Subsequent research should focus on the enormous amount of heterogeneity of SADE
event rates that was reported in this meta-analytic review. It is important to understand this
heterogeneity and explore its’ relationship with the included SADEs involved in prescription
opioids. Findings may have potential implications for future research and clinical applications.
Furthermore, the large amount of heterogeneity indicates that an overall event rate for any SADE
would not be representative and/or meaningful as it would not be applicable to a vast majority of
patients.
The moderator variables in the current meta-analytic could also be analyzed further. The
current review examined the influence moderator variables had on event rates/occurrence of
SADEs. However, these moderator variables may have an impact on the severity of the SADEs
and/or the rate at which patients recover from them; both of which have important implications
for healthcare. After clinicians have a more refined understanding of how these specific
moderator variables influence ADEs, it would be worthwhile to a develop risk tool focused
around these moderator variables. A comprehensive risk tool would allow clinicians to assess
risk for specific ADEs on a patient by patient basis and for specific subsets of the patient
population.
The way in which both the therapeutic benefits and ADEs of opioids are examined in
studies is antiquated. The majority of opioid studies examine opioids in isolation to observe the

95
‘true effect’ an opioid medication has on chronic pain. However, current treatments in medicine
are holistic and contain diverse treatment modalities150. For instance, opioids are normally used
in combination with physiotherapy and/or massage therapy to treat chronic pain conditions. It is
important to understand how these diverse treatments interact with one another and what their
collective effect is on both therapeutic benefits and ADEs in chronic pain patients. Future studies
are encouraged to examine the possible synergistic effect of these various treatment modalities.
In summary, the current meta-analytic review provides a benchmark of the current state
of the SADE opioid literature and it has emphasized the need for improved quality of reporting
and lower risk of bias in this literature. However, it is crucial that subsequent studies expand on
these results in order to better understand opioid ADEs and ADEs in general. The onus is on
future primary ADE studies to improve quality of reporting and lower risk of bias to allow for
more meaningful findings that can inform healthcare and improve patient outcomes.
96
References
1. Rotermann M, Sanmartin C, Hennessy D, et al. Prescription medication use by Canadians
aged 6 to 79. Health Rep. 2014;25(6):3-9.
2. Barajas-Nava LA, Calvache JA, Lopez-Alcalde J, et al. Identification and description of
randomized controlled trials and systematic reviews on patient safety published in medical
journals. J Patient Saf. 2013;9(2):79-86.
3. Nebeker JR, Barach P, Samore MH. Clarifying adverse drug events: a clinician's guide to
terminology, documentation, and reporting. Ann Intern Med. 2004;140(10):795-801.
4. Shekelle PG, Wachter RM, Pronovost PJ, et al. Making health care safer II: an updated
critical analysis of the evidence for patient safety practices. Evid Rep Technol Assess (Full Rep).
2013(211):1-945.
5. Akobeng AK. Understanding randomised controlled trials. Arch Dis Child.
2005;90(8):840-844.
6. Stolberg HO, Norman G, Trop I. Randomized controlled trials. AJR Am J Roentgenol.
2004;183(6):1539-1544.
7. Hammad TA, Pinheiro SP, Neyarapally GA. Secondary use of randomized controlled
trials to evaluate drug safety: a review of methodological considerations. Clin Trials.
2011;8(5):559-570.
8. McGauran N, Wieseler B, Kreis J, et al. Reporting bias in medical research - a narrative
review. Trials. 2010;11:37.
9. Whitehouse PJ. MSJAMA: Lessons and responses in Alzheimer disease research. JAMA.
2003;290(1):115.

97
10. Teixeira da Silva JA. Negative results: negative perceptions limit their potential for
increasing reproducibility. J Negat Results Biomed. 2015;14:12.
11. Bardy AH. Bias in reporting clinical trials. Br J Clin Pharmacol. 1998;46(2):147-150.
12. Saini P, Loke YK, Gamble C, et al. Selective reporting bias of harm outcomes within
studies: findings from a cohort of systematic reviews. BMJ. 2014;349:g6501.
13. Molokhia M, Tanna S, Bell D. Improving reporting of adverse drug reactions: Systematic
review. Clin Epidemiol. 2009;1:75-92.
14. Leape LL. Reporting of adverse events. N Engl J Med. 2002;347(20):1633-1638.
15. Edwards JE, McQuay HJ, Moore RA, et al. Reporting of adverse effects in clinical trials
should be improved: lessons from acute postoperative pain. J Pain Symptom Manage.
1999;18(6):427-437.
16. Golder S, Loke YK, Zorzela L. Some improvements are apparent in identifying adverse
effects in systematic reviews from 1994 to 2011. J Clin Epidemiol. 2013;66(3):253-260.
17. Wahab IA, Pratt NL, Kalisch LM, et al. The detection of adverse events in randomized
clinical trials: can we really say new medicines are safe? Curr Drug Saf. 2013;8(2):104-113.
18. Zorzela L, Golder S, Liu Y, et al. Quality of reporting in systematic reviews of adverse
events: systematic review. BMJ. 2014;348:f7668.
19. Tan K, Petrie KJ, Faasse K, et al. Unhelpful information about adverse drug reactions.
BMJ. 2014;349:g5019.
20. Abdel-Sattar M, Krauth D, Anglemyer A, et al. The Relationship between Risk of Bias
Criteria, Research Outcomes, and Study Sponsorship in a Cohort of Preclinical
Thiazolidinedione Animal Studies: A Meta-Analysis. Evid Based Preclin Med. 2014;1(1):11-20.

98
21. Dantas F, Fisher P, Walach H, et al. A systematic review of the quality of homeopathic
pathogenetic trials published from 1945 to 1995. Homeopathy. 2007;96(1):4-16.
22. Floor-Schreudering A, Geerts AF, Aronson JK, et al. Checklist for standardized reporting
of drug-drug interaction management guidelines. Eur J Clin Pharmacol. 2014;70(3):313-318.
23. Moher D, Shamseer L, Clarke M, et al. Preferred reporting items for systematic review
and meta-analysis protocols (PRISMA-P) 2015 statement. Syst Rev. 2015;4:1.
24. Moher D, Liberati A. [Reporting systematic reviews and meta-analyses: asking authors,
peer reviewers, editors and funders to do better]. Med Clin (Barc). 2010;135(11):505-506.
25. Knobloch K, Yoon U, Vogt PM. Preferred reporting items for systematic reviews and
meta-analyses (PRISMA) statement and publication bias. J Craniomaxillofac Surg.
2011;39(2):91-92.
26. Duarte DF. [Opium and opioids: a brief history.]. Rev Bras Anestesiol. 2005;55(1):135-
146.
27. Rosenblum A, Marsch LA, Joseph H, et al. Opioids and the treatment of chronic pain:
controversies, current status, and future directions. Exp Clin Psychopharmacol. 2008;16(5):405-
416.
28. Oosten AW, Oldenmenger WH, Mathijssen RH, et al. A Systematic Review of
Prospective Studies Reporting Adverse Events of Commonly Used Opioids for Cancer-Related
Pain: A Call for the Use of Standardized Outcome Measures. J Pain. 2015;16(10):935-946.
29. Moore RA, McQuay HJ. Prevalence of opioid adverse events in chronic non-malignant
pain: systematic review of randomised trials of oral opioids. Arthritis Res Ther.
2005;7(5):R1046-1051.

99
30. Baldini A, Von Korff M, Lin EH. A Review of Potential Adverse Effects of Long-Term
Opioid Therapy: A Practitioner's Guide. Prim Care Companion CNS Disord. 2012;14(3).
31. Furlan AD, Yazdi F, Tsertsvadze A, et al. A systematic review and meta-analysis of
efficacy, cost-effectiveness, and safety of selected complementary and alternative medicine for
neck and low-back pain. Evid Based Complement Alternat Med. 2012;2012:953139.
32. McCance-Katz EF, Sullivan LE, Nallani S. Drug interactions of clinical importance
among the opioids, methadone and buprenorphine, and other frequently prescribed medications:
a review. Am J Addict. 2010;19(1):4-16.
33. Herzig SJ, Rothberg MB, Cheung M, et al. Opioid utilization and opioid-related adverse
events in nonsurgical patients in US hospitals. J Hosp Med. 2014;9(2):73-81.
34. Minkowitz HS, Gruschkus SK, Shah M, et al. Adverse drug events among patients
receiving postsurgical opioids in a large health system: risk factors and outcomes. Am J Health
Syst Pharm. 2014;71(18):1556-1565.
35. Santaguida P RP. McMaster Quality Assessment Scale of Harms (McHarm) for primary
studies. 2008.
36. Armijo-Olivo S, Ospina M, da Costa BR, et al. Poor reliability between Cochrane
reviewers and blinded external reviewers when applying the Cochrane risk of bias tool in
physical therapy trials. PLoS One. 2014;9(5):e96920.
37. Furlan AD, Malmivaara A, Chou R, et al. 2015 Updated Method Guideline for
Systematic Reviews in the Cochrane Back and Neck Group. Spine (Phila Pa 1976).
2015;40(21):1660-1673.
38. Bilandzic A, Fitzpatrick T, Rosella L, et al. Risk of Bias in Systematic Reviews of Non-
Randomized Studies of Adverse Cardiovascular Effects of Thiazolidinediones and

100
Cyclooxygenase-2 Inhibitors: Application of a New Cochrane Risk of Bias Tool. PLoS Med.
2016;13(4):e1001987.
39. Ballantyne JC. Opioid misuse in oncology pain patients. Curr Pain Headache Rep.
2007;11(4):276-282.
40. Medicine ACoP. Use, Abuse, Misuse & Disposal of Prescription Pain Medication
Clinical Reference. 2009.
41. Borenstein M, Hedges LV, Higgins JP, et al. A basic introduction to fixed-effect and
random-effects models for meta-analysis. Res Synth Methods. 2010;1(2):97-111.
42. Desai RJ, Huybrechts KF, Hernandez-Diaz S, et al. Exposure to prescription opioid
analgesics in utero and risk of neonatal abstinence syndrome: population based cohort study.
BMJ. 2015;350:h2102.
43. Thorlund K, Imberger G, Johnston BC, et al. Evolution of heterogeneity (I2) estimates
and their 95% confidence intervals in large meta-analyses. PLoS One. 2012;7(7):e39471.
44. de Heus P. R squared effect-size measures and overlap between direct and indirect effect
in mediation analysis. Behav Res Methods. 2012;44(1):213-221.
45. Schneider A, Hommel G, Blettner M. Linear regression analysis: part 14 of a series on
evaluation of scientific publications. Dtsch Arztebl Int. 2010;107(44):776-782.
46. Goodwin LD. Increasing efficiency and precision of data analysis: multivariate vs.
univariate statistical techniques. Nurs Res. 1984;33(4):247-249.
47. McHugh ML. Interrater reliability: the kappa statistic. Biochem Med (Zagreb).
2012;22(3):276-282.
48. Kim HY. Statistical notes for clinical researchers: Evaluation of measurement error 1:
using intraclass correlation coefficients. Restor Dent Endod. 2013;38(2):98-102.

101
49. Adams EH, Breiner S, Cicero TJ, et al. A comparison of the abuse liability of tramadol,
NSAIDs, and hydrocodone in patients with chronic pain. J Pain Symptom Manage.
2006;31(5):465-476.
50. Allan L, Hays H, Jensen NH, et al. Randomised crossover trial of transdermal fentanyl
and sustained release oral morphine for treating chronic non-cancer pain. BMJ.
2001;322(7295):1154-1158.
51. Back SE, Payne RA, Waldrop AE, et al. Prescription opioid aberrant behaviors: a pilot
study of sex differences. Clin J Pain. 2009;25(6):477-484.
52. Barth KS, Becker WC, Wiedemer NL, et al. Association between urine drug test results
and treatment outcome in high-risk chronic pain patients on opioids. J Addict Med.
2010;4(3):167-173.
53. Bohnert AS, Valenstein M, Bair MJ, et al. Association between opioid prescribing
patterns and opioid overdose-related deaths. JAMA. 2011;305(13):1315-1321.
54. Bouckoms A, Masand P, Murray GB, et al. Chronic Nonmalignant Pain Treated with
Long-Term Oral Narcotic Analgesics. 1992.
55. Broekmans S, Dobbels F, Milisen K, et al. Pharmacologic pain treatment in a
multidisciplinary pain center: do patients adhere to the prescription of the physician? Clin J Pain.
2010;26(2):81-86.
56. Chelminski PR, Ives TJ, Felix KM, et al. A primary care, multi-disciplinary disease
management program for opioid-treated patients with chronic non-cancer pain and a high burden
of psychiatric comorbidity. BMC Health Serv Res. 2005;5(1):3.

102
57. Compton P, Darakjian J, Miotto K. Screening for addiction in patients with chronic pain
and "problematic" substance use: evaluation of a pilot assessment tool. J Pain Symptom Manage.
1998;16(6):355-363.
58. Cowan DT, Allan LG, Libretto SE, et al. Opioid drugs: a comparative survey of
therapeutic and "street" use. Pain Med. 2001;2(3):193-203.
59. Cowan DT, Wilson-Barnett J, Griffiths P, et al. A survey of chronic noncancer pain
patients prescribed opioid analgesics. Pain Med. 2003;4(4):340-351.
60. Currie SR, Hodgins DC, Crabtree A, et al. Outcome from integrated pain management
treatment for recovering substance abusers. J Pain. 2003;4(2):91-100.
61. Dunn KM, Saunders KW, Rutter CM, et al. Opioid prescriptions for chronic pain and
overdose: a cohort study. Ann Intern Med. 2010;152(2):85-92.
62. Edlund MJ, Martin BC, Fan MY, et al. Risks for opioid abuse and dependence among
recipients of chronic opioid therapy: results from the TROUP study. Drug Alcohol Depend.
2010;112(1-2):90-98.
63. Edlund MJ, Steffick D, Hudson T, et al. Risk factors for clinically recognized opioid
abuse and dependence among veterans using opioids for chronic non-cancer pain. Pain.
2007;129(3):355-362.
64. Fleming MF, Balousek SL, Klessig CL, et al. Substance use disorders in a primary care
sample receiving daily opioid therapy. J Pain. 2007;8(7):573-582.
65. Gupta A, Patton C, Diskina D, et al. Retrospective review of physician opioid prescribing
practices in patients with aberrant behaviors. Pain Physician. 2011;14(4):383-389.
66. Haller DL, Acosta MC. Characteristics of pain patients with opioid-use disorder.
Psychosomatics. 2010;51(3):257-266.

103
67. Hariharan J, Lamb GC, Neuner JM. Long-term opioid contract use for chronic pain
management in primary care practice. A five year experience. J Gen Intern Med.
2007;22(4):485-490.
68. Hojsted J, Nielsen PR, Guldstrand SK, et al. Classification and identification of opioid
addiction in chronic pain patients. Eur J Pain. 2010;14(10):1014-1020.
69. Ives TJ, Chelminski PR, Hammett-Stabler CA, et al. Predictors of opioid misuse in
patients with chronic pain: a prospective cohort study. BMC Health Serv Res. 2006;6:46.
70. Jamison RN, Butler SF, Budman SH, et al. Gender differences in risk factors for aberrant
prescription opioid use. J Pain. 2010;11(4):312-320.
71. Katz NP, Sherburne S, Beach M, et al. Behavioral monitoring and urine toxicology
testing in patients receiving long-term opioid therapy. Anesth Analg. 2003;97(4):1097-1102,
table of contents.
72. Knisely JS, Wunsch MJ, Cropsey KL, et al. Prescription Opioid Misuse Index: a brief
questionnaire to assess misuse. J Subst Abuse Treat. 2008;35(4):380-386.
73. Kouyanou K, Pither CE, Wessely S. Medication misuse, abuse and dependence in
chronic pain patients. J Psychosom Res. 1997;43(5):497-504.
74. Krebs EE, Ramsey DC, Miloshoff JM, et al. Primary care monitoring of long-term opioid
therapy among veterans with chronic pain. Pain Med. 2011;12(5):740-746.
75. Lin TC, Hsu CH, Lu CC, et al. Chronic opioid therapy in patients with chronic noncancer
pain in Taiwan. J Anesth. 2010;24(6):882-887.
76. Mahowald ML, Singh JA, Majeski P. Opioid use by patients in an orthopedics spine
clinic. Arthritis Rheum. 2005;52(1):312-321.

104
77. Malinoff HL, Barkin RL, Wilson G. Sublingual buprenorphine is effective in the
treatment of chronic pain syndrome. Am J Ther. 2005;12(5):379-384.
78. Malonne H, Coffiner M, Fontaine D, et al. Long-term tolerability of tramadol LP, a new
once-daily formulation, in patients with osteoarthritis or low back pain. J Clin Pharm Ther.
2005;30(2):113-120.
79. Manchikanti KN, Manchikanti L, Damron KS, et al. Increasing deaths from opioid
analgesics in the United States: an evaluation in an interventional pain management practice. J
Opioid Manag. 2008;4(5):271-283.
80. Manchikanti L, Cash KA, Damron KS, et al. Controlled substance abuse and illicit drug
use in chronic pain patients: An evaluation of multiple variables. Pain Physician. 2006;9(3):215-
225.
81. Manchikanti L, Damron KS, McManus CD, et al. Patterns of illicit drug use and opioid
abuse in patients with chronic pain at initial evaluation: a prospective, observational study. Pain
Physician. 2004;7(4):431-437.
82. Manchikanti L, Damron KS, Pampati V, et al. Prospective evaluation of patients with
increasing opiate needs: prescription opiate abuse and illicit drug use. Pain Physician.
2004;7(3):339-344.
83. Manchikanti L, Fellows B, Damron KS, et al. Prevalence of illicit drug use among
individuals with chronic pain in the Commonwealth of Kentucky: an evaluation of patterns and
trends. J Ky Med Assoc. 2005;103(2):55-62.
84. Manchikanti L, Manchukonda R, Damron KS, et al. Does adherence monitoring reduce
controlled substance abuse in chronic pain patients? Pain Physician. 2006;9(1):57-60.
105
85. Manchikanti L, Manchukonda R, Pampati V, et al. Evaluation of abuse of prescription
and illicit drugs in chronic pain patients receiving short-acting (hydrocodone) or long-acting
(methadone) opioids. Pain Physician. 2005;8(3):257-261.
86. Manchikanti L, Pampati V, Damron KS, et al. Prevalence of opioid abuse in
interventional pain medicine practice settings: a randomized clinical evaluation. Pain Physician.
2001;4(4):358-365.
87. Manchikanti L, Singh V, Damron KS, et al. Screening for controlled substance abuse in
interventional pain management settings: evaluation of an assessment tool. Pain Physician.
2003;6(4):425-433.
88. Maruta T, Swanson DW, Finlayson RE. Drug abuse and dependency in patients with
chronic pain. Mayo Clin Proc. 1979;54(4):241-244.
89. Melanson SE, Kredlow MI, Jarolim P. Analysis and interpretation of drug testing results
from patients on chronic pain therapy: a clinical laboratory perspective. Clin Chem Lab Med.
2009;47(8):971-976.
90. Michna E, Jamison RN, Pham LD, et al. Urine toxicology screening among chronic pain
patients on opioid therapy: frequency and predictability of abnormal findings. Clin J Pain.
2007;23(2):173-179.
91. Michna E, Ross EL, Hynes WL, et al. Predicting aberrant drug behavior in patients
treated for chronic pain: importance of abuse history. J Pain Symptom Manage. 2004;28(3):250-
258.
92. Moore TM, Jones T, Browder JH, et al. A comparison of common screening methods for
predicting aberrant drug-related behavior among patients receiving opioids for chronic pain
management. Pain Med. 2009;10(8):1426-1433.

106
93. Mystakidou K, Parpa E, Tsilika E, et al. Long-term management of noncancer pain with
transdermal therapeutic system-fentanyl. J Pain. 2003;4(6):298-306.
94. Naliboff BD, Wu SM, Schieffer B, et al. A randomized trial of 2 prescription strategies
for opioid treatment of chronic nonmalignant pain. J Pain. 2011;12(2):288-296.
95. Osmun WE, Copeland J, Parr J, et al. Characteristics of chronic pain patients in a rural
teaching practice. Can Fam Physician. 2011;57(11):e436-440.
96. Pascual ML, Fleming RR, Gana TJ, et al. Open-label study of the safety and effectiveness
of long-term therapy with extended-release tramadol in the management of chronic
nonmalignant pain. Curr Med Res Opin. 2007;23(10):2531-2542.
97. Passik SD, Kirsh KL, Whitcomb L, et al. Monitoring outcomes during long-term opioid
therapy for noncancer pain: results with the Pain Assessment and Documentation Tool. J Opioid
Manag. 2005;1(5):257-266.
98. Portenoy RK, Foley KM. Chronic use of opioid analgesics in non-malignant pain: report
of 38 cases. Pain. 1986;25(2):171-186.
99. Reid MC, Engles-Horton LL, Weber MB, et al. Use of opioid medications for chronic
noncancer pain syndromes in primary care. J Gen Intern Med. 2002;17(3):173-179.
100. Reid MC, Henderson CR, Jr., Papaleontiou M, et al. Characteristics of older adults
receiving opioids in primary care: treatment duration and outcomes. Pain Med. 2010;11(7):1063-
1071.
101. Robbins L. Long-Acting Opioids for Severe Chronic Daily Headache. 1999.
102. Saper JR, Lake AE, 3rd, Hamel RL, et al. Daily scheduled opioids for intractable head
pain: long-term observations of a treatment program. Neurology. 2004;62(10):1687-1694.

107
103. Schneider JP, Kirsh KL. Defining clinical issues around tolerance, hyperalgesia, and
addiction: a quantitative and qualitative outcome study of long-term opioid dosing in a chronic
pain practice. J Opioid Manag. 2010;6(6):385-395.
104. Skinner MA, Lewis ET, Trafton JA. Opioid use patterns and association with pain
severity and mental health functioning in chronic pain patients. Pain Med. 2012;13(4):507-517.
105. Skurtveit S, Furu K, Borchgrevink P, et al. To what extent does a cohort of new users of
weak opioids develop persistent or probable problematic opioid use? Pain. 2011;152(7):1555-
1561.
106. Solomon DH, Rassen JA, Glynn RJ, et al. The comparative safety of analgesics in older
adults with arthritis. Arch Intern Med. 2010;170(22):1968-1976.
107. Sullivan MD, Edlund MJ, Fan MY, et al. Risks for possible and probable opioid misuse
among recipients of chronic opioid therapy in commercial and medicaid insurance plans: The
TROUP Study. Pain. 2010;150(2):332-339.
108. Sullivan MD, Von Korff M, Banta-Green C, et al. Problems and concerns of patients
receiving chronic opioid therapy for chronic non-cancer pain. Pain. 2010;149(2):345-353.
109. Vijayaraghavan M, Penko J, Guzman D, et al. Primary care providers' judgments of
opioid analgesic misuse in a community-based cohort of HIV-infected indigent adults. J Gen
Intern Med. 2011;26(4):412-418.
110. Watson CP, Watt-Watson JH, Chipman ML. Chronic noncancer pain and the long term
utility of opioids. Pain Res Manag. 2004;9(1):19-24.
111. Webster LR, Webster RM. Predicting aberrant behaviors in opioid-treated patients:
preliminary validation of the Opioid Risk Tool. Pain Med. 2005;6(6):432-442.
108
112. Wiedemer NL, Harden PS, Arndt IO, et al. The opioid renewal clinic: a primary care,
managed approach to opioid therapy in chronic pain patients at risk for substance abuse. Pain
Med. 2007;8(7):573-584.
113. Wild JE, Grond S, Kuperwasser B, et al. Long-term safety and tolerability of tapentadol
extended release for the management of chronic low back pain or osteoarthritis pain. Pain Pract.
2010;10(5):416-427.
114. Wilsey BL, Fishman SM, Tsodikov A, et al. Psychological comorbidities predicting
prescription opioid abuse among patients in chronic pain presenting to the emergency
department. Pain Med. 2008;9(8):1107-1117.
115. Wunsch MJ, Cropsey KL, Campbell ED, et al. OxyContin use and misuse in three
populations: substance abuse patients, pain patients, and criminal justice participants. J Opioid
Manag. 2008;4(2):73-79.
116. Ytterberg SR, Mahowald ML, Woods SR. Codeine and oxycodone use in patients with
chronic rheumatic disease pain. Arthritis Rheum. 1998;41(9):1603-1612.
117. Edlund MJ, Martin BC, Russo JE, et al. The role of opioid prescription in incident opioid
abuse and dependence among individuals with chronic noncancer pain: the role of opioid
prescription. Clin J Pain. 2014;30(7):557-564.
118. Grattan A, Sullivan MD, Saunders KW, et al. Depression and prescription opioid misuse
among chronic opioid therapy recipients with no history of substance abuse. Ann Fam Med.
2012;10(4):304-311.
119. Martel MO, Dolman AJ, Edwards RR, et al. The association between negative affect and
prescription opioid misuse in patients with chronic pain: the mediating role of opioid craving. J
Pain. 2014;15(1):90-100.

109
120. Matteliano D, Chang YP. Describing prescription opioid adherence among individuals
with chronic pain using urine drug testing. Pain Manag Nurs. 2015;16(1):51-59.
121. Miller M, Barber CW, Leatherman S, et al. Prescription opioid duration of action and the
risk of unintentional overdose among patients receiving opioid therapy. JAMA Intern Med.
2015;175(4):608-615.
122. Passik SD, Narayana A, Yang R. Aberrant drug-related behavior observed during a 12-
week open-label extension period of a study involving patients taking chronic opioid therapy for
persistent pain and fentanyl buccal tablet or traditional short-acting opioid for breakthrough pain.
Pain Med. 2014;15(8):1365-1372.
123. Robinson JP, Dansie EJ, Wilson HD, et al. Attitudes and Beliefs of Working and Work-
Disabled People with Chronic Pain Prescribed Long-Term Opioids. Pain Med. 2015;16(7):1311-
1324.
124. Sekhon R, Aminjavahery N, Davis CN, Jr., et al. Compliance with opioid treatment
guidelines for chronic non-cancer pain (CNCP) in primary care at a Veterans Affairs Medical
Center (VAMC). Pain Med. 2013;14(10):1548-1556.
125. Setnik B, Roland CL, Sommerville KW, et al. A multicenter, primary care-based, open-
label study to identify behaviors related to prescription opioid misuse, abuse, and diversion in
opioid-experienced patients with chronic moderate-to-severe pain. J Pain Res. 2015;8:361-373.
126. Turner BJ, Liang Y. Drug Overdose in a Retrospective Cohort with Non-Cancer Pain
Treated with Opioids, Antidepressants, and/or Sedative-Hypnotics: Interactions with Mental
Health Disorders. J Gen Intern Med. 2015;30(8):1081-1096.

110
127. Turner JA, Saunders K, Shortreed SM, et al. Chronic opioid therapy urine drug testing in
primary care: prevalence and predictors of aberrant results. J Gen Intern Med. 2014;29(12):1663-
1671.
128. Wasan AD, Ross EL, Michna E, et al. Craving of prescription opioids in patients with
chronic pain: a longitudinal outcomes trial. J Pain. 2012;13(2):146-154.
129. Yang Z, Wilsey B, Bohm M, et al. Defining risk of prescription opioid overdose:
pharmacy shopping and overlapping prescriptions among long-term opioid users in medicaid. J
Pain. 2015;16(5):445-453.
130. Zgierska A, Wallace ML, Burzinski CA, et al. Pharmacological and toxicological profile
of opioid-treated, chronic low back pain patients entering a mindfulness intervention randomized
controlled trial. J Opioid Manag. 2014;10(5):323-335.
131. Dunbar SA, Katz NP. Chronic opioid therapy for nonmalignant pain in patients with a
history of substance abuse: report of 20 cases. J Pain Symptom Manage. 1996;11(3):163-171.
132. Manchikanti L, Pampati V, Damron KS, et al. Prevalence of prescription drug abuse and
dependency in patients with chronic pain in western Kentucky. J Ky Med Assoc.
2003;101(11):511-517.
133. Milligan K, Lanteri-Minet M, Borchert K, et al. Evaluation of long-term efficacy and
safety of transdermal fentanyl in the treatment of chronic noncancer pain. J Pain. 2001;2(4):197-
204.
134. Moulin DE, Iezzi A, Amireh R, et al. Randomised trial of oral morphine for chronic non-
cancer pain. Lancet. 1996;347(8995):143-147.
111
135. Quang-Cantagrel ND, Wallace MS, Magnuson SK. Opioid substitution to improve the
effectiveness of chronic noncancer pain control: a chart review. Anesth Analg. 2000;90(4):933-
937.
136. Roth SH, Fleischmann RM, Burch FX, et al. Around-the-clock, controlled-release
oxycodone therapy for osteoarthritis-related pain: placebo-controlled trial and long-term
evaluation. Arch Intern Med. 2000;160(6):853-860.
137. Zedler B, Xie L, Wang L, et al. Risk factors for serious prescription opioid-related
toxicity or overdose among Veterans Health Administration patients. Pain Med.
2014;15(11):1911-1929.
138. Zenz M, Strumpf M, Tryba M. Long-term oral opioid therapy in patients with chronic
nonmalignant pain. J Pain Symptom Manage. 1992;7(2):69-77.
139. Gudin JA, Mogali S, Jones JD, et al. Risks, management, and monitoring of combination
opioid, benzodiazepines, and/or alcohol use. Postgrad Med. 2013;125(4):115-130.
140. Vowles KE, McEntee ML, Julnes PS, et al. Rates of opioid misuse, abuse, and addiction
in chronic pain: a systematic review and data synthesis. Pain. 2015;156(4):569-576.
141. Bryant J, Passey ME, Hall AE, et al. A systematic review of the quality of reporting in
published smoking cessation trials for pregnant women: an explanation for the evidence-practice
gap? Implement Sci. 2014;9:94.
142. Hopewell S, Boutron I, Altman DG, et al. Incorporation of assessments of risk of bias of
primary studies in systematic reviews of randomised trials: a cross-sectional study. BMJ Open.
2013;3(8):e003342.
143. Aronson JK, Derry S, Loke YK. Adverse drug reactions: keeping up to date. Fundam
Clin Pharmacol. 2002;16(1):49-56.

112
144. Kahan MM. The opioid crisis in North America. Can Fam Physician. 2011;57(5):536;
author reply 537-539.
145. Kane-Gill SL, Smithburger PL, Williams EA, et al. Published cases of adverse drug
reactions: has the quality of reporting improved over time? Ther Adv Drug Saf. 2015;6(2):38-44.
146. Moher D, Liberati A, Tetzlaff J, et al. Preferred reporting items for systematic reviews
and meta-analyses: the PRISMA statement. Int J Surg. 2010;8(5):336-341.
147. Moher D, Hopewell S, Schulz KF, et al. CONSORT 2010 explanation and elaboration:
updated guidelines for reporting parallel group randomised trials. BMJ. 2010;340:c869.
148. Benchimol EI, Smeeth L, Guttmann A, et al. The REporting of studies Conducted using
Observational Routinely-collected health Data (RECORD) statement. PLoS Med.
2015;12(10):e1001885.
149. Gomes T, Mamdani MM, Paterson JM, et al. Trends in high-dose opioid prescribing in
Canada. Can Fam Physician. 2014;60(9):826-832.
150. Poppe C, Devulder J, Mariman A, et al. Chronic pain therapy: an evolution from solo-
interventions to a holistic interdisciplinary patient approach. Acta Clin Belg. 2003;58(2):92-97.
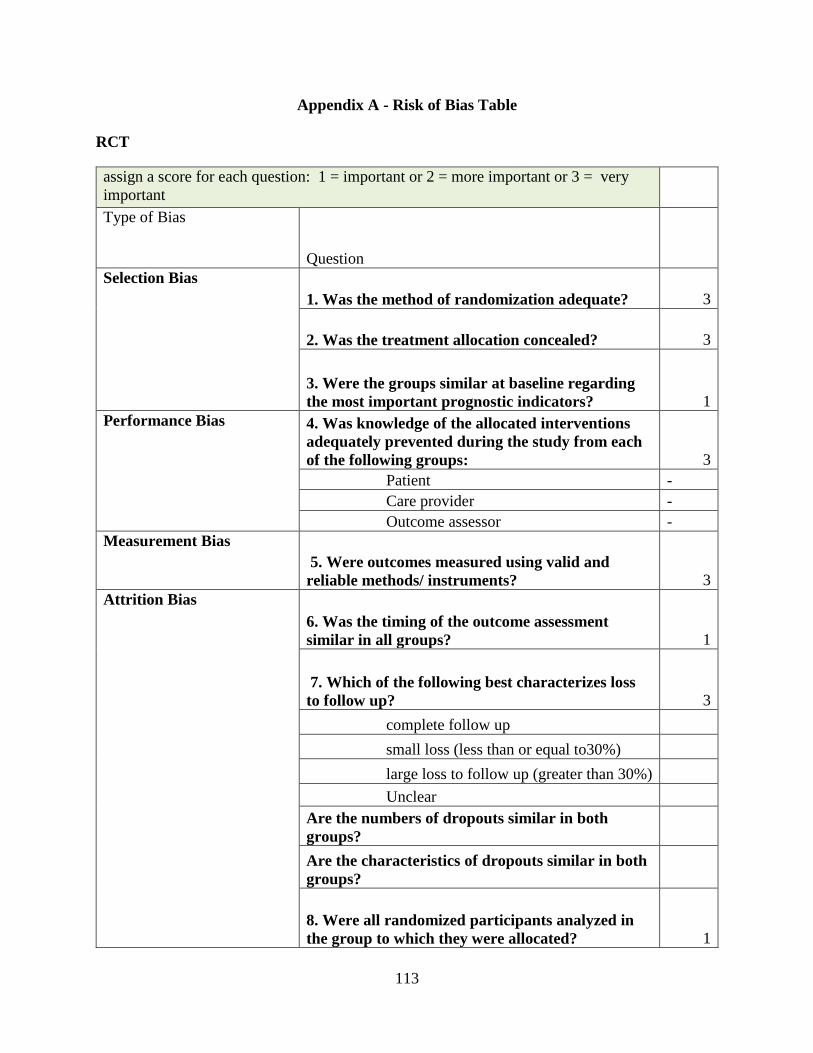
113
Appendix A - Risk of Bias Table
RCT
assign a score for each question: 1 = important or 2 = more important or 3 = very
important
Type of Bias
Question
Selection Bias
1. Was the method of randomization adequate? 3
2. Was the treatment allocation concealed? 3
3. Were the groups similar at baseline regarding
the most important prognostic indicators? 1
Performance Bias 4. Was knowledge of the allocated interventions
adequately prevented during the study from each
of the following groups: 3
Patient -
Care provider -
Outcome assessor -
Measurement Bias
5. Were outcomes measured using valid and
reliable methods/ instruments? 3
Attrition Bias
6. Was the timing of the outcome assessment
similar in all groups? 1
7. Which of the following best characterizes loss
to follow up? 3
complete follow up
small loss (less than or equal to30%)
large loss to follow up (greater than 30%)
Unclear
Are the numbers of dropouts similar in both
groups?
Are the characteristics of dropouts similar in both
groups?
8. Were all randomized participants analyzed in
the group to which they were allocated? 1
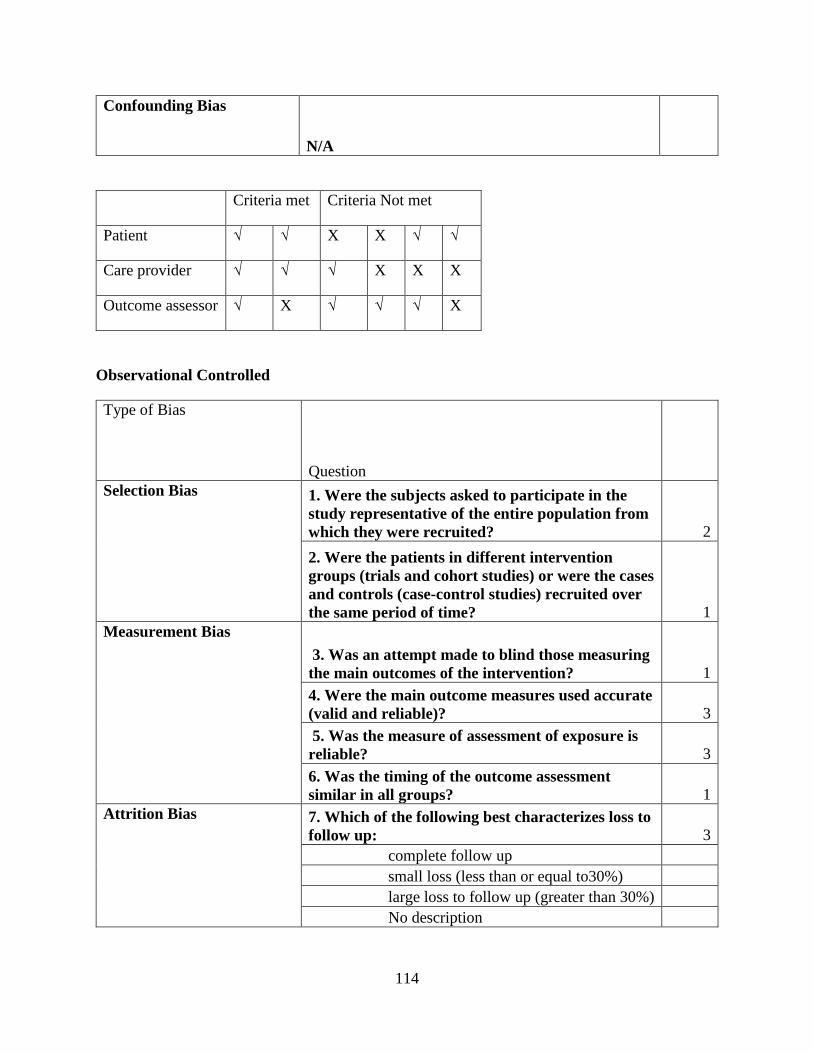
114
Confounding Bias
N/A
Criteria met Criteria Not met
Patient √ √ X X √ √
Care provider √ √ √ X X X
Outcome assessor √ X √ √ √ X
Observational Controlled
Type of Bias
Question
Selection Bias 1. Were the subjects asked to participate in the
study representative of the entire population from
which they were recruited? 2
2. Were the patients in different intervention
groups (trials and cohort studies) or were the cases
and controls (case-control studies) recruited over
the same period of time? 1
Measurement Bias
3. Was an attempt made to blind those measuring
the main outcomes of the intervention? 1
4. Were the main outcome measures used accurate
(valid and reliable)? 3
5. Was the measure of assessment of exposure is
reliable? 3
6. Was the timing of the outcome assessment
similar in all groups? 1
Attrition Bias 7. Which of the following best characterizes loss to
follow up: 3
complete follow up
small loss (less than or equal to30%)
large loss to follow up (greater than 30%)
No description

115
Are the numbers of dropouts similar in both
groups? n/a*
Are the characteristics of dropouts similar in both
groups? n/a*
Confounding Bias 8. Were main potential confounders measured
using valid and reliable methods/instruments? 3
9. Were baseline characteristics comparable
between groups? If unbalanced, were differences
appropriately controlled in the analysis? 3
Observational Non-Controlled
Type of Bias
Question Score
Measurement Bias 1. Were the main outcome
measures used accurate
(valid and reliable)? 3

116
Appendix B – Risk of Bias Flow Chart
Judging ROB criteria
Example:
Q1 (Very important question)
Yes No Unclear
Q2 (More important question)
Yes No Unclear
Q3 (Important question)
Yes No Unclear
Criteria Met Unclear if criteria met due to insufficient information
Criteria not met
Judgement can be made by the reviewer
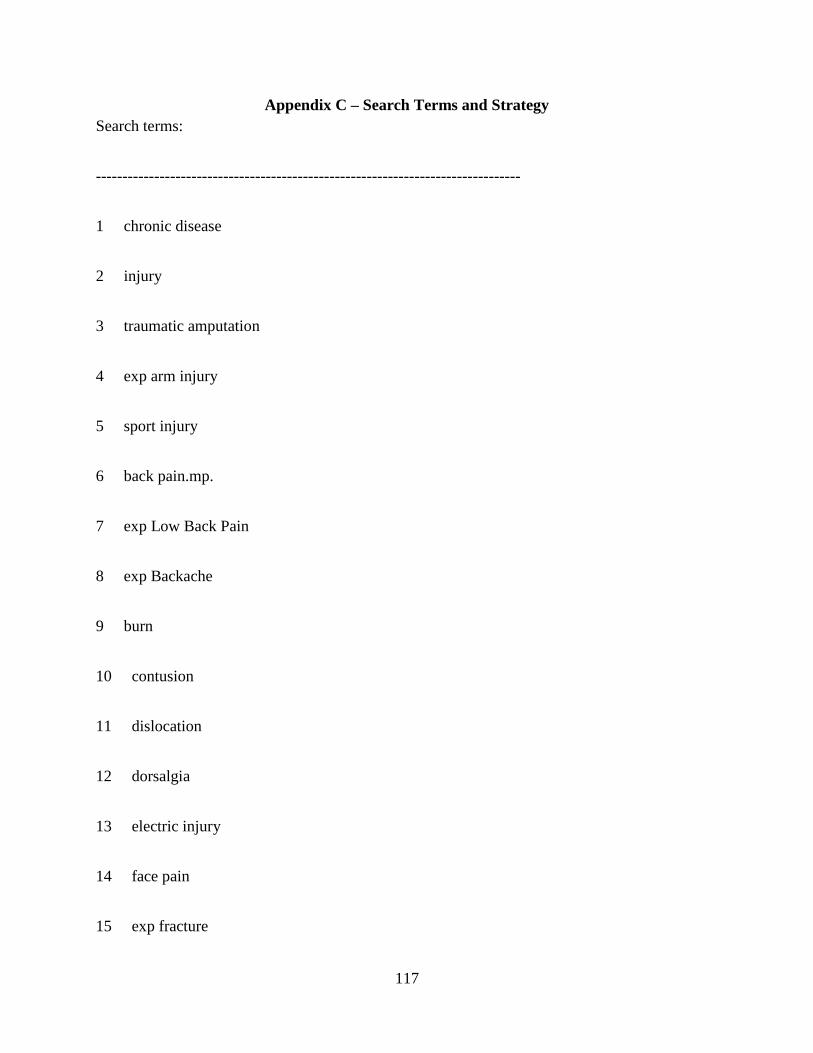
117
Appendix C – Search Terms and Strategy
Search terms:
--------------------------------------------------------------------------------
1 chronic disease
2 injury
3 traumatic amputation
4 exp arm injury
5 sport injury
6 back pain.mp.
7 exp Low Back Pain
8 exp Backache
9 burn
10 contusion
11 dislocation
12 dorsalgia
13 electric injury
14 face pain
15 exp fracture

118
16 cartilage fracture
17 exp hand injury
18 headache
19 "headache and facial pain"
20 exp hip injury
21 exp ischialgia
22 laceration
23 exp leg injury
24 exp leg pain
25 limb pain
26 (lumbar adj pain).mp.
27 metatarsalgia
28 exp migraine
29 multiple trauma
30 myalgia
31 exp neck injury
32 neck pain

119
33 nociceptive pain
34 exp occupational accident
35 exp rupture
36 shoulder pain
37 soft tissue injury
38 exp spinal cord injury
39 spine injury
40 exp tendon injury
41 exp nervous system injury
42 traffic accident
43 musculoskeletal pain
44 coccyx.mp.
45 coccydynia.mp.
46 sciatica.mp.
47 spondylosis.mp.
48 lumbago.mp.
49 back disorder$.ti,ab.

120
50 or/1-49
51 chronic pain
52 chronic pain.ti,ab.
53 or/51-52
54 50 and 53
55 pain
56 arthralgia
57 arthritis
58 exp osteoarthritis
59 chronic arthritis
60 rheumatoid arthritis
61 breakthrough pain
62 chronic pain
63 chronic daily headache
64 chronic tension headache
65 chronic cluster headache
66 new daily persistent headache
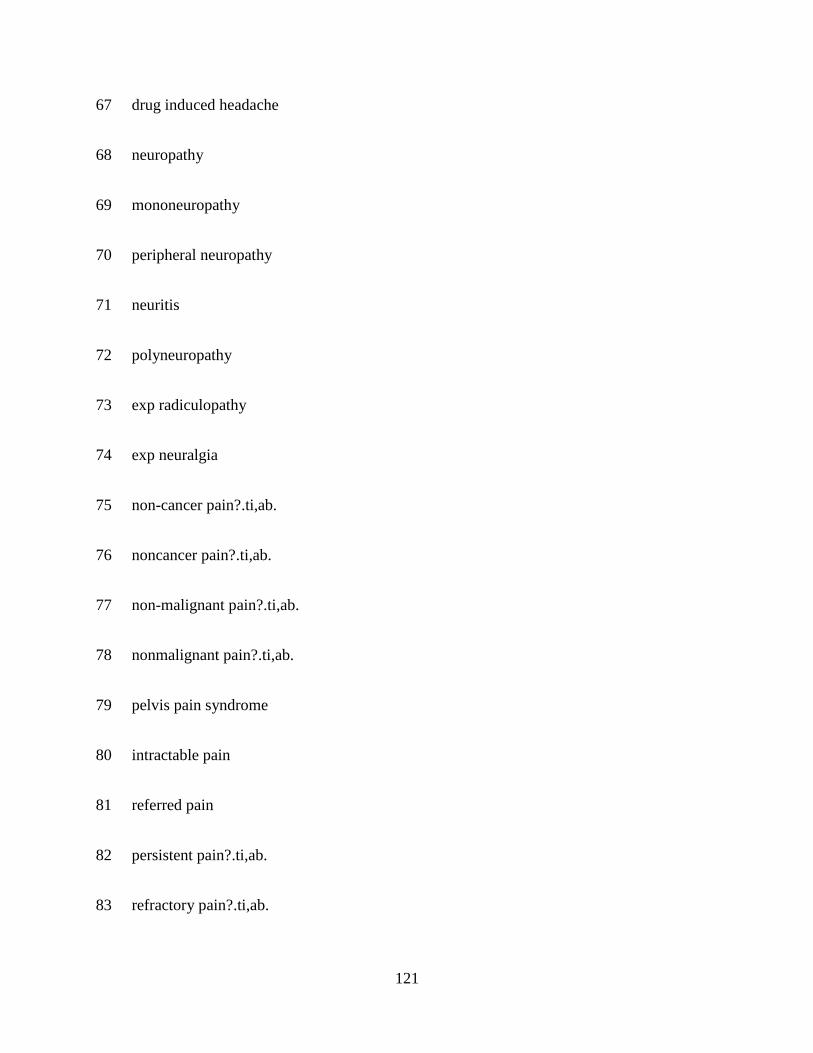
121
67 drug induced headache
68 neuropathy
69 mononeuropathy
70 peripheral neuropathy
71 neuritis
72 polyneuropathy
73 exp radiculopathy
74 exp neuralgia
75 non-cancer pain?.ti,ab.
76 noncancer pain?.ti,ab.
77 non-malignant pain?.ti,ab.
78 nonmalignant pain?.ti,ab.
79 pelvis pain syndrome
80 intractable pain
81 referred pain
82 persistent pain?.ti,ab.
83 refractory pain?.ti,ab.

122
84 or/55-83
85 54 or 84
86 narcotic analgesic agent
87 buprenorphine
88 codeine
89 fentanyl
90 hydrocodone
91 hydromorphone
92 levorphanol
93 pethidine
94 methadone
95 morphine
96 morphine sulfate
97 (narcotic? or opiate?).ti,ab.
98 opiate
99 opioid$.mp.
100 oxycodone

123
101 ibuprofen plus oxycodone
102 oxycodone plus paracetamol
103 oxymorphone
104 oxyneo.ti,ab.
105 pentazocine
106 paracetamol plus pentazocine
107 dextropropoxyphene
108 dextropropoxyphene napsilate
109 dextropropoxyphene plus paracetamol
110 dextropropoxyphene plus paracetamol
111 tramadol
112 paracetamol plus tramadol
113 butorphanol
114 tapentadol
115 or/86-114
116 (abilit$ adj3 work$).ti,ab.
117 absenteeism

124
118 daily life activity
119 exp affect
120 emotional disorder
121 walking
122 walking difficulty
123 physical mobility
124 anxiety
125 car driving
126 driving ability
127 (benefit? adj2 duration?).ti,ab.
128 ADL disability
129 daily task?.ti,ab.
130 depression
131 major depression
132 mood disorder
133 disability
134 disability benefit?.ti,ab.

125
135 disability claim?.ti,ab.
136 disability duration.ti,ab.
137 disabled person
138 insurance
139 disability leave.ti,ab.
140 disability management.ti,ab.
141 disability payment?.ti,ab.
142 disability pension?.ti,ab.
143 disability prevention.ti,ab.
144 domestic activit$.ti,ab.
145 domestic skill?.ti,ab.
146 domestic task?.ti,ab.
147 productivity
148 exp emotion
149 exp employability
150 employee performance.ti,ab.
151 employment

126
152 employment status
153 frustration
154 functional abilit$.ti,ab.
155 functional assessment
156 functional evaluation?.ti,ab.
157 functional disease
158 functional limitation?.ti,ab.
159 functional outcome?.ti,ab.
160 functional status
161 happiness
162 health
163 adolescent health
164 "men's health"
165 sexual health
166 "women’s health"
167 health behavior
168 "attitude to health"
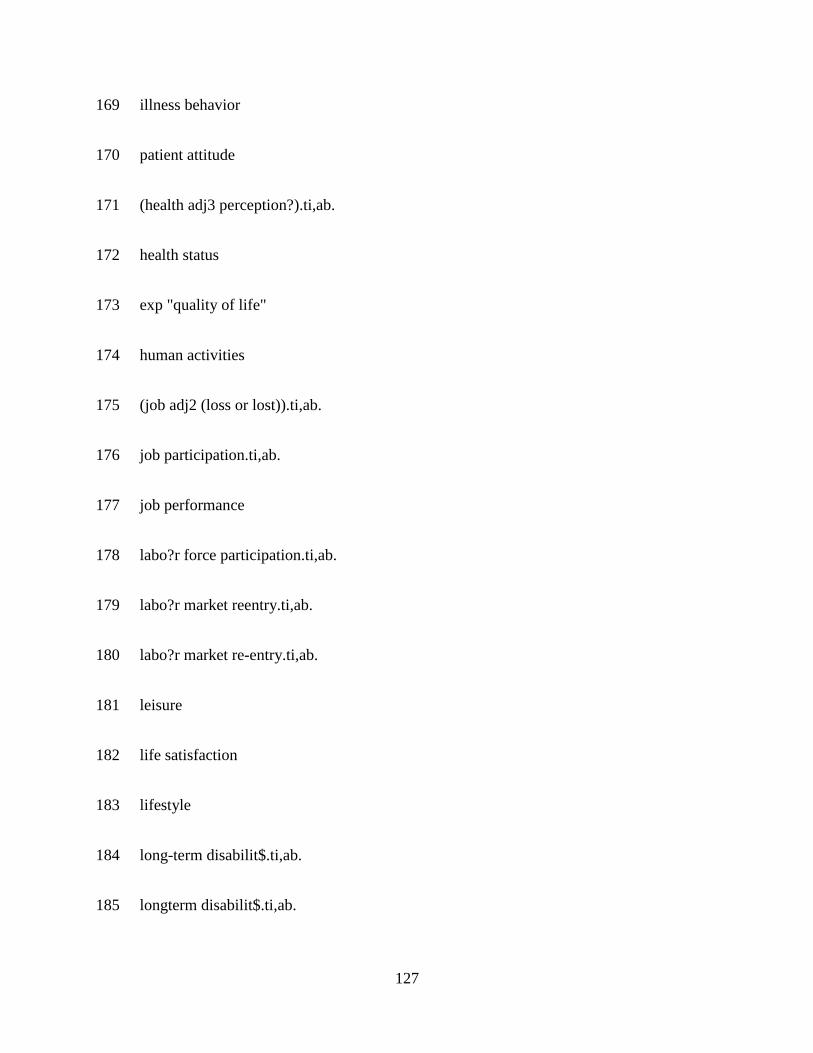
127
169 illness behavior
170 patient attitude
171 (health adj3 perception?).ti,ab.
172 health status
173 exp "quality of life"
174 human activities
175 (job adj2 (loss or lost)).ti,ab.
176 job participation.ti,ab.
177 job performance
178 labo?r force participation.ti,ab.
179 labo?r market reentry.ti,ab.
180 labo?r market re-entry.ti,ab.
181 leisure
182 life satisfaction
183 lifestyle
184 long-term disabilit$.ti,ab.
185 longterm disabilit$.ti,ab.

128
186 ((loss or lost) adj2 time).ti,ab.
187 ((loss or lost) adj2 work$).ti,ab.
188 (maintenance adj2 work).ti,ab.
189 medical leave
190 exp mental health
191 occupational disabilit$.ti,ab.
192 occupational function$.ti,ab.
193 occupational integration.ti,ab.
194 patient reported outcome?.ti,ab.
195 personal activit$.ti,ab.
196 personal care.ti,ab.
197 personal impairment.ti,ab.
198 personal limitation?.ti,ab.
199 personal management.ti,ab.
200 satisfaction
201 personal task?.ti,ab.
202 exp motor activity

129
203 exercise
204 fitness
205 physical activity
206 physical capacity
207 physical function$.ti,ab.
208 physical well-being.ti,ab.
209 pleasure
210 presenteeism.ti,ab.
211 productivity
212 distress syndrome
213 psychological well being
214 convalescence
215 reemploy$.ti,ab.
216 re-employ$.ti,ab.
217 (return$ adj2 employment).ti,ab.
218 (return$ adj3 work$).ti,ab.
219 role function$.ti,ab.

130
220 role participation.ti,ab.
221 RTW.ti,ab.
222 exp self care
223 self-rated health.ti,ab.
224 sexual behavior
225 sexual dysfunction
226 sexual satisfaction
227 short-term disabilit$.ti,ab.
228 shortterm disabilit$.ti,ab.
229 sick list$.ti,ab.
230 health insurance
231 national health insurance
232 private health insurance
233 public health insurance
234 exp sleep
235 exp sleep disorder
236 human relation

131
237 family relation
238 social behavior
239 social life
240 social network
241 family life
242 intimacy
243 job adaptation
244 recreation
245 social participation
246 social interaction
247 (stay$ adj3 work$).ti,ab.
248 mental stress
249 task performance
250 underactivity.ti,ab.
251 under activity.ti,ab.
252 unemployment
253 vitality.ti,ab.

132
254 wellbeing
255 work
256 work capacity
257 work disability
258 work function$.ti,ab.
259 work impairment?.ti,ab.
260 work incapacity.ti,ab.
261 work limitation?.ti,ab.
262 work outcome?.ti,ab.
263 work participation.ti,ab.
264 job performance
265 (work adj2 re-entry).ti,ab.
266 (work adj2 reentry).ti,ab.
267 work readiness.ti,ab.
268 work$ reintegration?.ti,ab.
269 work$ re-integration?.ti,ab.
270 work resumption?

133
271 work status.ti,ab.
272 workman compensation
273 exp suicide
274 accident
275 occupational accident
276 traffic accident
277 sick day?.ti,ab.
278 job satisfaction
279 exp school
280 exp education
281 extracurricular activit$.ti,ab.
282 family involvement.ti,ab.
283 relationship?.ti,ab.
284 marriage
285 divorce
286 memory
287 relocat$.ti,ab.

134
288 panic
289 social isolation
290 kinesiophobia.ti,ab.
291 immobilization
292 catastrophizing
293 or/116-292
294 death
295 accidental death
296 respiration depression
297 brain death
298 sudden death
299 drowning
300 excess dose?.ti,ab.
301 fatality
302 drug fatality
303 mortality
304 non-fatal$.ti,ab.

135
305 intoxication
306 drug intoxication
307 drug overdose
308 morphine addiction
309 premature mortality
310 hospitalization
311 intensive care
312 emergency
313 emergency care
314 emergency treatment
315 emergency health service
316 suicide
317 central nervous system depression
318 respiratory failure
319 or/294-318
320 (aberrant adj3 behavio?r).ti,ab.
321 behavior disorder

136
322 (abuse? and opioid$).mp.
323 abuse liability.ti,ab.
324 addiction
325 analgesic agent abuse
326 crime
327 violence
328 diversion?.mp.
329 doctor shopping.ti,ab.
330 drug abuse
331 drug abuse pattern
332 drug dependence
333 drug misuse
334 drug seeking behavior
335 "excessive use".ti,ab.
336 "hazardous use?".mp.
337 "heavy use?".mp.
338 "illegal use?".mp.

137
339 "illicit use?".mp.
340 intoxication?.mp.
341 drug control
342 "non-prescription use?".mp.
343 opiate addiction
344 "problem use".ti,ab.
345 psychoactive effect?.mp.
346 harm reduction
347 high risk behavior
348 risk reduction
349 street drug
350 withdrawal syndrome
351 drug withdrawal
352 intravenous drug abuse
353 substance abuse
354 snort$.mp.
355 crush$.mp.
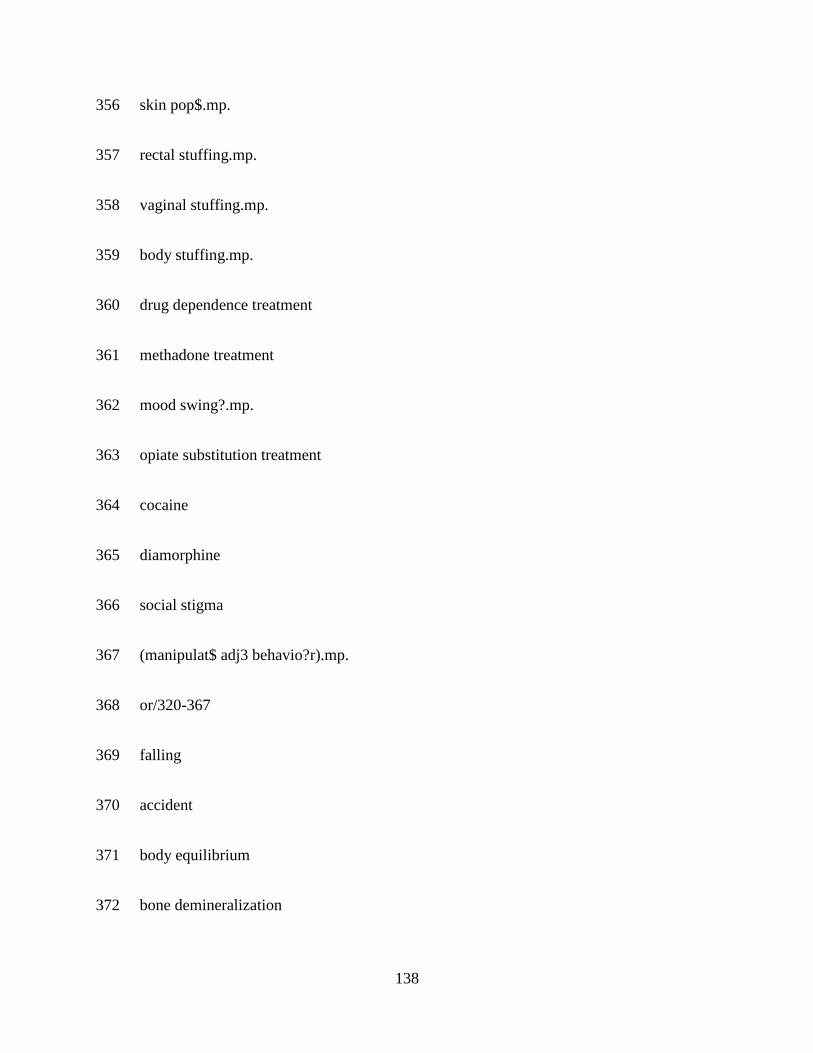
138
356 skin pop$.mp.
357 rectal stuffing.mp.
358 vaginal stuffing.mp.
359 body stuffing.mp.
360 drug dependence treatment
361 methadone treatment
362 mood swing?.mp.
363 opiate substitution treatment
364 cocaine
365 diamorphine
366 social stigma
367 (manipulat$ adj3 behavio?r).mp.
368 or/320-367
369 falling
370 accident
371 body equilibrium
372 bone demineralization

139
373 bone density
374 osteolysis
375 bone mass
376 bone strength
377 exp bone
378 home accident
379 exp fracture
380 injury
381 cartilage fracture
382 occupational accident
383 exp metabolic bone disease
384 osteoporosis
385 postural instability.mp.
386 postural stability.mp.
387 slip$.mp.
388 stumbl$.mp.
389 trip$.mp.

140
390 tumbl$.mp.
391 emergency
392 emergency care
393 exp emergency treatment
394 emergency health service
395 hospitalization
396 hospital admission
397 or/369-396
398 293 or 319 or 368 or 397
399 85 and 115 and 398
400 exp anesthesia
401 exp labor
402 labor pain
403 exp delivery pain
404 child birth
405 "immature and premature labor"
406 premature labor
141
407 pediatrics
408 pediatric rehabilitation
409 pediatric advanced life support
410 pediatric hospital
411 exp pediatric surgery
412 Parkinson disease
413 parkinsonism
414 exp fertility
415 exp palliative therapy
416 terminal care
417 newborn
418 newborn intensive care
419 perioperative period
420 kidney disease
421 kidney arteriovenous fistula
422 kidney colic
423 kidney collecting tubule

142
424 kidney dysfunction
425 or/400-424
426 399 not 425
427 animals/ or nonhuman
428 human
429 427 not 428
430 426 not 429
431 embryo/ or infant/ or child/ or preschool child/ or school child
432 adolescent/ or adult/ or aged
433 431 not 432
434 430 not 433
435 embryo/ or infant/ or child/ or preschool child/ or school child
436 adolescent/ or adult/ or aged
437 435 not 436
438 434 not 437
439 limit 438 to (book or book series or conference abstract or conference paper or
"conference review" or editorial or erratum or letter or note or conference proceeding or report or
short survey or trade journal)

143
440 438 not 439

144

145

146