a manual for a laboratory information management system - usgs
TRANSCRIPT

A MANUAL FOR A LABORATORYINFORMATION MANAGEMENT SYSTEM(LIMS) FOR LIGHT STABLE ISOTOPES—VERSION 7.0
U.S. GEOLOGICAL SURVEY
Open-File Report 98-284Revision of Open-File Report 97-812

A MANUAL FOR A LABORATORYINFORMATION MANAGEMENT SYSTEM(LIMS) FOR LIGHT STABLE ISOTOPES—VERSION 7.0
By Tyler B. Coplen
U.S. GEOLOGICAL SURVEY
Open-File Report 98-284Revision of Open-File Report 97-812
Reston, Virginia
1998

U.S. DEPARTMENT OF THE INTERIORBruce Babbitt, Secretary
U.S. GEOLOGICAL SURVEYThomas J. Casadevall, Acting Director
For additional information write to: Copies of this report can be purchased from:
Chief, Isotope Fractionation Project U.S. Geological SurveyU.S. Geological Survey Branch of Information ServicesMS 431 - National Center Box 25286, Federal CenterReston, Virginia 20192 Denver, Colorado 80225-0286

iii
CONTENTS
Abstract .................................................................................................................................................1Introduction ..........................................................................................................................................2
Hardware Requirements ...................................................................................................................3Software Requirements.....................................................................................................................3Installation Instructions ....................................................................................................................4
Installation on a single computer from the Internet....................................................................4Installation on a single computer from diskettes ........................................................................6Installation on a network...........................................................................................................7Installation of version 1.4 from the Internet...............................................................................8Installation of version 1.4 from diskettes...................................................................................9
Instructions for Removing LIMS for Light Stable Isotopes 7.0 (Uninstallation)..............................10Concepts................................................................................................................................................11Example Database..................................................................................................................................20
Introduction....................................................................................................................................20Login New Samples Form..............................................................................................................26Import New Project Button.............................................................................................................28Search for a Project Form ...............................................................................................................29Project Form ..................................................................................................................................29Sample Form..................................................................................................................................34Add Samples To Be Analyzed Form...............................................................................................38Print Sample Range Form...............................................................................................................40Printing a Template and the Samples To Be Analyzed Form...........................................................40Analysis Form................................................................................................................................51Add or Change Analyses Form.......................................................................................................51Import Analyses Button..................................................................................................................55
LIMS Default Import Format ..................................................................................................56Analytical Precision Import Format ........................................................................................56Europa Scientific Import Format .............................................................................................57Finnigan MAT Import Format ................................................................................................57
Introduction.....................................................................................................................57Dual Inlet ........................................................................................................................57GCC................................................................................................................................58EA...................................................................................................................................59
Micromass Import Format.......................................................................................................59LIMS For Light Stable Isotopes Configuration Form......................................................................60Correction Factors and Normalization Equations Form...................................................................62Print Samples In Progress Form .....................................................................................................69Edit Samples In Progress Form.......................................................................................................71Store Samples In Progress Form.....................................................................................................77Add Samples To Samples In Progress Form ...................................................................................78Normalization Equation Ranges Form ............................................................................................78
Installing a New Database File...............................................................................................................79Importing Projects Using the Excel 5.0 Template...................................................................................81
iv
Special Features .....................................................................................................................................85LIMS For Light Stable Isotopes Configuration Form......................................................................85
Alternative Field Names .........................................................................................................85Form Colors............................................................................................................................85Software Switches...................................................................................................................86Paper Size...............................................................................................................................86Default Country ......................................................................................................................86Other Parameters.....................................................................................................................87
Reference Samples Form................................................................................................................89Prefixes & Next Sample # Button...................................................................................................89Mass Spectrometer Configuration Form .........................................................................................91Faraday Cup Information Form ......................................................................................................93Mass Spectrometer Error Codes Form ............................................................................................93NAWID, NWQL, and Access Forms ..............................................................................................93Media Form....................................................................................................................................93Procedure Form..............................................................................................................................93Low Procedure Codes Form ...........................................................................................................94High Procedure Codes Form...........................................................................................................94How to Add Media, Procedures, Low Procedures, and High Procedures .........................................96How to Delete Media, Procedures, Low Procedures, and High Procedures......................................97Creating and Editing Templates......................................................................................................97Using LIMS with 14C ....................................................................................................................105Using LIMS with 3H.....................................................................................................................106Using LIMS with CFCs................................................................................................................107
Analysis Import Formats .....................................................................................................................109Introduction..................................................................................................................................109LIMS Default Import Format ......................................................................................................109Analytical Precision Analysis Import Format ..............................................................................111Europa Scientific Analysis Import Format ...................................................................................112Finnigan MAT Analysis Import Format ......................................................................................112
Dual Inlet Import Format .....................................................................................................113GCC Import Format .............................................................................................................116EA Import Format ................................................................................................................116
Micromass Analysis Import Format ............................................................................................117Sample Export Formats .......................................................................................................................119
Introduction..................................................................................................................................119LIMS Default Sample Export Format ..........................................................................................119Sample Export Format for Analytical Precision ..........................................................................119Sample Export Format for Europa Scientific ...............................................................................119Sample Export Format for Finnigan MAT ..................................................................................121Sample Export Format for Micromass ........................................................................................121
Files found on diskettes .......................................................................................................................122Acknowledgments ...............................................................................................................................123References ......................................................................................................................................124
v
ILLUSTRATIONS
Figure 1. LIMS Main Menu ...........................................................................................................222. Login sample tasks .........................................................................................................243. Tasks to analyze and report data ....................................................................................254. Login New Samples form ...............................................................................................275. Search for project form ..................................................................................................306. Project form ....................................................................................................................317. Example of project report after being logged in .............................................................338. Example of a small labels report ....................................................................................359. Sample form ...................................................................................................................36
10. Add Samples To Be Analyzed form ...............................................................................3911. Example of Print Samples Range report .........................................................................4112. Samples To Be Analyzed form for the EA for C and N ................................................4213. Example of List of Samples To Be Analyzed for the EA for C & N template ..............45
14a. Page 1 of multi-sheet template (EA for C & N) for an elemental analyzer ...................4614b. Page 2 of multi-sheet template (EA for C & N) for an elemental analyzer........................4714c. Page 3 of multi-sheet template (EA for C & N) for an elemental analyzer........................4814d. Page 4 of multi-sheet template (EA for C & N) for an elemental analyzer........................4914e. Page 5 of multi-sheet template (EA for C & N) for an elemental analyzer........................5015. Analysis form .................................................................................................................5216. Add or Change Analyses form.........................................................................................5417. LIMS For Light Stable Isotopes Configuration form........................................................6118. Analyses and Normalization Equations form ...................................................................6319. Normalization Equation Coefficients form.......................................................................6520. Example of Normalization Equation Coefficients report ..................................................6721. Print Samples In Progress form ......................................................................................7022. Example of Print Samples In Progress report .................................................................7223. Example of Print Samples In Progress report with Print Aliquot IDs
and Interfering Masses check boxes enabled ....................................................................7324. Edit Samples In Progress form .......................................................................................7425. Example of report for δ
15N results of compound specific isotope-ratio analyses(C4 through C9) ..............................................................................................................76
26. Alt.xls Excel 5.0 template for creating projects................................................................8327. Reference Samples form..................................................................................................9028. Mass Spectrometer Configuration form ...........................................................................9229. Templates form ...............................................................................................................98
30a. Micromass CO2-H2O equilibration system in author’s laboratory ..................................9930b. Template for this system set up with 48 samples .............................................................9931. Example of List of Samples To Be Analyzed for the CO2-H2O equilibration template
with 48 samples ............................................................................................................10032. Example of the 4-page CO2-H2O equilibration template with 48 samples. ..................10133. Ports & Configuration form...........................................................................................104

vi
TABLES
Table 1. Media codes used in LIMS version 7.0 ............................................................................122. List of sample prefixes used in LIMS version 7.0 ............................................................133. List of isotopes, isotope ratios, and CFCs that can be selected in LIMS version 7.0 .........144. List of sample preparation procedures used in LIMS version 7.0 .....................................155. Minimum and Maximum Sample Preparation Procedure Codes in LIMS
version 7.0 as a Function of Isotope Code Between Codes 2 and 15 ................................956. Fields of the LIMS version 7.0 default table for importing isotopic analyses .................1107. Fields of the Analytical Precision Microsoft Access table of isotopic
analyses, LIMSInput .....................................................................................................1128. Fields of the Europa Scientific file of isotopic analyses, Mercury.txt .............................1139. Fields of the LIMS version 7.0 default sample export table, SamplesToBeAnalysed…..120
10. Fields of the sample export file for Europa Scientific..................................................120

1
A MANUAL FOR A LABORATORY INFORMATION MANAGEMENT SYSTEM (LIMS) FORLIGHT STABLE ISOTOPES—VERSION 7.0
Tyler B. Coplen
ABSTRACT
The reliability and accuracy of isotopic data can be improved by utilizing database software to (i)store information about samples, (ii) store the results of mass spectrometric isotope-ratio analyses ofsamples, (iii) calculate analytical results using standardized algorithms stored in a database, (iv)normalize stable isotopic data to international scales using isotopic reference materials, and (v) generatemulti-sheet paper templates for convenient sample loading of automated mass-spectrometer samplepreparation manifolds. Such a database program is presented herein. Major benefits of this systeminclude (i) an increase in laboratory efficiency, (ii) reduction in the use of paper, (iii) reduction inworkload due to the elimination or reduction of retyping of data by laboratory personnel, and (iv)decreased errors in data reported to sample submitters. Such a database provides a complete record ofwhen and how often laboratory reference materials have been analyzed and provides a record of whatcorrection factors have been used through time. It provides an audit trail for stable isotope laboratories.
Since the original publication of the manual for LIMS for Light Stable Isotopes, the isotopes 3H,3He, and 14C, and the chlorofluorocarbons (CFCs), CFC-11, CFC-12, and CFC-113, have been added tothis program.
Information on downloading this report and downloading code and databases is provided at theInternet address: http://water.usgs.gov/software/geochemical.html, or from the author at the E-mailaddress: [email protected].

2
INTRODUCTION
Over the past two decades, the laboratory of the Isotope Fractionation Project of the WaterResources Division of the U.S. Geological Survey in Reston, Virginia, has analyzed water and solidsamples for the determination of stable hydrogen, carbon, nitrogen, oxygen, and sulfur isotope ratios fornumerous individuals. In order to track these samples, we have developed a laboratory informationmanagement system (LIMS) based on the relational database program Microsoft Access1. This manualdiscusses this database program and is an update of Coplen (1997). This database program now includesthe isotopes 3H, 3He, and 14C, and the chlorofluorocarbons (CFC): CFC-11, CFC-12, and CFC-113. 3Husers are directed especially to pay particular attention to the section on 3H beginning on page 106. 14Cusers should pay particular attention to the section on 14C beginning on page 105. CFC users should payparticular attention to the section on CFCs beginning on page 107.
Access is available as one of the applications in Microsoft Office Professional. Access allowsstorage of more data than can be stored in spreadsheet programs. An Access database can be larger than100 MB. Because LIMS is a relational database application, data are stored in separate tables in such away as to eliminate or minimize repeating of data.
LIMS for Light Stable Isotopes has proven useful in laboratories that (i) receive samples for isotopicanalysis from numerous individuals, and (ii) perform at least a few thousand isotopic analyses per year. Users who do not meet at least one, and likely both these criteria, will probably not find worthwhile theinvestment in time that it takes to learn and fully apply LIMS for Light Stable Isotopes.
Experience has shown that approximately one week is required to become reasonably acquaintedwith LIMS for Light Stable Isotopes and set it up for operation in a laboratory. The user should plan oneday for the tutorial (see page 20) and three to four days to set up a new database and begin importingisotopic analyses from mass spectrometers in the laboratory. Although this may seem like a largeinvestment in time, current users report that the rewards in increased productivity and better organizationin a laboratory far outweigh this setup cost.
LIMS for Light Stable Isotopes can store information about samples and analytical results for thefollowing isotope ratios, isotopes, and CFCs:
2H/1H 11B/10B 18O/16O 37Cl/35Cl 129Xe/132Xe3H 13C/12C 21Ne/20Ne 38Ar/36Ar 136Xe/132Xe3He 14C 22Ne/20Ne 40Ar/36Ar CFC-114He 15N/14N 30Si/28Si 83Kr/84Kr CFC-127Li/6Li 17O/16O 34S/32S 86Kr/84Kr CFC-113
1 The use of trade, brand or product names in this report is for identification purposes only and doesnot constitute endorsement by the U.S. Geological Survey.

3
Two versions of LIMS for Light Stable Isotopes are available. LIMS for Light Stable Isotopesversion 7.0 operates on the Microsoft Windows 95 or Windows NT 4.0 (or higher) platforms underAccess 97. LIMS for Light Stable Isotopes version 1.4, runs on the Microsoft Windows 3.1 or theWindows for Workgroups 3.11 platform under Microsoft Access 2.0. The two versions of LIMS forLight Stable Isotopes are nearly identical. This report discusses version 7.0, but version 1.4 users can usethis manual also. Where important differences occur, they are discussed herein.
Hardware Requirements
LIMS for Light Stable Isotopes 7.0 requires an IBM compatible computer. A 486, Pentium, orPentium Pro computer with 16 MB of memory is satisfactory; however, a 32-MB Pentium isrecommended. A speed of at least 66 MHz is needed, but 200 or 233 MHz is desirable to minimizedelays while Access runs some queries. Although a 15-inch monitor can be used, a 17-inch monitor willbe easier to use because small fonts are used on some of the forms. Although a 640 x 480 pixel videodriver and video adaptor card may display text at its largest size, a screen resolution of 800 x 600 pixelsworks satisfactorily with 17-inch monitors, and a screen resolution of 1024 x 768 pixels workssatisfactorily with 21-inch monitors. A mouse is required.
A Hewlett Packard LaserJet III printer was used to generate the reports in this report. If adifferent printer is employed, the user should confirm that the fonts available are sufficiently smallthat no information is omitted from the user’s reports.
Software Requirements
LIMS for Light Stable Isotopes 7.0 (abbreviated LIMS from here on) runs under MicrosoftAccess 97 and requires Microsoft Windows 95 or NT 4.0 (or higher). LIMS will not function properlywith Access 95. Access 97 is one of the applications in the Microsoft Office Professional suite. Installation of Microsoft Excel 97 is also required. (Note that installation of Excel 5.0 is useful, but notrequired for LIMS 1.4 users.)
The complete LIMS application or only the most recent code file can be downloaded from theInternet (http://water.usgs.gov/software/geochemical.html). Additionally, LIMS can be supplied by theauthor (E-mail: [email protected]) on eight 1.44 MB diskettes (version 1.4 can be supplied with onlyfive diskettes—the code file is much smaller). Diskettes for LIMS for Light Stable Isotopes 7.0 consistof:

4
Program Files (4 diskettes) To be installed on the user’s computer
New Database For the user's laboratory database. To be installed aftercompleting the tutorial.
Example Database Installed with program files in the selected folder.
Excel 5.0 Template for For use by those submitting samples to user'sCreating Sample Projects laboratory.
Example Import Formats Contains ten files with isotopic analyses that can beimported into the LIMS example database.
Installation Instructions
As is done for many database applications, LIMS is divided into two database files. One is the code(Lm7code.mdb) and the other is the backend database (LM4DATA.mdb, Lm7data.mdb, or similar)where all of the user's isotopic data reside. The location of these two files on the user's computer isunimportant—they can reside in separate folders or in the same folder on the user's hard drive (or onanother computer on the user's network). LIMS runs on a single computer or on computers networkedtogether using Microsoft Windows for Workgroups or Microsoft Windows NT 4.0 (or higher).
Installation on a single computer from the Internet
The installation on a single computer is as follows:
1. Install Microsoft Access 97 on your computer (from Microsoft Office Professional 97 ifdesired) if not already installed. Two optional components must be installed when Access 97 isinstalled:
i. Database Drivers option under Data Access components, and
ii. Microsoft Graph under Office Tools.
2. Install Microsoft Excel 97 on your computer (from Microsoft Office Professional 97 if desired)if not already installed.
3. Decide upon the directory (and subdirectory) that will contain LIMS and create it. In theauthor's laboratory C:\Share\Limsdata is used.
4. Download the file, Lims7.exe, from http://water.usgs.gov/software/geochemical.html and move

5
it to the directory (and subdirectory) decided upon in the step above.
5. Lims7.exe is a self-extracting compacted file that can create five subdirectories and populatethem with files. Expand Lims7.exe by clicking the Start button, clicking RUN, and thentyping the following into the command line:
[drive]:\ [root directory] \ [sub directories chosen in step 3] \ lims7.exe -d
For example, the author would type:
C:\Share\Limsdata\lims7.exe -d
Five subdirectories should be created and populated with files. All of these files are backups ofthe original files. The user should make copies of them as requested below.
6. Copy the file Lm7code.mdb in the subdirectory “ \code” to the directory (and subdirectory)decided upon in step 3 above.
7. Copy the files in the subdirectory “ \expl-db” to a diskette and label it “ LIMS for Light StableIsotopes 7.0—Example Database.”
8. Copy the files in the subdirectory “ \imp-fmts” to a diskette and label it “ LIMS for Light StableIsotopes 7.0—Example Import Formats.”
9. Copy the file in the subdirectory “ \new-db” to a diskette and label it “ LIMS for Light StableIsotopes 7.0—New Database.”
10. Copy the files in the subdirectory “ \xls-tpl” to a diskette and label it “ LIMS for Light StableIsotopes 7.0—Excel 5.0 Template for Creating Sample Projects.”
11. Copy the file Lm7datae.mdb from the subdirectory “ \expl-db” to the directory (andsubdirectory) decided upon in step 3 above.
This completes the installation on a single computer. Multiple copies of the LIMS 7.0 code can beinstalled on a network, allowing more than one person to use your backend database at a time. See theinstructions on page 7.
After the features of LIMS have been explored using the example database (see page 20), a newdatabase (found on the LIMS New Database diskette, created above) can be installed (see page 79). Besure to delete the example database (or change its name or move it to another folder) to force LIMS toquery the user for the location of the new database.

6
Installation on a single computer from diskettes
The installation on a single computer is as follows:
1. Install Access 97 (from Microsoft Office 97 Professional if desired) if not already installed. Two optional components must be installed when Access 97 is installed:
a. Database Drivers option under the Data Access components, and
b. Microsoft Graph under Office Tools.
2. Install Excel 97 if not already installed.
3. Decide upon the name of the folder that will hold the backend database (the primary reservoirof the user’s data). In the author’s laboratory this folder is C:\SHARE\LIMSDATA.
4. Insert the diskette labelled “ LIMS for Light Stable Isotopes 7.0 Program Files Setup - Disk 1”into the computer.
5. Click Start.
6. Click Run.
7. Click Browse and locate “ setup.exe” on the diskette.
8. Click Open and follow the installation instructions. When asked for the folder in which tolocate LIMS, use that identified in step 3. The program will be installed. The installationprogram will prompt the user for each of the four program setup diskettes in turn.
9. Add “ LIMS 7.0” to the Start button menu if desired. The instructions can be found byselecting Help, searching for “ Start menu” and then for “ adding programs to” under the Startmenu. For Windows NT 4.0 the instructions are:
a. Click Start and then point to Settings.
b. Click Taskbar, and then click the Start Menu Programs tab.
c. Click Add, then click Browse.
d. Locate the program you want to add, and then double-click it.
e. Click Next, and then double-click the menu on which you want the program toappear.

7
f. Type the name that you want to see on the menu (LIMS 7.0, for example), and thenclick Finish.
g. If Windows NT 4.0 prompts you to choose an icon, click one, and then click Finish.
This completes the installation on a single computer. Multiple copies of the LIMS 7.0 code can beinstalled on a network, allowing more than one person to use your backend database at a time. See theinstructions below.
After the features of LIMS have been explored using the example database (see page 20), a newdatabase (found on the LIMS New Database diskette) can be installed (see page 79). Be sure to deletethe example database (or change its name or move it to another folder) to force LIMS to query the userfor the location of the new database.
Installation on a network
Multiple copies of the LIMS code can be installed computers on a network, allowing more than oneperson to use the backend database at a time. The installation is as follows:
1. First install LIMS on the computer on which the backend database will reside using either theInternet or diskette installation instructions above.
2. Share the folder that serves as the location of the backend database using Microsoft Explorer byright clicking the mouse (clicking the right-hand mouse button for right handed people) whenthe cursor is on the folder to be shared. Select sharing and enter a Share Name of your choice. In the author’s laboratory “ LIMSDATA” is used.
3. Copy the LIMS program code file, Lm7code.mdb, to each computer on your network asdesired.
Then, for each computer that contains Lm7code.mdb, do the following:
4. Install Access 97 (from Microsoft Office 97 Professional if desired) if not already installed. Two optional components must be installed when Access 97 is installed:
a. Database Drivers option under the Data Access components, and
b. Microsoft Graph under Office Tools.
5. Install Excel 97 if not already installed.

8
6. Open Microsoft Access.
7. Find Lm7code.mdb on this computer and open it.
8. Follow the installation instructions. LIMS will be unable to find the backend database and willprompt the user to find it. Click on the Network Neighborhood icon and find the backenddatabase in the directory shared in step 2 above. Once the paper size has been selected, clickthe Exit button.
9. Add “ LIMS 7.0” to the Start button menu if desired as shown above.
This completes the installation.
After the features of LIMS have been explored using the example database (see page 20), a newdatabase (found on the LIMS New Database diskette) can be installed (see page 79). Be sure to deletethe example database (or change its name or move it to another folder) to force LIMS to query the userfor the location of the new database.
Installation of version 1.4 from the Internet
The installation for LIMS 1.4 (the version for Microsoft Windows 3.1 and Microsoft Windows forWorkgroups) on a single computer are given below (for instructions on installing LIMS 1.4 on anetwork, contact the author):
1. Install Microsoft Access 2.0 on your computer (from Microsoft Office Professional if desired)if not already installed.
2. Decide upon the directory (and subdirectory) that will contain LIMS 1.4 and create it. In theauthor's laboratory C:\Share\Limsdata is used.
3. Download the file, LIMS4.EXE, from http://water.usgs.gov/software/geochemical.html, andmove it to the directory (and subdirectory) decided upon in the step above.
4. LIMS4.EXE is a self-extracting compacted file that can create five subdirectories and populatethem with files. Expand LIMS4.EXE by selecting “ Run,” from the Windows ProgramManager, and then typing the following into the command line:
[drive]:\ [root directory] \ [sub directories chosen in step 2] \ lims4.exe -d
For example, the author would type:
C:\Share\Limsdata\lims4.exe –d

9
Five subdirectories should be created and populated with files. All of these files are backups of theoriginal files. The user should make copies of them as requested below.
5. Copy the file LM4CODE.MDB in the subdirectory “ \CODE” to the directory (andsubdirectory) decided upon in step 2 above.
6. Copy the files in the subdirectory “ \EXPL-DB” to a diskette and label it “ LIMS for LightStable Isotopes 1.4—Example Database.”
7. Copy the files in the subdirectory “ \IMP-FMTS” to a diskette and label it “ LIMS for LightStable Isotopes 1.4—Example Import Formats.”
8. Copy the file in the subdirectory “ \NEW-DB” to a diskette and label it “ LIMS for Light StableIsotopes 1.4—New Database.”
9. Copy the files in the subdirectory “ \XLS-TPL” to a diskette and label it “ LIMS for LightStable Isotopes 1.4—Excel 5.0 Template for Creating Sample Projects.”
10. Copy the file LM4DATAE.MDB from the subdirectory “ \EXPL-DB” to the directory (andsubdirectory) decided upon in step 2 above.
11. Register Microsoft Graph by running the file GRAPH5.EXE using the Run command from theWindows Program Manager. It will indicate that it can only be run from within anotherprogram. To locate GRAPH5.EXE it may be easiest to use the command Browse.
This completes the installation. The user will probably find it useful to add a shortcut icon to one ofthe program groups in Microsoft Windows (see the Microsoft Windows manual for instructions). In thismanner, the user can double click on this icon, Access 2 will open, and LIMS will open automatically. You are now ready to begin the tutorial on page 20.
Installation of version 1.4 from diskettes
The Microsoft Windows version of LIMS (version 1.4) is smaller. The code is provided incompressed form on a single diskette. The installation for LIMS 1.4 on a single computer are givenbelow (for instructions on installing LIMS 1.4 on a network, contact the author):
1. Install Access 2.0 (from Microsoft Office Professional if desired) if not already installed.
2. Decide upon the directory (and subdirectory if desired) that will contain LIMS and create it. C:\SHARE\LIMSDATA is used in the author's laboratory.
3. Copy LM4DATAE.mdb from the diskette labelled “ Example Database” to the directory orsubdirectory created in step 2.

10
4. Copy LM4CODE.EXE from the diskette labelled “ Program File Setup - Disk 1” to thedirectory or subdirectory created in step 2.
5. Extract the code file by running LM4CODE.EXE using the Run command from the WindowsProgram Manager.
6. Register Microsoft Graph by running the file GRAPH5.EXE using the Run command from theWindows Program Manager. It will indicate that it can only be run from within anotherprogram. To locate GRAPH5.EXE it may be easiest to use the command Browse.
This completes the installation. The user will probably find it useful to add a shortcut icon to one of theprogram groups in Microsoft Windows (see the Microsoft Windows manual for instructions). In thismanner, the user can double click on this icon, Access 2 will open, and LIMS will open automatically.
Instructions for Removing LIMS for Light Stable Isotopes 7.0 (Uninstallation)
If LIMS was installed from the Internet, the user can open Microsoft Explorer and delete thefollowing:
1. Subdirectories “ \code” , “ \imp-fmts” , “ \new-db” , “ \xls-tpl” , and “ \expl-db” .
2. Files Lm7code.mdb, Lm7datae.mdb, Lm7data.mdb, Limsdata.log, Lm7prefs.mdb, Import.log,Lims_err.log.
If LIMS was installed from diskettes:
1. Insert the diskette labelled “ LIMS for Light Stable Isotopes 7.0 Program Files Setup - Disk 1”into the computer.
2. Click Start.
3. Click Run.
4. Click Browse and locate “ setup.exe” on the diskette.
5. Click Open and the LIMS installation program will check for installed component.
6. Click Uninstall and follow the instructions.

11
CONCEPTS
Most isotope laboratories can accept a variety of sample types. These sample types are called mediain LIMS terminology and represent the type of material or compounds analyzed. The current list ofmedia appears in table 1. There may be slight variations between table 1 and some versions of LIMSbecause media are added occasionally.
When samples are delivered to a laboratory, they normally are sent with a document listing thesamples and describing the analyses to be performed. In LIMS, this document is called the samplesubmission document. Before the samples can be analyzed, the samples must be logged in to LIMS. This activity is commonly called “ logging in samples.”
The date on the sample submission document is the submission date and is a key for storing thesamples in LIMS. A group of samples of a single medium comprises a project in LIMS. Suppose agroup of organic sludge samples for C and N isotopic analysis and water samples for δ
2H and δ18O
determination is submitted by Howard Q. Johnson. These samples must be logged in as two separateprojects with media numbers of 1 and 26 (see table 1). Note that the sample medium is the medium ofthe samples that arrives at the laboratory, not media that might be prepared during the sample preparationin the laboratory. Thus, coal samples submitted for δ
34S analysis might be converted to BaSO4 or Ag2Sduring sample preparation, but they would be logged in as medium 28 (C- and S-bearing material) or asmedium 69 (other S-bearing material) and not as medium 72 (sulfate mineral) or medium 66 (sulfidemineral). Note that users are free to delete and add media in LIMS as necessary for their specificlaboratory use. If a coal sample is to be analyzed for δ
2H, δ13C, and δ
34S, then it must be logged in twice. The reason for this is discussed below.
When samples arrive at the laboratory, each sample must have a unique identifier by which thesample submitter distinguishes his (her) samples. In LIMS this is called the Sample ID or the Field ID. When samples are logged into LIMS, LIMS will assign an alphabetic Prefix and an integer, separated bya hyphen, to each sample. This is called the Our Lab ID in LIMS, and it is the unique identifier bywhich LIMS knows each sample. Examples are N-3345, W-332, and R-10. The prefix is determined bythe medium. Possible prefixes are listed in table 2. Consider sample prefixes as “ cabinets” in whichsamples are stored. Water samples (for δ
2H and δ18O analysis) are stored in the “ W” cabinet and thus
have the prefix W. Carbonates are stored in the “ C” cabinet, and so on. Samples analyzed primarily fornitrogen and sulfur isotopic composition are given the prefixes N and S, respectively. The prefix R iscommonly used for gaseous reference samples, but one may choose samples with other prefixes for useas reference samples. Lastly, the prefix J is user definable. It is not used for any media. Originally itwas thought that it would be used for reference samples identified by Julian date, thus, the letter J. In alaboratory analyzing primarily extraterrestrial samples, the prefix J could be used for variousextraterrestrial media analyzed by the laboratory. Using this system samples are kept in numeric orderand they are easy to locate in cabinets, saving laboratory personnel time.

12
Table 1. Media codes used in LIMS version 7.0.
MediaCode
Prefix Description
1 W water (H & O)2 C Calcite3 C Dolomite4 C DIC5 G gaseous carbon dioxide6 G gaseous hydrogen8 R gaseous carbon dioxide reference10 R gaseous hydrogen reference12 R gaseous nitrogen reference14 R gaseous sulfur dioxide reference16 R gaseous oxygen reference20 G methane (H & C)21 G coal (H & C)22 G oil (H & C)23 G cellulose (H & C)24 G other H-bearing material25 G organic C26 G C- and N-bearing material27 G C- and O-bearing material28 G C- and S-bearing material29 G C- and Cl-bearing material30 G other C-bearing material31 C Aragonite45 C other carbonate46 G Graphite50 N pure nitrogen gas52 N N-bearing solid (salts, rock, etc)53 N organic N55 N water (dissolved nitrate)56 N water (dissolved ammonium)58 N other N- & O-bearing materials59 N other N-bearing material60 N nitrous oxide64 S water (dissolved sulfate)65 S water (dissolved sulfide)66 S sulfide mineral69 S other S-bearing material70 S gaseous sulfur dioxide71 S elemental sulfur72 S sulfate mineral79 G gaseous oxygen (analyzed as CO2)80 G gaseous oxygen (analyzed as O2 for 17O & 18O)81 G quartz (O & Si)82 G silicate rocks (O & Si)89 G other O-bearing material

13
Table 1. Media codes used in LIMS version 7.0 (contd).
Media
Code
Prefix Description
103 R Li reference material104 G water (dissolved Li)106 G phosphate mineral107 G Li (in silicates)109 G other Li-bearing material113 R B reference material114 G water (dissolved B)115 G B (in evaporites)118 G B (in rock)119 G other B-bearing material123 R gaseous silicon tetrachloride reference125 G elemental silicon126 G Silicate129 G other Si-bearing material133 R gaseous methyl chloride reference134 G water (dissolved Cl)139 G other Cl-bearing material
The samples in a project will comprise a range of samples. Thus, the water samples submitted byHoward Q. Johnson above might comprise the project whose samples range from W-3321 throughW-3355.
Once samples have been logged into LIMS and been given an Our Lab ID, they can be analyzed forisotopic composition. Samples cannot be analyzed prior to logging them in to LIMS because the OurLab ID needs to be entered in the sample ID field of the mass spectrometer analysis. In addition toregular submitters, it is useful to have some additional submitters, such as “ Reference” and “ Test.” Testand Reference have both submitted samples in the example database discussed below and are included inthe table of customers in this database.
Table 2. List of sample prefixes used in LIMS version 7.0.
Prefix Description
C Carbonate samplesG General samplesJ User definedN Samples submitted primarily for N isotopic analysisR Gaseous reference samplesS Samples submitted primarily for S isotopic analysisW Water samples

14
Samples may be analyzed for a variety of isotopes, isotope ratios, and CFCs (see Table 3).
Table 3. List of isotopes, isotoperatios, and CFCs that can be select-ed in LIMS version 7.0.
Code Description
2 2H/1H3 13C/12C5 15N/14N6 34S/32S7 17O/16O8 18O/16O10 7Li/6Li11 11B/10B12 30Si/28Si13 37Cl/35Cl14 14C15 3H16 3He17 4He18 38Ar/36Ar20 40Ar/36Ar21 21Ne/20Ne22 22Ne/20Ne23 83Kr/84Kr24 86Kr/84Kr25 129Xe/132Xe26 136Xe/132Xe27 CFC-1128 CFC-1229 CFC-113
Samples are prepared for isotopic analysis using set methods or procedures. Table 4 lists theprocedures (this list may differ slightly in some versions of LIMS) that can be selected. Procedures canbe edited, added, and deleted (see page 93) except that procedures that are currently used in other tablesin the database should not be deleted. The codes between 100 and 199 are miscellaneous codes for avariety of purposes. Thus, ion gauge readings of the sample and standard (161 and 162) can be stored. Concentrations of C, N, and S from elemental analyzers can be stored (codes 189, 190, and 191). Codes200 to 299 are for δ
2H procedures, codes 300 to 399 are for δ13C procedures, etc. The abbreviations “ DI”
and “ CF” are dual inlet and continuous flow.

15
Table 4. List of sample preparation procedures used in LIMS version 7.0.
Code Description
0 N/A100 M/z = 2 ion beam (sample)101 M/z = 2 ion beam (standard)102 M/z = 3 ion beam (sample)103 M/z = 3 ion beam (standard)104 M/z = 4 ion beam (sample)105 M/z = 4 ion beam (standard)106 M/z = 12 ion beam (sample)107 M/z = 12 ion beam (standard)108 M/z = 13 ion beam (sample)109 M/z = 13 ion beam (standard)110 M/z = 14 ion beam (sample)111 M/z = 14 ion beam (standard)112 M/z = 15 ion beam (sample)113 M/z = 15 ion beam (standard)114 M/z = 16 ion beam (sample)115 M/z = 16 ion beam (standard)116 M/z = 17 ion beam (sample)117 M/z = 17 ion beam (standard)118 M/z = 18 ion beam (sample)119 M/z = 18 ion beam (standard)120 M/z = 20 ion beam (sample)121 M/z = 20 ion beam (standard)122 M/z = 22 ion beam (sample)123 M/z = 22 ion beam (standard)124 M/z = 28 ion beam (sample)125 M/z = 28 ion beam (standard)126 M/z = 29 ion beam (sample)127 M/z = 29 ion beam (standard)128 M/z = 30 ion beam (sample)129 M/z = 30 ion beam (standard)130 M/z = 32 ion beam (sample)131 M/z = 32 ion beam (standard)132 M/z = 33 ion beam (sample)133 M/z = 33 ion beam (standard)134 M/z = 34 ion beam (sample)135 M/z = 34 ion beam (standard)136 M/z = 36 ion beam (sample)137 M/z = 36 ion beam (standard)138 M/z = 40 ion beam (sample)

16
Table 4. List of sample preparation procedures used in LIMS version 7.0 (contd).
Code Description
139 M/z = 40 ion beam (standard)140 M/z = 44 ion beam (sample)141 M/z = 44 ion beam (standard)142 M/z = 45 ion beam (sample)143 M/z = 45 ion beam (standard)144 M/z = 46 ion beam (sample)145 M/z = 46 ion beam (standard)146 M/z = 47 ion beam (sample)147 M/z = 47 ion beam (standard)148 M/z = 50 ion beam (sample)149 M/z = 50 ion beam (standard)150 M/z = 52 ion beam (sample)151 M/z = 52 ion beam (standard)152 M/z = 64 ion beam (sample)153 M/z = 64 ion beam (standard)154 M/z = 66 ion beam (sample)155 M/z = 66 ion beam (standard)160 Contamination161 Ion gauge (sample)162 Ion gauge (standard)163 Major ion beam (sample)164 Major ion beam (standard)165 Yield187 H concentration188 O concentration189 C concentration190 N concentration191 S concentration192 δ
2H received unexpectedly193 δ
13C received unexpectedly195 δ
15N received unexpectedly196 δ
34S received unexpectedly197 δ
17O received unexpectedly198 δ
18O received unexpectedly200 DI, δ
2H, (medium 6 & 10)201 DI, 2 mL, 30 deg., Pt equil., δ
2H, (medium 1)210 DI, Zn reduction, δ
2H, (medium 1)220 DI, U reduction, δ
2H, (medium 1)225 DI, combus. & U reduction, δ
2H, (media 20, 21, 22, 23, & 24)300 DI, Gaseous carbon dioxide. δ
13C, (media 5 & 8)

17
Table 4. List of sample preparation procedures used in LIMS version 7.0 (contd).
Code Description303 DI, Filtered, δ
13C, (medium 4)δ312 DI, 100% phosphoric acid, δ
13C, (medium 2, 3, 31, & 45)340 DI, CH4 combus. to CO2 δ
13C (medium 20)352 DI, Qtz sealed tube, 800 deg, δ
13C, (media 21, 22, 23, 25, 26, 27, 29, 30, & 46)354 CF, CO2 gas, δ
13C, (medium 8)355 CF, GCC, δ
13C, (media 25, 26, 27, 29, & 30)356 CF, EA, δ
13C, (media 21, 22, 23, 25, 26, 27, 28, 29, 30, & 46)500 DI, Gaseous nitrogen, δ
15N, (media 12 & 50)510 DI, Total N, solid sample, combust, δ
15N, (medium 52)515 DI, Organic sample, combust, δ
15N, (medium 53)520 DI, Diss. nitrate, FD1 (add KOH to pH > 9), FD2, δ
15N, (medium 55)522 DI, Diss. ammonium, FD1 (add H2SO4 to pH < 3), δ
15N, (medium 56)580 DI, δ
15N, (medium 26)580 DI, δ
15N, (medium 58)580 DI, δ
15N, (medium 59)582 CF, N2O, δ
15N, (medium 60)583 CF, GCC, δ
15N, (medium 26)583 CF, GCC, δ
15N, (medium 59)584 CF, EA, δ
15N, (medium 26)584 CF, EA, δ
15N, (medium 52)584 CF, EA, δ
15N, (medium 53)584 CF, EA, δ
15N, (medium 59)600 DI, Delta, δ
34S, (medium 14)600 DI, Delta, δ
34S, (medium 28)600 DI, Delta, δ
34S, (medium 64)600 DI, Delta, δ
34S, (medium 65)600 DI, Delta, δ
34S, (medium 66)600 DI, Delta, δ
34S, (medium 69)600 DI, Delta, δ
34S, (medium 70)600 DI, Delta, δ
34S, (medium 71)600 DI, Delta, δ
34S, (medium 72)662 CF, EA, δ
34S, (medium 28)662 CF, EA, δ
34S, (medium 64)662 CF, EA, δ
34S, (medium 65)662 CF, EA, δ
34S, (medium 66)662 CF, EA, δ
34S, (medium 69)662 CF, EA, δ
34S, (medium 71)662 CF, EA, δ
34S, (medium 72)688 CF, pure SO2, δ
34S, (medium 14)

18
Table 4. List of sample preparation procedures used in LIMS version 7.0 (contd).
Code Description
700 DI, δ17O of ref. or working std O2, (medium 16)
780 DI, δ17O of gaseous O2, (meduim 80)
800 DI, 2 mL equilibration δ18O, (medium 1)
809 DI, Guanidine H2O, δ18O, (medium 1)
810 DI, δ18O, (media 5, 8, 27, 64, 79, & 89)
820 DI, 25 deg., 100% phosphoric acid, δ18O, (media 2, 3, 31, & 45)
821 DI, 50 deg., 100% phosphoric acid, δ18O, (media 2, 3, 31, & 45)
850 DI, SO2, δ18O, (media 14, 70, & 72)
859 DI, User definable oxygen-isotope fractionation, δ18O, (media 2, 3, & 31)
860 DI, BrF5, δ18O, (media 81 & 82)
878 DI, δ18O on O2 gas converted to CO2, (media 16 & 80)
879 CF, δ18O on O2 gas converted to CO2, (media 16 & 80)
880 DI, δ18O on O2 gas as O2, (media 16 & 80)
881 CF, δ18O on O2 gas as O2, (media 16 & 80)
883 CF, convt. to O2 for analysis, δ18O, (media 27, 58, 81, 82, & 89)
884 CF, convt. to CO2 for analysis, δ18O, (media 27, 58, 79, 81, 82, & 89)
886 CF, pure CO2, δ18O, (media 5 & 8)
887 CF, N2O, δ18O, (medium 60)
888 CF, pure SO2, δ18O, (media 14 & 70)
890 DI, N-bearing material, δ18O, (media 55 & 58)
1030 δ7Li, (medium 103)
1040 δ7Li, (medium 104)
1060 δ7Li, (medium 106)
1070 δ7Li, (medium 107)
1090 δ7Li, (medium 109)
1130 δ11B, (medium 113)
1140 δ11B, (medium 114)
1150 δ11B, (medium 115)
1180 δ11B, (medium 118)
1190 δ11B, (medium 119)
1230 DI, δ30Si, (medium 123)
1240 DI, BrF5 δ30Si, (media 81, 82, 125, 126, & 129)
1320 DI, δ37Cl, (medium 29)
1330 DI, δ37Cl, (media 133 & 139)
1340 DI, diss. Cl, δ37Cl, (medium 134)
When samples are analyzed for isotopic composition, LIMS requires that each mass

19
spectrometric isotopic analysis have a unique integer value, known in LIMS as the analysis number. This is required for its relational database structure. In the case that a mass spectrometer measures twoisotopic ratios simultaneously, such as δ
13C and δ18O on CO2 with a mass spectrometer having three
Faraday-cup collectors, both isotope-ratio analyses can be stored with the same integer analysis number. For compound specific continuous flow isotopic analyses, δ values from as many as 999 peaks can bestored for each analysis number.
Because the majority of the samples analyzed by the author’s laboratory have been either wateror carbonate samples, each sample has normally required two isotopic analyses: δ
2H and δ18O for water
samples and δ13C and δ
18O for carbonates, for example. Thus, the LIMS Table of Samples has beendesigned to store and present conveniently two types of isotopic analyses for a medium. Usually, theanalysis of the element with the lower mass is the low analysis (or low procedure) and the other is thehigh analysis (or high procedure). One consequence of this scheme is that occasionally one may want toanalyze a sample for three isotopic ratios (C, N, and S, for example). There are two possible solutions tothis problem. One is to save the third isotopic ratio using a procedure code between 100 and 199. Asmany as 100 parameters can be stored for each analysis using these special procedure codes. For anexample of the use of these codes, see page 57. Alternatively, the user might log in the sample twice. For example, one might use medium 26 (C- & N-bearing material) and medium 69 (other S-bearingmaterial). If this is not acceptable, the user can modify the existing structure of LIMS and can add morefields to the Table of Samples and to the samples form. LIMS is reasonably flexible and can be modifiedby users. Users can add new media codes and procedure codes (see page 85), or delete existing ones.
Once samples have been analyzed, the isotopic analyses are imported into LIMS. The isotopicresults are “ corrected” using isotopic reference materials analyzed with the samples. The isotopic resultsare then saved in the table that contains the sample information. This activity is called “ storing data.” Once all the samples in a project have been analyzed and the isotopic results have been stored, the projectis reported. This is commonly called “ reporting results.” The next section is a tutorial that describesthese activities in more detail.

20
EXAMPLE DATABASE
Introduction
The tutorial that follows uses an example database to help the reader to familiarize himself or herselfwith the various forms and reports in LIMS, and it will illustrate where and how various types of data arestored in LIMS. To use the example database, the installation of LIMS must have been completed (seepage 6). If another database has been installed, you will need to temporarily change its name to forceLIMS to query the user for the file specifier of the example database. Start LIMS by selecting LIMS 7.0from the Start button menu or run Access 97 and open the file Lm7code.mdb.
The figures and text in this tutorial apply to the U.S. English regional settings for MicrosoftWindows. If another regional setting is used, reports and input will correspond to that setting. Thus, forSweden a date-time would be entered as 1996-09-30 16:32 and a depth of three and one-half meterswould be entered as 3,5. If LIMS indicates that an entry error has been made and that the entry needs tobe a numeric value, the user should check to be sure that the correct decimal separator (comma versusdecimal point) is being entered.
WARNING. The reports shown in this tutorial were printed using a Hewlett Packard LaserJet IIIprinter. Some printers will not support the same fonts as the HP LaserJet III. If the user’s printeremploys a font with wider characters, some characters may be omitted from LIMS reports. The usershould compare closely the printer output of Figs. 7, 11, 20, 22, 23, and 25 to ensure that no charactershave been omitted. In the event that characters have been omitted, the user should contact the author(e-mail [email protected]).
If LIMS has been used previously and a new database has been installed (either Lm7data.mdb orLM4DATA.mdb), the user should record any preferences or tokens that have been saved in theconfiguration table because they will be changed during this tutorial. After the tutorial is completed andthe new database is reinstalled, the user can edit these preferences and tokens to their values prior toexecution of the tutorial.
When one opens LIMS for the first time, the code module will be unable intentionally to locate thebackend database. A message similar to the following will appear:
Welcome to LIMS for Light Stable Isotopes. Please find the database for your samples andanalyses. For the tutorial it is Lm7datae.mdb.
The user should click OK. The file dialog form will appear and the user should locate the backenddatabase. For this tutorial this is the file Lm7datae.mdb and is found in the folder in which the LIMScode module, Lm7code.mdb, is found. (For LIMS 1.4 users, the backend database for this tutorial is thefile LM4DATAE.mdb). LIMS should then require a minute or so to complete linking to tables in thebackend database.

21
Once the code module connects with the tables in the backend database, a message similar to thefollowing may appear:
A previous LIMS preferences file has been found. LIMS will replaces the preferences andtokens in this new version of LIMS with those saved by the previous version of LIMS.
If this message does appear, click Cancel to begin a new tutorial session.
The following message will appear if a paper format for the printer has not been selected:
Welcome to LIMS for Light Stable Isotopes.
You need to select either U.S. or European A4 size paper for reports. This can be changed ata later date. LIMS will default to U.S. standard paper.
Choose no to use A4 paper for printing.
Click Yes or No as appropriate for your printer.
The LIMS Main Menu is now shown on the screen. Click Special Features and LIMS will promptthe user for the password. Enter the password supplied, and the Special Features subform will open onthe Main Menu (Fig. 1). The functions of the buttons on the Main Menu are summarized below.
Projects Opens the Search Projects form and allows the user to locate a project (groupof samples).
New Project Login Login samples to be analyzed.
Import New Project Login samples to be analyzed using the Excel diskette provided by the samplesubmitter.
Samples & Analyses Open the sample form with the desired sample, and open the analysis form ifthe sample has been analyzed.
Print Sample Range Prints a range of samples such as between C-4444 and C-4449.
Import Analyses Import isotopic analyses from a diskette written to by a mass spectrometer.
Print Templates Edit the list of samples to be analyzed and print a multi-sheet template forlaying out the samples for organized isotopic analysis.
Add or Change Analyses Add or Edit mass spectrometric isotopic analyses.
Correction Factors and Allows the user to adjust (“ correct” ) the isotopic data to account for drift inNormalization Equations the working standard, etc.
Normalization Equation Allows the user to view and print out the equations for the corrections made inRanges the step above.

22
Fig. 1. LIMS Main Menu.

23
Edit Samples In Progress Allows the user to view isotopic analyses of samples just analyzed and toignore analyses of samples in the calculation of their final δ value.
Print Samples In Progress Print the isotopic analyses of samples recently analyzed, calculating final δvalues where possible.
Store Samples In Progress Once the user is satisfied with the final δ value of a sample, the δ value issaved in the Table of Samples.
Add Samples to Samples Reevaluate the isotopic analysis that went into determining the final δ value ofIn Progress a sample.
Exit Exit LIMS and close Access 97.
About Information about LIMS for Light Stable Isotopes.
Config Edit the preferences, parameters, and tokens in LIMS.
Prefixes & Next Sample # Edit the integers of the Our Lab ID numbers assigned during login of samples.References Add, edit, or delete laboratory reference materials.
Mass Spec Install, edit, or delete a mass spectrometer.
Mass Spec Error Codes Add, edit, or delete mass spectrometric error codes.
Media Add, edit, or delete media.
Procedures Add, edit, or delete procedure codes.
Low Procedures Add, edit, or delete low procedure codes.
High Procedures Add, edit, or delete high procedure codes.
Data log Future use.
LIMS Log Review certain LIMS’ activities.
Import Log Summary of importing activities.
Error Log A log of LIMS errors.
Templates Add, edit, or delete the instructions for creating a multi-sheet paper templateused for laying out samples to be analyzed as a group (such as in a carousel).
The tasks necessary to login samples, analyze samples, and report isotopic results are shown in Figs.2 and 3. This tutorial takes the reader through these tasks. In Figs. 2 and 3, tasks are shown on the rightand the applicable Main Menu (Fig. 1) button to execute the task is shown on the left. For the readers’convenience, Figs. 2 and 3 are also shown (in the printed documentation only—not on the Internetdownload version) on the last page of this manual as a foldout page. The user should now turn to thispage and open it out so that it can be viewed as the reader trudges through this tutorial. Click Close toclose the Special Features subform.

24
Use This Button on Main Menu of LIMS for Light StableIsotopes to Execute TheseTasks
TASKS TO LOGINSAMPLES
(1) Samples received
New Project Login (2) Log in samples to add them to the Table Of Samples
Projects (3) Print labels
Projects (4) Add samples to Table Of Samples To Be Analyzed
(5) Label sample containers
(6) Put samples into cabinets for storage until analyzed
Fig. 2. Login sample tasks.

25
TASKS TO ANALYZE AND REPORTSAMPLES
Print templates (1) Generate Daily List of Samples to be Analyzed and Template
(2) Technician loads template with samples
(3) Analyze samples with mass spectrometer
(4) Save isotopic results to diskette
Import Analyses (5) Import isotopic results from diskette. (LIMS willadd samples to Table Of Samples In Progress.)
Correction Factors & NormalizationEquations
(6) Apply corrections to isotopic data
Print Samples In Progress (7) Print list of isotopic results in Table Of Samples In Progress
Edit Samples In Progress (8) Review and edit isotopic results
Print Templates (9) Add sample reruns to Table Of Samples To Be Analyzed
Store Samples In Progress (10) Store isotopic results to Table Of Samples and remove from Table Of Samples In Progress
Projects (11) Print Reports and/or save data to a diskette in ASCII or Excel 5.0 format
DoneFig. 3. Tasks to analyze and report data.

26
Login New Samples Form
When samples are delivered to a laboratory, they normally are sent with a document listing thesamples and describing the analyses to be performed. In LIMS this is called the sample submissiondocument. The date on this document is the submission date and is a key for storing projects, a group ofsamples of the same medium, in LIMS. Suppose a box of organic sludge samples from Howard Q.Johnson has arrived in the laboratory for isotopic analysis.
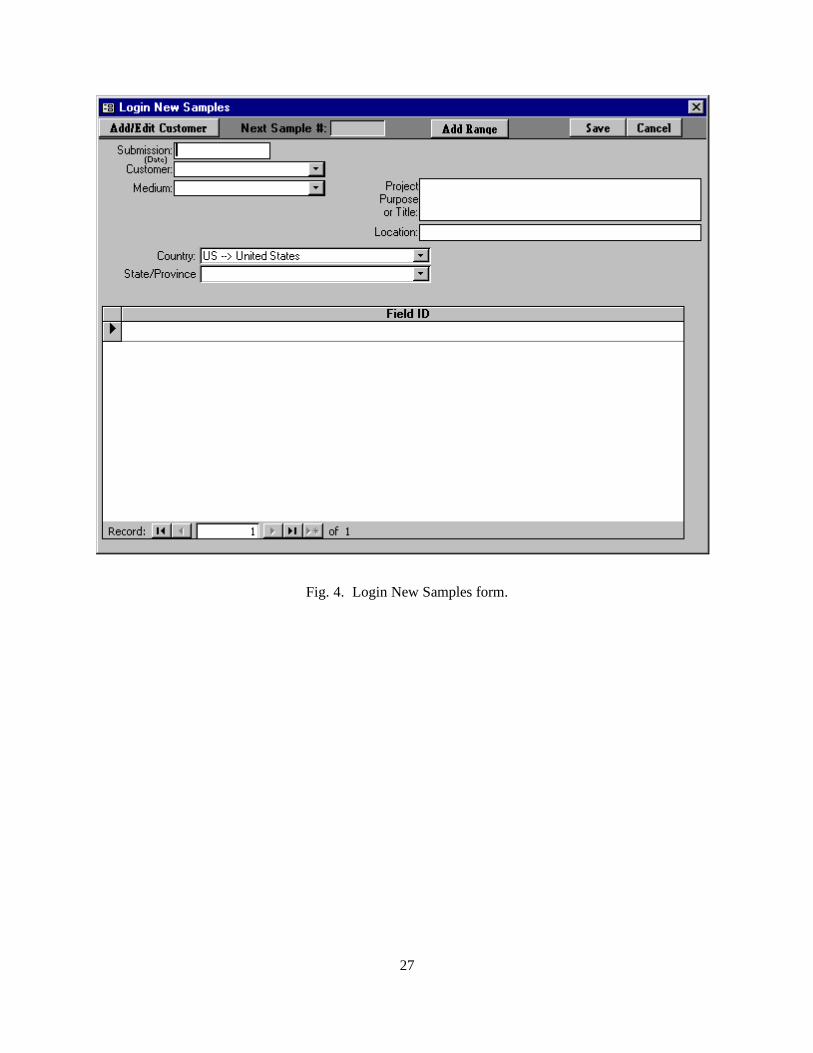
Click New Project Login on the Main Menu to open the Login New Samples form (Fig. 4). The
Login New Samples form allows the user to enter basic information about a project, such as the date,sample submitter, Sample ID’s, country, and other information. When the Login New Samples formopens, the country combo box is set to the default country selected in the LIMS For Light StableIsotopes Configuration form (see page 86 for instructions), which one accesses by clicking SpecialFeatures on the Main Menu. After completing the LIMS tutorial and installing a new database, the userwill want to change the default country to his or her own country.
Enter the date on the sample submission letter. If U.S. regional settings are in effect, the user wouldenter June 6, 1995 or 6/6/95 and press the Enter key. For Swedish regional settings, the user would enter1995-06-06. Select Johnson as the customer from the Customer combo (combination) box by clickingon the down arrow on the right side of the control to open it. Then select Johnson by clicking the mouseon Johnson. Select 26 as the medium (C- & N-bearing material). Set the Country to Canada. Set theState/Province to 002--> British Columbia. For the Project Purpose or Title enter Weller Toxics Study. For Location put Victoria, B.C. Howard Johnson submitted 18 samples with Sample ID’s of
Yta-01 through Yta-10
and
Yta-12 through Yta-19
that we want to add as a range. Click on Add Range. Since we will be omitting one Yta value, it willbe easier if we add 19 lines and delete 1. Enter Yta-01 in the From box. Press Enter. Enter Yta-19 inthe to box. Press Enter and the message similar to the following appears.
You have chosen to add 19 rows. Is this correct?
Click Yes. Now one needs to delete Yta-11. Using the vertical scroll control, bring Yta-11 into view. Click on the gray area at the far left of the screen in the row Yta-11. This row should be selected(blackened). Press the Delete key on the keyboard (or click the right mouse key and select Cut). Amessage similar to the following should appear:
You are about to delete 1 record(s).
27
Fig. 4. Login New Samples form.

28
If you click Yes, you won’t be able to undo this Delete operation. Are you sure you want todelete these records?
Select Yes and save the project by clicking Save. A message similar to the following
Create project record6/6/95 Johnson, Howard QG-13 to G-30
appears. Select OK. The project has now been added to the database and the second task in Fig. 2 iscompleted.
A comment about the values entered in the Add Range form above is useful. The user might betempted to enter Yta-1 (instead of Yta-01) and Yta-19. If these values are entered, LIMS responds withthe message
Invalid Range
because LIMS is unable to determine correct sample IDs. (This problem may be attacked in a futureversion of LIMS.)
In any one project, Sample IDs must be unique. If one adds two samples with identical Sample IDs,a message similar to the following appears.
The changes you requested to the table were not successful because they would createduplicate values in the index, primary key, or relationship. Change the data in the field orfields that contain duplicate data, remove the index, or redefine the index to permit duplicateentries and try again.
This is Microsoft Access’ way of informing the user that one of the Sample IDs will need to be changedto continue.
Import New Project Button
The second way to add a project to LIMS is by importing sample headings (the information abouteach sample such as collection date, latitude, etc.) and project information previously stored on a disketteas an Excel 5 spreadsheet by the sample submitter—use the diskette labelled Excel 5.0 Template forCreating Sample Projects (see page 81) and click Import New Project on the Main Menu (but don't do itnow). This method has the great advantage that the sample submitter enters all of the Sample IDs; thus,laboratory personnel do not need to retype any of them. Any mistakes are the responsibility of thesample submitter!

29
Search for a Project Form
Now is a good time to print a project report and to print adhesive-backed labels for the samples justentered (the third task in Fig. 2). These tasks are performed from the Projects form.
Click Projects on the Main Menu. The Search for a project form (Fig. 5) should open. In thesubform (the light area on the form), the entry
5/15/96 Reference G-12 Acetanilide for GCC tests
or similar is highlighted. The first column contains the submission date of the project, the second is thelast name of the sample submitter, the third is the range of samples in the project, the fourth is the projecttitle or purpose, and the fifth is the location. One can use the vertical scroll bar or the up and down arrowkeys to move to another project. Note that there are about 36 projects in the database. Several projectscontain only a single sample. The first twenty or so projects have been found useful in the author’slaboratory. These include:
1. Several test or “ garbage” samples for testing, such as W-1, C-1, etc,2. C-3, G-3, N-3, and S-3 are defined to be a blank (with no boat) for an elemental analyzer,3. C-4, G-4, N-4, and S-4 are defined to be an empty boat for an elemental analyzer, and4. R-1 through R-5 are defined to be continuous flow reference gases, H2, N2, etc.
To open a project either double-click it, the user would click on the project to select it and depressthe Enter key or click Find (but don't do it yet).
One can limit searches by using the search tools on this form. Suppose one only wants to see thesamples submitted by Johnson. From the Name combo box select Johnson. Click Search. Only thefive Johnson projects should be displayed. One can limit searches with multiple criteria. Suppose oneonly wants to see Johnson's prefix G samples. From the Prefix combo box select “ G--> General” andthen click Search. Two projects are shown. If only one project had been displayed, LIMS would haveopened the project.
Project Form
Select the project “ 6/6/95 Johnson” and double-click on it to open the Project form (see Fig. 6). On the Project form those text boxes which cannot be edited are shown with a darker background. If onewants to edit an entry, one must first click Edit. This feature is used throughout LIMS to preventworkers from accidently changing data. The following describes the buttons on the Project form:
List displays all the projects in the database.

30
Fig. 5. Search for project form.

31
Fig. 6. Project form.

32
The four navigation buttons, |<, <, >, and >|, allow one to go to the first, the previous, the next, andthe last project, respectively. The navigation buttons work the same way on other forms in LIMS. When the current project is the last project, > and >| are grayed out to indicate that they are disabled.
Delete allows one to delete a project (and all the samples in that project). Thus, one could delete theJohnson project entered (but do not do it). A password may be required to delete a project. Use thepassword sent with the diskettes.
Delta Plot loads Microsoft Graph and displays a δ2H versus δ
18O plot of samples in the project(unless Microsoft Graph has not been loaded, and then one needs to add this component from theMicrosoft Office 97 Professional installation media). This button is enabled only for medium 1,water samples, and is demonstrated later in this tutorial.
Results allows one to save (i) project δ values in ASCII format to a diskette or (ii) data from anentire project to a diskette in Excel 5.0 format. The latter is a useful feature because samplesubmitters occasionally need all of the sample information (latitude, longitude, etc., including δvalues) in an Excel spreadsheet. This button provides LIMS with that functionality.
Import transfers data from an Excel 5.0 spreadsheet to the Table of Samples (see page 81). Twounpopulated (empty) spreadsheet templates are provided on the diskette labelled Excel 5.0 Templatefor Creating Sample Projects (see page 81). They are useful when someone does not have all of therequired sample information when samples are submitted. For example, latitudes and longitudes aresometimes provided after samples have been submitted. Using a populated spreadsheet, data can beadded to the database without retyping by laboratory personnel (see page 81).
Print Report prints a report containing the δ values of all samples in the selected project.
Print Labels and Print Small Labels print two sizes of labels, 30 or 80 labels per page of U.S.standard 8.5-inch by 11-inch label stock, or 21 or 84 labels per page on A4 stock, respectively. TheAvery stock numbers for 30 and 80 labels per page are 5260 and 5267, respectively. These label arealso available in colors. A4 stock with 21 labels per page is available from Ryman (stock numberP21). Avery (stock number L7656) provides 84 labels per A4 page.
The user should now click Print Report to print a report containing the δ values of all samples inthe project (Fig. 7). Since the project has just been logged in and no samples have yet been analyzed, noisotopic results are shown on the report. The user should compare his or her printer output with that inFig. 7 to ensure that no characters have been omitted.
Click Print Small Labels. LIMS will ask if one wants to print labels for every sample in theproject. The user has the possibility to print a single label or labels for a range of samples. Select Yes toprint a label for every sample in the project. LIMS will query the user for the number of labels for eachsample. Enter 3 and click OK or press the Enter key on the keyboard. The printer should print a page of

33
Submission: 6/6/95 Johnson, Howard Q G-13 to G-30 1/19/98
Medium: 26 --> G [C & N] C- and N-bearing materialPurpose: Weller Toxics Study
Location: Victoria, B.C.
δ13C δ
15N
Collection VPDB(‰) AIR(‰)Sample ID: Date Our Lab ID Value Comment Value Comment
Yta-01 G-13
Yta-02 G-14
Yta-03 G-15
Yta-04 G-16
Yta-05 G-17
Yta-06 G-18
Yta-07 G-19
Yta-08 G-20
Yta-09 G-21
Yta-10 G-22
Yta-12 G-23
Yta-13 G-24
Yta-14 G-25
Yta-15 G-26
Yta-16 G-27
Yta-17 G-28
Yta-18 G-29
Yta-19 G-30
Fig. 7. Example of project report after being logged in. No δ values are shown because no isotopic analyses have been performed on these samples.

34
56 labels (Fig. 8). The user should compare his or her printer output with that in Fig. 8 to ensure that nocharacters have been omitted. Had the user loaded adhesive label stock in the printer, adhesive labels forsamples would have been printed. This completes the third task in Fig. 2.
Sample Form
The user should add some geographic information to some of the Johnson sludge samples. Click
Samples on the Project form to open the Sample form (Fig. 9). The Sample form shows the firstsample in the project (G-13). (One can also open the Sample form by clicking Samples & Analyses onthe Main Menu.) Click List and select G-17. Alternatively, the navigation buttons can be used to movethrough samples in a project.
On the Sample form, there are eight fields that one can set with one’s own user defined captions (seepage 85). They are:
Sample ID User Def Caption 5User Def Caption 2 User Def Caption 6User Def Caption 3 Caption 7User Def Caption 4 Other Info
(Note that there are no periods in any of the above captions. A period is not allowed in a field name (seepage 85 for all disallowed characters.) Perhaps a user is analyzing urine from diabetic patients. One ofthe fields could be defined as “ Days After Dose” (see page 85).
In case samples are for repay, the Project Account field may be useful.
There are over 200 “ countries” on the Country combo control. They can be updated by editing theunderlying table of countries. States, provinces, or administrative districts are listed for some countries.
One can use as many of the fields on the Sample form as are desired. If only a few fields will everbe used, one could easily modify the code and make unused labels and text boxes invisible. If this isdone, one may also want to make the same changes to the Range of Samples report.
On the Sample form, one can see blocks identified as Low Analysis and as High Analysis. Thesewill contain the low and high δ values discussed on page 19 once the sample has been analyzed.
A Comment is available for both the low and high analysis. The user might use these to indicate thestandard deviation of the analyses, to indicate a sample bottle has broken, etc.
Clicking Analyses opens the Analysis form with analyses of the sample. Since this project has justbeen logged in, no isotopic analyses yet exist. Try it.

35
G-13 G-13 G-13 G-14Yta-01 Yta-01 Yta-01 Yta-02G-14 G-14 G-15 G-15Yta-02 Yta-02 Yta-03 Yta-03G-15 G-16 G-16 G-16Yta-03 Yta-04 Yta-04 Yta-04G-17 G-17 G-17 G-18Yta-05 Yta-05 Yta-05 Yta-06G-18 G-18 G-19 G-19Yta-06 Yta-06 Yta-07 Yta-07G-19 G-20 G-20 G-20Yta-07 Yta-08 Yta-08 Yta-08G-21 G-21 G-21 G-22Yta-09 Yta-09 Yta-09 Yta-10G-22 G-22 G-23 G-23Yta-10 Yta-10 Yta-12 Yta-12G-23 G-24 G-24 G-24Yta-12 Yta-13 Yta-13 Yta-13G-25 G-25 G-25 G-26Yta-14 Yta-14 Yta-14 Yta-15G-26 G-26 G-27 G-27Yta-15 Yta-15 Yta-16 Yta-16G-27 G-28 G-28 G-28Yta-16 Yta-17 Yta-17 Yta-17G-29 G-29 G-29 G-30Yta-18 Yta-18 Yta-18 Yta-19G-30 G-30Yta-19 Yta-19
Fig. 8. Example of a small labels report.

36
Fig. 9. Sample form.

37
Print Project will print a report identical to the report generated by clicking Print Project on the
Project form (Fig. 7).
Edit enables editing of the information in the light colored text boxes (those not grayed out).
The latitude and longitude of many samples are important. One can enter or display data in eitherdegrees-minutes-seconds (DMS) format ( e.g., 1214512) or in decimal degrees format (e.g., 121.75333).The symbols °, ’, and " are not accepted for data entry. One can set the display default to either Decimal
Degrees or DMS using a software switch on the LIMS For Light Stable Isotopes Configuration form(see page 86).
The user needs to enter the latitude and longitude of sample G-17. If necessary, click DecimalDegrees to toggle the format to DMS. Click Edit. Click the Lat text box and enter 483807 for thelatitude. Press Enter. Enter -1233015 for the longitude (the minus sign is for the Western Hemisphere). Press Enter. The accuracy of the latitude and longitude can be selected if desired.
The elevations and depths of some samples are important. One can use meters or feet and set thedefault [for samples imported where the submitter has not specified meters or feet on his Excel 5.0template (see page 81)] using a software switch on the LIMS For Light Stable Isotopes Configurationform (see page 86).
Sample G-17 came from a site with an elevation of 142 meters. If the length units are Feet, click tochange it to Meters if necessary. Click the Elevation text box and enter the elevation of 142. Press
Enter. The depth to the top of the perforated interval is 3.5 m. Enter 3.5 in Top and press Enter. Thedepth to the bottom of the perforated interval is 4 m. Enter 4 in Bottom and press Enter.
Both a collection date/time and ending date/time are available. The ending date/time is useful forrain samples.
The collection date/time of sample G-17 is February 2, 1995 11:30 a.m. Click the Collection Datetext box. Enter 2/2/95 11:30 as the collection date and time.
Click Save to save the information entered thus far.
The Copy button can be used to copy sample information to another sample. It is useful in theevent a user has submitted samples with more than one medium from the same location. Often watersamples are submitted for δ
2H and δ18O analysis along with samples for δ
34S analysis. The Copy buttonis used to copy the headings entered for W samples to the S samples.
Suppose the sulfate mineral sample, S-6, was collected from the same location as sample G-17 (Yta-05). The user needs to copy the location information of G-17 to S-6. Click Copy. Several fields will behighlighted and LIMS will inform the user:

38
This command will copy the highlighted information to another sample. Use this commandvery carefully!
Click OK. If prompted, enter the password. Enter S-6 by selecting the Prefix S and entering 6 into the
Sample # text box. Click Copy. LIMS will advise the user:
The Sample ID of the sample selected is BaSO4.
Click OK and the highlighted fields are copied to sample S-6 as will be shown below.
Click Close to return to the Project form.
Add Samples To Be Analyzed Form
LIMS can populate a multi-sheet template with samples for isotopic analysis. One first needs to addthe samples to the Table of Samples To Be Analyzed.
Click Templates on the Project form (Fig. 5) to add samples to this table. The Add Samples ToBe Analyzed form should open (Fig. 10). (The user should not confuse the Add Samples To BeAnalyzed form with the Samples To Be Analyzed form. The latter is opened by clicking on PrintTemplates on the Main Menu and is discussed later in this tutorial.) The information used to set thedefault entries on the Add Samples To Be Analyzed form is obtained from template configurationtables. These are edited by clicking on Special Features on the Main Menu and then selecting
Templates (but don’t do it now).
Only the template “ EA for C & N” is available for medium 26 (C- & N-bearing material), so it isautomatically loaded into the Template combo box by LIMS. The From and To values that define thesample range are set to 13 and 30. The user can edit them. The default number of repeat analyses is 1;thus, samples will only be put on the template once. The user can increase this value if needed. Leave itat 1. The default low procedure code is 356 (CF, EA, Delta 13C), so this value is entered into the lowprocedure combo box by LIMS. Two other low procedure codes (352 and 355) are valid for medium 26and can be selected by the user. Likewise, the user may accept the default high procedure code of 584(CF, EA, Delta 15N) or choose one of the other values in the high procedure combo box. Select the
Front of the queue toggle button to add these samples to the top of the Table of Samples To BeAnalyzed. Click Add to add the samples to the Table of Samples To Be Analyzed. LIMS will respondwith a message box indicating that the repeats have been added. This completes the fourth task in Fig. 2.
If one wants to delete all the samples of a project from the Table of Samples To Be Analyzed, onewould click Delete (but don't do it). Click OK. Close the Project form.

39
Fig. 10. Add Samples To Be Analyzed form.

40
The user can now confirm that information was copied from sample G-17 to sample S-6. Click
Samples & Analyses. Click the Prefix S, enter 6, and click Find. The Sample form opens showingsample S-6. Note that data was copied from G-17. Click Close.
Print Sample Range Form
Clicking Print Sample Range prints information from the Table of Samples for a range of samples. Try printing the range W-41 to W-42. The Access report generated is shown in Fig. 11. The usershould compare his or her printer output with that in Fig. 11 to ensure that no characters have beenomitted.
Printing a Template and the Samples To Be Analyzed Form
After sample projects are created in LIMS, one can add the samples to the Table of Samples To BeAnalyzed [(as the user did above (page 38)] in order to load them in turn on a multi-sheet template thatLIMS can generate. Additionally, LIMS can save the sample headings on a diskette and these headingsare available to the mass spectrometer data acquisition and control program. If the computer controllingthe mass spectrometer can read these sample headings from the diskette, then the headings need not betyped into the mass spectrometer computer by the operator. If a user’s computer software is not able toread these sample headings, the user may want to contact the mass spectrometer manufacturer and“ encourage” the manufacturer to provide software that can read these headings since this is a significanttime saver.
On the Main Menu click Print Templates to open the Samples To Be Analyzed form (Fig. 12). Click List and select the template “ EA for C & N.” “ EA for C & N” is the C and N elemental analyzertemplate. One can see that there are 18 samples waiting to be analyzed by the elemental analyzer for δ
13Cand δ
15N. The sample list shows the low and (or) high procedure code(s) and the number of repeatsremaining. The number of repeats is the number of times that a sample needs to appear on a template. When generating a template, LIMS takes samples from the top of the list. Each time a sample is taken,the number of repeats is decremented by one.
One can edit the list of samples by adding samples, deleting samples, editing the sample number andprefix of a sample, and changing the number of repeats. A sample can appear more than once. Wewill first add a sample to the list. Click on the last record of the subform marked by an asterisk in the leftcolumn. LIMS immediately fills in the default number of repeats, the low procedure code, and the highprocedure code, 1, 356, and 584, respectively. For an experiment, try to enter W-1 as the sample. EnterW as the prefix and 1 as the sample. When the user attempts to update the record by clicking anotherrecord on the subform, the message
This record is not compatible with the EA for C & N. Perhaps the medium is of an incorrecttype or the sample does not exist.

41
Fig. 11. Example of Print Sample Range report.

42
Fig. 12. Samples To Be Analyzed Form for the EA for C and N.

43
Click OK. Enter G for the prefix and 17 for the sample.
To cancel an entry, press the Escape key on the keyboard, but don’t do it now.
To locate a sample quickly, one can use Find. Click Find and the Search form appears. Click
Prefix G, enter 17 in Sample text box, and click Find. The cursor will locate the first G-17.
Move G-13 to the bottom of the queue. Move the focus to sample G-13 by clicking on the cellcontaining 13. Then click on the down arrow button. G-13 will be moved to the bottom of the queue. Next, move it to the top of the queue. Click on the cell containing 13. Click on the up arrow button. G-13 should be moved to the top of the queue. One will notice that it is quicker to move samples to the endof the queue that to move them to the top of the queue.
The user may also move a group of records to the top or bottom of the queue. (Unfortunately, thisfeature does not work in LIMS 1.4). This is done by selecting a group of records and then clicking theup or down arrow button. For example, to move the records G-19 through G-28 to the bottom of thequeue, click on the cell containing 19, hold the Shift key down and click on the cell containing 28,release the Shift key, and click the down arrow button. LIMS will display the message:
Samples G-19 through G-28 will be moved to the bottom of the queue.
Click Cancel since we do not want to move them now.
Once the number of repeats reaches zero, the user commonly deletes the sample by selecting it withthe mouse and pressing the keyboard Delete key. A range of sample can be deleted by first selecting therange of samples to be deleted (drag the mouse along the left edge of the list box) and then by pressingthe Delete key on the keyboard. Clicking the Delete button on the form allows one to delete a singlesample, the sample that has the focus. One can also use Delete on the Add Samples To Be Analyzedform (see page 38) to delete all the samples from the selected project.
Click on the last record, G-17. Click Delete. The sample just added has been deleted.
The user should now generate a multi-sheet template and diskette for the EA for C & N template. Click New Template. LIMS will advise the user of the number of samples waiting to be analyzed (18 inthis case). Click OK. LIMS populates the template with samples and reference samples according to thespecifications of the template. To populate the template, LIMS performs the following steps:
1. LIMS determines if any ports are to be empty according to the user’s template configurationspecifications and makes these ports empty. If a port is not working properly due to improperoperation of a valve or solenoid, that port may be set to “ Empty” by editing the templateconfiguration (select Special Features and then Templates).
2. LIMS examines the user's template configuration specifications and places fixed reference

44
samples in any ports so specified. For example, the user may want the second port to alwayshave a reference sample in it.
3. LIMS determines how many floating reference samples (if any) are to be placed in each bank(manifold) of the preparation device and places them in ports using a random numbergeneration routine. A floating reference sample is a reference sample that is randomlyinterspersed among a group of samples.
4. LIMS fills in the remaining ports with samples taken from the Table of Samples To BeAnalyzed. If LIMS reaches the bottom of the list and still needs more samples to completepopulation of the template, LIMS begins again selecting samples from the top of the queue,choosing samples that have repeats greater than zero. Thus, a sample can appear more thanonce on a template. If LIMS exhausts samples from the Table of Samples To Be Analyzed,LIMS fills the remaining ports with a sample so designated on the Template Configurationform (see page 97). This often is W-1, or an equivalent “ test” sample.
Creating a new template format and editing an existing template format is discussed beginning on page97.
After the template is generated, LIMS will display the message
You can add Aliquot IDs if desired. You cannot edit any other field.
Click OK. Typically, the aliquot ID of each sample would be printed on the isotopic analysis sheet bythe mass spectrometer, assuming that the vendor's software can import the information saved to a file ona diskette by LIMS.
Click Print. When requested by LIMS, insert a blank diskette into the computer and click OK. Thefollowing actions now take place:
1. A list of samples is printed (Fig. 13). This list helps the analyst locate the samples.
2. A multi-sheet template is printed (Fig. 14a–14e),
3. Sample headings are saved on the diskette for use by the mass spectrometer, and
4. A backup of the Table of Samples To Be Analyzed is made.
5. The number of repeats for each sample shown on the template is decremented by one.
LIMS will inform the user that the oldest backup has been replaced successfully. Click OK.

45
EA for C N Samples To Be Analyzed1/20/98 9:50:45 AM
Port Sample # Amount00 G-4 _________ 40 G-5 _________01 G-5 _________ 41 G-3 _________02 G-13 _________ 42 G-3 _________03 G-14 _________ 43 G-3 _________04 G-15 _________ 44 G-3 _________
05 G-16 _________ 45 G-3 _________06 G-17 _________ 46 G-3 _________07 G-18 _________ 47 G-3 _________08 G-19 _________ 48 G-3 _________09 G-20 _________ 49 G-3 _________
10 G-21 _________11 G-22 _________12 G-23 _________13 G-24 _________14 G-25 _________
15 G-26 _________16 G-27 _________17 G-28 _________18 G-29 _________19 G-30 _________
20 G-3 _________21 G-3 _________22 G-3 _________23 G-3 _________24 G-3 _________
25 G-3 _________26 G-3 _________27 G-3 _________28 G-3 _________29 G-3 _________
30 G-3 _________31 G-3 _________32 G-3 _________33 G-5 _________34 G-3 _________
35 G-3 _________36 G-3 _________35 G-3 _________38 G-3 _________39 G-3 _________
Fig. 13. Example of List of Samples To Be Analyzed for the EA for C & N template.

46
45/G-3 46/G-3 47/G-3
30/G-3 31/G-3 32/G-3
15/G-26 16/G-27 17/G-28
00/G-4 01/G-5 02/G-13
EA for C N 20-Jan-98
Page 1
Fig. 14a. Page 1 of multi-sheet template (EA for C & N) for an elemental analyzer.

47
48/G-3 49/G-3
33/G-5 34/G-3 35/G-3
18/G-29 19/G-30 20/G-3
03/G-14 04/G-15 05/G-16
EA for C N 20-Jan-98
Page 2
Fig. 14b. Page 2 of multi-sheet template (EA for C & N) for an elemental analyzer.

48
36/G-3 37/G-3 38/G-3
21/G-3 22/G-3 23/G-3
06/G-17 07/G-18 08/G-19
EA for C N 20-Jan-98
Page 3
Fig. 14c. Page 3 of multi-sheet template (EA for C & N) for an elemental analyzer.

49
39/G-3 40/G-5 41/G-3
24/G-3 25/G-3 26/G-3
09/G-20 10/G-21 11/G-22
EA for C N 20-Jan-98
Page 4
Fig. 14d. Page 4 of multi-sheet template (EA for C & N) for an elemental analyzer.

50
42/G-3 43/G-3 44/G-3
27/G-3 28/G-3 29/G-3
12/G-23 13/G-24 14/G-25
EA for C N 20-Jan-98
Page 5
Fig. 14e. Page 5 of multi-sheet template (EA for C & N) for an elemental analyzer.

51
Note that the last approximately 30 positions on your template are populated with G-3 (see Fig. 13),an empty sample on the elemental analyzer carousel (see page 29). Also, because a random numbergenerator is used to position the three floating reference samples (G-5), the user’s template will beslightly different than the one shown in Figs. 13 and 14a–14e.
The last multi-sheet template is saved in case the printer malfunctions. If you need to print it again,click Last Template on the Samples To Be Analyzed form.
Clicking Make Backup creates a backup of the Table of Samples to Be Analyzed shown on the
Samples To Be Analyzed form (Fig. 12). To restore a previous backup, click Retrieve Backup andselect the day and time of the backup to be restored. The last nine backups are retained by LIMS.
Close the Samples To Be Analyzed form. This completes the first task in Fig. 3. The technicianwould now load the template with samples and analyze them (tasks 2 and 3 on Fig. 3).
Analysis Form
The tutorial will digress briefly to discuss the Analysis form which is used to show the isotopicanalysis of a sample that has been analyzed. To open the Analysis form, it is first necessary to open the
Sample form. The easiest way to open the Sample form (Fig. 9) is to click Samples and Analyses onthe Main Menu. Click Samples and Analyses. The W is already selected, so enter 8 and press Enter. The sample form should open. The Analysis form is opened by clicking Analyses on the Sample form. Click Analyses and a message indicates that there are no analyses for sample W-8. This is correct sincethe Comment text box indicates that the sample was broken (this is a real sample and it was broken). Move to sample W-9 by clicking List or the navigation buttons. Click Analyses and the Analysis formopens (Fig. 15).
Analysis D-117229 is visible. To view other analyses, select them by clicking List. There are two
δ18O analyses from the DuPont mass spectrometer and two δ
2H analyses from the VG mass spectrometer. To edit an analysis, click Edit and the Edit Analysis form opens. One may need to enter the password.
Close the Analysis form and the Sample form to return to the Main Menu.
Add or Change Analyses Form
Assume the Johnson sludge samples have now been analyzed along with numerous other samples. The user needs to add these isotopic analyses to LIMS. Isotopic analyses are added in either of twoways, they are entered using the keyboard or they are imported from a file created by the massspectrometer software. First enter isotopic data using the keyboard.

52
Fig. 15. Analysis form.

53
Enter the missing mass spectrometer analysis information as follows. Click Add or ChangeAnalyses. The Add or Change Analyses form should appear (Fig. 16). From the Mass Spec combo(combination) box, select V-->VG in 5B131. When the hourglass cursor disappears, W has been selectedas the sample prefix. Note that only three prefixes are shown for this mass spectrometer (G, R, and W)because it can only analyze hydrogen isotopic ratios. [The Table of Media (table 1) shows that there areno media with prefixes C, J, N, or S for hydrogen isotopic analysis.] Above the Mass Spec combo boxis Range of Mass Spec Analyses for List option group. This only applies to the List button, which isused below. Generally, the user will want to accept the default of the last 1,000 analyses becauseselecting all analyses may require a query of the database that takes more than a minute in the case oflarge databases.
The analysis number of the missing analysis is 128329. Click New Analysis. LIMS determinesthat the next analysis number should be 128329 and LIMS inserts this value in the Analysis # text box. By chance it is exactly the analysis that is missing, so press Enter and the focus (cursor) moves to the
Aliquot ID text box. Users often identify the aliquot of the sample analyzed with A, B, etc. This 20character field can be used as one chooses. It will not be used now, so press Enter. The cursor shouldmove to the Standard text box.
Enter 24 for the working standard. The integers 1 to 366 are normally used in the author’slaboratory for identification of working standards (the day of the year in which it was loaded). One canforce error checking for the integers 1 to 366 using one of the switches on the LIMS For Light StableIsotopes Configuration form (page 86).
Enter 31 for the port number. Port numbers can be up to six characters long. Integer port numbersbetween 0 and 99 are used in the author’s laboratory. One can ensure that users enter only integer portnumbers between 0 and 99 by enabling a software switch (page 86).
Enter March 1, 1997 6:24 PM (or 18:24) for the date/time analyzed. The date/time format may bedifferent depending upon the Window’s date and time default settings of the user’s computer.
The cursor should move to the Comment text box. This 32-character field can be used to store textfor each analysis, as one chooses. It is not used now, so press Enter. The cursor moves to the Prefix W.Accept this prefix and press Enter. The cursor moves to the Sample text box.
The sample number of the missing analysis is W-6, so enter 6 and press Enter. LIMS will nowsearch the database for information about sample W-6 and it will fill in the following information:
Sample submitter (owner) ReferenceSubmission date Jan. 5, 1995Sample ID Light Lab RefMedia 01 for water

54
Fig. 16. Add or Change Analyses form.

55
The cursor should be in the Isotope combo box. Select 2H from the Isotope combo box if it is notalready selected and press Enter. The cursor moves to the Procedure combo box and procedure 201 isselected because it is the default low procedure code for the medium water (see page 94).
Enter -389.86 for the δ value and press Enter.
The mass spectrometer error code is 0 (no error), so press Enter. The error code is similar to theMicromass “ Run Code.” The focus should move to Save. Click Save or press Enter to save thisanalysis.
Next the user should select “ P --> My Delta Plus” from the Mass Spec combo box. Note thatLIMS now makes the Peak Number text box visible because the Delta Plus has continuous flowcapabilities. Click List and the analyses, peaks, and procedure codes for the last 1000 analyses of theDelta Plus are shown. Additionally, the date and time of analysis, Aliquot ID, port ID, Our Lab ID,Standard, and δ value are shown. Click on P-110 and this analysis is loaded into the form.
The function of the buttons on this form is similar to those on other forms and is described below:
Edit enables the user to edit the isotopic analysis (and peak number if shown). Most fields can beedited. LIMS will perform data validation whenever possible. Thus, LIMS would not allow theuser to change the Our Lab ID of a sample on the VG mass spectrometer from W-1 to S-1 becausethe VG mass spectrometer is not able to analyze sulfur isotopic ratios.
New Peak enables the user to enter a new peak to an existing mass spectrometric analysis.
New Procedure enables the user to enter a new procedure code. LIMS will constrain the isotopeand procedure codes to those that are valid for the medium of the sample and the capabilities of themass spectrometer, that is, the isotopes it can analyze.
Delete enables the user to delete an analysis and peak number.
Next the user will enter isotopic data from files saved by mass spectrometers, so click Close to closethe Add or Change Analyses form.
Import Analyses Button
The Import Analyses button on the Main Menu is used to import isotopic analyses from a file on adiskette that has been saved by a mass spectrometer. In addition to the LIMS default format, LIMS canimport isotopic analyses from analysis files created by Analytical Precision, Europa Scientific, FinniganMAT, and Micromass mass spectrometers. The format for each manufacturer is discussed is some detailbeginning on page 109. LIMS cannot import all formats of all manufacturers. In particular, importing ofMicromass continuous flow isotopic results is not yet available because there are a variety of formats

56
rather than a unique format.
When any sample analysis is imported, the Our Lab ID and the isotope (see table 3) is appended tothe Table of Samples In Progress unless it already is present in this table. Typically the user will “ applya correction to” the δ values (discussed below) and store the final δ value in the Table of Samples so thatfinal reports of results can be generated. When the final δ value is stored in the Table of Samples, thesample is deleted from the Table of Samples In Progress because the user no longer needs it there.
LIMS Default Import Format
The LIMS default import format for isotopic analyses is a Microsoft Access 2.0 .mdb database file(see page 109). Next import isotopic results in the LIMS default format. Insert the LIMS ExampleDatabase diskette into the computer. Click Import Analyses. When prompted to select a massspectrometer, select “ D --> DuPont.” Note that the Import Format combo box is set to “ LIMS Default”because this is the only choice for the DuPont mass spectrometer. [It is the only choice because theimport format in the mass spectrometer configuration table (page 91) for the DuPont mass spectrometerhas been set to “ LIMS Default.” Had it been left blank, LIMS would have prompted the user to selectthe import format from the list of import formats.] Click OK and the file dialog form opens and displaysthe .mdb files on the diskette. The DuPont mass spectrometer generated the file LmImpDef.mdb, soselect it and click Select. The status form should open. The form is updated after each line of data in thefile of isotopic results is processed. Six analyses should be imported and LIMS should advise the userthat D-117457 through D-117462 have been imported. Click OK. If one were to import LmImpDef.mdbagain, one would see that the status form would process 6 lines and that there would be 6 duplicaterecords.
Analytical Precision Import Format
Software from Analytical Precision saves isotopic results in an Access 2.0 database file (see page111 for the format). Next import isotopic results from an Analytical Precision file. Click ImportAnalyses. Select “ A --> My AP” from the mass spectrometer combo box. Click OK and the file dialogform will show all of the .mdb files on the diskette. Select the file AP_Imp.mdb and click Select. Thirteen records should be imported, A-1318 through A-1323. To view these analyses, click Add orChange Analyses. Select mass spectrometer “ A --> My AP” , and click List. Note that for the firstanalysis, A-1318, both δ
13C and δ18O values have been imported (procedure code 300 is the δ
13C analysisand procedure code 810 is the δ
18O analysis). The user will note that analyses A-1318 through A-1322are for gaseous CO2 samples from a mass spectrometer test (samples G-7 through G-11). Analysis 1323is an elemental analyzer analysis of sample G-1 and has two peaks, the first is N2 and its δ
15N value is+0.33; the second is CO2 and its δ
13C value is -24.35. Note that a value of -1.58 is listed for procedurecode 198 of peak 2. Procedure code 198 is δ
18O received unexpectedly. The Analytical Precision massspectrometer saved the δ
18O value of the CO2 sample on the diskette. But LIMS knows that the medium

57
of sample G-1 is 26, C- and N-bearing material. Thus, LIMS knows that this medium has no oxygen init (as far as LIMS is concerned). When LIMS imported the δ
18O value, the only way LIMS could store itwas as procedure code 198. Click Close to close the Add or Change Analyses form.
Europa Scientific Import Format
Software from Europa Scientific has for several years saved isotopic results in an ASCII .prn file. An example, Europa.prn, is provided on the Example Import Files diskette. In March 1997 a new formatwas adopted (see discussion on page 112). The new format is an ASCII text file (.txt) given the nameMercury.txt. Import a Europa Scientific file. Click Import Analyses. Choose “ U --> My Europa.” The Europa Scientific import format is automatically selected. Click OK. The file dialog form shouldopen showing the .txt files on the Example Database diskette. Choose Mercury.txt. Click Select. Thestatus form should show that 7 lines have been processed and 7 analyses imported. LIMS will advise theuser that analyses U-25 through U-30 have been imported. One can view these analyses as done aboveby clicking Add or Change Analyses. Select “ U --> My Europa” for the mass spectrometer and click
List. One can see that U-25 through U-29 are δ15N elemental analyzer analyses—the procedure code is
584. U-30 shows 2 peaks from a nitrogen isotope GC combustion analysis (a compound specific isotopicanalysis of sample G-1). Select U-25 and click Close.
Finnigan MAT Import Format
Introduction.Finnigan MAT isotopic results need to be saved in a Lotus (.wks) format using ISODAT at the
Finnigan mass spectrometer computer. See page 112 for details on creating a .wks file that is compatiblewith LIMS.
When Finnigan ISODAT analyses are imported, the unique integer that LIMS uses for the analysisnumber is the Finnigan mass spectrometer Spec No. This number must be unique. Therefore, if a userneeds to replace a computer or hard disk, the Spec No must be set during installation to the nextunique integer. For example, if the last Spec No. of the last analysis before the computer failed was33115, the replacement computer must be installed with a Spec No. of 33116.
The format for Finnigan dual inlet, GC combustion (GCC), and EA (elemental analyzer) files aredifferent. They are discussed in detail beginning on page 113. Each will be imported in turn by the user.
Dual Inlet.Click Import Analyses. Select “ F --> My 251” from the mass spectrometer combo box.
“ Finnigan ISODAT” is automatically displayed in the Import Format combo box. Click OK. The filedialog form will open and display all of the .wks files on the diskette. Select Finn_di.wks. The statusform should open and three lines will be processed—this may take a few minutes. Note that 24 recordshave been added to LIMS. Three δ
15N values and 21 other values should have been imported. These

58
include sample and standard major ion beam voltages, ion gauge values for the standard and sample, andvoltages of some interfering masses of the sample. One can examine these analyses as follows. Click
Add or Change Analyses. Click “ F --> My 251” and click List. The first line shows a δ15N value
(procedure code 580) of 0.73 of N-40 for analysis F-18206. In addition the δ15N value, LIMS has
imported seven other values. Specifically, the following procedure codes have been imported for each ofthe three analyses:
124 m/z = 28 ion beam (sample)138 m/z = 40 ion beam (sample)140 m/z = 44 ion beam (sample)161 Ion gauge (sample)162 Ion gauge (standard)163 Major ion beam (sample)164 Major ion beam (standard)
Values for all of these parameters have been saved in LIMS. Select procedure code 161 of analysisF-18206. A value of 2.9617180824 has been saved in LIMS for ion gauge reading of the sample. Click
Close.
Importing Finnigan isotopic data is not always straightforward. Sometimes the column heading ofthe data one wishes to import is not what one expects. Examine the format of the data just imported. Open Excel. Open A:\Finn_di.wks. One will see that isotopic results start in row 6 and that each rowcontains all the isotopic results for a given analysis number (Finnigan's “ spec no.” ). In this file the δ
15Nvalues are given in the column with the heading “ d-29/28.”
GCC.Click Import Analyses. Select “ P --> My Delta Plus” from the mass spectrometer combo box.
“ Finnigan ISODAT” is automatically displayed in the Import Format combo box. Click OK. The filedialog form will open and display all of the .wks files on the diskette. Double click F_GCCCO2.wks. LIMS will display the message (if LIMS doesn't show this message, see the note below):
Finnigan GCC analyses found. For the reference sample IDs, LIMS will use:
R-2 for the CO2 reference gas
(These can be changed using the configuration form. To change, click Cancel and clickSpecial Features on the main menu.)
This message indicates that R-2 will be substituted for the Our Lab ID of the reference gas (standard). Click OK. LIMS will open the Status form, will import the δ
13C and δ18O values, and advise the user
that three analyses (P-515 through P-517) and 42 records have been imported. Delta values for 7 peaks

59
of each analysis have been imported (3 analyses × 7 peaks × 2 δ values per peak = 42 records). Page 116discusses several factors that need to be considered to import Finnigan GCC analyses.
EA.The user needs to import the isotopic data for Mr. Johnson’s samples from Victoria, B.C. Click
Import Analyses. Select My Delta Plus and click OK. Select Finn_EA.wks and click Select. LIMSwill advise the user that elemental analyzer analyses have been found and that R-2 will be used for theCO2 reference and R-3 for the N2 reference. Click OK. LIMS will import analyses P-620 through P-659(160 records). For each elemental analyzer analysis of a C- and N-bearing substance, ISODAT providestwo peaks and two isotopic analyses. The first analysis is of N2 gas (peak 1 is the N2 reference and peak 2is the sample), and the subsequent analysis is of CO2 gas (peak 1 is the sample and peak 2 is the CO2
reference). If the user checks analyses P-620 and P-621 by clicking Add or Change Analyses, selecting“ P--> My Delta Plus” from the Mass Spec combo box, and clicking List, the user will find that both
δ13C and δ
18O analyses have been imported. LIMS has correctly identified the N2 reference gas as R-3and assigned it a δ
15N value of -4.13‰ (procedure code 500) and identified the CO2 reference gas as R-2and assigned it a δ
13C value of -41.22, both obtained from the table of references. LIMS has retained theasterisks from the ISODAT .wks file identifying the references. Note that both peaks 1 and 2 have N andC concentration values listed for them (the values listed for procedure codes 190 and 189, respectively). This completes the fifth task in Fig. 3.
LIMS can also import Finnigan δ34S elemental analyzer analyses. Page 116 discusses several factors
that are important in importing Finnigan elemental analyzer analyses.
Click analysis P-100 and click Close to close the Add or Change Analyses form.
Micromass Import Format
Micromass uses comma separated variable (csv) text files that can be imported into spreadsheetprograms. The format of dual inlet files for various gases is relatively similar according to Micromass;however, the format for continuous flow samples has varied often. According to Tim Brockwell,providing a stable format for continuous flow measurements has not been given a high priority. Therefore, currently LIMS does not import Micromass continuous flow analyses.
Next import some δ18O values of water from a dual inlet Micromass file. Click Import Analyses.
Select “ M --> My Micromass” from the mass spectrometer combo box and “ Micromass” will be loadedinto the Import Format combo box. Click OK and the file dialog form will show all of the .csv files onthe diskette. Select the file Mm_o18w.csv and click Select. LIMS will inform the user that there are noMicromass analyses in the database and will suggest a default value of 1 for the first analysis number. Because Micromass does not maintain an integer analysis number, incremented sequentially for eachanalysis, Micromass users are forced to generate and maintain such analysis numbers themselves. The

60
user should accept the default of 1 and click OK. Five lines are processed and 30 records are imported(Analyses M-1 through M-5). Thus, results of 6 procedures have been stored for each analysis (line inthe file). In addition to importing δ
18O values, LIMS has imported the following procedure codes:
161 Ion gauge (sample)162 Ion gauge (standard)163 Major ion beam (sample)164 Major ion beam (standard)193 Delta 13C received unexpectedly
The user can open the Add or Change Analyses form and verify this. (Select “ M --> My Micromass”for the mass spectrometer, and click List. The code 193 appears for each analysis because water samples(medium 1) were analyzed, and LIMS knows that water samples have only H and O in them—no C. Butthe mass spectrometer analyzed CO2 samples and saved both δ
13C and δ18O values. Thus, LIMS imports
δ13C values and stores them as procedure 193. Note that Micromass' “ Run Serial Number,” if available,
is stored in the comment field, for example for analysis M-5 as “ RSN = 2572.” Close the Add orChange Analyses form.
LIMS For Light Stable Isotopes Configuration Form
Suppose one does not want to import ion gauge readings or major ion beam voltages. The userneeds to set a software flag to disable importing of these values. Click Special Features. Enter thepassword if requested. Click Config. The LIMS For Light Stable Isotopes Configuration form willopen (Fig. 17). This form allows users to (i) edit eight alternative field (column) names of the Table ofSamples, (ii) edit the labels “ top” and “ bottom” on the samples form (and the range of samples report),(iii) change the color of many of the forms in LIMS, (iv) set software switches, and (v) edit the value ofvarious tokens used in the software.
Click List. Select “ STORE_INTERF_MASSES” and click it. Click Edit. Change the entry in the
Value text box from -1 to 0 (zero, not the letter oh). Click Save. Click List. Click“ STORE_MAJOR_VOLTAGES.” Click Edit. Change the entry in the Value text box from -1 to 0. Click Save. Click List. Click “ STORE_EA_CONCENTRATIONS.” Click Edit. Change the entry inthe Value text box from -1 to 0. Click Save. Click List. Click “ STORE_ION_GAUGES.” Click Edit. Change the entry in the Value text box from -1 to 0. Click Save. Click List. Click“ STORE_UNEXPECTED_PROCEDURES.” Click Edit. Change the entry in the Value text box from-1 to 0. Click Save. Click Close. Click Close on the Special Features subform. Now interferingmasses, major ion beam voltages, elemental analyzer concentrations, ion gauge readings, and unexpectedprocedures will not be imported. This will prevent LIMS from importing unneeded information and willaid in keeping the user's database smaller. As a consequence, queries will run more quickly and LIMSwill respond more quickly. Users will need to set to -1 any of these parameters they need to store. Anextensive discussion of the LIMS For Light Stable Isotopes Configuration form starts on page 85.

Fig. 17. LIMS For Light Stable Isotopes Configuration form.

62
Correction Factors and Normalization Equations Form
The δ values imported into the table of analyses in LIMS are called penultimate delta values, that is,the delta value before the last. To calculate the final delta value, one uses the equation
Final delta = a × Penultimate Delta + b
where the coefficients a and b are determined by analyzing reference materials with known δ values (seeCoplen, 1988, for a discussion of normalization). The coefficient b takes into account drift of theworking standard, etc. The coefficient a takes into account contraction of the δ scale by one’s massspectrometer or variation in the H+
3 contribution to the m/z = 3 ion beam when analyzing hydrogen. Inthe case of δ
34S, the user could employ it to take into account the difference between the SF6- and SO2-based sulfur-isotope scales.
Click Correction Factors and Normalization Equations. The Analyses and NormalizationEquations form opens (Fig. 18) allowing one to choose a mass spectrometer and isotope to view. Startwith 18O for water samples on the Dupont by selecting “ D (DuPont) for 18O (water)” from the
Correction Factor List combo box. The Analyses from and to text boxes are automatically filled withthe last 501 analyses. Click Query to display the list of all DuPont analyses in the database betweenD-116962 and D-117462.
The mass spectrometric analysis number in the first column increases downward and consists of thesingle letter prefix of the mass spectrometer and the integer analysis number. The peak number is givenin the second column. The value of the peak number will be 1 for all dual inlet analyses. It can rangebetween 1 and 999 for continuous flow compound specific GC combustion isotopic analyses. The timeand date occupy the third column. The sample analyzed (Our Lab ID) is given in the fourth column, andport and working standard ID are given in the fifth and sixth columns. The coefficients a and b, separatedby a comma, are given in the seventh column. Currently many b values are null. The last columncontains range markers. A range marker shows a range of analyses (such as 117446 through 117456) andthe coefficients a and b that are applicable to the analyses in that range. The “ pd” stands for penultimate
δ value. Thus, the last range marker on screen,
117446 - 117456; 1.00000*pd-0.47
indicates that the final delta value of each analysis of a water sample in the range D-117446 toD-117456 is calculated by multiplying the penultimate δ value by 1.00000 and subtracting 0.47. Therange marker is shown at the bottom of a range of analyses, that is on the last analysis (D-117456). Onecan move from analysis to analysis by use of the vertical scroll bar on the right side of the form. Notethat all of the DuPont analyses are shown, not just the δ
18O analyses. Because DuPont for 18O (water)was selected from the Correction Factor List, one can only put range markers on δ
18O analyses of watersamples. Each δ
18O analysis of a water sample is indicated by an asterisk (*) after the Our Lab ID in thefourth column.

63
Fig. 18. Analyses and Normalization Equations form.

64
Unmark is used to delete a range marker. Click on the range marker “ 117409 - 117445;1.00000*pd-0.55” at analysis D-117445. Note that the next range marker which is at D-117456 coversthe range 117446 - 117456. Click Unmark. The range marker on D-117445 is removed and the rangeof the range marker at D-117456 is updated to 117409 - 117456.
One creates a range marker in two ways. The first to be discussed is highlighting an analysis andthen double-clicking on it. The user should Select “ D (DuPont) for 13C” from the Correction FactorList combo box. The Analyses from and to text boxes are automatically filled with the last 501analyses. All of the DuPont isotopic analyses need to be evaluated so replace 116962 in the Analysesfrom text box by 1. Click Query to display the list of analyses. The working standard was changed onFeb. 22, 1995—the standard changed from 362 to 53 (at analysis D-117334). Therefore, the user will putthe first range marker at the last δ
13C analysis before the working standard was changed, that is atD-117332. The user should move to this analysis and click it. The user should press the Enter key ordouble-click on analysis D-117332 to create a range marker. In a few seconds, the NormalizationEquation Coefficients form should appear (Fig. 19).
The Normalization Equation Coefficients form is used to calculate the coefficients a and b fromthe isotopic analysis of reference materials interspersed with the samples. The coefficient a, theexpansion factor, is labelled Exp. Coef, and b, the additive correction factor, is labelled Add. Corr. (seeFig. 19). All of the δ
13C reference materials analyzed between D-000001 and D-117332 are shown in thesubform in red font. D-116957 is the first analysis. One can use the vertical scroll bar to scroll throughthe analyses. In this example, we have 23 analyses. The sample number (Our Lab ID) is shown in thefirst column and the mass spectrometer analysis number is in the second. The peak number is appendedto the analysis number as a decimal. For example, peak number 14 of analysis number 123456 would beP-123456.014. If the peak number is 1 (which it is for all dual inlet analyses, and it is here), the “.001”is not shown. This feature is adopted for most of the forms and reports in LIMS. The workingstandard ID appears in the third column, the port number in the fourth, the mass spectrometer error codein the fifth (typically not used by most vendors, so it is 0), the penultimate delta in the sixth, the finaldelta for the analysis in the seventh, and an Ignore check box in the eighth column. Note that LIMS mayuse -999 as a default delta value to indicate a null value. Analysis D-117195 was evidently lost, and themass spectrometer error code indicates that the sample was too small. The DuPont mass spectrometerthen provided the value of -999 as the penultimate delta value and set the Ignore check box to True. Because of unknown difficulties with a sample, the DuPont mass spectrometer analyzed the sample threetimes (D-116957 through D-116959) and automatically ignored the first two analyses. At this point, theuser should peruse the analyses and ignore any additional analyses that should not be included in thedetermination of the coefficients a and b. The mean is 2.04 and the standard deviation is 0.02. Thus,there is no statistically valid reason for eliminating any of these analyses. The value following the
Reference combo box is 1.89 per mill [note that LIMS uses the ISO spelling of ‰, (ISO, 1992)]. This isthe “ true” value of this reference material that LIMS obtained from the table of references (see page 89for instructions on adding, editing, and deleting δ values of references). Because the mean value is 2.04,the difference is -0.15. This value appears in text box labelled Proposed Add. Corr (Proposed AdditiveCorrection Factor) and is the proposed value of the coefficient b. The value of a is 1.0000, in the boxabove. There is only one reference material, C-5. Because it takes at least two points to determine thecoefficients of a straight line, one cannot determine another value for a, and the existing proposed value

65
Fig. 19. Normalization Equation Coefficients form.

66
of 1.00000 is retained. Calculation of an expansion coefficient different than 1.00000 is demonstratedin an example below with hydrogen isotopic data on page 68. To accept the factor of -0.15 and apply itto analyses D-000001 though D-117332, click the large arrow button between the labels Accepted andProposed. The δ
13C values in on the underlying form are automatically updated and the range marker
1 - 117332; 1.00000*pd-0.15
appears in column seven of the Analyses and Normalization Equations form (one can grab the top ofthe Analyses and Normalization Equations form with the mouse and move it down to view theunderlying form). The proposed values have been copied to the text boxes below the label Accepted. This is an easy way to apply correction factors to a large quantity of data quickly. It potentiallyeliminates errors that commonly can occur when correcting data “ by hand.”
If one wants to apply a different value for the additive correction factor than is shown (proposed),one only needs to delete the proposed value and enter the preferred value. Clicking the large arrow keyapplies the new preferred value and updates the isotopic data in the selected range. If one wants to applya value for the expansion coefficient other than 1.00000 (the proposed value), one needs to deselect the
Force Exp. Coef. to 1.00000 check box and replace the proposed value by the new value. Clicking thelarge arrow key applies the values in the “ Proposed” column and updates the isotopic data in the selectedrange.
The user should now click Print to obtain a permanent record of this determination of normalizationcoefficients (see Fig. 20). The user should compare his or her printer output with that in Fig. 20 toensure that no characters have been omitted.
Click Close and move to analysis D-117461, the last δ13C analysis in the list. Double-click on it. A
correction factor of -0.17 should be shown. Apply it by clicking the large arrow button and close theform. The correction factors for all of the δ
13C data in the database have now been completed.
To calculate correction factors (normalization coefficients) for the δ18O values of the carbonates,
select “ D (DuPont) for 18O (other than water)” from the Correction Factor List combo box and press
Enter. Replace the current value of 116962 in the Analyses from test box with 1. Click Query to showthe DuPont analyses again. This time the asterisks denote δ
18O analyses (other than water). Water istreated separately because the coefficients a and b are sometimes different than for non-water samples. Double-click on D-117333. The standard deviation is 0.05 so accept the existing isotopic results. Clickthe large arrow button and the additive correction factor of -1.25 is applied to the analyses in the selectedrange. Close the Normalization Equation Coefficients form. The range marker
1 - 117333; 1.00000*pd-1.25
is shown in column eight of the Analyses and Normalization Equations form. Move to D-117462

67
References for D (DuPont) for 13C 1/20/98Between 1 And 117332
Expansion Coefficient: 1.00000 Correction Factor: -0.15
Proc. PenultimateDate Analysis # Port Code Error Messages Delta Ignore
C-51/6/95 9:32:32 AM D-116957 77 312 10 --> Ignore +1.84 Ignore1/6/95 9:50:46 AM D-116958 77 312 10 --> Duplicate +2.03 Ignore1/6/95 10:18:04 AM D-116959 77 312 +2.041/7/95 12:14:18 AM D-116993 84 312 +2.041/7/95 3:07:16 AM D-117003 89 312 +2.041/8/95 1:39:18 PM D-117011 73 312 +2.021/9/95 8:13:36 PM D-117023 75 312 +2.051/9/95 10:29:59 PM D-117031 84 312 +2.051/11/95 12:33:03 AM D-117053 75 312 +2.031/11/95 4:33:47 AM D-117067 83 312 +2.041/12/95 7:12:21 AM D-117089 74 312 +2.042/10/95 11:46:37 AM D-117107 83 312 +2.032/13/95 6:19:52 PM D-117121 74 312 +2.012/13/95 8:38:46 PM D-117129 78 312 +2.042/15/95 2:27:56 AM D-117154 76 312 +2.042/15/95 9:24:37 AM D-117178 89 312 +2.032/15/95 3:36:28 PM D-117182 71 312 +2.032/16/95 7:20:38 AM D-117195 71 312 03 --> Too Small or -999.00 Ignore2/17/95 3:45:41 PM D-117251 89 312 +2.062/18/95 8:44:25 PM D-117263 83 312 +2.012/20/95 6:19:34 PM D-117328 74 312 +2.012/21/95 8:45:39 PM D-117330 77 312 +2.042/21/95 10:30:02 PM D-117332 81 312 +2.06
+2.04 ± 0.02
Computed value of C-5 relative to VPDB: 1.89 per millValue should be (from reference table): 1.89 per mill
Fig. 20. Example of Normalization Equations Coefficients report.

68
and double-click. The proposed additive correction factor is -1.32. Accept it (click the arrow button) andclose the Normalization Equation Coefficients form. The δ
13C and δ18O correction factors for
carbonates in the database (also for G samples if there were any for δ13C and δ
18O) are completed.
LIMS allows one to take into account expansion or contraction of the δ scale. As an example,calculate the normalization coefficients and allow the expansion coefficient to differ from 1.00000. Fromthe Analyses and Normalization Equations form select “ V (VG in 5B131) for 2H” and click Query. The correction factors (normalization equation coefficients) have been calculated for all but the last 21analyses. Thus, one only needs to determine correction factors for these 21 analyses. Since theseanalyses extend over less than 1/4 day, one can treat them as one range. Double-click on V-128329. When the Normalization Equation Coefficients form opens, click the Reference combo box and selectW-5. The proposed values of the expansion coefficient and additive correction factor are 1.00000 and8.03. Accept these values and click on the arrow button to update the underlying form. Now click theoption button Show All References from the References option group. The analyses of W-6 are nowadded to the subform. Their Final Deltas are about -382. The true value, -395.1, can be found byclicking the Reference combo box to open it. What has happened is that the mass spectrometer has“ misbehaved” and the H+3 value has increased significantly. One needs to normalize the isotopic dataover this range and one can do this by clicking Force Exp. Coef. to 1.00000 check box in order touncheck it. The message
Will determine best fitting normalization equation coefficients.
appears. Click OK or press Return. The Proposed and Accepted Expansion Coefficient and AdditiveCorrection Factor have changed to 1.03879 and 10.42. The Final Delta values for the two W-6 samplesshould have changed to -395.63 and -394.56, appropriate for a true value of -395.1.
To determine the best fitting coefficients, the option button Show All References must be selected. If one has three or more reference materials in the range of analyses, analyses of all three will appear inthe subform and will be used to calculate the best fitting coefficients unless one has checked the Ignorebox for one or more of them. Given analyses for three materials, analyses for any one can be eliminatedby ignoring all of its analyses (checking the Ignore check box of each of its analyses). Close the
Normalization Equation Coefficients form.
The second method to create a range marker is to use Mark. In the event that there are no analysesof reference samples in the range to be marked, the Mark button is the only method to create a rangemarker. The user will first be prompted for the expansion coefficient and then for the additive correctionfactor. The user should select “ F (My 251) for 15N” from the Correction Factor List combo box. Click Query. Click (do not double-click) on analysis F-18208 to select it unless it is already selected. Click Mark. Use 1.00000 for the expansion coefficient. Enter -0.28 for the additive correction factor. The range marker
1 - 18208; 1.00000*pd-0.28

69
has been created.
View/Edit opens the Normalization Equation Coefficients form using the range marker affecting aparticular analysis unless there are no reference samples in that range. In that case, LIMS displays themessage:
No reference samples found in the correction range selected.
Note that the highlighted selector bar need not be on a range marker, and the current analysis remainshighlighted rather than moving the highlighting to a range marker. If the highlighted analysis does nothave an asterisk, the user will be advised that they need to move to an analysis that matches that selectedin the Correction Factor List combo box, that is, one that does have an asterisk in column 4.
Now do the correction factors for Mr. Johnson’s samples from Victoria, B.C. Select “ P (My DeltaPlus) for 13C.” Click Query. Note the asterisks in column 6. ISODAT uses these to indicate that this isa standard. Do not confuse these asterisks with the ones in column 4 which indicate that the isotope ofan analysis is identical to that selected in the Correction Factor List combo box. Double click on peak2 of P-659. From the Reference combo box choose G-5, which is the reference material that wasanalyzed in the elemental analyzer with Mr Johnson's samples. The standard deviation is 0.01, so acceptthe proposed additive correction factor of -0.27 and click the arrow button. This completes the δ
13Ccorrections; click Close. Repeat for My Delta Plus for δ
15N. Select “ P (My Delta Plus) for 15N.” Click
Query. Double click on the last δ15N analysis, that is, the last one with an asterisk in column 4 (peak 2
of P-658). After the Normalization Equation Coefficients form opens, select G-5 from the Referencecombo box. The additive correction factor is -0.13 and the standard deviation is 0.06 so accept thesecoefficients and click on the large arrow button. Click Close. This completes task 6 in Fig. 3.
Close the Analyses and Normalization Equations form.
Print Samples in Progress Form
When mass spectrometer analyses are added to the Analyses table in LIMS, they are alsoautomatically added to the Table of Samples In Progress. When the user is satisfied with the δ value of asample (assuming that the sample may require replicate analysis), the final δ value is “ stored,” saving its
δ value in the Table of Samples. When a δ value of a sample is stored, that sample is removed from theTable of Samples In Progress.
As an example, print the δ13C results for the samples C-5 through C-7. Click Print Samples in
Progress and the Print Samples in Progress form should open (Fig. 21). Select C for the Prefix. TheIsotope combo box is automatically updated and opened displaying 13C and 18O as possible selections.Select 13C. Enter 5 and 7 in the From and to boxes, respectively. Click Print. LIMS displays themessage

70
Fig. 21. Print Samples In Progress form.

71
Do you really want to print all of the analyses of reference sample C-5?
This message appears in order to allow the user to modify the selection to minimize wasting of paper. Click Yes. A Samples In Progress report is printed for the selected range (Fig. 22). The user shouldcompare his or her printer output with that in Fig. 22 to ensure that no characters have been omitted. Note that analyses D-116957, D-116958, and D-117195 are ignored for sample C-5 (note large X in rightcolumn of Fig. 22). LIMS calculates a mean δ
13C value, 1.89, and two standard deviations. The first islabelled Std Dev 1 and includes all of the analyses. The second, Std Dev 2, is calculated after the farthestoutlier is eliminated. Means for both standard deviations are determined and the one that appears as theFinal Delta is the one associated with the Std Dev in bold font. Users might look at the existing codethat is enabled when the software switch, Reston Features (page 86), is enabled. This algorithm in LIMScan be modified to suit the user’s own needs.
Aliquot IDs and (or) interfering mass values can be printed (assuming they exist in the database). Click Print Samples In Progress on the Main Menu. Select the Prefix N. Select 15N for the Isotope. Check the Print Aliquot ID’s and the Print Interfering Masses check boxes. The Replace ErrorMessages With Comments check box should already be checked. Enter 41 in the From text box. Click
Print. The report printed (Fig. 23) shows values of m/z = 28, 40, and 44 for this sample. The usershould compare his or her printer output with that in Fig. 23 to ensure that no characters have beenomitted. Ion gauge values for the sample and standard are shown, and values for the major ion beamelectrometer outputs of the sample and standard are shown.
Click Print Samples In Progress, select Prefix G, select 13C for the Isotope, enter a sample rangeof 13 to 30, and click Print. This will print the δ
13C analyses of Mr. Johnson’s samples. Repeat for δ15N.
This completes the seventh task in Fig. 3.
Edit Samples In Progress Form
Edit Samples In Progress is used to edit the analyses that determine the Final δ value. Click EditSamples In Progress to open the Edit Samples In Progress form. Select C as the Prefix and 13C as the
Isotope. Enter 5 in the From text box. Click Query. The analyses of C-5 are shown (Fig. 24). Notethat two standard deviations are shown. To show the effect of including poor analytical data on Std Dev1, click on the Ignore box for analysis D-116957. The Final Delta and both standard deviations areimmediately updated. Note that Std Dev 1 changes from 0.01 to 0.04. Click the same check box toignore D-116957.
A Final Delta will not be calculated for a sample with a null value (or -999) in Pen. Delta field(penultimate delta). To demonstrate this, click the Ignore box of D-117195 to uncheck this box. Notethat Final Delta and both standard deviations are cleared. Click the Ignore box of D-117195 so that anumerical value in Final Delta is displayed.

72
Samples in Progress for 13C 1/20/98 1:42:23 PMBetween C-5 And C-7 Proc. Penultimate Corr. Corrected
Date Analysis.Pk Port Code Comments Delta Coefs. Delta Ign
C-5 Reference Q1 02 --> C [Cal] calcite
1/6/95 D-116957 77 312 +1.84 1.00000, -0.15 +1.69 X1/6/95 D-116958 77 312 +2.03 1.00000, -0.15 +1.88 X1/6/95 D-116959 77 312 +2.04 1.00000, -0.15 +1.891/7/95 D-116993 84 312 +2.04 1.00000, -0.15 +1.891/7/95 D-117003 89 312 +2.04 1.00000, -0.15 +1.891/8/95 D-117011 73 312 +2.02 1.00000, -0.15 +1.871/9/95 D-117023 75 312 +2.05 1.00000, -0.15 +1.901/9/95 D-117031 84 312 +2.05 1.00000, -0.15 +1.901/11/9 D-117053 75 312 +2.03 1.00000, -0.15 +1.881/11/95 D-117067 83 312 +2.04 1.00000, -0.15 +1.891/12/95 D-117089 74 312 +2.04 1.00000, -0.15 +1.892/10/95 D-117107 83 312 +2.03 1.00000, -0.15 +1.882/13/95 D-117121 74 312 +2.01 1.00000, -0.15 +1.862/13/95 D-117129 78 312 +2.04 1.00000, -0.15 +1.892/15/95 D-117154 76 312 +2.04 1.00000, -0.15 +1.892/15/95 D-117178 89 312 +2.03 1.00000, -0.15 +1.882/15/95 D-117182 71 312 +2.03 1.00000, -0.15 +1.882/16/95 D-117195 71 312 -999.00 1.00000, -0.15 X2/17/95 D-117251 89 312 +2.06 1.00000, -0.15 +1.912/18/95 D-117263 83 312 +2.01 1.00000, -0.15 +1.862/20/95 D-117328 74 312 +2.01 1.00000, -0.15 +1.862/21/95 D-117330 77 312 +2.04 1.00000, -0.15 +1.892/21/95 D-117332 81 312 +2.06 1.00000, -0.15 +1.913/4/95 D-117399 85 312 +2.06 1.00000, -0.17 +1.893/4/95 D-117407 85 312 +2.05 1.00000, -0.17 +1.88
Std Dev 1 = 0.01 Final Delta = 1.89 Std Dev 2 = 0.01
C-6 Johnson DHC2-0.25 02 --> C[Cal] calcite
1/5/95 D-116943 70 312 -2.07 1.00000, -0.15 -2.222/9/95 D-117093 75 312 -2.05 1.00000, -0.15 -2.20
Std Dev 1 = 0.01 Final Delta = -2.21
C-7 Johnson DHC2-0.50 02 --> C[Cal] calcite
1/5/95 D-116945 71 312 -2.08 1.00000, -0.15 -2.232/9/95 D-117095 76 312 -2.05 1.00000, -0.15 -2.20
Std Dev 1 = 0.02 Final Delta = -2.22
Fig. 22. Example of Print Samples In Progress report.

73
Samples in Progress for 15N 1/20/98 1:48:44 PMBetween N-41 And N-41
Proc. Penultimate Corr. CorrectedDate Analysis.Pk Port Code Comments Delta Coefs. Delta Ign
N-41 Johnson 1286 60 --> N [N2O] nitrous oxide
Aliquot ID: Aliquot 56/6/96 F-18208 124 m/z = 28 ion b 0.996 1.00000,6/6/96 F-18208 138 m/z = 40 ion b 2.078 1.00000,6/6/96 F-18208 140 m/z = 44 ion b 0.039 1.00000,6/6/96 F-18208 161 Ion gauge (sam 2.9372 1.00000,6/6/96 F-18208 162 Ion gauge (sta 2.93681 1.00000,6/6/96 F-18208 163 Major ion beam 1.00118 1.00000,6/6/96 F-18208 164 Major ion beam 1.0042 1.00000,6/6/96 F-18208 580 0.636 v -2.85 1.00000, -0.28 -3.13
Fig. 23. Example of Print Samples In Progress report with Print Aliquots IDs and Interfering Massescheck boxes enabled.

74
Fig. 24. Edit Samples In Progress form.

75
One may easily view the results of compound specific isotopic analyses. As an example, set thePrefix to G, select 13C from the Isotope combo box, and click Query. Move to sample G-6 by clicking
List or the navigation buttons. Listed are δ13C values for a sludge sample. To print a report of these data
(Fig. 25), click Close, click Print Samples In Progress, select Prefix G, select Isotope 13C, enter 6 inthe From text box, check the Print Aliquot IDs and the Print Interfering Masses check boxes, andclick Print. The user should compare his or her printer output with that in Fig. 25 to ensure that nocharacters have been omitted. Note that no Final Delta value is calculated by LIMS. Such a value isprobably not of much use because it is the average of the δ values of all of the aliquots. It is this valuethat would be stored in the Table of Samples and that would be displayed on the Sample form. Thus, itis necessary to use Samples In Progress for viewing and printing reports on compound specific analyses.
Open the Edit Samples In Progress form again if it was closed. Click Prefix G, select 13C from the
Isotope combo box, and click Query. Click List and select sample G-6. To delete the sample from theTable of Samples In Progress, click Delete. This act does not delete the sample (or analyses) from thedatabase. It only removes the sample from the Table of Samples In Progress. To add it back, the usercan click Add Samples to Samples In Progress on the Main Menu discussed below. Generally, the
Delete button is rarely used because samples are removed automatically from the Table of Samples InProgress when the Final Delta is stored in the Table of Samples by clicking Store Samples In Progressas described below.
Click List and select sample G-13. The user can review the δ13C values of Mr. Johnson’s samples.
Use the List button or the navigation buttons to move to another sample. The user can repeat for δ15N
values by selecting 15N from the Isotope combo box and clicking Query. No editing of the samples isnecessary; thus, this completes the eighth task in Fig. 3. No sample reruns are necessary because we onlyplanned to analyze each sample once. Thus, the ninth task in Fig. 3 is also completed.
Occasionally one may realize that the mean δ value calculated from several mass spectrometeranalyses is in error and needs to be corrected. If the user has a good idea of what the true δ value of thesample should be, e.g., the average of two “ close” δ values, the Add Ethereal button can be clicked toadd this value to the table of analyses. Clicking this button brings up the “ Ethereal mass spectrometer.” Enter the δ value for the sample—this is the corrected δ value, not the penultimate δ value. Ignore(check the Ignore check box) all of the other analyses of the selected sample. If all analyses except theEthereal δ value are ignored by checking each Ignore check box, then the Ethereal δ value is stored inthe Table of Samples when Store Samples in Progress is executed with the Single Analysis check boxchecked (see below). Such a case can arise, for example, when there are two analyses of a sample thatare fairly close, but not close enough to satisfy the algorithm that calculates the Final Delta. If thesample were exhausted, the user could store an average of the two extant analyses.
The other buttons on the Edit Samples In Progress form are described below:
Retrieve is described below in the section titled “ Add Samples to Samples In Progress” (see page78).

76
Samples in Progress for 13C 1/20/98 1:59:28 PMBetween G-6 And G-6
Proc. Penultimate Corr. CorrectedDate Analysis.Pk Port Code Comments Delta Coefs. Delta Ign
G-6 Johnson Sludge 1 26 --> G [C & N] C- and N-bearing material
Aliquot ID: C42/18/96 P-101 0 355 -25.55 1.00000, -0.36 -25.91Aliquot ID: C52/18/96 P-101.002 0 355 -25.35 1.00000, -0.36 -25.71Aliquot ID: C62/18/96 P-101.003 0 355 -23.33 1.00000, -0.34 -23.67Aliquot ID: C72/18/96 P-101.004 0 355 -23.55 1.00000, -0.34 -23.89Aliquot ID: C82/18/96 P-101.005 0 355 -23.81 1.00000, -0.34 -24.15Aliquot ID: C92/18/96 P-101.006 0 355 -24.35 1.00000, -0.34 -24.69Aliquot ID: None2/19/96 P-110 0 355 -22.84 1.00000, -1.68 -24.52
Fig. 25. Example of report for δ15N results of compound specific isotope-ratio analyses (C4 through C9).

77
Print allows the user to print analyses of the prefix, isotope, and range selected. However, it is notquite as flexible as the Print Samples In Progress form because the options of printing aliquot IDs orprinting interfering masses are not offered.
Close the Edit Samples In Progress form.
Store Samples In Progress Form
Ranges of samples are “ stored” (Final Delta values of samples in the Table of Samples In Progressare calculated and saved in the Table of Samples, and the sample is removed from the Table of SamplesIn Progress) with the Store Samples In Progress form. Click Store Samples In Progress. Select
Prefix C and the Isotope combo box is updated and opened. Select 13C. For the range choose a rangelarge enough to include all the samples to be stored. Use 1 to 999. Click Store and the Status form willdisplay the samples as they are stored. Only samples for which a Final Delta can be calculated are stored. Thus, there must be at least two analyses for every sample that is stored. Samples for which correctionfactors have not been determined cannot be stored because a Final Delta cannot be calculated for them. When the samples have been stored, click OK.
Store Mr. Johnson's samples for δ13C and all others that have only a single analysis. Click Store
Samples In Progress. To store samples that have only a single analysis, the user must check the StoreSingle Analysis check box. Click Store Samples In Progress. Click Prefix G, select Isotope 13C, enter1-999 for the sample range, check the Store Single Analysis check box, and click Store. When LIMSgets to sample G-5 it displays the message:
Sample G-5 has data for more than 1 peak. Therefore, a mean value will not be calculated andno value will be stored in the Samples Table.
Do you want this sample deleted from Samples In Progress?
Click Yes because the mean value of this sample is meaningless as discussed above. Deleting the samplefrom the Table of Samples In Progress does not delete any isotopic analyses or results. LIMS repeats themessage for sample G-6. Click Yes. When the samples have been stored, click OK.
Repeat for Prefix G and Isotope 15N. Mr. Johnson's samples have now been “ stored,” completing thetenth task in Fig. 3.
To print a report of Mr. Johnson's samples, click Projects. Double click on 6/6/95 Johnson to openthe Project form. Click Print Report and a final project report is printed. To save isotopic data fromthis project in ASCII format on a diskette, click Results and click Yes. Insert a diskette into thecomputer. LIMS will advise the user that the file will create a file with 18 samples and will save the filewith a default name of Johnson.txt on the diskette. The user can change this file specifier if desired. Click Select and the file is created. To save all of the information in the Table of Samples about each

78
sample in this project to a diskette in Excel 5.0 format, click Results and click No. Using LIMS defaultfile specifier, the file G-13.xls is created on the diskette. Click Close. This completes the tasks on Fig. 3for Mr. Johnson’s samples and the results could be sent via mail or E-mail to him.
Add Samples to Samples In Progress Form
In the event that one wants to revise normalization coefficients for a sample and change the stored δvalue, one will need to add the sample back into the Table of Samples In Progress. This can be done byclicking Add Samples to Samples In Progress on the Main Menu. The sample Prefix, the Isotope, andthe sample range will need to be selected. If a sample is reanalyzed, the sample is automatically added tothe Table of Samples In Progress.
One can also add a sample to the Table of Samples In Progress by clicking Retrieve on the EditSamples in Progress form.
Normalization Equation Ranges Form
For audits, one may want to print the coefficients of the normalization equations and their ranges. This is done with the Normalization Equation Ranges form which is accessed by clicking Normaliza-tion Equation Ranges on the Main Menu. One needs to select a mass spectrometer and isotope from the
Normalization Equation List combo box and enter the range of the mass spectrometer analyses.
This completes the discussion of the Example Database.

79
INSTALLING A NEW DATABASE FILE
A new database is installed when the user is ready to begin using LIMS in their laboratory. Thedatabase is a backend database that holds the samples, analyses, and projects of the user’s laboratory. The user first needs to select from between two possible database files. If the database must beaccessible by LIMS version 1.4 (the Access 2.0 version of LIMS), the user should install the Access 2.0compatible database, LM4DATA.mdb. If only Windows 95 or NT 4.0 (or higher) platforms will be usedfor LIMS, the user should install Lm7data.mdb, which is only compatible with Access 97.
To install the new database, find the New Database diskette that contains the file that will be thebackend database (either LM4DATA.mdb or Lm7data.mdb) and insert it into the computer. Locate thefolder for the backend database. This is likely to be the folder in which Lm7datae.mdb now is found. Copy the new database file (either LM4DATA.mdb or Lm7data.mdb) from the New Database diskette tothis folder. The user will need to delete the current backend database, change its name, or move it toanother folder in order to force LIMS to query the user for the location of the new database.
When LIMS is opened, one or more mass spectrometers will need to be installed. Follow theinstructions on page 91 and then close the Mass Spectrometer Configuration form. Click New ProjectLogin on the Main Menu to open the Login New Samples form. Click Add/Edit Customer to open the
Customers form. Customer # 001 should be visible. Click Edit. Replace MyLastName with the user’slast name. Replace MyFirstName with the user’s first name, etc. When finished, click Save. Click Listor use the navigation buttons to view the customers in the table of customers. The customers “ Test” and“ Reference” will be found. “ Test” is often used for samples that are employed to test a massspectrometer or for fill-in samples whose δ values are not needed. “ Reference” is normally used todesignate reference materials. Click Close to close the Customers form and click Cancel to close the
Login New Samples form.
When the Login New Samples Form opens, the Country combo box is set to the country selected inthe LIMS For Light Stable Isotopes Configuration Form. See page 85 for instruction on how to setthe default country to the user's country. The user should at this time set the software switches and otherpreferences on the LIMS For Light Stable Isotopes Configuration Form.
Click Projects on the Main Menu to open the Search for Projects form. Nineteen projects havealready been created and should be shown. The submitter of five projects is Reference, and these are theH2, CO2, SO2, N2, and O2 used as the references (standards) in continuous flow measurements. If one doesnot plan to employ continuous flow techniques, these projects can be deleted. There are fourteen Testprojects. These are useful for testing. Several are for an elemental analyzer. Their samples are forempty boats and no boats for background determination. If other media are needed, now is a good timeto add them (see page 93).
Stable isotope laboratories will typically employ a number of internally produced reference materialson a daily or weekly basis for their own quality assurance. The user should log all such referencematerials into LIMS now. The known δ values versus VSMOW, VCDT, VPDB, AIR, or other

80
internationally accepted reference should be added to the table of references (see page 89).
The user should modify the Alternative Field Names on the LIMS For Light Stable IsotopesConfiguration form (Fig. 17). For example, the user might be primarily interested in oceanographicsamples and might prefer the names “ Station” , “ Cast” , “ Niskin” , and “ Depth” , for “ User Def Caption2” , “ User Def Caption 3” , “ User Def Caption 4” , and “ Elevation” (see page 85). If the user plans toemploy the Excel 5.0 template for importing projects of samples entered by those submitting samples tothe laboratory (this is strongly advised), the column headings will also need to be changed on theworksheet Alt.xls (see page 81). Note that the worksheet Alt.xls is protected, but there is no password. Thus, users can easily unprotect it, make the necessary changes, and protect it again. All yellow cellsshould remain unprotected; all others can be protected so that column headings cannot be changedaccidentally by those submitting samples to the laboratory.
The new database is now ready for use.
The user should make backups of the backend database on a regular interval. Have at least twobackups, for example, one for even days of the month and one for odd days of the month. In the author'slaboratory, a copy is saved to another hard disk daily using an automatic backup program for .mdb files(Total Access Agent, http:/www.fmsinc.com). The importance of regular, frequent backups cannotbe stressed too strongly. If power fails while LIMS is writing to one’s backend database, it willlikely be corrupted and could be a total loss. Thus, an uninterruptible power supply for the LIMScomputer is very worthwhile.

81
IMPORTING PROJECTS USING THE EXCEL 5.0 TEMPLATE
An easy way for a user to create a project in LIMS is to import the sample headings and projectinformation entered in an Excel 5.0 template file by the customer submitting the samples. This techniqueeliminates typographic errors by the laboratory staff. Any errors are the responsibility of the submitter ofthe samples.
The minimum required information that must be provided by the template file includes:
(1) the submission date,
(2) the name of the submitter (only last name may be needed if the last name is unique in thetable of customers),
(3) the numeric media code, and
(4) Sample IDs for each of the samples submitted.
Other project information will be imported if it is present, e.g., project purpose and location. Additionalsample information, such as latitude, longitude, country, etc., will be imported if it is present.
The LIMS diskette titled Excel 5.0 Template for Creating Sample Projects contains two MicrosoftExcel 5.0 files: USGS.xls and ALT.xls. The two template files are unpopulated with data. The choiceof which one to use is based on the following:
ALT.xls This is for use by submitters who use a laboratory where Alternative Field Names areemployed (see page 85). This probably includes the vast majority of users. Theadvantage of this template is that column headings can be changed to match thealternative field names.
USGS.xls This is for use by users who submit samples to a laboratory that has not checked the
Alternative Field Names Enabled check box on the LIMS For Light StableIsotopes Configuration form, e.g., the author’s laboratory. The column names cannotbe changed or importing will fail.
There is a significant difference in size between ALT.xls and USGS.xls, 97 kb and 425 kb, respectively. Most of this difference is due to the fact that USGS.xls contains all the states and counties in the U.S.
In order to use USGS.xls, the user only needs to ensure that the Alternative Field Names Enabledcheck box on the LIMS For Light Stable Isotope Configuration form is deselected. After a customerhas entered his project and sample information in the spreadsheet, LIMS should import this informationand create a project.

82
Part of Excel 5.0 template ALT.xls is shown in Fig. 26. In addition to customer information (lastname, first name, address, etc.) and project information (submission date, title, and general location), thefollowing fields are provided for sample information:
Sample ID User Def Cap 2Country Code User Def Cap 3State/Province Code User Def Cap 4Latitude User Def Cap 5Longitude User Def Cap 6Lat. Long. Accuracy Cap 7Collection Date/Time Other InfoEnding Collection Date/TimeElevationLength UnitTopBottom
It is possible to change 10 of these (Sample ID, User Def Cap 2 through 6, Cap 7, Other Info, Top, andBottom) using the LIMS For Light Stable Isotope Configuration form and selecting the AlternativeField Names Enabled check box. If this has been done, the user must change the names on the Exceltemplate to match exactly or LIMS cannot import the project. The Excel template files can then bedistributed to customers.
A Sample ID (or equivalent name if the user has changed the name of this column) must be providedfor each sample. Sample IDs must be unique. LIMS will check to be sure that Sample IDs are uniqueand will not import a project if they are not unique. The Country Codes are listed on the spreadsheettitled “ Countries.” The State/Province Codes are listed on the spreadsheet titled “ States-Provinces.” Latitude and longitude can be entered as 45.3333 in the Degrees field or 45 in the Degrees field and 20 inthe Minutes field. No characters other than numbers and decimal points should be entered (for example,do not enter 20" for 20 seconds). The Collection Date/Time and Ending Collection Date/Time should beentered in a format compatible with that in your Microsoft Windows settings. The ending date/time isused when collecting a precipitation or similar sample. The Elevation of the site must be a numericentry. The unit of distance (meter or foot) is specified in the column Length Unit. Valid entries are mand ft. If the columns Top or Bottom are used, they must contain only numeric data (no alpha charactersare allowed). The seven remaining fields, beginning with User Def Cap 2, can contain alphanumericentries.
As supplied, the maximum length of entries that will be imported and stored in LIMS is:
Sample ID 35 charactersUser Def Cap 2 40 charactersUser Def Cap 3 20 charactersUser Def Cap 4 20 characters
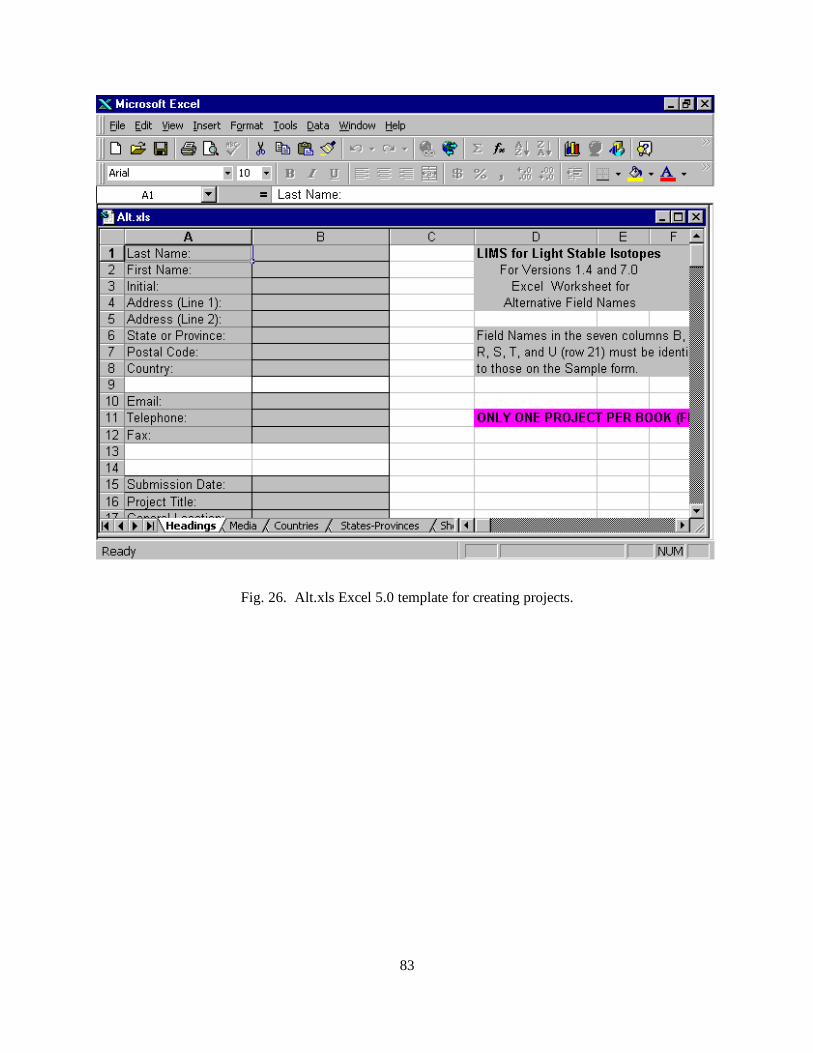
83
Fig. 26. Alt.xls Excel 5.0 template for creating projects.

84
User Def Cap 5 20 charactersUser Def Cap 6 22 charactersCap 7 26 charactersOther Info 70 characters
Any of these can be easily increased by the user—see the Microsoft Access Help or Microsoft 1997a,1997b.

85
SPECIAL FEATURES
The Special Features button allows the user to change the configuration of LIMS and to add,delete, and edit mass spectrometers, procedure codes, media codes, etc. Clicking Special Features opensthe Special Features subform. The user may be prompted for a password.
LIMS For Light Stable Isotopes Configuration Form
Clicking Config opens the LIMS For Light Stable Isotopes Configuration form (Fig. 17). Thisform allows the user to (i) edit eight alternative field (column) names (and “ Top” and “ Bottom” ) thatappear as labels on the Samples form, (ii) change the color of most of the forms, (iii) set softwareswitches, and (iv) edit the value of various tokens or parameters used in the software. All of these valuesare stored in the code module. When you click Exit on the Main Menu, LIMS makes a backup of theseitems in the Access database Lm7prefs.mdb (LM4PREFS.mdb in the Access 2.0 version of LIMS). Ifthe user updates the code module Lm7code.mdb, LIMS will search for Lm7prefs.mdb. If LIMS finds it,it will ask the user if the configuration parameters should be updated. The user should choose in theaffirmative.
Alternative Field Names
If users check the Alternative Field Names Enabled check box, they may change the names ofeight fields on the Sample form (and Range of Samples report). For example, one might want one ofthe fields to be Dose if one is working with urine from diabetic patients. Generally one will use upperand lower case letters and the underscore character. In no case should the following five characters beused:
[ ] ‘ . !
Form Colors
To change the color of a form, first click Edit, choose a form from the Form Colors combo box,click on a color on the palette, and click OK on the color palette. Try it with the Main Menu firstbecause it can be seen below the LIMS For Light Stable Isotopes Configuration form. One can resetthe colors to the initial LIMS for Light Stable Isotopes colors by clicking Set default colors. If one has avideo card that can produce more than 256 colors, one can click Define Custom Colors on the colorpalette to produce more colors than employed in LIMS (LIMS requires and assumes you have at least256 colors).

86
Software Switches
The following software switch options may be selected:
1. Show latitudes and longitudes on forms and reports using decimal degrees (33.34221, forexample) rather than DDMMSS (Degree Degree Minute Minute Second Second) format. Datain the LIMS Table of Samples are always stored in decimal degrees.
2. Display elevations and depths on forms and reports using meters instead of feet. Data in theLIMS Table of Samples are stored in feet. (This, of course, could be changed.)
3. Require working standard label to be an integer between 1 and 366.
4. Check for missing mass spectrometer analyses when starting LIMS.
5. Use ‘Rel. to VPDB' for δ18O values of carbonates instead of ‘Rel. to VSMOW.'
6. Require port label identifiers on the mass spectrometers to be integers between 0 and 99.
7. Display “ Headings Complete” text box on the Project form. This is useful when extensiveamounts of information may need to be added to the Sample form, often after the samples areanalyzed.
8. Reston features enabled. This switch changes several values to Reston default values. Itenables an algorithm for preventing isotopic replicate analyses from being stored unless thestandard deviation is sufficiently low, makes visible NWQL, NAWID, and Access buttons andforms, makes visible some buttons on the Project form, and enables several other features.
9. Debugging enabled will make numerous text boxes visible on forms. Once you toggle thischeck box, it is a good idea to exit LIMS and restart it.
Paper Size
The paper size token, US_PAPERSIZE, can be found by clicking LIST. It can have two values, 0and -1. A value of 0 is used to select the A4 paper size and -1 selects U.S. standard paper (8.5 inches x11 inches). The value for this token is changed by clicking Edit, replacing the value in the Value textbox, and clicking Save to save the change.
Default Country
When the Login New Samples form opens, the Country combo box is set to the country selectedby the token labelled “ DEFAULT_COUNTRY” in the configuration table. To change the country to his
87
or her own country, identify the two character string that is used for the new country. This is done byclicking the Samples and Analyses on the Main Menu, entering a 1 for the sample number, clickingFind, opening the Country combo box, and scrolling to the new country. The first two character (CAfor Canada, for example) are needed. To set the default country to this new country, click SpecialFeatures on the Main Menu, enter the password if requested, click Config, click List, select the tokenDEFAULT_COUNTRY, click Edit, change the two character token from “ US” to that identified above,click Save, and click Close. The new default country can be checked by clicking New Project Login.
Other Parameters
The other tokens whose values can be changed are listed below:
ALT_SAMPLE_CAPTION_BOT Caption for bottom (bottom of perforation) when alternativefield names are enabled.
ALT_SAMPLE_CAPTION_TOP Caption for top (top of perforation) when alternative fieldnames are enabled.
CF_Std_OurLabID_AIR The Our Lab ID of the mixed reference gas used for continu-ous flow analysis.
CF_Std_OurLabID_CO2 The Our Lab ID of the CO2 reference gas used for continuousflow analysis.
CF_Std_OurLabID_H2 The Our Lab ID of the H2 reference gas used for continuousflow analysis.
CF_Std_OurLabID_N2 The Our Lab ID of the N2 reference gas used for continuousflow analysis.
CF_Std_OurLabID_O2 The Our Lab ID of the O2 reference gas used for continuousflow analysis.
CF_Std_OurLabID_SO2 The Our Lab ID of the SO2 reference gas used for continuousflow analysis.
COMPANY_NAME Name of company, university, or organization.
FINN_BLANK_CORR_EA_DATA Set to -1 to import EA blank corrected delta values. Other-wise set to 0 to use non-blank corrected data.
FINN_COL_HEAD_13C Unique identifier in δ13C column in ISODAT dual inlet
spreadsheet.

88
FINN_COL_HEAD_15N Unique identifier in δ15N column in ISODAT dual inlet
spreadsheet.
FINN_COL_HEAD_17O Unique identifier in δ17O column in ISODAT dual inlet
spreadsheet.
FINN_COL_HEAD_18O Unique identifier in δ18O column in ISODAT dual inlet
spreadsheet for other than H2O samples.
FINN_COL_HEAD_18OH2O Unique identifier in δ18O column in ISODAT dual inlet
spreadsheet for H2O samples.
FINN_COL_HEAD_2H Unique identifier in delta 2H column in ISODAT dual inletspreadsheet.
FINN_COL_HEAD_30Si Unique identifier in delta δ30Si column in ISODAT dual inlet
spreadsheet.
FINN_COL_HEAD_34S Unique identifier in δ34S column in ISODAT dual inlet
spreadsheet.
FINN_COL_HEAD_37Cl Unique identifier in δ37Cl column in ISODAT dual inlet
spreadsheet.
FINN_COL_HEAD_GCC_13C Unique identifier in δ13C column in ISODAT GCC CF
spreadsheet.
FINN_COL_HEAD_GCC_15N Unique identifier in δ15N column in ISODAT GCC CF
spreadsheet.
FINN_COL_HEAD_GCC_18O Unique identifier in δ18O column in ISODAT GCC CF
spreadsheet.
SHOW_CFC-11_12_&_113 Set to -1 to show CFC-11, 12 & 113 simultaneously onsample form and reports. Otherwise set to 0.
STORE_EA_CONCENTRATIONS When set to -1, Finnigan EA concentrations are stored whenisotopic compositions are imported. Otherwise set to 0.
STORE_INTERF_MASSES When set to -1, interfering mass voltages are stored whenisotopic analyses are imported. Otherwise set to 0.
STORE_ION_GAUGES When set to -1, Finnigan ion gauge values are stored whenisotopic analyses are imported. Otherwise set to 0.
STORE_MAJOR_VOLTAGES Set to -1 to store ion gauge readings and major ion beam

89
volatages when importing analyses. Otherwise, set to 0.
STORE_UNEXPECTED_PROCEDURES Set to -1, unexpected procedures (192 - 198) are stored whenisotopic analyses are imported. Otherwise, set to 0.
UMASS_COL_HEAD_13C Column header of δ13C column in Micromass spreadsheet.
UMASS_COL_HEAD_15N Column header of δ15N column in Micromass spreadsheet.
UMASS_COL_HEAD_17O Column header of δ17O column in Micromass spreadsheet.
UMASS_COL_HEAD_18O_Other Column header of δ18O column in Micromass spreadsheet for
samples other than water.
UMASS_COL_HEAD_18O_Water Column header of δ18O column in Micromass spreadsheet for
water samples.
UMASS_COL_HEAD_2H Column header of δ2H column in Micromass spreadsheet.
UMASS_COL_HEAD_30Si Column header of δ30Si column in Micromass spreadsheet.
UMASS_COL_HEAD_34S Column header of δ34S column in Micromass spreadsheet.
UMASS_COL_HEAD_37Cl Column header of δ37Cl column in Micromass spreadsheet.
Reference Samples Form
The Reference Samples form (Fig. 27) is opened by clicking Special Features on the Main Menuand clicking References. This form is used to add, delete, or edit reference samples used in thenormalization equation calculations. To add a reference sample, click Add, select the isotope from the
Isotope combo box, select the sample prefix from the Prefix combo box, enter the integer samplenumber, and enter the “ true value” in the Final Delta text box. To save results, click Save. To edit anexisting reference click List or the navigation buttons to move to the reference. Click Edit, make thechange, and click Save. Click Delete to delete a reference sample.
Prefixes & Next Sample # Button
The Prefix form is opened by clicking Special Features on the Main Menu and clicking Prefixes &Next Sample #. One can only edit the positive integer in the Next Sample text box. This is the integerused for assigning the next Our Lab ID in the Login New Samples form. If one changes this integer, oneneeds to be careful that samples with duplicate Our Lab IDs are not generated. This is a sure method ofcreating havoc in LIMS.

90
Fig. 27. Reference Samples form.

91
Mass Spectrometer Configuration Form
The Mass Spectrometer Configuration form (Fig. 28) is opened by clicking Special Features onthe Main Menu and clicking Mass Spec. Install a new mass spectrometer as follows:
1. Click Add.
2. Enter a single letter code for the mass spectrometer. Once a mass spectrometer is created,this single letter code cannot be changed (the mass spectrometer must be deleted and a newmass spectrometer must be installed). One probably should avoid using the letters already usedfor sample prefixes (C, G, J, N, R, S, and W) and the letters O and I. The letter E is notavailable because it is used for the Ethereal mass spectrometer. The short name is used inseveral combo boxes.
3. Enter the vendor serial number which may be used by some mass spectrometer manufacturerson the file of isotopic results in order to identify the mass spectrometer that generated theisotopic results. If your mass spectrometer manufacturer supports LIMS, ask what entry needsto go into this field.
4. Enter an analysis import format appropriate for your mass spectrometer.
5. Enter a sample export format as appropriate for your mass spectrometer. If a user’smanufacturer is not listed, “ LIMS Default” can be selected. The user can then generate multi-sheet templates and (or) sample lists even though the file on the diskette generated by thetemplate code cannot be used. The user may want to encourage mass spectrometer vendors tomodify their mass spectrometer software so that it can make use of the LIMS sample exportfile.
6. Select all isotopes that will be analyzed by the mass spectrometer.
7. Enter the sample prefix of the most common sample analyzed. This field can be left blank.
8. Check the “ Continuous Flow Capability” check box if appropriate.
9. Click Save to create your mass spectrometer.
One may edit most fields for an existing mass spectrometer. One cannot deselect an isotope if there areany analyses of that isotope in the table of analyses. Likewise, one cannot delete a mass spectrometer ifthere are any analyses for it in the table of analyses.
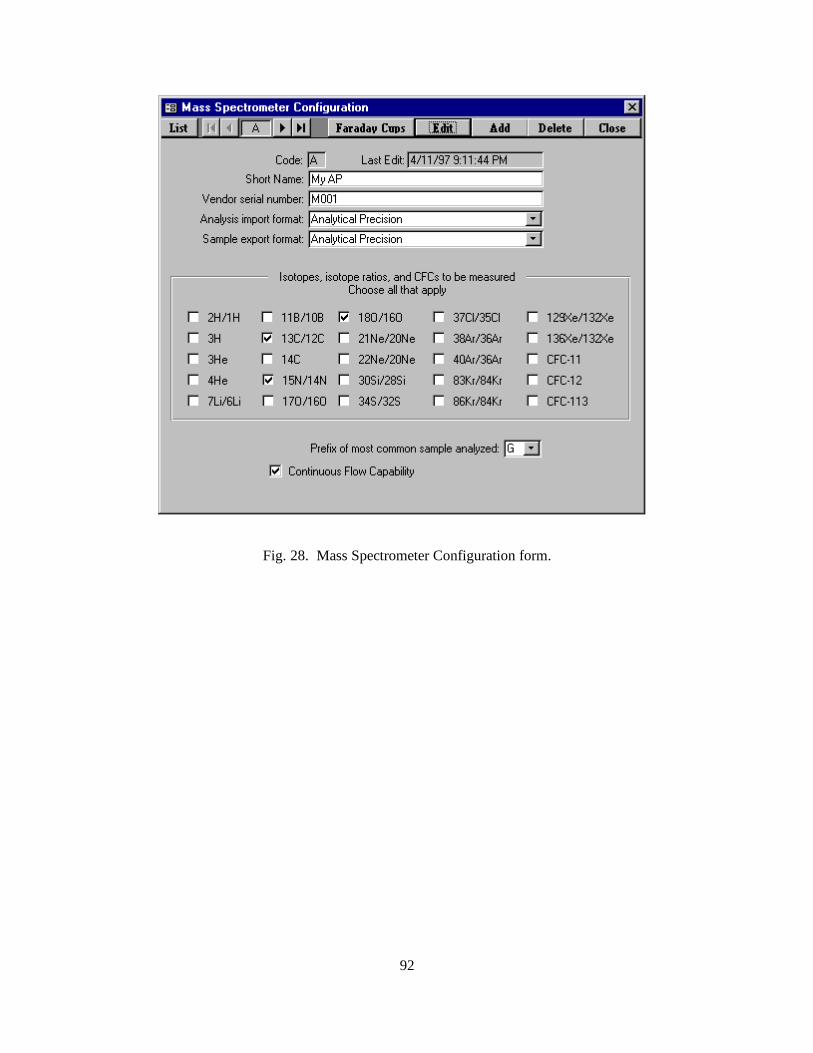
92
Fig. 28. Mass Spectrometer Configuration form.

93
Faraday Cup Information Form
When the user clicks Faraday Cups LIMS advises the user that Faraday cup information for allmass spectrometers can be edited. Click Faraday Cups. Click OK and the Faraday Cup Informationform opens. For each Faraday cup of each mass spectrometer, one can assign an electrometer outputcoefficient. This is the expansion coefficient that is used when an interfering mass value is imported andthat is printed on the Samples In Progress report for interfering masses. If analyses with interferingmasses are imported and no Faraday cup electrometer output coefficients are found, a default value of 1is employed.
Mass Spectrometer Error Codes Form
The mass spectrometer Error Codes form is opened by clicking Special Features on the MainMenu and clicking Mass Spec Error Codes. The existing error codes are used by the author’s MicrosoftVisual Basic mass spectrometric data acquisition and control software. One can add additional codes,delete these, or edit existing codes.
NAWID, NWQL, and Access Forms
NAWID, NWQL, and Access are program features used only by the U.S. Geological Survey andare only visible when Reston Features is enabled.
Media Form
The Media form is opened by clicking Special Features on the Main Menu and clicking Media. One can add, edit, and delete media in a manner similar to that used with the Reference Samples formabove. The description can always be edited. The prefix cannot be edited if any samples of the mediumhave been logged in because labels may already exist on sample containers with this prefix. One isrequired to select one and may select two isotopes for a medium. These will become the low and highisotopes of the medium. An example of adding a medium is given on page 96. Information aboutdeleting media codes is given on page 97.
Procedure Form
The Procedure form is opened by clicking Special Features on the Main Menu and clicking
Procedures. One can add, edit, and delete procedure codes using this form in a manner similar to thatused with the Reference Samples form above. Note that only the description of the procedure code canbe edited. When LIMS was designed, it was decided to build in a relationship between the procedurecodes (table 4) and the isotope codes (table 3) in order to minimize disk accesses and to speed up

94
the program. This relationship is:
Integer(Procedure code)/100 = Isotope code
Thus, all of the procedure codes for δ2H lie between 200 and 299 because the isotope code for 2H is 2
(table 3). The situation with oxygen is a little more complicated. It was decided that normalizationcoefficients for δ
18O of water should be in a list separate from that of other O-bearing substances. Thus,
δ18O procedure codes for water range from 800 through 809 and those for other O-bearing materials lie
between 810 and 899. The situation for isotope codes 2 through 15 is summarized in table 5. The valuesfor codes above 15 are analogous to the values for isotope code 15. If more than 100 procedure codeswere needed for any isotope, one could easily modify the algorithm above. For example, the value of100 could be changed to 1000. Then each isotope could have 1000 procedure codes.
To add a new procedure code and make use of it in LIMS is a two-step process. First, the usershould add the procedure code to LIMS using this form. Next the user must link the procedure to eachmedium using the Low Procedure Codes form or the High Procedure Codes form. An example ofadding a medium, procedures, low procedures, and high procedures is given on page 96. Informationabout deleting media codes, procedure codes, low procedure codes, and high procedure codes is given onpage 97.
Low Procedure Codes Form
The Low Procedure Codes form is opened by clicking Special Features on the Main Menu andclicking Low Procedures. One can add, edit, and delete low procedure codes. The low procedure codelinks the low isotope of a medium to a procedure code. When a new procedure has been added to thetable of procedures, the user can open the Low Procedure Codes form, click Add, select the medium,select the new procedure, and click Save. If this medium has entries in both the low and high procedurestables, then the user must ensure that procedure 000 (N/A) has been added to both the low and highprocedures tables. This gives the user the possibility to select individually either the low or the highprocedure code, but not to require both. For every medium, one and only one procedure should beselected as the default procedure. The default procedure is selected by assigning an asterisk to theDefault field on the Low Procedure Codes form.
An example of adding a medium, procedures, low procedures, and high procedures is given below. Information about deleting media codes, procedure codes, low procedure codes, and high procedurecodes is given on page 97.
High Procedure Codes Form
The High Procedure Codes form is opened by clicking Special Features on the Main Menu andclicking High Procedures. One can add, edit, and delete high procedure codes. The high procedure code

95
Table 5. Minimum and Maximum Sample Preparation Procedure Codes in LIMS version 7.0 as aFunction of Isotope Code Between Codes 2 and 15.
Isotope IsotopeCode
Prefix MinimumProcedure
Code
MaximumProcedure
Code2H 2 G 200 2992H 2 J 200 2992H 2 R 200 2992H 2 W 200 29913C 3 C 300 39913C 3 G 300 39913C 3 J 300 39913C 3 R 300 39915N 5 G 500 59915N 5 J 500 59915N 5 N 500 59915N 5 R 500 59934S 6 G 600 69934S 6 J 600 69934S 6 R 600 69934S 6 S 600 69917O 7 G 700 79917O 7 J 700 79917O 7 R 700 79918O 8 C 810 89918O 8 G 810 89918O 8 J 810 89918O 8 N 810 89918O 8 R 810 89918O 8 S 810 89918O 8 W 800 8097Li 10 G 1000 10997Li 10 J 1000 10997Li 10 R 1000 109911B 11 G 1100 119911B 11 J 1100 119911B 11 R 1100 119930Si 12 G 1200 129930Si 12 J 1200 129930Si 12 R 1200 129937Cl 13 G 1300 139937Cl 13 J 1300 139937Cl 13 R 1300 139914C 14 G 1400 149914C 14 J 1400 149914C 14 R 1400 14993H 15 G 1500 15993H 15 J 1500 15993H 15 R 1500 1599

96
links the high isotope of a medium to a procedure code. High procedure codes are edited and added inthe same manner as low procedure codes (see page 94). An example of adding a medium, procedures,low procedures, and high procedures is given below. Information about deleting media codes, procedurecodes, low procedure codes, and high procedure codes is given on page 97.
How to Add Media, Procedures, Low Procedures, and High Procedures
Suppose a large project on the variability of δ18O and δ
30Si of olivine samples is starting. Suppose
δ18O preparation will be by a new laser ablation technique and δ
30Si preparation will be by reaction withgaseous fluorine. Assume that some samples will have δ
18O analyses only and some will have δ30Si
analyses only. Add a new medium, two procedure codes, and low and high procedure codes. Becausethis will be a major project spanning decades, choose a unique prefix for the medium.
Click Media and click Add. Enter 85 (since 85 is not used) in the Code text box, “ olivine” in the
Medium text box, J in the Prefix combo box, and “ olv” in the Abbr text box. Either one or twoisotopes need to be selected. Click the 18
O/16O and the 30
Si/28Si check boxes. Click Save and LIMS will
remind the user to add this medium to the list of media on the Excel 5.0 template for importing projects. Click OK. Click Close.
Now add two new procedure codes. From table 5 one knows that the δ18O procedure needs to be
between 810 and 899 because this is an O-bearing material that is not water. Choose 870 since it is notused. For the δ
30Si use 1225 since it is available. Click Procedures and click Add. Enter 870 in the
Code text box, “ DI, laser ablation, delta 18O” in the Description text box, and click Save. The
Amount of Sample text box is not used (this text box is for future use in LIMS). Click Add. Enter1225 in the Code text box, “ DI, gaseous fluorine, Delta 30Si” in the Description text box, and click
Save. Click Close.
Now link the medium and procedures. Let 870 be the low procedure code. Click Low Procedures. Click Add, select 85 from the Medium combo box, select 870 from the Low Procedure combo box,and set the Default combo box to * (this indicates that procedure code 870 will be selected as the defaultfor the determination of δ
18O in olivine samples). Click Save. One needs the possibility to select onlythe δ
30Si preparation. This is done by adding the following additional low procedure code. Click Add. Select 85 for the Medium combo box, select “ 000 --> N/A” for the Low Procedure combo box, andclick Save. Click Close. Now either 0 or 870 can be selected as the procedure code for the low isotope(18O).
Repeat in a similar manner for the high procedure code. Click High Procedures. Click Add. Select 85 for the Medium combo box, select 1225 for the High Procedure combo box, select * for the
Default combo box, and click Save. Click Add. Select 85 for the Medium combo box, select “ 000 -->N/A” for the High Procedure combo box, and click Save. Click Close. Now either 0 or 1225 can beselected as the procedure code for the high isotope (30Si).

97
This completes the addition of a medium, procedure code, low procedure code, and high procedurecode.
How to Delete Media, Procedures, Low Procedures, and High Procedures
Media codes, procedure codes, low procedure codes, high procedure codes must be deleted in thereverse order in which they are installed. Therefore, if a procedure code is to be deleted, all of the lowand high procedure codes using this procedure must first be deleted. If a medium is to be deleted, all ofthe low and high procedure codes using this procedure must first be deleted. Media codes, procedurecodes, low procedure codes, high procedure codes cannot be deleted if they have been used for samplesor isotopic analyses in the database.
Creating and Editing Templates
Multi-sheet paper templates are used for two purposes: (i) to set out samples to be analyzed so thatthey correspond to the location of sample preparation vessels, and (ii) to provide a list of the sample thatgoes into each location on an elemental analyzer. Templates are populated with samples from the Tableof Samples To Be Analyzed, and printed by clicking Print Templates on the Main Menu. However,before a template can be populated and printed, it must be designed and created. Templates on the
Special Features subform opens the Templates form (Fig. 29) and allows the user to add or edit atemplate. The user may want to examine the templates in the example database. Templates for elementalanalyzers and water equilibration devices can be found in the example database. The user shouldexamine these templates prior to generating any templates. To view these templates (first make sure theexample database is active—see page 20), click Special Features on the Main Menu, and click
Templates.
Fig. 30 shows a photograph of the 48-port Micromass sample equilibration system in the author'slaboratory and a template set up with 48 water samples for this preparation system. The multi-sheetpaper template is shown in Figs. 31 and 32. Note that there are 12 samples in each of 4 rows (48 samplestotal) laid out on a four-page template. (Twelve samples, whether they be water, carbonates, or othersamples, has been found to be a convenient number to put on one sheet of paper. If samples are larger,then fewer samples can be placed on each page, leaving desired positions blank.) Samples can be placedon the template the day prior to sample preparation; thus, a designated technician has time to check tomake sure that each position on the template has the correct sample on it. This has led to a significantreduction in errors in the laboratory. The plastic holder in the front is used to load the samples from eachrow and to transport them to the equilibration system.
It is important to consider the layout of your multi-sheet template. Proper design can lead toimportant savings in sample preparation time and reduction of error by minimizing the possibility of asample getting into the wrong sample port. As an example, for the 48-port CO2-H2O equilibration deviceabove, there are four banks, A, B, C, and D. There are 12 sample ports on each bank. Thus, one mightuse the port names A1, A2, A3, ... B1, B2, ... D12. However, in the author's laboratory operators find it

98
Fig. 29. Templates form.

99
Fig. 30. (a) Micromass CO2-H2O equilibration system in author’s laboratory. (b) Templatefor this system set up with 48 samples.

100
Neptune Samples To Be Analyzed 1/20/98 3:54:33 PM
Port Sample # Amount11 W-69 _________ 34 W-102 _________09 W-5 _________ 36 W-5 _________07 W-70 _________ 38 W-103 _________05 W-71 _________ 40 W-104 _________03 W-72 _________ 42 W-105 _________
01 W-73 _________ 44 W-106 _________23 W-74 _________ 46 W-107 _________21 W-75 _________ 48 W-108 _________19 W-6 _________17 W-6 _________
15 W-5 _________13 W-76 _________02 W-77 _________04 W-78 _________06 W-79 _________
08 W-80 _________10 W-81 _________12 W-82 _________14 W-83 _________16 W-84 _________
18 W-5 _________20 W-85 _________22 W-86 _________24 W-87 _________35 W-88 _________
33 W-89 _________31 W-5 _________29 W-90 _________27 W-91 _________25 W-92 _________
47 W-93 _________45 W-94 _________43 W-95 _________41 W-96 _________39 W-97 _________
37 W-98 _________26 W-99 _________28 W-100 _________30 W-101 _________32 W-5 _________
Fig. 31. Example of List of Samples To Be Analyzed for the CO2-H2O equilibration template with 48samples.

101
26/W-99 28/W-100 30/W-101 32/W-5 34/W-102 36/W-5 38/W-103 40/W-104 42/W-105 44/W-106 46/W-107 48/W-108
35/W-88 33/W-89 31/W-5 29/W-90 27/W-91 25/W-92 47/W-93 45/W-94 43/W-95 41/W-96 39/W-97 37/W-98
02/W-77 04/W-78 06/W-79 08/W-80 10/W-81 12/W-82 14/W-83 16/W-84 18/W-5 20/W-85 22/W-86 24/W-87
11/W-69 09/W-5 07/W-70 05/W-71 03/W-72 01/W-73 23/W-74 21/W-75 19/W-6 17/W-6 15/W-5 13/W-76
Page 1 Page 2 Page 3 Page 4
Fig. 32. Example of the 4-page CO2-H2O water equilibration template with 48 samples. Note placementof pages side by side.

102
easier to identify each sample port by an integer; thus, 1, 2, ... 47, and 48 are used. Personnel find itquickest to load 12 samples at a time. The first 12 samples are 6 samples on one side of bank A and 6samples on the same side of bank B. The next 12 samples are the samples on the other side of banks Aand B. The third set of 12 samples consists of 6 samples on bank C and 6 on bank D. The last 12samples are on the other side of banks C and D. This relatively complicated layout scheme allowspersonnel to load samples in a minimum of time and it minimizes the possibility of error in sampleloading. It is presented to demonstrate to the reader that it is important to consider various scenarios forloading samples.
Before starting be sure that the reference samples you want to use as floating (see step 14 below) andfixed (see step 25 below) references are in the Table of Reference Samples. To add a template followthese steps:
1. Click Special Features on the Main Menu and then click Templates.
2. Click Add.
3. Enter a name for the template, such as "Pegasus." Each template must have a unique name.
4. Enter the description.
5. Select the mass spectrometer.
6. Select the sample export format if necessary.
7. Select the media for the template. The user will need to fill the Media Selected for Templatelist box with all of the media for the template. First click on a medium in the Available Medialist box to highlight it. Then click Add to add this medium to the Media Selected for Templatelist box. As many media as required can be included. If you make a mistake, highlight themedium to be deleted in the Media Selected for Template list box, and click Delete Medium.
8. Select an isotope for the low procedure code if necessary.
9. Select the default low procedure code if necessary.
10. Select the default number of repeats for the low procedure if necessary. The default number ofrepeats is the number of times a sample added to the template will be analyzed. For example,in the author’s laboratory, every water sample for H equilibration is analyzed twice.
11. Select an isotope for the high procedure code if necessary.
12. Select the default high procedure code if necessary.

103
13. Select the default number of repeats for the high procedure if necessary.
14. Select the sample that will serve as the floating reference. A floating reference is a referencesample that is randomly interspersed with samples. LIMS will determine the location of allfloating reference samples using a random number generator. Only samples from the table ofreference samples that have a medium found in the Media Selected for Template list box willappear in this combo box.
15. Enter the number of floating reference samples on your template. Often it is 10 to 15% of thetotal number of samples on a template.
16. Select a sample for unfilled positions. This sample is used to fill or pad the remainder of atemplate in the event that there are not sufficient samples in the Table of Samples To BeAnalyzed to populate all the spaces in a template. Often a sample such as W-1, C-1, etc. isselected.
17. Select the printing option. Usually, one wants to print a multi-sheet template and a list ofsamples.
18. Click Save.
19. Click Ports & References to open the Ports & References form (Fig. 33) and design themulti-sheet paper template that will holds the samples. Even though one only wants to print alist of samples and not a multi-sheet template, one still needs to use this form to providenecessary information to LIMS (port identification, etc.).
20. Layout the multi-page template. The user will need to decide the following:a. Will all 12 positions on each page be used? If not, which will remain blank?b. What is the port number for each of the positions on the page that will hold a sample?c. Which ports should be left empty. These might be ones with vacuum leaks or such other
problem that prevents their use.d. Which ports must always hold a reference sample, that is, a fixed reference sample.e. By default, the remaining ports can hold a floating reference sample. A floating reference
sample “ floats” from port to port and has no fixed location.
21. Click Edit to enable editing.
22. Page 1 of your template should be shown. Enter port numbers (or port identifiers for each ofthe 12 positions that should hold a sample.
23. Enter the list number of each port specified above. This is the ordinal number of the sample inthe sample list printed out for the user. For example, the sample position that is always at thetop of the list is 1, the second is 2, etc.

104
Fig. 33. Ports & Configuration form.

105
24. For each position that should be empty, select “ Empty.”
25. For each position that should be a fixed reference, select “ Fixed Ref” and select the referencesample from the fixed reference (“ Fixed Ref” ) combo box. The remaining positions should beidentified as “ Floating Ref” positions. This completes the entry for this page.
26. Click Save to save your entries.
27. If the template consists of only a single page, click Close and this completes the creation of thetemplate. Otherwise, click Add Page.
28. Enter the entries on page 2 in a manner similar to that done for page 1.
29. Repeat data entry for remaining template pages.
30. When all pages are complete, click Close.
Additional pages may be added and entries may be edited by clicking Edit. If the user needs to delete apage, only the last page of a template can be deleted. This completes the creation of the template.
In order to use this template, the user will need to add samples to the Table of Samples To BeAnalyzed. This can be done from the Project form (page 29) by clicking Templates, or from the
Samples To Be Analyzed form (page 40). Once samples have been added to the Table of Samples ToBe Analyzed, a list of samples (and a template of samples to analyze) can be printed (e.g., see Figs. 31and 32).
Using LIMS with 14C
LIMS can be used for 14C samples. 14C media and procedures must be added to the default databasebecause no media or procedures using them are otherwise available. The following illustrates how this isdone.
Add a new medium containing 13C and 14C, and add a procedure code for 14C. Click SpecialFeatures, entering the password if required, click Media from the Special Features subform, and click
Add on the Media form. LIMS will prompt the user to select the Prefix last. Click OK. Enter “ 140”for the Code, enter “ C-bearing material” for the Medium, and enter “ 14C” for the Abbr. Click thecheck boxes 13C/12C and 14C. Select Prefix “ G,” and click Save. (Note, that the user could haveselected “ C --> Carbonate.” LIMS will remind the user that this medium should be added to the ExcelTemplate file for Creating Sample Projects in case the user is using this feature (see page 81). Click OK. Click Close to close the Media form. Note that the user can create a medium containing only 14C, or onecontaining 13C and 14C with Prefix C, etc.

106
Next add a new procedure for 14C. Click Procedures on the Special Features subform. LIMS willdisplay a message box advising the user of valid ranges of procedure codes for various isotopes, isotoperatios, and CFCs. Note that valid procedure codes for 14C are between 1400 and 1499. Click Ok. Click
Add. Enter “ 1400” for the Code and press the Enter key. LIMS will advise the user that a code for 14Cis being added. Click OK. Enter “ 14C by AMS” for the Description. Click Save. Click Close toclose the Procedure Codes form.
The user next needs to link procedures to the medium created. Click Low Procedures on the
Special Features form. Click Add. Select “ 140 -->G [14C] C-bearing material” from the Mediumcombo box. Select “ 352 --> DI, Quartz sealed tube, 800 deg. Delta 13C” from the Low Procedurecombo box. If a user had several procedure codes for the same medium and needed to indicate to LIMSwhich should be used as a default (such as when importing isotopic analyses), the user could select “ *”from the Default combo box in order to make the selected procedure code the default low procedurecode. Click Save and close the Low Procedure Codes form by clicking Close.
Next click High Procedures on the Special Features subform to open the High Procedure Codesform. Click Add. Select “ 140 -->G [14C] C-bearing material” from the Medium combo box. Select“ 1400 --> 14C by AMS” from the High Procedure combo box. Click Save and close the HighProcedure Codes form by clicking Close.
A media code, and procedures codes are now available for 14C use in LIMS. To demonstrate this,click New Project Login on the Main Menu. Click the Medium combo box and verify that medium140 is available.
Using LIMS with 3H
LIMS can be used for 3H samples. 3H media and procedures must be added to the default databasebecause no media or procedures using 3H are otherwise available. The following illustrates how this isdone.
Add a new medium containing 3H, and add a procedure code for 3H. Click Special Features,entering the password if required, click Media from the Special Features subform, and click Add on the
Media form. LIMS will prompt the user to select the Prefix last. Click OK. Enter “ 150” for the Code,enter “ 3H-bearing material” for the Medium, and enter “ 3HC” for the Abbr. Click the check box 3H. Select Prefix “ G,” and click Save. LIMS will remind the user that this medium should be added to theExcel Template file for Creating Sample Projects in case the user is using this feature (see page 81). Click OK. Click Close to close the Media form. Note that the user can create a medium containingonly 3H, or one containing 2H and 3H, for example.
Next add a new procedure for 3H. Click Procedures on the Special Features subform. LIMS willdisplay a message box advising the user of valid ranges of procedure codes for various isotopes, isotoperatios, and CFCs. Note that valid procedure codes for 3H are between 1500 and 1599. Click Ok. Click

107
Add. Enter “ 1500” for the Code and press the Enter key. LIMS will advise the user that a code for 3His being added. Click OK. Enter “ 3H by electrolytic enrichment and LSC” for the Description. Click Save. Click Close to close the Procedure Codes form.
The user next needs to link procedures to the medium created. Click Low Procedures on the
Special Features form. Click Add. Select “ 150 -->G [3H] 3H-bearing material” from the Mediumcombo box. Select “ 1500 --> 3H by electrolytic enrichment and LSC” from the Low Procedure combobox. If a user had several procedure codes for the same medium and needed to indicate to LIMS whichshould be used as a default (such as when importing isotopic analyses), the user could select “ *” fromthe Default combo box in order to make the selected procedure code the default low procedure code. Click Save and close the Low Procedure Codes form by clicking Close.
A media code, and procedures codes are now available for 3H use in LIMS. To demonstrate this,click New Project Login on the Main Menu. Click the Medium combo box and verify that medium150 is available.
Using LIMS with CFCs
The CFCs, CFC-11, CFC-12, and CFC-113, are available in LIMS. CFC media and proceduresmust be added to the default database because no media or procedures using them are otherwiseavailable. The following illustrates how this is done.
First add a new medium by clicking Special Features, entering the password if required, clicking
Media from the Special Features subform, and clicking Add on the Media form. LIMS will prompt theuser to select the Prefix last. Click OK. Enter “ 270” for the Code, enter “ CFC-11, 12, & 113” for the
Medium, and enter “ CFCs” for the Abbr. Click the check boxes CFC-11 and CFC-12. Select Prefix“ G,” and click Save. LIMS will remind the user that this medium should be added to the ExcelTemplate file for Creating Sample Projects in case the user is using this feature (see page 81). Click OK. Click Close to close the Media form.
Next add two new procedures, one for CFC-11 and one for CFC-12. Click Procedures on the
Special Features subform. LIMS will display a message box advising the user of valid ranges ofprocedure codes for various isotopes, isotope ratios, and CFCs. Note that valid procedure codes forCFC-11 are between 2700 and 2799, and for CFC-12 are between 2800 and 2899. Click Ok. ClickAdd. Enter “ 2700” for the Code and press the Enter key. LIMS will advise the user that a code forCFC-11 is being added. Click OK. Enter “ CFC-11” for the Description. Click Save. The firstprocedure code has been added. Enter the second code by clicking Add, entering “ 2800” for the Code,entering “ CFC-12” for the Description, and click Save. Click Close to close the Procedure Codesform.
The user next needs to link these two procedures to the medium created. Click Low Procedures onthe Special Features form. Click Add. Select “ 270 --> G [CFCs] CFC-11, 12 & 113” from the

108
Medium combo box. Select “ 2700 --> CFC-11” from the Low Procedure combo box. If a user hadseveral procedure codes for the same medium and needed to indicate to LIMS which should be usedas a default (such as when importing isotopic analyses), the user could select “ *” from the Defaultcombo box in order to make the selected procedure code the default low procedure code. Click Save andclose the Low Procedure Codes form by clicking Close.
Next click High Procedures on the Special Features subform to open the High Procedure Codesform. Click Add. Select “ 270 -->G [CFCs] CFC-11, 12 & 113” from the Medium combo box. Select“ 2800 --> CFC-12” from the High Procedure combo box. Click Save and close the High ProcedureCodes form by clicking Close.
A media code, and procedures codes are now available for use in LIMS. To demonstrate this, click
New Project Login on the Main Menu. Click the Medium combo box and verify that medium 270 isavailable.
LIMS allows users to display, print, and store CFC-113 results on a medium created for CFC-11 andCFC-12 using the token “ SHOW_CFC-11_12_&_113” found in the LIMS for Light Stable IsotopesConfiguration form. Setting this token to -1 will enable the label “ CFC-113” to be visible on the
Samples form, the Project report, and the Sample Range report.

109
ANALYSIS IMPORT FORMATS
Introduction
LIMS can import isotopic results from a file on a diskette. The formats that existed when thisdocument was printed are discussed below. The user may discover that additional import formats havebeen added.
LIMS Default Analysis Import Format
The LIMS Default format for importing isotopic analyses is a Microsoft Access 2.0 .mdb databasefile. The specifications are listed below. The field names of the database file are listed in table 6.
Extension of the Microsoft Access file: .mdbMicrosoft Jet engine version: 2.0Name of Microsoft Access table: tbl_IsotopicResults
Either of the first two fields can be null (rstr_MassSpec or str_VendorMSID). If rstr_MassSpec is null,then LIMS can use str_VendorMSID to interrogate the table of mass spectrometers to determinerstr_MassSpec.
LIMS_TBA.mdb must be an Access 2.0 database and not an Access 95 or 97 database so that it canbe imported by users employing LIMS 1.4, the Access 2.0 version that runs on the Microsoft Windows3.1 or Windows for Workgroups 3.11 platform.
The Microsoft Visual Basic 3 code fragment below shows how to create the Access 2.0 file, createthe table tbl_IsotopicResults, and populate the table. Dim dyn As dynaset Dim sz As string Dim qdf As querydef Dim tbl As table Dim db As database
On Error GoTo 0
’Delete file named ANALYSES.mdb on drive A:. On Error Resume Next Kill ("A:\ANALYSES.MDB") On Error GoTo e_Export_Click ’Create Microsoft Access file. By default it is version 2.0. Set db = CreateDatabase("A:\ANALYSES.MDB", DB_LANG_GENERAL, False) sz = "CREATE TABLE tbl_IsotopicResults" sz = sz & " (rstr_MassSpec TEXT (1)," sz = sz & " str_VendorMSID TEXT (50)," sz = sz & " lng_Analysis LONG," sz = sz & " lng_PeakNumber LONG," sz = sz & " rstr_Prefix TEXT (1),"

110
Table 6. Fields of the LIMS default table for importing isotopic analyses.
Field nameData type
Maximumstring size
Description
rstr_MassSpec Text 1 Single letter mass spectrometer identification. Primary keyof tbl_MassSpec. Does not need to be supplied as long asstr_VendorMSID is supplied.
str_VendorMSID Text 50 Mass spectrometer serial number or vendor identificationnumber. Does not need to be supplied as long asrstr_MassSpec is supplied.
lng_Analysis Number(long)
Analysis number. Unique integer that should be generatedby the mass spectrometer and printed on the analysis report. This number must be able to be changed by user so that itcan be set to required value in case mass spectrometercomputer requires replacement.
lng_PeakNumber Number(long)
Peak number. Acceptable values are 1 to 999. Defaultvalue for dual inlet mass spectrometers is 1.
rstr_Prefix Text 1 Single letter sample prefix; C, G, J, N, R, S, or W (see table1).
rlng_Sample Number(long)
Integer sample number. Together with sample prefix, thisforms the Our Lab ID, e.g., W-45677.
str_AliquotID Text 20 Aliquot identification.
str_Port Text 5 Name or identifier of the sample port on the preparationunit, manifold, carousel, etc.
str_Std Text 14 In dual inlet mass spectrometry, the name or identifier ofthe working standard.
dat_Analyzed Date/Time Date and time sample analysis of this peak is begun. Generally increments for each peak.
str Comment Text 32 Comment.int_Procedure Number
(integer)Procedure code from table tbl_Procedure (table 4).
dbl_PenultimateDelta Number(double)
Penultimate delta value.
rint_Error Number(integer)
Error code. Primary key of table tbl_Error. Default valueis 0.
ysn_Ignore Yes/No Default value is No. Mass spectrometer can set this field toYes if it can determine that isotopic analysis is unsatis-factory and should not be included in a calculation by LIMSof the final delta value. Usually this is the case when thedual inlet mass spectrometer software performs anotherisotopic analysis of the sample.

111
sz = sz & " rlng_Sample LONG," sz = sz & " str_AliquotID TEXT (20)," sz = sz & " str_Port TEXT (5)," sz = sz & " str_Std TEXT (14)," sz = sz & " dat_Analyzed DATETIME," sz = sz & " str_Comment TEXT (32)," sz = sz & " int_Procedure SHORT," sz = sz & " dbl_PenultimateDelta DOUBLE," sz = sz & " rint_Error SHORT," sz = sz & " ysn_Ignore BIT );" Set qdf = db.CreateQueryDef("qdf_Create_tbl_IsotopicResults", sz) qdf.Execute qdf.Close db.DeleteQueryDef ("qdf_Create_tbl_IsotopicResults")
Set tbl = db.OpenTable("tbl_IsotopicResults") ... set dynaset with analysis data here. dyn.MoveFirst Do While Not dyn.EOF tbl.AddNew tbl("rstr_MassSpec") = dyn("rstr_MassSpec") tbl("str_VendorMSID") = "My serial #" tbl("lng_Analysis") = dyn("lng_Analysis") tbl("lng_PeakNumber") = dyn("lng_PeakNumber") tbl("rstr_Prefix") = dyn("rstr_Prefix") tbl("rlng_Sample") = dyn("rlng_Sample") tbl("str_Port") = dyn("str_Port") tbl("str_Std") = dyn("str_Std") tbl("dat_Analyzed") = dyn("dat_Analyzed") tbl("str_Comment") = dyn("str_Comment") tbl("int_Procedure") = dyn("int_Procedure") tbl("dbl_PenultimateDelta") = dyn("dbl_PenultimateDelta") tbl("rint_Error") = dyn("rint_Error") tbl("ysn_Ignore") = 0 tbl.Update dyn.MoveNext Loop tbl.Close Set db = Nothing
Analytical Precision Analysis Import Format
Analytical Precision saves analyses in a Microsoft MDB file with the specifications below (seetable 7):
Microsoft Jet engine version: 2.0Microsoft Access Table name: LIMSInput

112
Table 7. Fields of the Analytical Precision Microsoft Access table of isotopic analyses, LIMSInput.
Field name Data type Size Comments
Counter Long Not used by LIMS
MassSpecID String 9 This is the VendorID of the massspec.
AnalysisCounter Long Analysis number.PeakNo Integer Peak number.Name String 20 OurLabID must be here.Position Long PortIDGasName String 10 Not used by LIMS.RunDate Date/Time Date/TimeComment Memo First 32 characters should be
saved in LIMS comment field.Isotope Integer Isotope from tbl_Isotope.Delta Double Delta valueRunCode Long Same as LIMS’ error code.Barcode string 10 Equivalent to LIMS’ Sample ID.
Europa Scientific Analysis Import Format
The format employed by Europa Scientific is a comma separated ASCII text file with all valuesin quotes (see table 8). Null values are indicated by "".
File name: Mercury.txt
An example of one line of data follows:
"U","45741","1","W","4578","Aliquot 2","10101","Y123","23/03/1997 23:15:17","","-9.23","200","0"
Finnigan MAT Analysis Import Format
The format for Finnigan ISODAT dual inlet, GC combustion (GCC), and EA (elementalanalyzer) files are different and are discussed below. Importing isotopic data from any of these threeformats into LIMS is a two step process:
1. Save the isotopic data on a diskette in Lotus .wks format using the mass spectrometer’scomputer.
2. Insert the diskette with the .wks file into the LIMS computer, click Import Analyses,and import the .wks file.

113
Table 8. Fields of the Europa Scientific file of isotopic analyses, Mercury.txt.
Item# Description
MaximumString Length
Comment
1 mass spectrometer ID 1 LIMS mass spectrometer ID2 analysis number 7 LIMS long integer3 peak number 3 LIMS long integer4 sample prefix 1 LIMS text with length of 15 sample number 6 LIMS long integer6 aliquot ID 20 LIMS text with length of 207 port ID 5 LIMS text with length of 58 standard ID 14 LIMS text with length of 149 date/time 19 LIMS date/time
10 Comment 32 LIMS text with length of 3211 penultimate delta LIMS double12 Procedure 4 LIMS integer13 error code 5 LIMS integer
Finnigan MAT is currently investigating possible formats for incorporation into their ISODAT-NT software, now under development.
Dual Inlet Import Format
Importing Finnigan isotopic data is not always straight forward. An example of importing thedual inlet file Finn_DI.wks is given in the tutorial on page 57. If one opens this file with Excel, onefinds the following 17 column headings in row 4:
1. date/time2. spec.- no.3. sample ident4. standard name5. Comment6. SA7. ST8. SA28[V]9. ST28[V]10. SA29[V]11. ST29[V]12. d-29/2813. std.dev. 29/28

114
14. Baseline15. Interfering mass 116. Interfering mass 217. Interfering mass 3
This spreadsheet file was created with ISODAT version 5.2-0009 software using the following ISODATconfiguration parameters:
* 2 Date* 3 Spec.-No. / Sample Ident / Sample Size* 6 Standard Name* 8 Comment* 13 Ion-Gauge* 25 Delta Mean* 26 Std.Deviation* 50 New Page* 52 Interfering Masses
For importing δ18O values of water the user may want to put an asterisk on parameter 44,
“ sample (alpha H2O).” For importing δ18O values of CO2 gas, the user may want to put an asterisk on
parameter 42, “ Delta O-18 vs SMOW.”
A few comments are in order. The date/time column is imported by LIMS. Column 2, the spec.no., is the LIMS analysis number. This must be a unique integer for use by LIMS. Therefore, if a userneeds to replace a computer or hard disk, the Spec No must be set during installation to the nextunique integer analysis number. Column four contains the standard name. Column five contains theanalysis comment. Column three is used to provide information about the description of the sample andthe analysis. Currently LIMS does not import Baseline information (column 14). LIMS does importsome interfering masses (columns 15 through 17).
LIMS needs a value for the peak number. It uses a value of 1 as a default for dual inlet analyses.
Column three, sample ident, can contain as many as five items of information as shown anexample below:
Example ValueOur Lab ID C-1Aliquot ID My test #34Low Procedure Code 312High Procedure Code 820Comment Temp = 41 C
When all five items are provided, they are delimited with forward slashes as:

115
Our Lab ID / Aliquot ID / Low Procedure Code / High Procedure Code / Comment
The minimum information needed by LIMS to import the analysis is Our Lab ID. LIMS will use defaultprocedure codes for the medium if not provided. The following are examples for valid entries in column3:
C-1/My test #34/312/820/Temp = 41 CC-1 / My test #34 / 312 / 820 / Temp = 41 CC-1C-1 //// Temp = 41 CC-1 / My test #34 /// Temp = 41 CC-1/My test #34C-1 // 312 / 820C-1 // 820
Note that if the comment is provided as a unique column (column 5 in this example), then it should notbe provided in column 3.
The δ15N values are found in column 12 in this example. The column header is “ d-29/28” .
LIMS needs a mechanism to uniquely identify the column of the δ values to be imported. Often δ valuesare found in several columns so the user must specify the correct column. The procedure the user followsis to open the LIMS For Light Stable Isotopes Configuration form by clicking Special Features onthe Main Menu and then clicking Config. The user can click List and can click on the token“ FINN_COL_HEAD_15N.” Note that the value of this token is “ d-29/28” and that the description ofthis parameter is that it is the descriptor that uniquely identifies the column with δ
15N data to be imported. Note that tokens are also available for several other δ values. In the case of δ
18O, two tokens areprovided. One is for importing water samples and the other is for all other oxygen bearing materials.
An example of a file containing δ18O values from water samples is F_18wodi.wks. Another
example of a file containing δ18O values from water samples is Fh2o18di.wks. In this file, the unique
column identifier is “ 18/16-O” . Finnh2di.wks contains δ2H results. Note that the unique column
identifier containing the desired isotopic data is either “ sample vs. SMOW” or “ H3 factor” to choosecolumn 7 or “ std.dev. 3/2” to select column 11. “ outl. corr” cannot be used because it is found in othercolumns. If the user is having difficulty importing isotopic data into LIMS, it is important to verify thatthe token specifying the column with the δ values to be imported is unique and spelled exactly as itappears. It cannot differ, even by a space. The author uses the copy and paste features of Windows tocopy these column specifiers.
In order to import data from a file LIMS needs at a minimum the following columns: (i)date/time, (ii) spec.- no. (analysis number), (iii) sample ident with Our Lab ID, (iv) standard name, (v) δvalue.

116
As shown in the example database (page 57), LIMS can import ion gauge readings and sampleand standard ion beam voltages if these are present in the spreadsheet to be imported. The user enablesimporting of these values using the tokens “ STORE_INTERF_MASSES” and“ STORE_MAJOR_VOLTAGES” in the LIMS For Light Stable Isotopes Configuration form.
GCC Import Format
Two slightly different formats are generated for GCC analyses depending upon whether CO2 orN2 is being analyzed. F_gcc_n2.wks was generated from a Finnigan Delta Plus from caffeine. Note thatthe format is significantly different than that of dual inlet isotopic data. The δ
15N values are found in acolumn uniquely identified by “ delta-29/28” and this is saved in the token“ FINN_COL_HEAD_GCC_15N” . The Our Lab ID must be found in either column “ Sample Name#1” , “ Sample Name #2” ,or “ Sample Name #3.” As in the case of dual inlet data, aliquot IDs andprocedure codes can be appended using forward slash as the record separator in columns 1, 2 or 3. Thereis little reason to put the comment in columns 1, 2, or 3 because a separate comment column is provided. LIMS will use the peak number found in the column with the specifier “ Peak.” Typically, one or moreanalyses will be a standard. This is identified by an asterisk in the column “ STD.” For such analysesLIMS will use the Our Lab ID found in the token “ CF_Std_OurLabID_N2” in the LIMS For LightStable Isotopes Configuration form.
F_GCC_CO2.wks was generated during installation of a Finnigan Delta Plus from analysis ofCO2 from a flame ionization mixture of organic compounds. The δ
13C values of CO2 are found in acolumn uniquely identified by “ delta-13/12” and this is specified with the token“ FINN_COL_HEAD_GCC_13C” (see the LIMS For Light Stable Isotopes Configuration form). The
δ18O values of CO2 are found in a column uniquely identified by “ delta-18/16” and this is specified with
the token “ FINN_COL_HEAD_GCC_18O” (see the LIMS For Light Stable Isotopes Configurationform). The Our Lab ID must be found in either column “ Sample Name #1” , “ Sample Name #2” , or“ Sample Name #3.” As in the case of dual inlet data, aliquot IDs and procedure codes can be appendedusing forward slash as the record separator in columns 1, 2 or 3. LIMS will use the peak number foundin the column “ Peak.” Typically, one or more analyses will be a standard. As above, this is identifiedby an asterisk in the column “ STD.” For such analyses LIMS will use the Our Lab ID found in thetoken “ CF_Std_OurLabID_CO2” in the LIMS For Light Stable Isotopes Configuration form.
EA Import Format
Three slightly different formats are generated for GCC analyses depending upon whether SO2, N2
only, or CO2 only or CO2 and N2 is being analyzed. Finn_EA.wks was generated on a Finnigan DeltaPlus from C- and N-bearing samples. The format is similar to that of GCC analyses. The first 18 or socolumns are similar or identical to those found in Finnigan GCC files. LIMS can import the values forC, N, or S concentration found in the column “ CONC.” They will be stored using procedure codes 189,190, and 191, respectively. The amount of sample is listed in the column “ Sample Wt. [mg] .” If the

117
comment is blank, LIMS will import the amount of sample and save it in the Comment field of theanalyses table. The δ
13C and δ15N values are found in columns 26 through 29. Both blank-corrected and
non-blank-corrected δ values are reported. The user specifies which to import using the token“ FINN_BLANK_CORR_EA_DATA” in the LIMS For Light Stable Isotopes Configuration form. Set it for -1 to import blank-corrected values, otherwise set it for 0. As in the GCC format, the Our LabID must be found in either column “ Sample Name #1” , “ Sample Name #2” ,or “ Sample Name #3.” Aliquot IDs and procedure codes can be appended using forward slash as the record separator in columns1, 2 or 3. There is little reason to put the comment in columns 1, 2, or 3 because a separate commentcolumn is provided. LIMS will use the peak number found in the column “ Peak.” Typically, one ormore analyses will be a standard. This is identified by an asterisk in the column “ STD.” For suchanalyses LIMS will use the Our Lab ID found in the token “ CF_Std_OurLabID_CO2” in the LIMS ForLight Stable Isotopes Configuration form. When N2 is analyzed, LIMS will use for standards the OurLab ID specified in the token “ CF_Std_OurLabID_CO2.” For SO2 analyses LIMS will use for standardsthe Our Lab ID specified in the token “ CF_Std_OurLabID_SO2.” Files F_EA_N2.wks andF_EA_SO2.wks are examples of N2 only and of SO2 files. As of the version of ISODAT of September1997, blank-corrected δ
34S values were not available. Therefore, δ34S values imported by LIMS will be
identical whether the token “ FINN_BLANK_CORR_EA_DATA” in the LIMS For Light StableIsotopes Configuration form is set to True (-1) or False (0).
If the user has set LIMS to import EA blank corrected δ values by setting the token,FINN_BLANK_CORR_EA_DATA, to true (-1) using the Configuration form (page 60), LIMS displaysthe following message:
At software development time [a date], Finnigan ISODAT software did not save blankcorrected sulfur delta values with unique column headings, such as ’delta vs. CDT.’
If the user clicks OK, the message above about Finnigan GCC analyses being found appears. The “ Atsoftware development time ...” message appears because LIMS checks the spreadsheet to see if it is anEA analysis, and then to see if it is a GCC analysis. This is a temporary message until a future version ofISODAT provides blank corrected EA δ
34S values.
Micromass Analysis Import Format
Micromass uses comma separated variable (CSV) text files that can be imported into spreadsheetprograms. An example of importing the dual inlet file Mm_H2.csv is given in the tutorial on page 59. The format of dual inlet files is relatively similar according to Micromass; however, the format forcontinuous flow samples has varied often. According to discussion of the author in March 1997 withTim Brockwell of Micromass, providing a stable format for continuous flow measurements has not beengiven a high priority. Therefore, currently LIMS does not import Micromass continuous flow analyses.
Micromass dual inlet files often contain more than 150 columns; thus, standard importing toolsof Access will not work. Examples of Micromass dual inlet files of δ
2H of water, δ15N of other N-

118
bearing material, and δ18O of water are provided by the files Mm_H2.csv, Mm_N2.csv, and
Mm_O18w.csv, respectively. Column 1, “ Sample Name” , must contain the Our Lab ID. Just as forFinnigan importing, the Aliquot ID, the low procedure code, the high procedure code, and the commentcan be appended together in this field using the record separator forward slash (see above). The user hasthe choice to select the column of δ values to be imported.
Note that no analysis number is maintained by Micromass software. Therefore, users areprompted by LIMS to input an analysis number that must be separately maintained by the user. The“ Run Serial Number” that Micromass generates is stored in the comment field of the analyses table. If acomment has been entered, the two are appended.
The δ18O values are found in column 39 in this example. The column header is “ delta O18 wrt
SMOW” . LIMS needs a mechanism to uniquely identify the column of the δ values to be imported. Often δ values are found in several columns so the user must specify the correct column. The procedurethe user follows is to open the LIMS For Light Stable Isotopes Configuration form by clicking
Special Features on the Main Menu and then clicking Config. The user can click List and can click onthe token “ UMASS_COL_HEAD_18O_Water” Note that the value of this token is “ Delta O18 wrtSMOW” and that the description of this parameter is that it is the descriptor that uniquely identifies thecolumn with δ
18O values of water to be imported. Note that tokens are also available for δ18O of other
materials, δ13C, δ
34S, etc. If the user is having difficulty importing isotopic data into LIMS, it is importantto verify that the token specifying the column with the δ values to be imported is unique and spelledexactly as it appears. It cannot differ, even by a space. The author uses the copy and paste features ofWindows to copy these column specifiers.
As for Finnigan files (see page 57 of the tutorial), LIMS can import ion gauge readings andsample and standard ion beam voltages if these are present in the spreadsheet to be imported. The userenables importing of these values using the tokens “ STORE_INTERF_MASSES” and“ STORE_MAJOR_VOLTAGES” in the LIMS For Light Stable Isotopes Configuration form.
When LIMS imports date and time from Micromass files it first tries to import them assumingthey are in the format 18-03-1997 18:03. If that is unsuccessful, LIMS attempts to import them as validdates for the existing Window's setting. Therefore, be careful not to enter 09/03/97, expecting thatSeptember 3, 1997 will be imported. LIMS will import it as March 9, 1997.
119
SAMPLE EXPORT FORMATS
Introduction
When the user generates a template of samples to be analyzed, LIMS creates a file on the user’sdiskette that contains the sample names, the position of the samples in the preparation system, andinformation about the isotopic analyses requested. The data acquisition and control software of the user’smass spectrometer can use this information to perform the requested isotopic analysis(es) of each of theuser’s samples. This technique eliminates typing in the sample heading and potential typographic errors. This method has been used in the author’s laboratory for a decade.
LIMS Default Sample Export Format
LIMS saves information on samples to be analyzed in two files, as a Microsoft Access 2 .mdbdatabase file and as a Microsoft Excel 5.0 file. The specifications of the database and table are listedbelow (table 9). Analytical Precision also saves information on samples to be analyzed in the sameMicrosoft Access 2.0 format.
Name of Microsoft Access file: LIMS_TBA.mdbName of Microsoft Access table: SamplesToBeAnalyzedName of Microsoft Excel 5.0 file: LIMS_TBA.xls
Sample Export Format for Analytical Precision
The sample export format used by Analytical Precision is the LIMS default format, discussedbelow.
Sample Export Format for Europa Scientific
The format employed by Europa Scientific is a comma separated text file with all values inquotes (see table 10). Each line corresponds to one sample. Missing information is presented as "".
Name of text file: ZEUS.TXT

120
Table 9. Fields of the LIMS default sample export table, SamplesToBeAnalyzed.
Description Field name Data type Size
Date and time of template
Generation
dat_Stamp Date/Time 8
template name rstr_TemplateName Text 50mass spectrometer ID rstr_MassSpec Text 1mass spectrometer serial numberor vendor ID
rstr_VendorMSID Text 50
ordinal position of samplein list
rlng_OrdinalPositionInList Number (Long) 4
port ID rstr_Port Text 5flag; 1 = fixed reference samplein this port, 2 = floatingreference sample in this port,and 3 = port is empty.
rlng_PortRefEmpty Number (Long) 4
sample prefix rstr_Prefix Text 1sample number rlng_Sample Number (Long) 4aliquot ID rstr_AliquotID Text 20low isotope byt_Lisotope Number (Byte) 1low procedure rint_Lprocedure Number (Integer) 2high isotope byt_Hisotope Number (Byte) 1high procedure rint_Hprocedure Number (Integer) 2method (for future use) rstr_Method Text 32
Table 10. Fields of LIMS sample export file for Europa Scientific.
Item# Description
MaximumStringLength
1 template name 502 mass spectrometer ID 13 mass spectrometer serial
number or vendor ID50
4 ordinal position in list 55 port ID 56 sample prefix 17 sample number 68 aliquot ID 209 Isotope of low procedure 2
10 Low procedure 511 Isotope of high procedure 212 high procedure 5

121
An example of two rows of data follow:
"EA 1","U","4KM33","1","10001","G","4451","Aliquot 1","3","380","5","584""EA 1","U","4KM33","2","10002","C","751","Aliquot 1","3","356","",""
Sample Export Format for Finnigan MAT
Finnigan MAT’s sample export format is currently being developed on Finnigan’s ISODAT-NTdata acquisition and control software that operates on the Microsoft Windows NT platform.
Sample Export Format for Micromass
Currently Micromass has no sample export format.

122
FILES FOUND ON DISKETTES
The following files are included with LIMS—Version 7.0.
Program Files (4 diskettes, except only 1 diskette for LIMS 1.4)
Example DatabaseLm7datae.mdb (LM4DATAE.mdb is provided for LIMS 1.4)numerous examples of mass spectrometer analyses for importing
New DatabaseLm7data.mdb and LM4DATA.mdb
Excel 5.0 Template for Creating Sample ProjectsALT.xlsUSGS.xls
Example Import FormatsSeveral files of isotopic analyses that can be imported into the example database.

123
ACKNOWLEDGMENTS
The author is indebted to numerous individuals that provided suggestions, comments, examples ofmass spectrometer data output, and ideas in storing and handling isotopic data. For a decade, CarolKendall was instrumental in helping to develop concepts employed in LIMS. Mark Farnsworth using hisVisual Basic expertise created much of the code in the first version of LIMS. Gilles St-Jean (Universityof Ottawa, Ottawa, Ontario, Canada) was instrumental in getting LIMS to work effectively with otherthan Windows U.S. regional settings, and he suggested numerous improvements. Len Wassenaar (En-vironment Canada, Saskatoon, Saskatchewan, Canada) has been a strong supporter of this project and hasoffered numerous suggestions. Willi Brand (Finnigan MAT, Bremen, Germany) pointed out that theinclusion of peak number was critical to the success of the database for use in continuous flow isotopicanalysis. Rebecca Carmody, Daniel Snyder, Gilles St-Jean, Joe Wildman, and Steve Gossin providededitorial suggestions to the manual. Jun Abrajano (Memorial University, St. John’s, Newfoundland,Canada), Paul Dennis (UEA, Norwich, United Kingdom), Carol Kendall, Robert Michener (BostonUniversity, Boston, MA), Devon Rowe (University of Alberta, Edmonton, Alberta, Canada), Gilles St-Jean, and Len Wassenaar provided various examples of mass spectrometer output.
The cooperation of the mass spectrometer vendors Analytical Precision, Europa Scientific, FinniganMAT, and Micromass is greatly appreciated. In particular Barry Graney from Analytical Precisionoffered numerous suggestions on coding and data storage.

124
REFERENCES
Coplen, T. B., 1988, Normalization of oxygen and hydrogen isotope data: Chemical Geology (IsotopeGeoscience Section), v. 72, p. 293-297.
Coplen, T. B., 1997, A Laboratory Information Management System (LIMS) for light stable isotopes—Version 7.0: U.S. Geological Survey Open-File Report 97-812, 118 p.
ISO, 1992, ISO 31-0, Quantities and Units, Part 0, General Principles, subclause 2.3.3, InternationalOrganization for Standardization.
Microsoft, 1997a, Microsoft Access Language Reference and Microsoft Office Data AccessReference, Microsoft Press, Redmond, Washington.
Microsoft, 1997b, Microsoft Visual Basic for Applications and Shared Libraries References,Microsoft Press, Redmond, Washington.