a machine vision system for automatically grading ... a machine vision system for automatically...
TRANSCRIPT

53
A Machine Vision System for Automatically GradingHardwood Lumber
Richard W. ConnersTai-Hoon ChoChong T. Ng
Thomas H. DrayerJoe G. Tront
Spatial Data Analysis LaboratoryVirginia Tech
Blacksburg, Virginia 24061
Philip A. AramanU.S. Forest Service
Brooks Research CenterVirginia Tech
Blacksburg, Virginia 24061
Robert L. BrisbonForest Sciences Laboratory
Route 2 Box 562-BPrinceton, West Virginia 24740
Abstract
Any automatic system for grading hardwood lumber can conceptually be divided into twocomponents. One of these is a machine vision system for locating and identifying grading defects.The other is an automatic grading program that accepts as input the output of the machine visonsystem and based on these data, determines the grade of a board. The progress that has been madeon developing the first component the machine vision component will be reported in this paper. Themachine vision system being developed is made up of an imaging subsystem for imaging roughlumber surfaces, a computer vision subsystem for analyzing the image data and identifying gradingdefects, a materials handling subsystem for moving boards through the imaging devices, and, finally,a computer for executing the algorithms comprising the computer vision subsystem and for control-ling the other subsystems. This paper will describe the progress that has been made on developingall of these components. It will also indicate the directions for future research. A major god of thisresearch activity is to create a vision technology that will be applicable to not only the grading ofhardwood lumber but a number of other forest products related applications as well.
Laser and Vision Technology

54
Introduction
Any automatic system for grading hardwood lumber is composed of two components. One ofthese is a machine vision system that can locate and identify grading defects. The other componentis an automatic grading program that accepts as input the output of the machine vision system and,based on these data, determines the grade of a board. This program is a computer algorithm formof the National Hardwood Lumber Association (NLHA) hardwood grading rules. Its developmenthas entailed translating the English statements appearing in the NLHA grading rules into precisemathematical statements that can be understood by a computer. A good deal of progress has beenmade on developing this program [1-3].
This paper reports the progress that has been made on developing the other component of anautomatic grading system, the machine vision component. The machine vision system beingdeveloped is composed of an imaging subsystem for imaging board surfaces, a materials handlingsubsystem for moving boards through the imaging subsystem, a computer vision subsystem thatanalyzes board image data to locate and identify grading defects, and a computer for executing thealgorithms that comprise the computer vision subsystem and for controlling the other subsystemsof the machine vision system.
Of all the components that comprise the machine vision system, the one that is the most difficultto design is the computer vision subsystem. There are a number of reasons for this. First, for agrading system to be truly robust, it must be able to handle a variety of different hardwood species.But hardwood species vary significantly in their appearance. Grading defects in hardwood lumbermanifest themselves in many different ways. For an automatic system to be industrially usefulrequires that it be able to process lumber at least as fast as a skilled human grader. This means thatthe vision system must be able to analyze image data at a rate of at least two linear feet per second,i.e., so it can grade a 16 foot board in 8 seconds. Lastly, since grading depends on detecting smallgrading defects, the vision system must be able to process high spatial resolution image data. Theneed for high spatial resolution data together with the rather high flow rates mean that the algorithmscomprising the computer vision subsystem must analyze lots of data fairly quickly. To minimizetotal system costs the computer vision algorithms must be structured so that they minimize thecomputational complexity of the analysis task. Only in this way can a reasonably “inexpensive”computer be used to perform the processing.
All these requirements taken together pose a challenge to the developer, especially consideringthe state-of-the-art of computer vision. Developing computer vision algorithms is an art and not ascience. At the beginning of any computer vision related research activity there is no assurance thata complete computer vision system for solving an applications problem can be created. Given thisfact, prudence demands that one proceed cautiously. This implies that one must first establish thefeasibility of creating the required computer vision methodologies. Also, the initial research shouldemploy standard off-the-shelf imaging hardware and computing system so as to minimize initialhardware costs.
Laser and Vision Technology

55
This paper will report the results of the initial investigations that have gone into developing thecomputer vision subsystem. It will show some of the processing results that have been obtained. Itwill be argued that these results do indicate the feasibility of creating a computer vision system thatcan locate and identify grading defects on rough hardwood lumber.
The initial research has employed standard off-the-shelf hardware. The 512x480 standardRS-170 solid state camera used in the initial investigations restricts the research by allowing onlyimages of 8 inch by 8 inch square areas of board surfaces to be considered. The use of this hardwareis the limiting factor in proceeding further. To proceed further requires access to images of full sizedmaterial, i.e., boards up to 16 feet long, up to 13 inches wide, and up to 2 1/4 inches thick.
Currently, a full scale prototype machine vision system is being developed. This system willcombine all the components of a machine vision system so that a variety of experiments can beperformed. AS was stated above, developing computer vision algorithms is an art and not a science.A good deal of experimentation is required to develop robust methods. The experimentationperformed must reflect the type of material the algorithms will have to analyze in the industrialsetting. Practically speaking, the feasibility of the complete machine vision system cannot beestablished until issues of maintainability and reliability are addressed. Also, in any automatedsystem, hardware and software must interact. Compromises must be made between what can beaccomplished with hardware and what can be accomplished with software. A complete systemsapproach is required in the development process. This full scale prototype will allow all these issuesto be addressed.
The major thrust of the current research activities is developing this full scale prototype. Thedevelopment of this prototype is very important. It provides a vehicle for performing research on anumber of forest products related problems and not just the development of an automatic gradingsystem. Currently, two problem domains are being considered. One is developing a machine visionsystem that can be used to automatically grade lumber. This will be referred to as the rough lumberproblem, since any grading system must be able to handle rough lumber. A second problem isdeveloping a system that can be used to automate the rough mills of hardwood furniture and fixtureplants. This will be called the surfaced lumber problem, since most furniture and fixture plants, atleast, skip plane material prior to cutup. An important goal of this research activity is to developmethods that have general applicability within the forest products industry. Considering both ofthese problems simultaneously provides an excellent opportunity to develop general purposemethods. This paper will report the progress that has been made on developing this prototype.
Computer Vision Subsystem Development
The Rough Lumber Grading Problem
A machine vision system for grading hardwood lumber must be able to handle rough lumber.Developing computer vision methods for locating and identifying grading defects on rough lumberis a difficult problem. This problem is arguably more complex than the computer analysis of images
Laser and Vision Technology

56
of surfaced lumber since surfacing removes a good many of the discolorations that routinely appearon rough lumber. For example, there is the variability in exposure to ultra-violet radiation. Afterlumber is sawn it is typically stacked, usually outside, where the stack is exposed to direct sunlight.Boards on the exterior portion of the stack receive signifcant exposure to ultra-violet radiation whileboards on the inside of the stack receive very little exposure to ultra-violet light. This difference inexposure can and does cause a marked variation in material appearance depending on a board’slocation within the stack [4]., Light surfacing removes any such color variations.
Stacks stored outside are exposed to the weather. This weathering can also cause variation in thevisual appearance of a board, again depending on its location in the stack. Again, light surfacingremoves the discolorations caused by weathering.
There is also the problem of boards getting dirty during the various materials handling operationsthat occur prior to grading. Obviously dirt can be mistaken for a grading defect. Most graders carrya knife to ensure that a particular spot on a board is not just dirt that can be scraped off, but a realgrading defect. A machine vision system will not have access to a knife. Surfacing just prior tomachine vision inspection removes all dirt and prevents the machine vision system from having torecognize dirt.
Even the drying process introduces potential color variations in the material. Sap can come outof lumber and dry on the surface. The stickers used to separate the boards during drying can leavemarks on the material, etc. The rough surface itself can cause problems. The lighting needed tocreate a digital image of the board can cast shadows. These shadows could be misinterpreted bycomputer vision algorithms as being a defect. It is also known that the extent of surface roughnesscan affect the color of the material [5]. Surfacing creates a relatively smooth surface, free of sapstains and sticker marks.
As was stated in the introduction, more and more secondary remanufactures are surfacing thematerial prior to cutup in the rough mill. These manufacturers do it to simplify the cutup operationfor the sawyers. Surfacing makes defects, especially small defects, easier to see. The fact thatsurfacing is used in the rough mill is another indication of the relative difficulty of the two analysisproblems.
Finally, the computer analysis of rough lumber for the purpose of grading must cope with theproblem of surface moisture. Lumber can be graded right after it is first sawn to sometime after itis kiln dried. The variation in surface moisture content during this period of time is substantial andis known to cause a significant variation in the visual appearance of the material [6]. This is anotherproblem that need not be considered in rough mill automation since boards cutup in rough millshave all been dried.
Laser and Vision Technology

57
Initial Problem Statement
Because of the complexity of the rough lumber inspection problem, it was decided to reduce thecomplexity somewhat in the initial investigations by considering a less general problem. A decisionwas made to concentrate on just three species: red oak, cherry, and yellow poplar. Only fairly cleanboards were selected for the study. Boards with mud spots on them were not included in the database. Boards with sticker marks were allowed. Badly weathered boards were not. Boards containingareas discolored by ultra-violet light were also not considered.
The boards selected were digitized using a standard black and white RS-170 solid state camerahaving a resolution of 512x480. Full color images were obtained by using red, green, and blue colorfalters. The resulting full color images had a spatial resolution of approximately 64 points per inchso that each image represents approximately an eight inch by eight inch area.
The process of digitizing an image is referred to as “scanning.” To scan an image one must selecta number of scanning parameters. These parameters correspond to setting the f-stop and exposuretime on a 35 millimeter camera. For a vision system to be species independent the same scanningparameters have to be used to image all the material examined. Hence one set of scanning parametersmust be used to image all the various hardwood species. Using one set of paramaters means thateach species will not be “optimally” imaged just as one setting for the f-stop and exposure time willnot optimally image all pictures one might want to take. The concern in using just one scannersetting is that the images created could be so poor as to make the analysis of these imagescomputationally complex for the computer.
To determine the effects of scanning parameter settings, a number of boards from each specieswere scanned twice. The first image of each board was created using scanning parameters“optimized” for that board’s species. The second image of each board was created using scannersettings that allow all hardwood species to be imaged. This last set of scanner settings has been usedto scan surfaced boards of red oak, white oak, hickory, poplar, maple, walnut, cherry, mahogany,and white pine.
Finally, another small number of rough samples of red oak were scanned when their surfaceshad varying degrees of surface moisture content. The procedure followed was to wet the surface ofeach sample by letting the sample soak in water for some time. The samples were then removedfrom the water and scanned at regular time intervals. The purpose of this set of data was to determinethe effects of surface moisture on the computer analysis of the images.
The goal of these studies was to draw from the experience that has been gained from the studyof surfaced lumber [7-12] and to see if the same basic technology could be used on both problems.In those areas where difficulties occurred, the objective was to create algorithms that will work onboth rough and surfaced lumber.
Laser and Vision Technology

58
The image data used in the initial studies was color image data. Color characteristics of boardfeatures play an important role in the cutup operation performed in the rough mill. Because of this,a good deal of research had gone into the use of color data prior to considering the rough lumbergrading problem. Another reason for selecting color imagery is that humans can perform bothgrading and saw up based solely on input of color information from the eye. Therefore the initialconcentration on color imagery seems well founded.
The Segmentation System for Color Imagery
To achieve an inexpensive real-time implementation of the computer vision subsystem meansthat efforts must be made to reduce the computational complexity of these algorithms, to make themas computationally simple as possible. One method for reducing computational complexity comesfrom the studies that have been conducted on surfaced lumber [7-12]. The idea is a simple one andcomes from a cursory analysis of the problem. The imaging subsystem of the machine vision systemmust have a field of view as wide as the widest board that should be processed. Studies show thatover 99 percent of most hardwood lumber is less than 13 inches wide. So this would seem areasonable field of view. Yet the average hardwood board has a width of between 6 and 7 inches.If one can easily separate pixels of background from those of board, a substantial reduction in theamount of data that needs to be processed by the recognition algorithms can be achieved. Next, ifone looks at a typical board the vast majority of the board surface is clear wood, free of all defects.If one can create computationally simple methods for separating areas of clear wood from areas thatmight potentially contain a defect, another substantial reduction would occur in the volume of datathat has to be processed by the recognition algorithms. This savings becomes particularly importantif one considers that recognition algorithms are always the most computationally complex of anythe algorithms appearing in a computer vision system. By limiting the volume of data that has tobe processed by the recognition algorithms the computational complexity of the whole analysisproblem can be markedly reduced.
If this simplification method is employed, then the resulting vision system software can best beconceptually divided into two parts, a Segmentation System and a Recognition System. The purposeof the Segmentation System is to separate picture elements, “pixels,” of background from pixels ofboard, and pixels of clear wood from pixels of potential grading defects. The objective is to use verysimple algorithms for performing each of these tasks. The purpose of the Recognition System is toidentify the type of defect present at the locations marked by the Segmentation System. The goalof the Segmentation System is to reduce the volume of data that must be processed by theRecognition System.
Approximately two years of effort have gone into developing robust methods for performing thesegmentation operation, though admittedly, the thrust of these efforts has gone into the segmentationof surfaced lumber. The general methods used are described in References 7 - 12. However, themethods reported in these references had trouble separating decay and blue stain from areas of clearwood. Since the publication of these articles a new method has been devised [13,15]. It has yielded
Laser and Vision Technology

59
significantly improved results and has been used, without alteration, to segment images of surfacedred oak, white oak, hickory, poplar, maple, walnut, cherry, and white pine.
A goal of this study was to determine whether this new segmentation method would also workon rough lumber. Obviously, there is a strong theoretical motivation for wanting similar methodsto be used on both problems. The overall objective is to create a vision technology that is applicableto a variety of forest products applications.
The Recognition System for Color Imagery
The purpose of the Recognition System is to identify the type of defect present at a particularlocation, a location provided to the Recognition System by the Segmentation System. In computervision terminology the Recognition System performs the “scene analysis” operation, i.e., given aparticular image region the purpose of the Recognition System is to assign a label that identifieswhat is present in that region.
Conceptually, there are three basic approaches to scene analysis [16]. The first of these is thebottom-up type of approach. Using a version of this type of approach image data is processed by anumber of different operations, each operation producing a new data structure that makes some newfacet of the image explicit to the computer. The last of the operations performed are those thatactually label the regions of the image.
Bottom-up approaches have their origin in very early computer vision research [17-19]. Bottom-up approaches are known to be very sensitive to noise. Any mistake made by an early processingoperation propagates up through the rest of the processing operations. As such this type of approachhas proven ineffective on real world images [16], e.g., images of rough lumber.
A second class of scene analysis strategies are the top-down methods. The basic idea behind atop-down method is the formulation of a hypothesis of what is in the image. Once the hypothesishas been made operators are applied to the image to verify whether the formulated hypothesis iscorrect. Note that the initial hypothesis is generated without using any information collected fromthe scene. Further if the results of an operation disprove the current working conjecture of the sceneanalysis system then another working conjecture or hypothesis is generated. The generation of thisnew hypothesis is also independent of any information obtained from the scene during earlierprocessing.
Because no image derived information is used in formulating working hypotheses, top-downmethods are very limited in their generality [ 16]. However, these approaches have been successfullyused on very complicated albeit highly structured real world scenes, e.g., the analysis of chestradiographs [20].
The third class of scene analysis strategies is the combination or heterarchical strategies. Suchstrategies use a combination of both bottom-up and top-down methods. It can be argued that human
Laser and Vision Technology

60
vision uses a combination strategy. The need for some bottom-up processing where image derivedinformation is used to guide the analysis should be intuitively clear. The need for a scene analysissystem to make an hypothesis and attempt to verify that hypothesis using special operators is notso intuitively clear. See Reference 16 for an argument indicating the importance of top-downprocessing in human vision.
The final Recognition System being developed for the rough lumber inspection problem will usea combination strategy. Bottom-up type operations are used initially. The culmination of thebottom-up operations is a labelling of the various regions found in the image. For each region, thebottom-up derived labelling is used as the current working hypothesis for the top-down type ofanalysis that comes next. Ideally, an examination of the current working hypothesis could be foundto be erroneous by the operators applied to test the hypothesis. If this happens additional bottom-upprocessing would be required to generate a new working hypothesis for the region. This newworking hypothesis would then be used in a top-down analysis, etc. Obviously, such a recognitionprocedure will work in real-time only if a very few iterations are required before a correct label,i.e., defect type, is assigned.
As of this writing the Recognition System is not completely developed. It has only been trainedto identify splits/checks, knots, holes, and wane. Also, the system does not contain all the requiredtopdown components. It does contain a significant amount of the required bottom-up processing.The system is rule base, uses neural networks to validate the final working hypothesis about theidentity of a defect at a particular location, and uses fuzzy logic to help focus attention of therecognition algorithms.
Initial Study Results
The analysis of the moistened red oak samples confirmed the results given in Reference 6.Clearly, surface moisture content can significantly affect wood color. More importantly, it wasfound that the color difference between clear wood and grading defects changes markedly withsurface moisture content. When surface moisture is high there is very little color difference betweenclear wood and many of the grading defects. As the surface dries this color difference becomesmuch more pronounced. Hence whether man or machine is doing the grading, the grading can beaccomplished more easily and with greater accuracy if board surfaces are allowed to dry [13-15]
It was this result that motivated the consideration of kiln dried lumber in this study. Such sampleshave low surface moisture content and are dimensionally stable. Dimensional stability of the sampleswas an important consideration in selecting kiln dried lumber. Dimensional stability of the samplessimplifies efforts to verify the accuracy of an automatic analysis.
The application of the previously developed segmentation methods to the rough lumber samplesshowed that these techniques work almost as well on rough lumber as on surfaced lumber. There issome slight degradation in quality caused by the shadows cast by the rough surface of the material[13-15].
Laser and Vision Technology

61
The results obtained from the segmentation methods did not depend on the scanning parametersused. Hence, this study, just like the study involving surfaced samples of red oak, white oak, cherry,maple, walnut, poplar, hickory, and white pine, indicates that a single scanner setting for allhardwood species can be used. This is a very important result with regard to the possibility ofachieving species independent processing [13-15].
Next, the segmentation methods work equally well across the spectrum of hardwood species thathave been tested to date. Both this study and the one done on surfaced lumber samples show therobustness of these methods and their ability to be applied to any species and obtain good results.Again this is a very important result with regard to creating species independent processing methods[13-15].
The most important results to be presented are those obtained by applying the partially developedRecognition System to rough lumber data. Consider the board image shown in Figure 1. This is ablack and white version of the color image used in the actual processing. This image is of a rough
Figure 1
Laser and Vision Technology
62
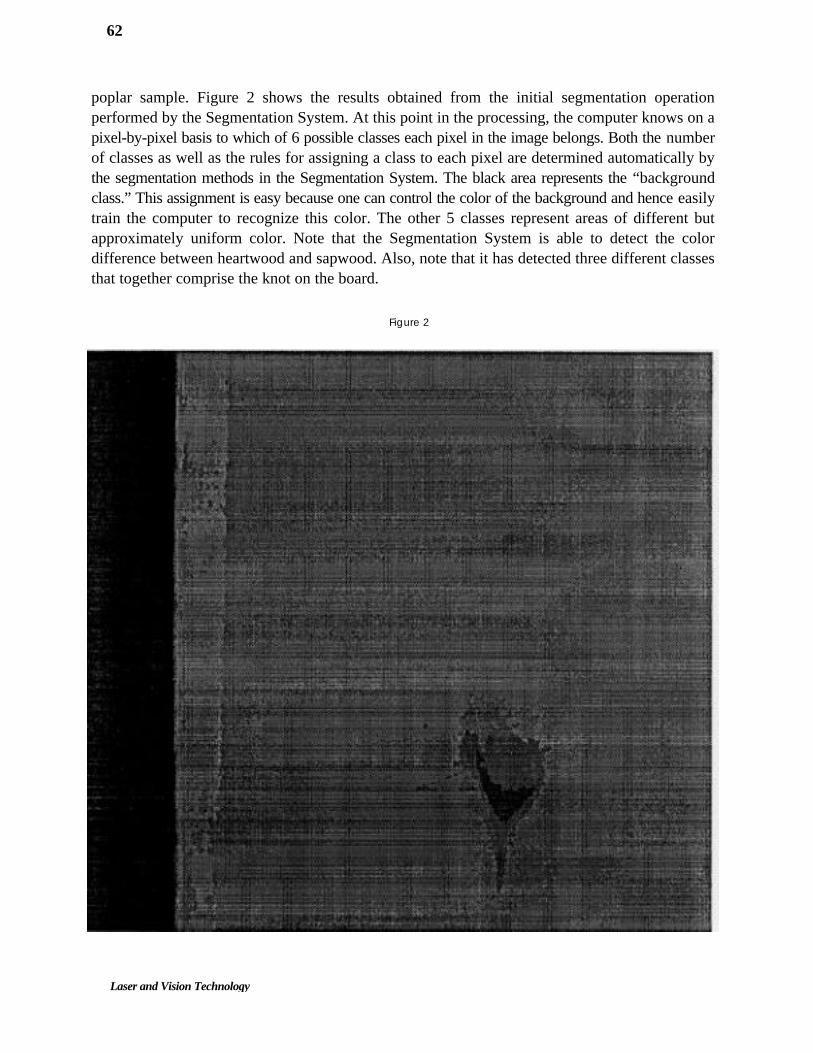
poplar sample. Figure 2 shows the results obtained from the initial segmentation operationperformed by the Segmentation System. At this point in the processing, the computer knows on apixel-by-pixel basis to which of 6 possible classes each pixel in the image belongs. Both the numberof classes as well as the rules for assigning a class to each pixel are determined automatically bythe segmentation methods in the Segmentation System. The black area represents the “backgroundclass.” This assignment is easy because one can control the color of the background and hence easilytrain the computer to recognize this color. The other 5 classes represent areas of different butapproximately uniform color. Note that the Segmentation System is able to detect the colordifference between heartwood and sapwood. Also, note that it has detected three different classesthat together comprise the knot on the board.
Figure 2
Laser and Vision Technology

63
As of this point the system believes that the class shown in medium gray, i.e., the heartwood, isthe clear wood area. It believes that this class is the clear wood class because there are always morepixels of this clear wood than any other class. This follows from the fact that the largest portion ofany board is clear wood area whether this clear wood be heartwood or sapwood.
Note that the purpose of the Segmentation System is to detect areas that might contain a defect.It does not have to find the exact boundary of a defect, only an approximate one. Nor does it haveto be completely noise free. If it makes errors these errors will be compensated for later in theprocessing.
Further bottom-up processing is performed by the Segmentation System to determine the numberand location of the connected regions appearing in the segmented image. The boundaries of thevarious connected regions found are shown in Figure 3. Note that prior to this processing thecomputer only knew on a pixel-by-pixel basis to which class each pixel belonged. It also knowswhich class seemingly corresponded to clear wood. The result of this new processing is to makeexplicit to the computer the number and location of connected regions.
An examination of Figure 3 shows that the initial segmentation did produce some erroneousresults. Most of the “noise” in the segmented image is confined to very small connected regions.Hence the next operation performed by the Segmentation System is to merge these small regions
Figure 3
Laser and Vision Technology

64
Figure 4
with larger ones. Two tests are employed to do this merging. After all the merging that can be doneis completed, each of the resulting connected regions has a list of properties computed from it andthese properties are put in the region’s attribute table.
The first processing step of the Recognition System is again a bottom-up one. Each region inFigure 4 is first given a label based on the properties in the attribute list. Adjacent regions havingthe same label are merged together to form the concept of DEFECT_OBJECT. An attribute tableof the merged regions is computed and associated with the DEFECT_OBJECT. The initial labelingof the DEFECT_OBJECTs is then verified based on updated attributes together with additionalproperties computed from the DEFECT_OBJECT using neural networks.
The process of creating DEFECT_OBJECTs is done by independently operating defect recog-nition modules. Each of these modules is an “expert” in identifying one particular type of defect.
The resulting labelling can still have errors. To remove such errors a top-down type processingis used. For a particular DEFECT_OBJECT this processing uses, as its working hypothesis, thelabel that was assigned to the DEFECT_OBJECT during the bottom-up processing.
Laser and Vision Technology

65
The results obtained after applying the existing top-down type processing are shown in Figure5. Note that the light gray area shown in the Figure 5 is the region of the image that the RecognitionSystem believes to be background. The labelling of the background region was actually performedby the Segmentation System. The white area of the figure is the region that the Recognition Systembelieves is clear wood, i.e., either heartwood or sapwood. The darker gray area in the figure is theregion that the Recognition System believes is knot.
Approximately two years of effort have gone into creating the current recognition system. Muchhas been learned. Much remains to be done. For more information on this recognition system seeReferences 21-23.
Figure 5
Problems
The primary focus of the research in hardwood defect detection has been in handling surfacedlumber for the purpose of automating rough mill cutup. The thrust of this work was on being ableto locate a number of defects including badly discolored wood. Defect removal in the rough mill islargely based on removing aesthetically displeasing areas so that such areas will not appear in roughparts. This motivation led to considering color cameras as the transducer to use to image roughboards for purposes of grading lumber.
Laser and Vision Technology

66
All the experiments performed to date do indicate that color imagery is useful in defect detection.The computer vision methods described in the last section progressed surprisingly fast given the apriori perception of problem difficulty. It has worked remarkably well on the simplified problemto which it was applied. Unfortunately, the rough lumber problem in its full generality is a verydifficult problem. Dirty material can and does confuse the segmentation method that has beencreated. Experiments with other segmentation methods have yielded no better results. The shadowscast by the rough surface can and do reduce the sensitivity of this and other segmentation methods.Even in surfaced lumber there are knots that have the same color as clear wood. This situation isfurther exacerbated in rough lumber. Wane detection is no problem as long as cambium is intact.But if debarkers are used, the cambium frequently comes off with the bark not to mention somesapwood as well. In such cases, wane is difficult both to detect as well as to identify.
It is currently believed that color information alone is not enough. Color imagery requires thatdefects be detected in an indirect manner. That is, one attempts to infer the presence of a defect andidentify it based on non-unique characteristics, e.g., knots are typically reddish brown but a barkpocket can be the same color. And, as was mentioned above, knots can be the same color as clearwood. Hence, it is possible for a defect to evade detection in color imagery and, even if detected,evade being correctly identified.
It all leads the authors to believe that other imaging scanners are needed to augment colorcameras. To aid in knot detection an x-ray scanner would seem useful. Experiments performed atVirginia Tech indicate that x-rays provide an effective way to detect the presence and extent ofknots. X-ray scanners are currently being used by some softwood companies to aid in the automaticgrading of 2x4 lumber. X-ray scanners seemingly provide a direct method for locating andidentifying knots. For boards of uniform thickness X-ray scanners can directly measure the densitydifferences that exist between knots and clear wood. But even the addition of an x-ray device mightnot be enough.
Variations in x-ray attenuation can come from a variety of sources, most particularly boardthickness. A welcome addition to the color camera systems and x-ray scanner would be a systemfor gauging board thickness. A new scanning system is being designed at Virginia Tech to do justthat. This new scanner can detect any defect that affects measurement of board thickness, e.g., holes,wane, and splits/checks, etc. Experiments with a simplified version of this scanning system haveshown it to be effective in locating and identifying all these defects. Again, this scanning system isable to detect these defects in a non-invasive manner based on differences in measured thickness ofa board.
Obviously, each new scanner added to a machine vision system increases the cost of the systemby the amount that the scanner costs. An objective in adding new scanners is to improve overallsystem performance so that the additional price is offset. Another objective is to add scanner systemsthat will make the analysis problem less computationally complex. Reducing the computationalcomplexity can markedly reduce the cost of the computing hardware needed to analyze the image
Laser and Vision Technology

67
data in real-time. A final objective for adding a scanning system is to make the analysis problemsolvable.
Based on the results that have been obtained to date, it seems impossible to accurately locate andidentify grading defects of typical rough lumber coming out of a sawmill using only color imagedata regardless of the computational complexity of the algorithms employed. To solve this problemis going to require additional scanners. These scanners must improve the results obtainable whenonly color data is used. These improved results should help offset their costs. They should alsoreduce the complexity of the computer vision analysis tasks, thereby reducing the cost of thecomputer needed to process image data in real-time.
Integrating information from color cameras, an x-ray scanner, and the new “range” scanningsystem should markedly improve the quality of the results obtainable from automatic analysis.Interestingly, these new scanners also provide an effective tool in the analysis of surfaced lumberfor rough mill automation. It is also known that they will prove useful on a variety of other forestproducts related applications as well. However, the question remains, will they be enough?Currently, it is believed that they will, but further study is needed to ensure that this is the case.
Lastly, it must be pointed out that for each new scanner added, the computer vision subsystemwill have to be adapted to handle data from this new imaging device. Obviously, this adaption willrequire some time. However, the objective in adding each new scanning system is to reduce thecomplexity of both the software and the software development effort.
Hardware Development
Excluding the computer vision subsystem, the rest of the prototype machine vision system is allhardware. This hardware includes the imaging subsystem, the materials handling subsystem, andthe computer system that will process the computer vision algorithms and control all the otherhardware subsystems. As was stated in the introduction, there area number of reasons for wantingto create a full scale prototype. One reason is to examine the hardware/software trade-offs indesigning a commercially viable machine vision system. As was indicated in the last section, onehardware/software trade-off concerns the number and types of imaging systems that must be used.Currently, it appears that using just color data makes it very difficult if not impossible to create acomputer vision software system that can accurately locate and identify grading defects on roughlumber or that can detect removable defects on surfaced lumber for rough mill automation.Therefore, to solve these problems additional hardware is needed, i.e., additional imaging systems,so that the software design problem can be simplified and solved. Actually, there are a number ofuncertainties involved in both the hardware and software components of this machine vision system.Currently, data is insufficient to allow one to determine exactly what spatial resolutions should beused with each of the scanning devices to be employed in this machine vision system. This is acritical point since the lower the spatial resolution the less computationally complex the analysisproblem. There is also an uncertainty as to how accurate the machine vision system must be. Clearly,
Laser and Vision Technology

68
it should be as accurate as a human grader, but how accurate is the human grader? These same basicquestions remain unanswered in the rough mill automation problem as well.
The purpose of the prototype system is to resolve these uncertainties for both problems. Withinthe context of the aircraft industry this prototype is an experimental plane. Its goal is to probe thefrontiers and provide the data upon which commercially viable systems can be created. And just asin the case of the aircraft industry, experimental planes inevitably cost more than commercial aircraftwhose design was based on the data obtained from the experimental plane. This additional costfactor follows from the fact that there are so many uncertainties. Hence, the experimental prototypemust be over designed. The data collected by this system will probably be of a higher spatialresolution than that used in a commercial machine vision system. The number of sensors employedwill probably be greater than that used in a commercial system. The computer employed willprobably be more expensive than the ones that will be used on commercial systems.
The primary design criteria for creating the prototype are simple. One must allow for almostevery eventuality. The subsystems must be flexible enough to provide a mechanism for change. Theprototype must provide a vehicle for resolving the many uncertainties associated with designingand building a commercially viable system for automatically grading hardwood lumber or forautomating the rough mill of furniture and fixture plants. The authors feel that the design for thisprototype accomplishes all these objectives.
In what follows the design and development of each of these hardware subsystems will bedescribed in some detail.
Imaging Subsystem
As was mentioned above, the imaging subsystem is going to be comprised of a number of imagingsensors. Of all these imaging sensors, the one farthest along in the development phase is the colorimaging subsystem. A color line scan camera has been selected. This Pulnix camera has a resolutionof 864 color pixels. At 64 points per inch spatial resolution this camera will allow a 13 1/2 inchfield of view, a field of view wide enough to handle the vast majority of hardwood lumber. Thecamera can run at 2.5 megahertz. At this speed the camera can generate images that have 64 pointsper inch cross board resolution and 32 points per inch down board resolution. Tests indicate thatthis is more than enough spatial resolution for most forest products related applications, especiallyfor automatic grading and rough mill automation. Two of these cameras have been purchased, onefor scanning each of the two board faces. For more information about the motivation for selectingthese cameras see References 23-25.
Light sources for illuminating board surfaces have also been selected. These sources usetungsten-halogen incandescent bulbs that have a color temperature of approximately 3600 Kelvin.The light from a bulb is transferred through a fiber optic cable that is composed of a number of verythin fiber optic light lines. At the far end of this cable the individual fiber optic lines are stacked ontop of one another with their ends forming a straight line. These fiber optic lines are all enclosed to
Laser and Vision Technology

69
keep them permanently in this configuration. These light sources are produced by the FostecCorporation. There are a number of motivations for using this type of light source [ 12,24, 25], oneof which is that they provide a convenient method for changing bulbs that burn out.
The cameras and light sources have all been mounted on an imaging system “prototype.” Thisprototype is a 4x6 feet optical bench in a free standing enclosure. A simple 6 feet long computercontrolled linear stage is used to transport boards up to 4 feet long through the color camera systems.Both cameras were initially connected to the PS/2 via a rather low speed parallel interface, aninterface similar to the one typically used to connect a printer to a computer. This easy to designinterface has allowed experiments to be conducted using these cameras while more complicatedinterface hardware was being designed, built and tested. For more information about the progressthat has been made on developing the color imaging components see References 12,24, and 25.
This more complicated hardware is a high speed interface that allows both color cameras to beconnected to a PS/2 Model 80. It provides the mechanism for collecting the color imagery andstoring it into computer memory [26]. This interface will allow the collection of color imagery dataas fast as it can be generated by the camera systems, i.e., 2.5 megahertz.
his “prototyper” has allowed various imaging geometries to be tried. It has allowed theillumination problems to be solved. Basically, it will allow all the components of the color scanningsystem to be checked out. Once completely checked out on the prototype, all that will remain tobe done is design and build dust free enclosures for the cameras and light sources, enclosures thatcan be directly mounted to the materials handling subsystem. The actual mounting of the colorimaging components to the materials handling subsystem should occur by 1 July 1991.
Approximately one year of effort has gone into determining the “best” sensors to use inconjunction with the color cameras. The analysis performed was based on difficulties that werebeing experienced by the computer vision subsystem in accurately and reliably locating andidentifying various defects. It was clear that one of the primary problems being experienced involvedaccurately locating and identifying knots. Since knots are one of the most common defects, it wasclear that something was going to have to be done to improve this aspect of machine vision systemperformance.
Another study being conducted at Virginia Tech involves the use of computer tomography (CT)image data to automatically locate and identify internal defects in logs. Data used in this researchactivity consists of successive scans of a number of log sections. These data have been used tosimulate what x-ray images of boards cut from these sections would look like. These data clearlyshow that x-rays can be used to easily detect the presence of knots in boards.
Hence, an additional scanner that is being considered for use on the machine vision system is anx-ray scanner. The scanner under consideration is similar to, but has a higher spatial resolution than,the x-ray scanners used to scan luggage at airports. The x-ray scanning system under consideration
Laser and Vision Technology

70
has a 20 pixels per inch cress board resolution and, at 2 linear feet per second, will allow a 10 pixelsper inch down board resolution. During the month of January 1991 studies will be conducted, againusing CT image data, to conclusively determine whether this x-ray system will be used on theprototype. As of this writing it is believed that this represents the “best” method for detecting knots.However, the studies performed in January will be the final determining factor. Efforts are currentlyunderway to locate sources of funding so that this system can be purchased. It will take approximate-ly one year to integrate this device into the machine vision system. The integration involvesdesigning and building mounting hardware so that this scanner can be attached to the materialshandling subsystem. It also involves designing and building a high speed interface to the PS/2computer. The development of computer vision algorithms to analyze the data from this scannerwill proceed in parallel with the hardware development activity.
An additional scanning system that will definitely be used in the machine vision system is thenew scanner being designed and built at Virginia Tech. This system uses lasers and solid statecameras to determine board thickness. The system being developed is similar to laser systems usedin edging and trimming applications for locating wane. However, this system is going to have muchhigher resolution, having 32 pixels per inch cross board resolution and 16 pixels per inch downboard resolution. Theoretically, this system could detect thickness to approximately 0.01 of an inch.An important part of the design of this system involves creating the special purpose hardware neededto collect the “range” data from this scanning system in real-time. It will take approximately 1 1/2years to completely develop this system. Funds to procure all the necessary hardware have beenraised. Funds to support the personnel costs are currently being pursued. As in the case of the x-rayscanner, the development of computer vision algorithms to analyze data from this imaging systemwill proceed in parallel with the hardware development activity.
Materials Handling Subsystem
The materials handling subsystem has been designed and is currently being built by AutomatedLumber Handling (ALH) Company of Lenoir, North Carolina. The materials handling subsystemshould be built, tested, and installed on the Virginia Tech campus by 1 March 1991. An earlyconceptualization of this subsystem is shown in Figure 6. This conceptualization looks very muchlike the subsystem that has been designed by ALH. There are only two real major differencesbetween this conceptualization and the actual subsystem. One is that the actual subsystem will usepneumatic pinch-rollers instead of the string loaded ones shown in the figure. The other is that theactual subsystem will have an optical sensor to detect board presence on one side of each of thepinch-rollers. These devices will be used to detect the presence of a board and to signal when a pairof rollers comprising pinch-roller configuration should be pressed together.
The materials handling equipment was designed to handle all hardwood and softwood lumberspecies of economic significance for the wood furniture, fixture and cabinet industries. Themaximum dimension of each piece of lumber to be handled is 17 feet in length, 20 inches wide and2 1/4 inches thick. The system will handle warped boards, in particular, crooked boards that fit into
Laser and Vision Technology

71
the 17 feet long by 20 inches wide by 2 1/4 inches thick volume. The weight per unit volume usedto design the system was 6 pounds per board foot.
Figure 6
The motion control system used in the materials handling equipment has two modes of operation.The first is a constant velocity mode where a board is accelerated from a standing start to a softwareselectable speed before the leading edge of the board enters the first imaging station. The programselectable speeds range from 0 to 4 linear feet per second. The board is to travel through all theimaging stations at this speed. It is extremely important that this speed be accurately controlled sothat high quality images can be obtained. The accuracy requirement for the constant velocity modeis that the board always be within ± 1/100 of an inch of where it is supposed to be. After the trailingedge of a board has passed the last imaging station, the board will be decelerated to a complete stop.
The design specifications for the material handling equipment required that it provide space forat least five imaging stations. The actual materials handling subsystem provides room for siximaging stations. These imaging stations are the positions where the color cameras, x-ray scanner,and the new “range” scanning device will be located.
The second mode of operation for the motion control equipment involves a start/stop type ofoperation where a board is moved some software selectable distance and then completely stopped.The minimum incremental distance the system was designed to handle is 1/128 of an inch.Positioning accuracy during this type of movement must also be very accurate. It was specified thatthe positioning accuracy must be such that the accumulated error along a 17 feet long board is lessthan 1/256 of an inch. ALH believes their design will be able to meet all the design requirementswith the possible exception of this last specification.
Laser and Vision Technology

72
The motion control equipment will be programmable in G-code. Outputs from all “important”sensing devices associated with the material handling system will be such that they can be madeavailable to the computer system that will run the whole machine vision system.
It is very important that board vibration be minimized while a board is in an imaging area of eachscanning device. It was specified that board vibration should be less than 1/128 of an inch for atleast 90 percent of the system operating time. This is the reason pinch-rollers surround each imagingstation.
The ALH design specifies that the materials handling equipment will be approximately 45 feetlong. It will be composed of three sections, a 15 feet long materials infeed section, a 15 feet longimaging section, i.e., the section depicted in the figure, and a 15 feet long outfeed section. Thesystem will be four feet wide. Boards will travel through the system approximately 42 inches offthe floor.
Compared to other materials handling equipment being used in the forest products industry, therequirements placed on this materials handling system are extremely precise. It is about as accurateas any system handling lumber can reasonably be. Obviously, this precision does not come withoutsome cost associated with it.
Is all this precision needed? This precision will probably not be needed on a commercially viablemachine vision system. One of the purposes of this research is to find whether this precision isneeded.
Computing System
At the spatial resolutions currently being used, a 16 feet long hardwood board will generate 32megabytes of color image data, image data from both sides of the board. At industrial speeds thisdata must be collected in 4 to 8 seconds. This data must also be processed in 4 to 8 seconds. Theother imaging systems will add even more data, albeit only about 4 megabytes, to this total. Thisadditional data that must be collected and processed in 4 to 8 seconds. To many, including theauthors, the above represent staggering processing requirements. Obviously, reduced spatial resolu-tions can and probably will reduce the required computational load, but still, one must be concernedabout the cost of a computer system capable of processing this quantity of data in the above statedtimes. High speed computers cost more than low speed ones, usually significantly more. One musteven be concerned about the cost of the main memory needed to store all this data. Real-timeprocessing will not allow the use of disk storage. Hence, the original image data from all the scannersmust be put in main memory. Intermediate data structures used by the computer vision softwaremust also be stored in main memory. This means that there must be lots of main memory. Againthere must be a concern about total system cost. High speed computer and memory cost money.
To help alleviate fears about costs, some important points need to be made. Today’s bench markprocessor is Intel’s 486 microcomputer. The fastest 486 on the market today runs at a clock speed
Laser and Vision Technology

73
of 33 megahertz and can execute, and this is the important statistic, 27 million instructions persecond (MIPS). The people at Intel estimate that a benchmark processor in the year 2000 will runat clock speeds of 250 megahertz and be able to execute, and again this is the important statistic, 2billion instructions per second, i.e., 2,000 MIPS. While this projection might seem rosy, the decadeof the 1980s saw an increase in speed comparable to Intel’s projection for the decade of the 1990s.Interestingly, the pace of technological improvement is increasing all the time. Hence Intel’sprojections may be conservative. If Intel’s projections are true, a relatively low cost high speedsystem that can meet the processing requirements posed by this problem should be available withina few years, most certainly well before the year 2000.
As to the cost of memory, another statistic is of interest. In the 1980s average memory costssteadily declined while the amount of memory available on a single chip soared. Entering the 1980sone could get either 16 kilobit or 64 kilobit memory chips. Today one can get 4 million bits on onememory chip. Also in the 1980s the cost of a memory chip declined markedly from one year to thenext. A chip that cost $1.00 one year could easily cost only 60¢ the next year. Given the worldwidecompetition it is doubtful that any of these trends will end. This also suggests that an affordablecomputer system capable of meeting all the processing requirements should be available within avery few years.
With the cost of computers and memory continuing to decline, the most economical way toproceed with this research activity is to get a minimal computer system, one that will allow proofof the concept of an automatic grading system to be demonstrated. To establish proof of conceptseemingly requires the collection of all needed image data at industrial speeds, the processing ofthis data to locate and identify grading defects in a “reasonable” time period, albeit not real-time,and the ability to create large image data bases of board images for algorithm testing andperformance evaluation.
Starting with main memory, collecting image data at industrial speeds requires at least enoughmain memory to hold all image data generated by the various scanners. A 16 feet long board willgenerate approximately 37 megabytes of data from all the scanning systems. If one wants to processthis data at reasonable speeds then the original data together with the data generated duringprocessing must all be stored in main memory. This should require no more than 20 additionalmegabytes. Finally, processing programs and the operations system also have to reside in mainmemory. This should take no more than 7 megabytes. Hence, a minimal memory configuration forestablishing the proof of concept is 64 megabytes of main memory. To provide a reasonableturnaround for the processing of image data, a computer is needed in the 100 MIPS range. This isa fast microprocessor based system by today’s standards but systems of this speed are coming onthe market. The computer vision subsystem has been designed in such a way that it can effectivelyuse a multiple instruction stream, multiple data stream (MIMD) computer architecture. Further, thealgorithms are such that a fully symmetrical parallel processing system is not needed. Fortunately,“economical” 100 MIPS machines are just now coming on the market. These systems have a MIMDarchitecture and are, at least currently, asymmetrical in their parallel processing capabilities. The
Laser and Vision Technology

74
asymmetric nature of the parallel processing is not caused by any limitations of the hardware, butrather is caused by the nature of currently available operating systems. These operating systems donot as yet support full symmetric parallel processing.
NCR will start marketing a system in the spring of 1991 that will have a MIMD architecturewhich can have up to four 50 megahertz 486 processors in it. With all four processors installed thissystem will execute approximately 160 MIPS. This system is an ideal choice for the full scaleprototype for a number of reasons. First, it has the speed range that is desired. One can start with asystem with only one processor in it and then incrementally add processors as needed. Hence, onecan minimize one’s initial investment while providing a powerful upgrade path. Next, this computersupports up to 256 megabytes of main memory, far more than the 64 megabytes required for proofof concept demonstration. Thirdly, and very importantly, this system has a microchannel input/out-put (I/O) bus. The high speed interface that has been designed for connecting the color camerasystems to a computer is an interface that uses the microchannel. Choosing a computer with amicrochannel means that this interface will not have to be redesigned. Also, the experience that hasbeen gained in designing this interface should make designing other interfaces to microchannel buseasier than having to go to another bus structure. Lastly, the NCR machine uses a dual portedmemory. Both the microchannel and the CPUS have access to memory simultaneously. Dual portedmemory is precisely the type of memory the authors feel should be used in a commercial versionof the vision technology being created.
Summary and Conclusions
This paper has presented the progress that has been made on developing both the hardware andsoftware components of a machine vision system prototype that can be used to establish proof ofconcept of the automatic grading of hardwood lumber. The prototype that is being developedrepresents an experimental tool that has many uses for forest products related machine visiondevelopment. It provides a mechanism for collecting data on full sized boards, the kind of boardsthat are routinely processed by hardwood sawmillers, secondary remanufactures, etc. It providesa mechanism for creating large image databases, databases that can be used to establish algorithmrobustness. These same data bases can be used to quantitatively determine how well a typicalemployee performs various tasks in the forest products manufacturing industry. This data on humanperformance levels is very critical in making informed design decisions regarding the structure ofcommercially viable machine vision systems. This prototype provides a vehicle for studyingproblems of reliability and maintainability of the various hardware components, issues that shouldbe of concern to anyone who intends to implement a machine vision system. Finally, in its mostsophisticated form, after all the needed algorithms have been developed and reasonable processingspeeds are possible, this prototype will provide a vehicle for demonstrating the savings a commercialmachine vision system will provide the sawmiller and other forest products related manufacturers.What makes this system so important is that it provides a vehicle for investigating a number of forestproducts related inspection problems. Its development is not going to be inexpensive. But the utilityit offers, the data it will collect, and the testbed it provides would seem to justify the cost.
Laser and Vision Technology

75
References
1. Klinkhachorn, P., J. P. Franklin, C. W. McMillin, R. W. Conners, and H. A. Huber, 1988,“Automated Computer Grading of Hardwood Lumber,” Forest Products Journal, Vol. 38, No. 3,pp. 67-69.
2. Klinkhachorn, P., C. J. Schwehm, C. W. McMillin, and H. A. Huber, 1989, “HaLT AComputerized Training Program for Hardwood Lumber Graders,” Forest Products Journal, Vol.39, No. 2, pp. 38-40.
3. Schwehm, C. J., P. Klinkhachorn, C. W. McMillin, and H. A. Huber, 1990, “HaRem: HardwoodLumber Remanufacturing Program for Maximizing Value Based on Size, Grade, and CurrentMarket Prices,” Forest Products Journal, Vol. 40, No. 7/8, pp. 27-30.
4. Sandermann, W., and S. Schulumbom, 1962, “On the Effect of Filtered Ultraviolet Light onWood. Part II: Kind and Magnitude of Color Differences on Wood Surfaces,” Holz als Roh-undWerkstoff, Vol. 20, pp. 285-291.
5. Nakamura, G., and H. Takachio, 1960, “Reflection of Light and Roughness on Sanded Surfaceof Wood,” Journal of Japan Wood Research, Vol. 6, pp. 237-242.
6. Sullivan J., 1967, “Color Characterization of Wood; Color Parameters of Individual Species,”Forest Products Journal, Vol. 17, No. 8, pp. 25-29.
7. Conners, R. W., C. W. McMillin, K. Lin, and R. E. Vasquez-Espinoza, 1983, “Identifying andLocating Surface Defects in Wood: Part of an Automated Lumber Processing Systems,” IEEETransactions on Pattern Analysis and Machine Intelligence, Vol. PAMI-5, No. 6, pp. 573-583.
8. Koivo, A. J., and C. W. Kim, 1989, “Automatic Classification of Surface Defects on Red OakBoards,” Forest Products Journal, Vol. 39, No. 9, pp. 22-30.
9. Conners, R. W., 1987, “Automatic Defect Detection in Surfaced Hardwood Lumber,” Proceed-ings First U.S./Finnish Joint Seminar on Wood Technology Research and Automation, Lahti,Finland, August 3-6, pp. 47-63.
10. Conners, R. W., C. T. Ng, T. H. Cho, and C. W. McMillin, 1989, “Computer Vision System forLocating and Identifying Defects in Hardwood Lumber,” Proceedings of SPIE, Applications ofArtificial Intelligence, VII, March 28-30, Orlando, Florida, pp. 48-64.
11. Conners, R. W., C. T. Ng, T. H. Cho, and C. W. McMillin, 1989, “A System for IdentifyingDefects in Hardwood Lumber that Uses AI Methods,” Proceedings Southeastcon ’89, Columbia,S. C., April 9-12, pp. 1080-1083.
Laser and Vision Technology

76
12. Conners, R. W., C. T. Ng, T. Drayer, and C. Gatchell, 1989, “A Computer Vision System forAutomating the Rough Mill of Furniture Plants,” Proceedings of IIE Integrated Systems Conferenceand Society for Integrated Manufacturing Conference, Altanta, GA, November 12-15, pp. 663-668.
13. Conners, R. W., P. Klinkhachorn, C. W. McMillin J. P. Franklin, and C. T. Ng, 1987, “AComputer Vision System for Grading Hardwood Lumber,” Second International Conference onScanning Technology in Sawmilling, October 1-2, Oakland/Berkeley Hills, CA, Forest In-dustries/World Wood, pp. XV-1 - XV-7.
14. Conners, R. W., T. H. Cho, and P. A. Araman, 1989, “Lumber Grading with a Computer VisionSystem,” Proceedings of the Seventeenth Annual Hardwood Symposium of the Hardwood Re-search Council, Merrimac, Wisconsin, May 7-10, pp. 183-191.
15. Conners, R. W., T. H. Cho, and P. A. Araman, 1989, “Automated Grading of Rough HardwoodLumber,” Proceedings of the Third International Conference on Scanning Technology in Sawmill-ing, San Francisco, California, October 5-6, pp. XVI-1, XVI-15.
16.Conners, R. W., 1987, “The Need for a Quantitative Model of Human Preattentive Vision,”Proceedings of SPIE, Vol. 786, Applications of Artificial Intelligence V, pp. 211-220.
17. Roberts, L., 1965, “Machine Perception of Three-Dimensional Solids,” in Optical and Electro-Optical Information Processing, J. Tippet et al (Eds.), M.I.T. Press, Cambridge, Massachusetts.
18. Huffman, D., 1971, “Impossible Objects as Nonsense Sentences,” in Machine Intelligence, B.Meltzer and D. Michie (Eds.), Edinburgh University Press, Edinburgh, Scotland, pp. 115-134.
19. Clowes, M., 1971,”On Seeing Things,” Artificial Intelligence, Vol. 2, No. 1, pp. 79-112.
20. Tsiang, P., 1974, “Computer Analysis of Chest Radiographs Using Size and Shape Descriptors,”Ph.D. Dissertation, University of Missouri, Columbia.
21. Cho, T. H., R. W. Conners, and P. A. Araman, 1990, “A Computer Vision System for AnalyzingImages of Rough Hardwood Lumber,” Proceedings Tenth International Conference on PatternRecognition, 16-21 June, Atlantic City, New Jersey, pp.726-728.
22. Cho, T. H., R. W. Conners, and P. A. Araman, 1990, “A Computer Vision System for AutomaticGrading of Rough Hardwood Lumber Using a Knowledge-Based Approach,” Proceedings IEEEInternational Conference on Systems, Man, and Cybernetics, 4-7 November, Los Angeles, Califor-nia, pp. 345-350.
23.T. H. Cho, 1991, “A Knowledge-Based Machine Vision System for Automated IndustrialInspection Using Neural Networks and Uncertain Reasoning,” Ph.D. Dissertation, VirginiaPolytechnic Institute and State University, Blacksburg, VA.
Laser and Vision Technology

77
24. Conners, R. W., C. T. Ng, T. H. Drayer, J. G. Tront, D. E. Kline, and C. J. Gatchell, 1990,“Computer Vision Hardware System for Automating Rough Mills of Furniture Plants,” Proceedingsof SPIE, Applications of Artificial Intelligence, VIII, Orlando, Florida, pp. 777-787.
25. Ng, C. T., 1991, “A Machine Vision System for the General Web Inspection Problem,” Ph.D.Dissertation, Virginia Polytechnic Institute and State University, Blacksburg, VA.
26. T. H. Drayer, 1991, “A High Performance MicroChannel Interface for Image ProcessingApplications,” Masters Thesis, Virginia Polytechnic Institute and State University, Blacksburg, VA.
Laser and Vision Technology