a low-mass binary neutron star: long-term ejecta evolution
TRANSCRIPT

A Low-mass Binary Neutron Star: Long-term Ejecta Evolution and Kilonovae withWeak Blue Emission
Kyohei Kawaguchi1,2 , Sho Fujibayashi3 , Masaru Shibata2,3 , Masaomi Tanaka4 , and Shinya Wanajo3,51 Institute for Cosmic Ray Research, The University of Tokyo, 5-1-5 Kashiwanoha, Kashiwa, Chiba 277-8582, Japan
2 Center for Gravitational Physics, Yukawa Institute for Theoretical Physics, Kyoto University, Kyoto, 606-8502, Japan3 Max Planck Institute for Gravitational Physics (Albert Einstein Institute), Am Mühlenberg 1, Potsdam-Golm, D-14476, Germany
4 Astronomical Institute, Tohoku University, Aoba, Sendai 980-8578, Japan5 Interdisciplinary Theoretical and Mathematical Science (iTHEMS) Research Group, RIKEN, Wako, Saitama, 351-0198, Japan
Received 2020 December 29; revised 2021 March 15; accepted 2021 March 29; published 2021 May 28
Abstract
We study the long-term evolution of ejecta formed in a binary neutron star (NS) merger that results in a long-livedremnant NS by performing a hydrodynamics simulation with the outflow data of a numerical relativity simulationas the initial condition. At the homologously expanding phase, the total ejecta mass reaches≈ 0.1Me with anaverage velocity of≈ 0.1 c and lanthanide fraction of≈ 0.005. We further perform the radiative transfer simulationemploying the obtained ejecta profile. We find that, contrary to a naive expectation from the large ejecta mass andlow lanthanide fraction, the optical emission is not as bright as that in GW170817/AT2017gfo, while the infraredemission can be brighter. This light-curve property is attributed to preferential diffusion of photons toward theequatorial direction due to the prolate ejecta morphology; large opacity contribution of Zr, Y, and lanthanides; andlow specific heating rate of the ejecta. Our results suggest that these light-curve features could be used as anindicator for the presence of a long-lived remnant NS. We also found that the bright optical emission broadlyconsistent with GW170817/AT2017gfo is realized for the case in which the high-velocity ejecta components inthe polar region are suppressed. These results suggest that the remnant in GW170817/AT2017gfo is unlikely to bea long-lived NS but might have collapsed to a black hole within ( ) 0.1 s.
Unified Astronomy Thesaurus concepts: Gravitational wave astronomy (675); Neutron stars (1108); Radiativetransfer simulations (1967)
1. Introduction
Binary neutron star (BNS) mergers are interesting phenomenain various astrophysical aspects. Gravitational waves from BNSsare among the most robust targets for the ground-basedgravitational-wave detectors (LIGO, Aasi et al. 2015; Virgo,Acernese et al. 2015; KAGRA, Kuroda 2010). A fraction of theNS material can be ejected from the system during the merger(e.g., Rosswog et al. 1999; Ruffert et al. 2001; Hotokezaka et al.2013), and the so-called r-process nucleosynthesis is expected totake place in such ejected material. The ejecta launched from BNSmergers are considered as among the most robust production sitesfor about half of the elements heavier than iron in the universe(Lattimer & Schramm 1974; Eichler et al. 1989; Freiburghauset al. 1999; Cowan et al. 2021). BNS mergers are also expected tobe associated with various electromagnetic (EM) transients in awide range of wavelengths (e.g., Blinnikov et al. 1984; Paczynski1986; Eichler et al. 1989; Li & Paczynski 1998; Metzger &Berger 2012; Hotokezaka & Piran 2015; Carrasco & Shibata2020). The simultaneous detection of the EM counterparts to thegravitational-wave detection enables us to identify the host galaxyof the merger event.
Among various possible EM counterparts, a kilonova is one ofthe most promising EM transients, which occurs as a result of themass ejection during the merger and the post-merger process (Li& Paczynski 1998; Kulkarni 2005; Metzger et al. 2010; Kasenet al. 2013; Tanaka & Hotokezaka 2013). Nuclei synthesized inthe ejected material include many radioactive isotopes, and hencethe ejected material is heated by the radioactive decay of suchisotopes. Thermal photons emitted in the heated materialpropagate through the expanding ejecta interacting with thesynthesized elements, and the emission diffused out from the
ejecta is observed as a kilonova. Since the elements synthesized inthe NS merger ejecta, particularly the lanthanides, have a largecontribution to the opacity, the kilonova emission is expected tobe bright in the optical and near-infrared wavelengths (Kasen et al.2013; Tanaka & Hotokezaka 2013; Kasen et al. 2015; Wollaegeret al. 2018; Gaigalas et al. 2019; Tanaka et al. 2020). The opticaland infrared EM counterparts associated with the first gravita-tional-wave event from a BNS merger, AT2017gfo (Andreoniet al. 2017; Arcavi et al. 2017; Coulter et al. 2017; Cowperthwaiteet al. 2017; Díaz et al. 2017; Drout et al. 2017; Evans et al. 2017;Hu et al. 2017; Kasliwal et al. 2017; Lipunov et al. 2017; Pianet al. 2017; Smartt et al. 2017; Tanvir et al. 2017; Troja et al.2017; Utsumi et al. 2017; Valenti et al. 2017; Pozanenko et al.2018), were indeed found to be consistent with the prediction forkilonova emission (e.g., Cowperthwaite et al. 2017; Kasen et al.2017; Kasliwal et al. 2017; Perego et al. 2017; Tanaka et al. 2017;Villar et al. 2017; Kawaguchi et al. 2018; Rosswog et al. 2018),while the origin and the property of the ejecta are still underdebate.The kilonova light curves are characterized by the mass,
velocity, radioactive heating, and opacity of ejecta (Li &Paczynski 1998; Kasen et al. 2013, 2015; Barnes et al. 2016;Tanaka et al. 2017, 2018; Wollaeger et al. 2018). The isotopicabundances that determine the radioactive heating rate and opacityof the ejecta reflect the conditions under which the ejecta areformed, such as the expansion velocity, entropy, and electronfraction (Ye; Wanajo et al. 2014; Wu et al. 2016; Lippuner et al.2017; Wanajo 2018). The morphology of ejecta, which is alsopointed out as an important factor to characterize the resultinglight curves (Kasen et al. 2015; Kawaguchi et al. 2018; Bulla 2019;Kawaguchi et al. 2020a; Darbha & Kasen 2020; Zhu et al. 2020;
The Astrophysical Journal, 913:100 (24pp), 2021 June 1 https://doi.org/10.3847/1538-4357/abf3bc© 2021. The American Astronomical Society. All rights reserved.
1

Korobkin et al. 2021), also reflects the mass ejection history.Thus, the detailed observation of the kilonova emission can beused as a probe for the underlying physics in the merger process.For this purpose, the quantitative understanding of the ejectaproperty, as well as the accurate prediction of the kilonova lightcurves, is crucial.
Many efforts have been made to investigate the ejectaproperty by performing numerical relativity (NR) simulations(see, e.g., Shibata & Hotokezaka 2019, for a review). Therecent NR simulations and nucleosynthesis calculations haverevealed the detailed property of the ejected material and theresulting element abundances, together with the dependence onthe mass ejection mechanism and the binary parameters, suchas the NS mass and NS equation of state (EOS; Dessart et al.2009; Bauswein et al. 2013; Hotokezaka et al. 2013; Metzger &Fernández 2014; Perego et al. 2014; Wanajo et al. 2014; Justet al. 2015; Sekiguchi et al. 2015, 2016; Radice et al. 2016; Wuet al. 2016; Bovard et al. 2017; Dietrich et al. 2017; Lippuneret al. 2017; Shibata et al. 2017; Siegel & Metzger 2017, 2018;Fujibayashi et al. 2018, 2020a, 2020b, 2020c; Kiuchi et al.2018; Ruiz et al. 2018; Wanajo 2018; Christie et al. 2019;Fernández et al. 2019; Perego et al. 2019; Bernuzzi et al. 2020;Ciolfi & Kalinani 2020; Nedora et al. 2021). Based on ormotivated by the knowledge of the ejecta profile and theelement abundances obtained by those simulations, radiativetransfer simulations with the realistic heating rate and/or thedetailed opacity calculations are performed to predict thekilonova light curves (e.g., Kasen et al. 2013, 2015; Barneset al. 2016, 2020; Kawaguchi et al. 2018, 2020a; Tanaka et al.2018; Wollaeger et al. 2018; Wu et al. 2019; Fontes et al. 2020;Hotokezaka & Nakar 2020; Nativi et al. 2020; Bulla et al.2021; Korobkin et al. 2021; Zhu et al. 2021), and theapplication to the real events is also actively conducted (e.g.,Evans et al. 2017; Kasen et al. 2017; Tanaka et al. 2017;Kawaguchi et al. 2020a, 2020b; Coughlin et al. 2020a, 2020b;Andreoni et al. 2020; Kyutoku et al. 2020; Anand et al. 2021).
However, the ejecta profiles employed in the previous studiesare highly simplified. At the time of the kilonova emission, theejecta are expected to be in the homologously expanding phase, asthe internal energy is lost and becomes much smaller than thekinetic energy owing to the adiabatic cooling. On the other hand,in the NR simulations, the ejected material escapes from thecomputational domain during the evolution before it reaches thehomologously expanding phase because the size of the domainand the simulation time are limited by the computational cost. Atthe time of ejecta evaluation, the ejected material still has anonnegligible amount of internal energy compared to its kineticenergy, and the ejecta trajectory can be modified during theexpansion due to the thermal pressure (Kastaun & Galeazzi 2015).Furthermore, some fraction of material ejected in the later phasecould have higher velocity than the ejecta that have alreadyescaped from the computational domain (e.g., Ciolfi & Kalinani2020; Fujibayashi et al. 2020c; Nedora et al. 2021). Those fluidelements should interact hydrodynamically in the subsequentevolution. Hence, the ejecta profile at the stage of homologousexpansion is not trivial only from the output of the NRsimulations.
Rosswog et al. (2014) and Grossman et al. (2014) performedpseudo-Newtonian hydrodynamics simulations for BNS mer-gers and studied the long-term evolution of the dynamicalejecta component until it reached the homologously expanding
phase. However, the recent NR simulations suggest that thedynamical ejecta component accounts only for a minor fractionof ejected material, and the ejecta are dominated by the post-merger ejecta component (e.g., Hotokezaka et al. 2013;Metzger & Fernández 2014; Fernández et al. 2019; Fujibayashiet al. 2020c), in which the contribution from the internal energyto the ejecta expansion could be more significant (Kastaun &Galeazzi 2015). Fernández et al. (2015, 2017) performed long-term simulations for black hole–NS mergers to investigate theeffect of the interplay between the dynamical and post-mergercomponents. They indeed found that the interaction of themultiple ejecta components can modify the ejecta profile, aswell as the property of the fallback material. Thus, to predictmore realistic kilonova light curves, it is crucial to follow thehydrodynamics evolution of the multiple ejecta componentsuntil the homologously expanding phase.In this work, we investigate the long-term evolution of ejecta
and the kilonova emission from BNS mergers for the cases inwhich the merger remnant NS survives for a long period. Forthis purpose, we employ the outflow data of the NR simulationsobtained in Fujibayashi et al. (2020c) as the initial conditions.First, we perform a hydrodynamics simulation of ejecta untilthe system reaches the homologously expanding phase. Then,we perform the radiative transfer simulation employing theejecta profile in the homologously expanding phase obtainedby our hydrodynamics simulation, and we discuss the propertyof the resulting light curves. This paper is organized as follows:In Section 2, we describe the setup and the results of the long-term hydrodynamics simulation. In Section 3, we show theresults of the radiative transfer simulation employing the ejectaprofile obtained by the long-term hydrodynamics simulation.We show that a large amount of ejecta with low lanthanidefraction does not necessarily result in bright optical emissionand that the prolate ejecta morphology; spatial distribution ofthe Zr, Y, and lanthanides; and low heating rate are the keysfor this light-curve property. In Section 4, we discuss theimplication for the future kilonova observation based on ourfindings, indication of the bright optical emission in a kilonova,and possible non-local thermodynamic equilibrium (non-LTE)effect on the late-time light curves. Finally, we summarize thispaper in Section 5. Throughout this paper, c denotes the speedof light.
2. Hydrodynamics Evolution
2.1. Hydrodynamics Simulation
Fujibayashi et al. (2020c) performed NR simulations of BNSmergers for the cases in which the remnant massive NS survivesuntil the end of simulations (4–6 s after the merger). The NRsimulations were performed with two steps: First, the simulationsemploying a 3D general relativistic neutrino radiation hydro-dynamics code were performed to follow the merger phase. Then,to study the post-merger dynamics, the axisymmetric generalrelativistic neutrino radiation viscous hydrodynamics simulationswere performed employing the hydrodynamics configuration ofthe 3D simulations as the initial data. By this study, thehydrodynamics profile of the ejecta containing both dynamicaland post-merger components was obtained consistently; theformer was driven in the first ∼50ms after the onset of mergerby shock heating in the collision surface and/or gravitationaltorque of the nonaxisymmetric merger remnant, while the latter
2
The Astrophysical Journal, 913:100 (24pp), 2021 June 1 Kawaguchi et al.

was launched subsequently from the remnant NS torus systemdriven by the viscosity and neutrino irradiation (see, e.g., Shibata& Hotokezaka 2019, and the references therein for a review).
To determine the ejecta profile in the homologouslyexpanding phase, we solve the hydrodynamics evolution ofejecta by employing the axisymmetric outflow data obtained byNR simulations in Fujibayashi et al. (2020c) as the innerboundary condition (hereafter, we refer to their result and ourpresent result by the terms “NR simulation” and “HDsimulation,” respectively, to distinguish those two). Specifi-cally, we employ the outflow data of the model DD2-125M inFujibayashi et al. (2020c) as representative of their models thatresult in long-lived remnant NSs. In this model, the merger ofan equal-mass binary with each NS mass of 1.25 Me isconsidered employing a finite-temperature EOS for nuclearmatter referred to as DD2 (Banik et al. 2014), and the viscousparameter of the axisymmetric NR simulation was set to beαvis= 0.04. Note that the dynamical and post-merger ejectamasses for this fiducial model are≈ 10−3 and≈ 10−1Me,respectively. The dynamical ejecta mass and torus mass of thefiducial model are in agreement with the predictions of thefitting models by Dietrich & Ujevic (2017), Radice et al.(2018), and Krüger & Foucart (2020) within the errors of thefits (see also Coughlin et al. 2019; Nedora et al. 2020). In thefollowing, we refer to the results obtained by employing theseoutflow data and the setup described below as the fiducialmodel.
We note that Fujibayashi et al. (2020c) found similaroutcomes (e.g., the mass, velocity, and element pattern ofejecta) for the models with a different EOS (SFHo; Steineret al. 2013) or a more massive (single) NS mass (1.35Me) tothose of DD2-125M. Thus, even for different total mass andEOS, we expect that BNS mergers that accompany theformation of long-lived remnant NSs can result in qualitativelythe same property of the ejecta profile and kilonova light curvesas those for the fiducial case (see Section 4).
On the other hand, a larger amount of heavy nuclei will besynthesized if much shorter mass ejection timescale isrealized, for example, by higher viscosity or magnetohydro-dynamical effects (Fujibayashi et al. 2020a, 2020b, 2020c).Indeed, in Fujibayashi et al. (2020c), the NR simulationemploying an effectively larger value of the viscous parameterwas performed to investigate the ejecta property in such asituation (αvis= 0.10, referred to as “DD2-125M-h”) andfound the production of heavy r-process nuclei (see also theright panel of Figure 3). In this work, an HD simulation and aradiative transfer simulation are also performed for the higher-viscosity model to study how the mass ejection timescale ofthe accretion disk surrounding the remnant NS changes thekilonova light curves (see Section 3.2.2 and Appendix F forthe results). While NR simulations employing a smallerviscous parameter are currently not available and beyond thescope of this paper, the speculation for such cases is alsodiscussed in Section 4.
To follow the hydrodynamics evolution of ejecta, wedevelop a new code for solving the relativistic Euler’s equationin the spherical coordinates. The detail of the formulation issummarized in Appendix A. In the hydrodynamics simulationcode, the effect of fixed-background gravity is taken intoaccount by employing the nonrotating black hole metric in theisotropic coordinates. We set the initial Arnowitt–Deser–Misner mass (Arnowitt et al. 1960) of the axisymmetric
NR simulation≈ 2.46 Me as the black hole mass of themetric.6 Following the NR simulation, the axisymmetry andequatorial plane symmetry are imposed for our HD simulation.For the polar angle θ, 128 grid points are set with uniform gridspacing. For the radial direction, nonuniform grid structure isemployed to appropriately resolve the ejecta in the homo-logously expanding phase. More precisely, the jth grid point isgiven by
⎜ ⎟⎛⎝
⎞⎠
( )=-
+ = +rr
r
j
Jr j Jln ln
1ln , 1 1. 1j
out
inin
Here rin and rout denote the inner and outer radii of thecomputational domain, respectively, and J denotes the totalnumber of the radial grid points. In this work we set J= 1024,and rin and rout are set to be rex and 103 rex, respectively (seebelow). We confirm that the fiducial grid resolution employedin our HD simulations is sufficiently fine by checking that theresults do not change for the simulation with 2048 and 256grids for the radial and latitudinal directions, respectively. Werefer to the simulation time of the axisymmetric NR simulationas t, whose origin corresponds to≈ 50 ms after the onset ofmerger, and the same time origin is employed for the presentHD simulations.The inner boundary of the long-term HD simulations is
initially set to be rex= 8000 km, which agrees with theextraction radius in the NR simulation from which the ejectainformation was obtained. Note that, by this choice of rex, thedynamical ejecta with the velocity 0.6 c are contained insidethe extraction radius of the axisymmetric NR simulation att= 0, and the mass of the ejecta that have already escaped fromthe extraction radius is negligible (∼10−7Me). In the NRsimulation, the rest-mass density, ρ, velocity of the fluid,v i= u i/u t(i= x, y, z), and pressure, P, of the ejecta wererecorded at the time when ejecta reached the extraction radius,and they were obtained as functions of the simulation time tand the latitudinal angle θ. The rest-mass density and velocityat r= rin are set by employing these data. We employ the ideal-gas EOS with the adiabatic index of Γ= 4/3 assuming that thetotal pressure is dominated by the radiation pressure. Weconfirm in the HD simulations that the domination of theradiation pressure indeed holds up to t= 1 day. The specificinternal energy of the fluid at r= rin is set so that the pressureagrees with that of the outflow data. After the NR simulationdata are run out at t≈ 8.5 s, the HD simulation is continued bysetting the floor value to the density of the inner boundary. Theeffect of this truncation is discussed below.To follow the long-term evolution of the system, we add the
radial grid points to the outside of the originally outer boundarywhen the high-velocity edge of the outflow reaches the outerboundary of our HD simulation. At the same time, theinnermost radial grid points are removed to keep the totalnumber of the radial grid points. By this prescription, thematerial with the radial velocity in the range of 10−3< v/c< 1is always contained in the computational domain. We note thatthe total mass of the material lost by removing the innermostradial grid points is< 10−3Me, which is less than 1% of thepost-merger ejecta mass located around the inner boundary
6 We note that the relative correction of the remnant NS spin to the metric isnegligible because it is an order of ( )c ~ -GM c r 102 2
in2 12, with χ, M, and rin
being the dimensionless spin, mass of the remnant NS, and inner radius of thecomputational domain, respectively (Landau & Lifshitz 1975).
3
The Astrophysical Journal, 913:100 (24pp), 2021 June 1 Kawaguchi et al.

(∼0.1Me), and the regridding process has a negligible effecton the evolution.
In the NR simulation, nucleosynthesis calculations wereperformed by using tracer particles (see Fujibayashi et al. 2020cfor details), and the element abundances and the radioactiveheating rate of the fluid element ejected from the system aredetermined as functions of ejection time and angle by thesecalculations. Note that, in the NR simulations, the nucleosynthesiscalculations were performed by employing the thermodynamicalcondition at each location of the particle as far as the particleswere in the computational domain. After the particles reachedr= rex, the calculation was resumed assuming the free expansion.Hence, the detailed hydrodynamical evolution of the fluidelements, such as the shock heating due to the interactionbetween different ejecta components, was not taken into accountin the nucleosynthesis calculations after the particles passedr= rex. Nevertheless, as we see in Section 2.2.2, we expect thatthe modification by such effects will be only minor.
To determine the spatial distribution of the radioactiveheating rates and the element abundances of the ejecta, theinjected time when each fluid element reached rin (tin) and theangle (θin) of the material are also considered to be variables ofthe fluid in addition to usual hydrodynamics variables. Thesevalues are evolved by solving the following advectionequations of the fluid elements in the conservative form:
( ) ( ) ( )r r¶ + ¶ =Q Qv 0, 2t ii
* *
where Q= tin or θin. For each time step of the HD simulation,the radioactive heating in the ejecta is considered by employingthe heating rate obtained by the NR simulation referring to theinjected time and angle of the fluid element.
2.2. Results
2.2.1. Ejecta Profile
Figure 1 shows the time evolution of the total mass in thecomputational domain, as well as the total input mass determined
by the mass flux of the outflow data. As long as the material isinjected from the inner boundary, the total mass in thecomputational domain agrees with the total input mass, and itfinally reaches≈ 0.11Me. As is discussed in Fujibayashi et al.(2020c), two distinct mass ejection phases are seen: one found inthe early phase (tin 1 s; referred to as the early-time ejectacomponent), which consists of the dynamical, early-timeviscosity-driven and neutrino-driven ejecta, and the other foundin the late phase (tin 1 s; referred to as the late-time ejectacomponent), which consists of the late-time viscosity-driven ejecta(see Fujibayashi et al. 2020c for details of each component). Thefirst component contributes to 0.02Me of the total ejecta mass,and the ejecta mass increases up to≈ 0.11Me by the contributionof the second component. After the outflow data from the NRresult run out, a fraction of the material falls back through r= rinand the total mass in the computational domain starts to decrease.The decrease rate becomes gradually smaller as the time evolves,and the total mass in the computational domain finally convergesto≈ 0.096Me for t� 100 s.The fallback of the material happens because the pressure
support from the inner boundary vanishes at the time when theoutflow data run out. In Fujibayashi et al. (2020c), whether thefluid element can escape from the system or not was judged byBernoulli’s criterion, < - » -hu h c0.9987t min
2, where h, hmin,and ut are the specific enthalpy, the minimum value of h in theEOS table employed (see Section 2.3 in Fujibayashi et al. 2020c),and the lower time component of the four velocity, respectively.The material that reached the extraction radius in the NRsimulation always satisfies this condition. On the other hand, bythis definition, the fluid element counted as an ejecta component isnot necessarily in a gravitationally unbound trajectory (i.e., doesnot necessarily satisfy ut<− 1) at that time because thecontribution from the internal energy is also taken into accountfor the ejecta determination. As long as the material is injectedwith sufficiently high pressure from the inner region, the fluidelements in the gravitationally bound orbits are graduallyaccelerated by the pressure gradient and eventually transit to theunbound trajectories as in the stationary wind. However, after thepressure support from the inner boundary vanishes, the transitionto the unbound trajectories is suppressed, and the material in thebound orbits is decelerated by the pressure from the precedingmaterial. As a consequence, a fraction of the material falls backthrough r= rin. This suggests that Bernoulli’s criterion is notnecessarily a sufficient condition for the material to begravitationally unbound for a nonstationary flow (see also Kastaun& Galeazzi 2015; Vincent et al. 2020).To clarify this picture more quantitatively, we determine the
material in the kinematically unbound trajectory by the fluidelement that satisfies ut<− 1. Figure 1 shows that the total massof the material in the unbound trajectories increases in time butwith a slower rate than that of the total mass in the computationaldomain. The mass in the unbound trajectories reaches only upto≈ 0.093Me at the time when the outflow data run out. Theincrease rate is significantly suppressed after the injection from theinner boundary is truncated, and eventually the total mass in thecomputational domain converges to the value for the material inthe unbound trajectories. The difference between the total mass inthe computational domain and the total mass of the material in theunbound trajectories shows the mass of the material in the boundorbits. Thus, this indicates that the acceleration to a fraction of theinjected material by the pressure gradient becomes inefficient after
Figure 1. Total mass in the computational domain as a function of time. Thepurple and green curves denote the results for the HD simulations in which theradioactive heating is turned on and off, respectively. The orange dashed curvedenotes the total mass of the material that is in the unbound trajectory. The bluedotted curve denotes the total input mass determined by the outflow data of theNR simulation (ut < − 1). The black dotted vertical line denotes the time atwhich the material injection from the inner boundary is truncated.
4
The Astrophysical Journal, 913:100 (24pp), 2021 June 1 Kawaguchi et al.

the time of the outflow truncation, and the material in the boundorbits falls back through the inner boundary.
We should note that the fraction of the injected material thatfalls back depends on the epoch at which the pressure supportfrom the inner region vanishes, and the sudden truncation of theinjection from the inner boundary can be rather artificial.Nevertheless, we find that the final mass of the ejecta in thehomologously expanding phase only varies by≈ 10%, andsome fraction of the injected material always falls back throughthe inner boundary even if the outflow injection is smoothlyextended for a plausible timescale (the resulting light curvesalso do not significantly change; see Appendix B). Thus, ourresults suggest that a fraction of the material that was countedas ejecta in the NR simulation in the late phase may fail toescape from the system.
2.2.2. Effects of Radioactive Heating
The result of our HD simulation in which the radioactiveheating is turned off during the hydrodynamics evolution isalso plotted in Figure 1 with the green curve. The timeevolution of the total mass in the computational domainwithout the radioactive heating term agrees approximately withthat for the fiducial setup, while the presence of the radioactiveheating term slightly increases the total mass by enhancing theacceleration by the pressure gradient. This suggests that theradioactive heating plays only a minor role for the hydro-dynamics evolution for our setup. Indeed, the left panel ofFigure 2 shows that the angle-averaged rest-mass densities ofthe ejecta for the results with and without the radioactiveheating term agree approximately with each other. Thepresence of the radioactive heating term slightly decreasesand increases the material with the radial velocity of� 0.03 cand 0.03–0.1 c, respectively, due to the enhancement of thepressure gradient, while the difference is nevertheless small.We note that the density at r/ct≈ 10−3 for the model withoutthe radioactive heating term is five times larger than that withthe radioactive heating term, but the total mass in r/ct� 0.005is less than 10−3Me, and it is not important for kilonova lightcurves. On the other hand, the presence of the radioactiveheating could induce a small difference in the resulting light
curves due to the difference in the initial internal energy of theradiative transfer simulation (see Appendix C).The previous studies (Grossman et al. 2014; Rosswog et al.
2014) show that the radioactive heating could mildly modifythe ejecta profile. In contrast to the previous results, theradioactive heating has a minor effect in our HD simulation.This can be understood by the delay until the ejected materialreaches the extraction radius of the NR simulation. The rightpanel of Figure 2 shows the specific radioactive heating rate ofthe ejecta as a function of time elapsed after the fluidtemperature decreased below 10 GK (GK= 109 K). While thecontribution from radioactive heating rate becomes the largestat t≈ 1 s, we find that the ejected material took typically≈ 2 suntil it reached the extraction radius of the NR simulation.Hence, the radioactive heating has been already weakened atthe injection time in our HD simulation and thus has only aminor effect on the evolution.However, we should note that the energy generation due to
the nuclear reaction and β-decay in the NR simulation can beslightly underestimated. The EOS employed in the NRsimulation considered the contribution from the binding energyof the nuclei in nuclear statistical equilibrium (NSE), and hencethe energy release due to the nuclear reaction is effectivelytaken into account as the release of the binding energy as longas the NSE condition holds. However, as the ejecta expand, thetemperature drops, and hence the NSE is not established anylonger. For such low temperature, the element abundancesconsidered in the employed EOS are not very accurate. That is,for such a regime, the contribution from the energy generationdue to, e.g., the r-process nucleosynthesis and successiveradioactive decay was not taken into account for the evolutionof the ejecta in the NR simulation. Indeed, we find that theradioactive heating after the temperature drops below ≈6–7GK can typically increase the internal energy by≈ 40% at thetime when the material reaches the extraction radius of the NRsimulation. Nevertheless, by performing the long-term HDsimulation even with the internal energy increased by 40%, weconfirm that the acceleration of the ejecta velocity due to theincrease in the internal energy is within≈ 5%, and the effect onthe resulting light curves is only minor (see Appendix D).The left panel of Figure 3 shows the maximum temperature
that the material injected at t= tin experienced during the HD
Figure 2. Left panel: angle-averaged rest-mass density of ejecta obtained for the snapshot at t ≈ 0.1 days as a function of radius with respect to ct. Right panel: specificradioactive heating rate of the ejecta. The origin of the horizontal axis is taken at the time when the fluid temperature decreased below 10 GK. The purple, green, andblue curves denote the heating rates averaged among the whole ejecta, the ejecta injected before 1 s, and the ejecta injected after 1 s, respectively.
5
The Astrophysical Journal, 913:100 (24pp), 2021 June 1 Kawaguchi et al.

simulation. Here, assuming the domination of the radiationenergy, the temperature of the fluid is determined by
( )=T e aint1 4, with eint and a being the internal energy
density and the radiation constant, respectively. The range ofthe temperature at the time of injection is also shown by thegreen shaded region. The maximum temperature is alwaysbelow 2 GK. Note that the relatively high temperature isrealized for the material with tin≈ 0.1 s and tin� 1 s becausetheir ejection is driven by shock heating and viscous heating,respectively. The small deviation of the maximum temperaturefrom the high edge of the initial temperature range indicatesthat the fluid element does not experience significant heatingduring the hydrodynamics evolution for r> 8000 km. Notethat, in Fujibayashi et al. (2020c), the thermodynamic historiesof tracer particles were extrapolated for nucleosynthesiscalculations up to about 1 yr by assuming the constant terminalvelocity and entropy. Our result indicates that the hydro-dynamics evolution after the material escaped from thecomputational domain of the NR simulation has only a minoreffect on the nucleosynthesis.
The right panel of Figure 3 shows the mass-averagedelement mass fractions for the fiducial model and the modelwith a large viscous parameter (see Section 3.2.2) at t= 1 day.The lanthanide mass fractions of the fiducial and higher-viscosity models are Xlan≈ 0.005 and Xlan≈ 0.03, respectively.While a detailed discussion can be found in Fujibayashi et al.(2020c), we emphasize here that, for both models, a largeamount of the first r-process peak elements is present in theejecta. As we see in Section 3.2.1, the first r-process peakelements have a large impact on the resulting kilonova lightcurves.
2.2.3. 2D Profile
The top and middle panels of Figure 4, respectively, showthe rest-mass density and Ye value at the temperature of 5 GKfor each fluid element in the ejecta profile at t≈ 0.1 days. As isshown in Appendix E, the ejecta are already approximately inthe homologously expanding phase at t≈ 0.1 days, and thusr/ct approximately shows the velocity of the fluid.
Both early-time (tin 1 s) and late-time (tin 1 s) ejectacomponents exhibit mildly prolate morphology. The formercomponent (tin 1 s) distributes from≈ 0.1 c to 0.3 c for theequatorial region and from≈ 0.2 c to 0.4 c for the polar region.The latter component (tin 1 s) exhibits more elongated shape,and it is entirely surrounded by the former component. The higherejecta velocity in the polar direction, which is the origin of theprolate shape, is due to neutrino irradiation from the remnant NS.Indeed, Figure 5 in Fujibayashi et al. (2020c) shows that the ejectavelocity is enhanced in the presence of neutrino irradiation. Thisindicates that the ejecta from a BNS merger that results in a long-lived remnant NS can always have a prolate shape.Discontinuity in the density distribution is found for the
material injected between≈ 0.02 and≈ 0.1 s (the edge of thedark-orange region in the top panel of Figure 4 located from(x/ct, z/ct)≈ (0, 0.43) to (x/ct, z/ct)≈ (0.28, 0)) and for thematerial in the polar region injected at≈ 1 s ((x/ct, z/ct)≈ (0,0.23)). The discontinuity found for the material of tin≈ 0.1 sindicates the presence of the interaction between the earlyviscous or the neutrino-driven ejecta component and the low-velocity edge of the preceding dynamical ejecta component,while the discontinuity found for the material of tin≈ 1 s isformed between the late-time viscous and the early-timeviscosity/neutrino-driven ejecta components.The Ye profile of the early-time ejecta component (tin 1 s)
shows a clear angular dependence. For θ π/4, the value of Ye isalways above 0.3. In particular, the early-time ejecta component isdominated by the material with Ye> 0.4 for θ π/6. On the otherhand, the material with Ye< 0.3 dominates the early-time ejectacomponent with the radial velocity larger than≈ 0.1 c for θ π/4.Compared to the early-time ejecta component, the Ye value ofthe late-time ejecta component (tin 1 s) shows less spatialdependence, and it is always approximately in a range of 0.3–0.5.The bottom panel of Figure 4 shows the distribution of the
lanthanide (57� Z� 71) mass fraction of the ejecta profile at1 day, where Z denotes the atomic number. Reflecting the angulardependence of the Ye profile, a large value of the lanthanidefraction is realized in the equatorial region of the early-time ejectacomponent. On the other hand, only a tiny amount of lanthanidesis synthesized in the polar region of the early-time ejecta
Figure 3. Left panel: maximum temperature that the material injected at t = tin experienced during the HD simulation. The green shaded region denotes the initialtemperature range of the ejected material at the time of injection. Note that the material that has fallen back into the inner boundary is not considered. Right panel:mass-averaged element mass fractions for the fiducial model (green lines) and the model with a large viscous parameter (blue lines; see Section 3.2.2) at t = 1 day. Thelanthanide mass fraction for the fiducial and higher-viscosity models are Xlan ≈ 0.005 and Xlan ≈ 0.03, respectively. The solar r-residual pattern taken from Prantzoset al. (2020) is plotted by the black points. Note that the solar r-residual pattern is shifted so that the Zr (Z = 40) mass fraction agrees with that for the fiducial model.
6
The Astrophysical Journal, 913:100 (24pp), 2021 June 1 Kawaguchi et al.

component (θ π/4) and in almost the entire region of the late-time ejecta component as a consequence of the high values of Ye.As we show in the next section, the presence of lanthanides in theequatorial region of the early-time ejecta component has a greatimpact on the resulting kilonova light curves.
Figure 5 shows the specific heating rate of the entire ejecta andthe early/late-time ejecta components for t= 0.3–30 days, whichis responsible for the kilonova emission. Here the thermalizationefficiency is taken into account by employing an analytic formula(Equations (32)–(33)) of Barnes et al. (2016) for γ-rays, electrons,α-particles, and fission fragments. The specific heating rateof the entire ejecta agrees approximately with that of the late-time ejecta component (tin� 1 s). It can be approximated by6× 109 erg g−1 s−1 (t/1 day)−1.6 for t≈ 0.3–30 days, which showsmuch steeper time dependence than the heating rate typicallyrealized for ejecta with Ye< 0.25, that is, ≈ 1010 erg g−1 s−1
(t/1 day)−1.3 (e.g., Metzger et al. 2010; Wanajo et al. 2014). Att≈ 1 day, the late-time ejecta component has a specific heating ratelower approximately by a factor of 2 than that of the early-timeejecta component (tin� 1 s). This reflects that r-process nucleo-synthesis takes place only weakly in the late-time ejecta owing tothe high values of Ye (Wanajo et al. 2014; Wu et al. 2016;Lippuner et al. 2017). For t� 10 days, the specific heating rate ofthe early-time ejecta component becomes lower than that of thelate-time ejecta component because the thermalization efficiency islower for the early-time ejecta component owing to the lower rest-mass density.
3. Light Curves
3.1. Radiative Transfer Simulation
We calculate the light curves from the obtained ejecta profileusing a wavelength-dependent radiative transfer simulationcode (Tanaka & Hotokezaka 2013; Tanaka et al. 2017, 2018;Kawaguchi et al. 2020a). The photon transfer is calculated by aMonte Carlo method for given ejecta profiles of the density,velocity, and element abundance. We also consider the time-dependent thermalization efficiency following an analyticformula derived by Barnes et al. (2016). Axisymmetry isimposed for the matter profile, such as the density, temperature,and abundance distribution. The ionization and excitation statesare calculated under the assumption of LTE by using the Sahaionization and Boltzmann excitation equations.
Figure 4. Top panel: rest-mass density profile of the ejecta obtained by the HDsimulation at t ≈ 0.1 days. The dashed curves denote the ejecta that escapefrom the extraction radius of the NR simulation at t = 0.02, 0.1, 1, and 5 s.Middle panel: Ye value at the temperature of 5 GK for each fluid element in theejecta profile at t ≈ 0.1 days. The typical launching mechanism for each part ofejecta is described by the black label. Bottom panel: distribution of thelanthanide (57 � Z � 71) mass fraction at 1 day, with Z being the atomicnumber. The dashed curves denote the rest-mass density contour of (10−13,10−11, 10−9) g cm−3 at t = 0.1 days from the outside.
Figure 5. Specific heating rate of the entire ejecta and the early/late-time ejectacomponents for t = 0.3–30 days. The thermalization efficiency is taken intoaccount by employing an analytic formula of Barnes et al. (2016).
7
The Astrophysical Journal, 913:100 (24pp), 2021 June 1 Kawaguchi et al.

For photon–matter interaction, we consider bound–bound,bound–free, and free–free transitions and electron scatteringfor a transfer of optical and infrared photons (Tanaka &Hotokezaka 2013; Tanaka et al. 2017, 2018). The formalism ofthe expansion opacity (Friend & Castor 1983; Eastman &Pinto 1993; Kasen et al. 2006) and the updated line listcalculated in Tanaka et al. (2020) are employed for the bound–bound transitions. The line list is constructed by an atomicstructure calculation for the elements from Z= 26 to Z= 92and supplemented by Kurucz’s line list for Z< 26 (Kurucz &Bell 1995). Note that since our atomic data include only up tothe triple ionization for all the ions, the early parts of the lightcurves (t� 1 days) may not be very reliable owing to too highejecta temperature, while the error in the ugrizJHK-band lightcurves for 0.5 days� t� 1 days is expected to be 0.5 mag(see Banerjee et al. 2020 for the work taking the opacitycontribution from higher ionization states into account).
The radiative transfer simulations are performed from t= 0.1to 30 days. We employ the snapshot of our HD simulation at0.1 days, and the density profile is mapped to the velocity spacein the Cartesian coordinates assuming the homologousexpansion. The initial internal energy and temperature for theradiative transfer simulations are also determined from thoseobtained by our HD simulation. The spatial distributions of theheating rate and element abundances are determined by thetable obtained by the nucleosynthesis calculations referring tothe injected time and angle of the fluid elements. In particular,we employ element abundances at 1 day and fix them duringthe time evolution to reduce the computational cost. Wechecked that this prescription has only a minor effect on theresults by performing the same radiative transfer simulation butemploying element abundances at 10 days.
3.2. Results
3.2.1. Fiducial Model
Figure 6 shows the bolometric luminosity of the fiducialmodel. The luminosity remains nearly constant until t≈ 3 days
and steeply declines at t≈ 7 days. The bolometric luminosityobserved from the polar and equatorial direction is larger andsmaller by a factor of≈ 2 than the viewing-angle-averagedvalue at t= 1 day, respectively. This is due to the blockingeffect by the lanthanide-rich ejecta located around theequatorial plane and resulting preferential diffusion of photonsin the polar direction (Kasen et al. 2015; Bulla 2019;Kawaguchi et al. 2020a; Darbha & Kasen 2020; Zhu et al.2020; Korobkin et al. 2021). The viewing angle dependencevanishes after≈ 10 days, which suggests that the entire ejectaare optically thin for such a phase.As pointed out in Fujibayashi et al. (2020c), the total heating
rate of the fiducial model exhibits a similar shape to thebolometric luminosity measured in AT2017gfo assuming thedistance of 40Mpc. On the other hand, we find that thebolometric luminosity actually realized by taking the photondiffusion effect into account shows different features from thatobserved in AT2017gfo; the bolometric luminosity is lower bymore than a factor of 2 at t= 1 day, while the luminosity fort� 3 days is higher than the observation, irrespective of theviewing angles. The suppression of the bolometric luminosityfrom the total heating rate for t 3 days is due to the trappingof photons by the optically thick media, while the overshootingof the luminosity from the instantaneous heating rate for3 days t 15 days is due to the release of the trappedradiation energy as a consequence of the density decrease. Thebolometric luminosity agrees with the instantaneous heatingrate after the entire ejecta become optically thin and the trappedradiation energy is all released (t 15 days).The fainter emission in the early phase (≈1 days) indicates
that the diffusion timescale of photons is longer than inAT2017gfo. The brighter emission in the late phase (≈7 days)indicates that the total ejecta mass of AT2017gfo is smallerthan that of the fiducial ejecta model (≈0.1Me) unless theuncertainty of the thermalization efficiency is significantlylarge. Thus, this result supports that the progenitor ofAT2017gfo is not likely to be a system like our fiducialmodel, that is, a BNS merger that results in a long-livedremnant NS.Figure 7 shows the ugrizJHK-band light curves observed
from various viewing angles. Despite the low lanthanidefraction of the ejecta model, we find that the kilonova lightcurves for the fiducial model are relatively faint in the opticalwavelengths and rather bright in the infrared wavelengthscompared to AT2017gfo or the low lanthanide fraction modelsin the previous studies (e.g., HMNS_YH in Kawaguchi et al.2020a). Indeed, while the emission in the riz band observedfrom 0°� θ� 20° for t� 1 day agrees broadly with thoseobserved in AT2017gfo assuming the distance of 40Mpc, wefind that the emission in the g band is fainter than thoseobserved in AT2017gfo. Instead, the emission in the JHK bandfor t� 1 day is brighter by≈ 0.5–1 mag than those observed inAT2017gfo.There are three reasons that cause the faint optical and bright
infrared emission. The first reason is in the prolate morphologyof the late-time ejecta component (see Figure 4). For the prolatemorphology, photons diffuse preferentially toward the equator-ial direction, in which the optical depth is small (Tanaka et al.2014; Kyutoku et al. 2015; Kawaguchi et al. 2020a; Darbha &Kasen 2020; Zhu et al. 2020; Korobkin et al. 2021). In such asituation, optical photons emitted from the late-time ejectacomponent are efficiently reprocessed into infrared photons in
Figure 6. Bolometric luminosity of the fiducial model. The isotropicbolometric luminosity for various viewing angles is also shown. The dashedcurve and the data points denote the total (thermalized) heating rate and theestimated bolometric luminosity of AT2017gfo taken from Waxman et al.(2018) assuming the distance of 40 Mpc, respectively.
8
The Astrophysical Journal, 913:100 (24pp), 2021 June 1 Kawaguchi et al.

Figure 7. The ugriz- (left panels) and JHK-band (right panels) light curves observed from 0° � θ � 20° (top panels), 40° � θ � 46° (middle panels), and86° � θ � 90° (bottom panels). Data points denote the observed data of AT2017gfo summarized in Villar et al. (2017). The hypothetical distance of 40 Mpc is usedfor the apparent magnitudes.
9
The Astrophysical Journal, 913:100 (24pp), 2021 June 1 Kawaguchi et al.

the lanthanide-rich early-time ejecta component located aroundthe equatorial plane.
To investigate the effect of the prolate morphology, weperformed an HD simulation in which the outflow injectionfrom θ� 30° is truncated for t� 200 ms. By this prescription,the high-velocity late-time ejecta component in the polar region(with z/ct= 0.1–0.2; see the contour of tin= 1 s) is suppressed.The left panel of Figure 8 shows that the rest-mass densityprofile of the late-time ejecta component (tin� 1 s) exhibitsapproximately a spherical morphology. For this case, as shownin the right panel of Figure 8, we find that the optical emissionis indeed enhanced. Note that broadly the same results areobtained for different truncation time of the polar outflow(100–400 ms). In the right panel of Figure 8, we also show theresults for the case in which the outflow mass for θ� 30° isalso reduced to 2/3 of the original value, which might mimic aBNS merger that accompanies the formation of a black hole(see discussion in Section 4).
We note that not only the morphology but also the densitystructure is key for the effect explained above. For example,Korobkin et al. (2021) studied the effect of the ejectamorphology in the presence of the multiple ejecta components.Among the models studied in Korobkin et al. (2021), themodels with torus-shaped low-Ye ejecta and peanut-shapedhigh-Ye ejecta are most similar to our fiducial model. However,their models with such morphology show bolometric luminos-ity comparable to the observation of AT2017gfo for� 1 day,whereas our model results in smaller luminosity than theobservation despite the larger ejecta mass (see, in particular,“T1P1” or “T2P2” in Table 2 of Korobkin et al. 2021). Wespeculate that while the difference in the element abundancesand heating rate might be the main cause for this difference, thedifference in the density structure can also be responsible for it:while the peanut-shaped high-Ye ejecta model of Korobkinet al. (2021) has the density peak in (x/ct, z/ct)≈ (0, 0.1–0.2),the late-time ejecta component (tin� 1 s) of our model is moreconcentrated in the center region (r/ct< 0.1). Such a difference
in the density profile causes a large difference in the diffusiontimescale of photons and hence in the resulting bolometricluminosity (e.g., Kawaguchi et al. 2020a). Moreover, thepresence of the relatively smaller density region in the polarregion (z/ct= 0.1–0.2) in our model also has a great impact tosuppress the ultraviolet and optical light curves (e.g., see theextended Figure 1 in Kasen et al. 2017). Thus, we shouldconsider not only the ejecta morphology but also the densitystructure as the key characteristics of the ejecta.The second reason is in the presence of Y (Z= 39) and Zr
(Z= 40) in the high-velocity edge of the ejecta. Y and Zr arecategorized as d-shell elements, and they significantly con-tribute to the opacity in the optical wavelength as they have alarge number of low-lying energy levels (Tanaka et al. 2020).These elements (and also Sr) are abundantly produced in theejecta with relatively high values of Ye (e.g., >0.3; Wanajoet al. 2014). The left panel of Figure 9 shows the distribution ofthe Y (Z= 39) and Zr (Z= 40) mass fraction at 1 day. Focusingon the polar region (θ 30°), a large amount of Y and Zr, aswell as relatively low mass r-process elements, is present in thehigh-velocity edge of the early- and late-time ejecta compo-nents with z/ct ≈ 0.2 and 0.4, respectively. In the right panel ofFigure 9, we compare the expansion opacity (Friend &Castor 1983; Eastman & Pinto 1993; Kasen et al. 2006) ofbound–bound transitions between the cases in which thecontributions from Y and Zr are taken into account and nottaken into account. Here, the opacity is calculated by employ-ing the element abundances in (x/ct, z/ct)= (0.001, 0.4) andby assuming the density of 2× 10⁻¹⁶ g cm−3 and temperatureof 3000 K, which correspond to the condition there at t= 1.5days. It shows that the bound–bound opacity in the polar edgeof the ejecta is dominated by the contribution from Y and Zr.The left panel of Figure 10 compares the gzK-band light
curves observed from 0°� θ� 20° between the fiducial setupand the case in which the opacity from Y and Zr is omitted. Asis shown in the figure, the opacity from Y and Zr is responsiblefor suppressing the ugr-band emission by≈ 1–2 mag for
Figure 8. Left panel: rest-mass density profile of the ejecta at t ≈ 0.1 days for the HD simulation in which the outflow injection from θ � 30° is truncated for t � 200ms in order to suppress the high-velocity late-time ejecta component in the polar region (vz ≈ 0.1–0.2 c). The dashed curves denote the ejecta that escape from theextraction radius of the NR simulation at t = 0.02, 0.1, 1, and 5 s. Right panel: comparison of the gzK-band light curves observed from 0° � θ � 20° between thefiducial ejecta model (dashed curves) and the ejecta model in which the high-velocity late-time ejecta component is suppressed (“w/o high vel.”; solid curves). Thedotted curves (“2/3 disk wind”) denote the same as “w/o high vel.” but for the case in which the outflow mass for θ � 30° is also reduced to 2/3 of the original valuefor t � 200 ms. The meaning of the data points is the same as in Figure 7.
10
The Astrophysical Journal, 913:100 (24pp), 2021 June 1 Kawaguchi et al.

t 1 day. We note that Y and Zr are also present in theequatorial region, but the opacity is dominated by thelanthanide elements there. We also note that the first r-processpeak elements including Y and Zr are less produced in the polarregion of the ejecta with 0.3 r/ct 0.4 owing to a large Yevalue (�0.5).
The third reason is in the relatively low specific heating rateof the late-time ejecta component (see Figure 5). The mass-averaged heating rate of the ejecta in the fiducial setup istypically lower than that for the ejecta with Ye< 0.25 by afactor of 2–4 for t≈ 1–10 days. The low heating rate leads tolow ejecta temperature and hence shifts the spectral peak to thelonger wavelengths. The right panel of Figure 10 shows that
the emission is≈ 0.5–1 mag dimmer than that in a hypotheticalmodel with 1010 erg g−1 s−1 (t/1 day)−1.3 for t≈ 1–10 daysthat reasonably approximates that of ejecta with Ye< 0.25 (e.g.,Metzger et al. 2010; Wanajo et al. 2014).
3.2.2. Higher-viscosity Model
To investigate how the mass ejection timescale of theaccretion disk surrounding the remnant NS changes theresulting kilonova light curves, we perform a long-term HDsimulation and a radiative transfer simulation for the outflowdata obtained in the NR simulation with a large viscousparameter (DD2-125M-h) in the same manner as for thefiducial model (see Appendix F for the resulting ejecta profile).
Figure 10. Left panel: comparison of the gzK-band light curves observed from 0° � θ � 20° between the fiducial setup (dashed curves) and the case in which theopacity contributions from Y and Zr are omitted (solid curves). Right panel: comparison of the gzK-band light curves observed from 0° � θ � 20° between the fiducialsetup (dashed curves) and a hypothetical case with the power-law heating rate of 1010 erg g−1 s−1 (t/1 day)−1.3 (solid curves). The meaning of the data points is thesame as in Figure 7.
Figure 9. Left panel: distribution of the Y (Z = 39) and Zr (Z = 40) mass fraction at 1 day. The dashed curves denote the rest-mass density contour of (10−13, 10−11,10−9) g cm−3 at t = 0.1 days from the outside. Right panel: comparison of the expansion opacity (Friend & Castor 1983; Eastman & Pinto 1993; Kasen et al. 2006) ofbound–bound transitions between the cases in which the contributions from Y and Zr are taken into account (blue curve) and not taken into account (green curve). Theopacity is calculated by employing the element abundances in (x/ct, z/ct) = (0.001, 0.4) and by assuming 2 × 10⁻¹⁶ g cm−3 and 3000 K, which correspond to thecondition at t = 1.5 days.
11
The Astrophysical Journal, 913:100 (24pp), 2021 June 1 Kawaguchi et al.

Figure 11 compares the gzK-band light curves for the fiducialejecta model and for the ejecta model with a large viscousparameter.
We find that the light curves for the model with a largeviscous parameter show the features similar to those for thefiducial model, that is, the relatively faint optical and brightinfrared emission. This is due to the rest-mass density andelement abundance distributions of the higher-viscosity modelsimilar to those of the fiducial model: the prolate shape of thelate-time ejecta component with high mass of≈ 0.13Me,torus-like distribution of lanthanide elements in the surround-ing early-time ejecta component, and presence of the first r-process peak elements in the polar region.
Our result may indicate that the kilonova emission fromBNS mergers that result in long-lived remnant NSs sharesbroadly common features despite the difference in thenucleosynthesis yields if the viscous parameter is in theplausible range (0.1; e.g., Kiuchi et al. 2018; Fernández et al.2019). Note that, in a quantitative manner, the optical emissionand infrared emission are fainter and brighter by≈ 1 mag,respectively, than those for the fiducial model because the late-time ejecta component of the higher-viscosity model has alarger lanthanide fraction (see the right panel of Figure 3 and,e.g., Kawaguchi et al. 2020a).
We note, however, that the NR simulation with a higherviscous parameter was performed for the limited simulation time(2 s), and a large fraction of the ejected material (≈0.05Me) stillremained inside the extraction radius. Such an ejecta component isneglected in our long-term HD simulation since the injection ofthe outflow is truncated after the end of the outflow data. Weshould note that the final ejecta mass in the homologouslyexpanding phase will be larger, and hence the emission brighterthan that found in Figure 11 can be realized particularly in theinfrared wavelengths if such an ejecta component is taken intoaccount in our long-term HD simulation.
4. Discussion
Fujibayashi et al. (2020c) showed that BNS mergers thataccompany the formation of long-lived remnant NSs will result
in a qualitatively similar ejecta outcome irrespective of themass of each NS and the EOS for the NS. Quantitatively, thereis a variation in the total ejecta mass up to a factor of 2 amongthe models with different EOSs and different total binarymasses, reflecting differences in the remnant torus mass (seeTable 3 in Fujibayashi et al. 2020c). Nevertheless, the propertyof the kilonova light curves for the models with different EOSsand different total masses can be qualitatively the same as forthe fiducial model. In Figure 12, we compare the ugrizJHK-band light curves between the fiducial model and the model inwhich the outflow injection is truncated after tin= 3 s and thetotal ejecta mass is reduced by a factor of≈ 2. Note that thelatter model approximately corresponds to the model withSFHo (SFHo-125H in Fujibayashi et al. 2020c). Figure 12shows that the kilonova light curves have qualitatively thesame property as for the fiducial model for t= 1–16 days, thatis, relatively faint optical and bright infrared emission.We also found that the kilonova light curves with
qualitatively similar features can be realized even for the casewith a large viscous parameter, with which material with moreheavy nuclei is ejected. We speculate that the light curves witha qualitatively similar feature can also be obtained for the casewith a smaller viscous parameter: if the viscous parameter issmaller than that employed in the fiducial model, the massejection timescale becomes longer. For such a case, the post-merger ejecta with a slightly higher value of Ye will be formed,and a smaller amount of heavy nuclei will be synthesized in theejecta (Fujibayashi et al. 2020a, 2020b, 2020c). On the otherhand, the presence of the first r-process peak elements in thepolar edge (z/ct≈ 0.4) and the lanthanides in the equatorialregion, which are the important opacity sources, is expected tobe less dependent on the viscous parameter, as they originatefrom the dynamical and neutrino-driven mass ejection (see themiddle panel of Figure 4). Since the radioactive heating rate inthe ejecta will be strongly suppressed owing to suppressedproduction of the radioactive heavy nuclei, the brightness of theoptical emission for the case with a smaller viscous parametercould be comparable to or even smaller than the fiducial model.Thus, while performing the NR simulations with a smaller
Figure 11. Comparison of the gzK-band light curves between the fiducial ejecta model (dashed curves) and the ejecta model employing the outflow data of the NRsimulation with a large viscous parameter (solid curves). The light curves observed from 0° � θ � 20° (left panel) and 86° � θ � 90° (right panel) are shown. Themeaning of the data points is the same as in Figure 7.
12
The Astrophysical Journal, 913:100 (24pp), 2021 June 1 Kawaguchi et al.

viscous parameter is necessary for the confirmation, our resultsimply that the mergers of BNS systems that accompany theformation of long-lived remnant NSs may always result insimilar kilonova light curves to what we found in this work.
Fujibayashi et al. (2020c) pointed out that equal-mass BNSmergers that result in long-lived remnant NSs will not be themain events among the entire mergers, as the resultingnucleosynthetic yields are different from the solar r-process-like pattern that is observed in the r-process-enhanced metal-poor stars (e.g., Cowan et al. 2021). Nevertheless, BNSmergers that result in long-lived remnant NSs may be detectedin the future, as a low-mass NS binary indeed exists (Stovallet al. 2018). Our results show that if an event similar to thefiducial model occurs, the kilonova emission will be intrinsi-cally brighter than −14 mag in the z band for 1 day� t� 3days irrespective of the viewing angles. Such emission isdetectable by the observation using 1 m class and 4/8 m classtelescopes if the distance to the event is within ∼100 and200Mpc, respectively (Nissanke et al. 2013). The infraredobservation employing the telescopes, such as VISTA (Ackleyet al. 2020), will further increase the detectability of thekilonovae since the HK-band emission is apparently brighterthan 21 mag for 1 day� t� 10 days for all the viewing anglesif the distance to the event is within ∼150Mpc. On the otherhand, to detect the optical emission of which wavelengths areshorter than the g band, the follow-up observation within≈ 1day is crucial unless the event occurs much closer than the caseof AT2017gfo. The discovery of a kilonova from such a systemwill be a good opportunity to test our current understanding ofthe merger process and emission mechanism.
The relatively faint optical emission found in our kilonovamodel is partly due to the presence of a large amount ofmaterial in the polar region. The abundant existence of Y andZr in this region also plays a role for darkening the optical polaremission. This indicates that the suppression of the high-velocity ejecta components in the polar region with a largeramount of the first r-process peak elements may be needed forthe kilonova to be as bright in the optical wavelength as inAT2017gfo. Indeed, we found that the optical emission will beenhanced and the light curves could be broadly consistent with
AT2017gfo for the case in which the high-velocity componentin the polar region is suppressed (see Figure 8).Since the high-velocity components in the polar region are
enhanced by neutrino irradiation from the long-lived remnantNS, the high-velocity ejecta components in the polar regioncould be suppressed if the remnant NS collapses into a blackhole in a shorter timescale after the merger. For such a case, theviscosity-driven disk outflow will also be suppressed by afactor of≈ 1/3–2/3 (Fujibayashi et al. 2020a, 2020b). Figure 8shows that the infrared light curves approach those ofAT2017gfo for the case in which the mass of the viscosity-driven ejecta is reduced to 2/3 of the original value (see “2/3disk wind” in Figure 8). Note that the probable identification ofSr in the spectra of AT2017gfo (Watson et al. 2019) impliesthat the ejecta as a whole of this BNS merger should alsocontain a substantial amount of Y and Zr (which arecoproduced with Sr). This suggests that the presence of brightoptical emission in a kilonova may indicate the collapse of theremnant NS to a black hole in a short timescale of ( ) 0.1 s (seealso Mösta et al. 2020).However, we should note that the results could be modified
if the magnetohydrodynamical effects are taken into account inthe NR simulations. As discussed in Fujibayashi et al. (2020c),the remnant NS and disk can be strongly magnetized bymagnetohydrodynamical process such as Kelvin–Helmholtzinstability (Price & Rosswog 2006; Kiuchi et al. 2018), themagnetorotational instability (Balbus & Hawley 1998), and thewinding effects. In such a case, ejecta can be accelerated moreefficiently by the magnetohydrodynamical effects than those inthe prescription of effective viscosity. In fact, it is shown inMösta et al. (2020) that the ejecta velocity is significantlyenhanced up to 0.5 c by magnetohydrodynamical process in thepresence of a strong poloidal field (see also Fernández et al.2019; Ciolfi & Kalinani 2020; Shibata et al. 2021). Thus, theejecta can be more extended in the velocity space if themagnetohydrodynamical effects are taken into account.Our speculation for the kilonova light curves in the presence
of magnetically driven high-velocity post-merger ejectacomponents is as follows. If the ejecta formation occurs in ashort timescale (0.1 s), Ye of ejecta will be low and a
Figure 12. Comparison of the gzK-band light curves between the fiducial ejecta model (dashed curves) and the model in which the outflow injection is truncated aftertin = 3 s and the total ejecta mass is reduced by a factor of ≈ 2 (≈0.05 Me; solid curves). The light curves observed from 0° � θ � 20° (left panel) and 86° � θ � 90°(right panel) are shown. The meaning of the data points is the same as in Figure 7.
13
The Astrophysical Journal, 913:100 (24pp), 2021 June 1 Kawaguchi et al.
significant amount of lanthanides might be synthesized(Fujibayashi et al. 2020a, 2020b, 2020c). For such a case, theoutermost layer of the ejecta can be lanthanide-rich, and thekilonova light curves might be much fainter and brighter in theoptical and infrared wavelengths, respectively, due to the so-called lanthanide curtain effect (Kasen et al. 2015). On theother hand, if the mass ejection timescale is 1 s, Ye will behigh enough so that the post-merger ejecta are lanthanide-pooras in the fiducial model of this work. For such a case, kilonovalight curves brighter in the optical wavelengths for the earlyphase (≈1 day) might be realized owing to high ejecta velocity(e.g., Kawaguchi et al. 2020a). However, the other importantthermodynamical condition of ejecta, such as specific entropyof the ejecta, can also be significantly altered in the presence ofstrong magnetically driven turbulence, and thus it is not trivialwhat kinds of nuclear/element abundances, which determinethe opacity and the heating rate, are realized in the ejecta. Thus,the study based on the NR simulations taking the effects ofmagnetohydrodynamics into account is crucial.
Moreover, as discussed in Nativi et al. (2020) and Klion et al.(2021), the interaction between the preceding ejecta and therelativistic jet launched from the central remnant black hole torussystem may also enhance the optical emission by blowing off theejected material with the first r-process peak elements including Yand Zr located in the polar region. For such a case, the collapse ofthe remnant NS to a black hole in a short timescale of ( ) 0.1 smight not be necessarily needed to interpret the observation ofAT2017gfo. In fact, some studies (e.g., Murguia-Berthier et al.2021) suggest that the post-merger mass ejection lasting for ∼1 scan be consistent with the afterglow emission observed inGW170817. Further systematic investigation based on the NRsimulations with the collapsing remnant NSs taking the effects ofmagnetohydrodynamics and relativistic jets into account is neededto get a deeper understanding of the event and to integrate theknowledge obtained by various aspects.
Finally, we discuss a possible non-LTE effect that can modifythe emission for t 1 day. In our radiative transfer simulation, weassume that LTE and the ionization state population of theatoms are determined by solving Saha’s equation (Lucy 2005;
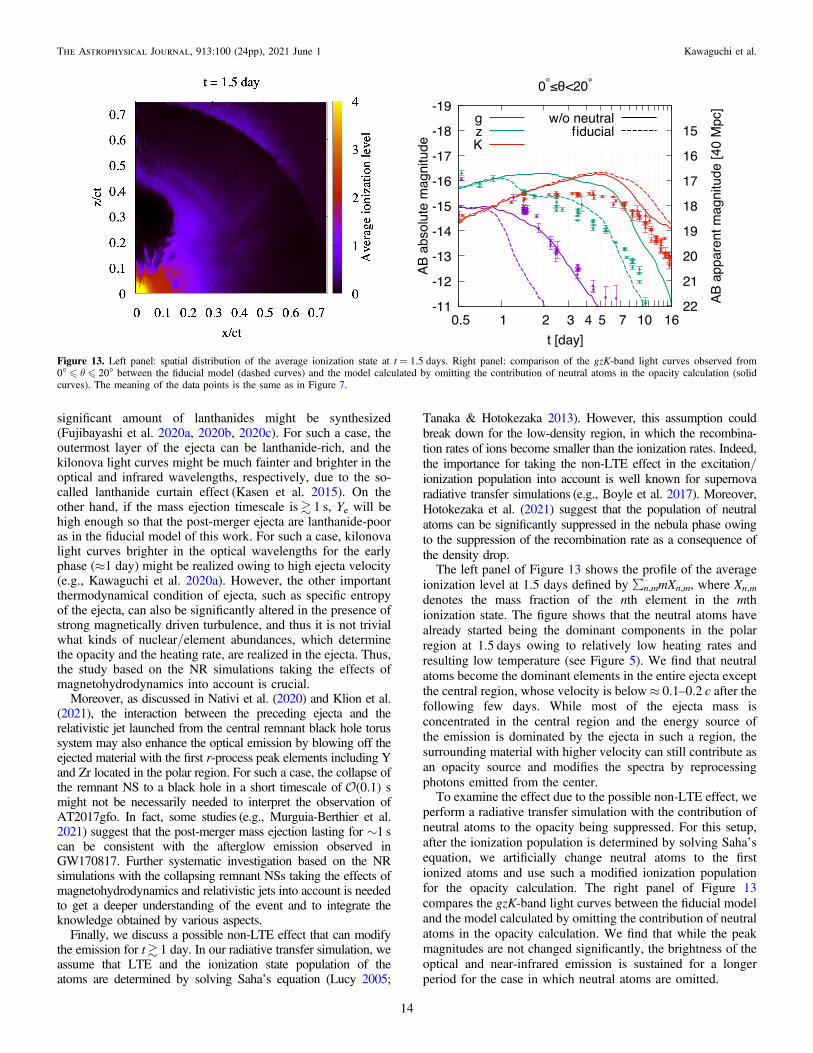
Tanaka & Hotokezaka 2013). However, this assumption couldbreak down for the low-density region, in which the recombina-tion rates of ions become smaller than the ionization rates. Indeed,the importance for taking the non-LTE effect in the excitation/ionization population into account is well known for supernovaradiative transfer simulations (e.g., Boyle et al. 2017). Moreover,Hotokezaka et al. (2021) suggest that the population of neutralatoms can be significantly suppressed in the nebula phase owingto the suppression of the recombination rate as a consequence ofthe density drop.The left panel of Figure 13 shows the profile of the average
ionization level at 1.5 days defined by ∑n,mmXn,m, where Xn,m
denotes the mass fraction of the nth element in the mthionization state. The figure shows that the neutral atoms havealready started being the dominant components in the polarregion at 1.5 days owing to relatively low heating rates andresulting low temperature (see Figure 5). We find that neutralatoms become the dominant elements in the entire ejecta exceptthe central region, whose velocity is below≈ 0.1–0.2 c after thefollowing few days. While most of the ejecta mass isconcentrated in the central region and the energy source ofthe emission is dominated by the ejecta in such a region, thesurrounding material with higher velocity can still contribute asan opacity source and modifies the spectra by reprocessingphotons emitted from the center.To examine the effect due to the possible non-LTE effect, we
perform a radiative transfer simulation with the contribution ofneutral atoms to the opacity being suppressed. For this setup,after the ionization population is determined by solving Saha’sequation, we artificially change neutral atoms to the firstionized atoms and use such a modified ionization populationfor the opacity calculation. The right panel of Figure 13compares the gzK-band light curves between the fiducial modeland the model calculated by omitting the contribution of neutralatoms in the opacity calculation. We find that while the peakmagnitudes are not changed significantly, the brightness of theoptical and near-infrared emission is sustained for a longerperiod for the case in which neutral atoms are omitted.
Figure 13. Left panel: spatial distribution of the average ionization state at t = 1.5 days. Right panel: comparison of the gzK-band light curves observed from0° � θ � 20° between the fiducial model (dashed curves) and the model calculated by omitting the contribution of neutral atoms in the opacity calculation (solidcurves). The meaning of the data points is the same as in Figure 7.
14
The Astrophysical Journal, 913:100 (24pp), 2021 June 1 Kawaguchi et al.

The enhancement in the optical emission found in the rightpanel of Figure 13 can be understood by the wavelengthdependence of the opacity. Figure 14 compares the opacity in(x/ct, z/ct)= (0.001, 0.4) at t= 2 days between the fiducial modeland the model calculated by omitting the contribution of neutralatoms. The ionized atoms are typically more transparent forphotons with long wavelengths than the neutral atoms (Gaigalaset al. 2019; Tanaka et al. 2020). Indeed, Figure 14 shows that, inthe absence of neutral atoms, the ejecta are less opaque forphotons with wavelengths above 5000Å (roughly the g band).
We note that the enhancement of the emission found in theright panel of Figure 13 could be overestimated since theneutral atoms are artificially omitted by hand. There is also apossibility that not only the population of the neutral atoms butalso the atoms in the higher ionization states can be modifiedby the non-LTE effects. To examine what kind of ionizationpopulation can be actually realized, and to quantify thedifference from the results assuming the thermal population,the implementation of non-LTE effects to the radiative transfercode is necessary. We leave this for future work.
5. Summary
In this work, we studied the long-term evolution of the ejectaformed in a BNS merger that results in a long-lived remnant NSby performing an HD simulation with the outflow data of an NRsimulation (Fujibayashi et al. 2020c) as the initial condition. Wefound that the ejected material exhibits a mildly prolate shape,while the ejecta with relatively high lanthanide mass fraction(0.01) show torus-like morphology. The increase of the ejectatemperature due to the interaction between ejecta componentsduring the late-time hydrodynamics evolution had only a smalleffect on the nucleosynthesis, which supports the robustness of theresulting element abundances obtained in the NR simulations. Onthe other hand, we showed that a fraction of the material countedas ejecta falls back to the central region and fails to escape fromthe system owing to the pressure from the preceding material.This indicates that feedback effects of the fallback material to the
NR simulations might need to be considered and investigated topredict the late-phase evolution of the system accurately (seeFernández et al. 2015, 2017 for black hole–NS mergers).We performed a radiative transfer simulation based on the
ejecta profile in the homologously expanding phase obtainedby our long-term HD simulation. We found that a large amountof total ejecta with low lanthanide fraction does not alwaysresult in the bright optical emission. Indeed, the opticalemission was not as bright as in AT2017gfo despite theinferred large amount of total ejecta mass and low lanthanidefraction of the ejecta. We showed that preferential diffusion ofphotons toward the equatorial direction due to the prolate ejectamorphology; large opacity contribution of Zr, Y, andlanthanides; and low specific heating rate of the ejecta is keyfor this light-curve property. This indicates that the progenitorof AT2017gfo is not likely to be a BNS merger that results in along-lived remnant NS by which a strong polar outflow isnecessarily driven. Our nontrivial findings increase theimportance of the realistic ejecta modeling by employing theNR simulation data for the kilonova light-curve prediction.Since Fujibayashi et al. (2020c) suggested that ejecta from
BNS mergers that result in long-lived remnant NSs will sharecommon properties, the resulting kilonova light curves fromsuch systems might show a similar property to what we foundin this work: kilonovae with relatively faint optical and brightinfrared emission. The future observation of a kilonova withsuch features could be a good indicator for the formation of along-lived remnant NS.We pointed out that the presence of a bright optical emission
in the kilonova might be the indicator for the collapse of themerger remnant NS to a black hole in a short timescale (∼0.1 s)after the onset of merger. Indeed, we showed that thesuppression of the high-velocity ejecta components in thepolar region will enhance the optical emission. However, it isnot clear that such an ejecta profile is indeed realized for thecase in which the remnant NS collapses to a black hole becausewe do not confirm the results of this type by NR simulations.We also note that there have been proposed alternative waysthat possibly realize the bright optical emission (see, e.g.,Arcavi 2018; Matsumoto et al. 2018; Piro & Kollmeier 2018;Klion et al. 2021; Nativi et al. 2020). Thus, further systematicinvestigation based on NR simulations is needed to obtain thedeeper understanding. The nucleosynthesis and resultantradioactive heating rates can also depend on the adoptednuclear ingredients such as the mass model (HFB-21 of Gorielyet al. 2010 in this study; see Fujibayashi et al. 2020c), aspointed out by, e.g., Wu et al. (2019) and Zhu et al. (2021).Furthermore, we also pointed out that more detailed physicalprocesses in radiative transfer, such as the non-LTE effect onthe ionization population, may also modify the results. Thisindicates that more detailed microphysics will be needed for theaccurate light-curve prediction.
We thank Smaranika Banerjee, Kenta Hotokezaka, WataruIshizaki, and Koutarou Kyutoku for valuable discussions.Numerical computation was performed on Cray XC40 at YukawaInstitute for Theoretical Physics, Kyoto University, and the Sakuracluster at Max Planck Institute for Gravitational Physics (AlbertEinstein Institute). This work was supported by Grant-in-Aid forScientific Research (JP16H02183, JP17H06361, JP15H02075,JP17H06363, JP18H05859, JP19H00694, JP20H00158) of JSPS
Figure 14. Comparison of the expansion opacity (Eastman & Pinto 1993;Kasen et al. 2006) of bound–bound transitions between the fiducial model (bluecurve) and the model calculated by omitting the contribution of neutral atoms(green curve). The opacity is calculated by employing the element abundancesin (x/ct, z/ct) = (0.001, 0.4) and by assuming 6 × 10⁻¹⁷ g cm−3 and 2300 K,which correspond to the condition at t = 2 days.
15
The Astrophysical Journal, 913:100 (24pp), 2021 June 1 Kawaguchi et al.

and by a post-K computer project (Priority issue No. 9) ofJapanese MEXT.
Appendix AFormulation
In this appendix, we describe the formulation of axisym-metric hydrodynamics equations in the spherical coordinatesemployed for the long-term evolution of ejecta. Throughoutthis appendix, the units of c= 1=G are employed, where G isthe gravitational constant, unless otherwise mentioned.
A.1. Basic Equations
The basic equations for the numerical hydrodynamicsemployed in this work are formulated in the framework of the3+ 1 decomposition of the spacetime (see, e.g., Shibata 2015). Inthe 3+ 1 form, the metric tensor gμν is decomposed as
( )( ) ( )
a
g b b
= = -
+ + +mn
m nds g dx dx dt
dx dt dx dt , A1iji i j j
2 2 2
where μ and ν denote the spacetime indices, i and j denote thespatial indices, and α, β i, and γij denote the lapse, shift, andspatial metric, respectively. We treat the material as a perfectfluid, and the energy–momentum tensor is given by
( )r= +mn m m mnT hu u Pg , A2
where ρ, h, uμ, and P denote the rest-mass density, specificenthalpy, four-velocity, and pressure, respectively. The equationsof energy–momentum conservation and the continuity equationare given by
( )g r =n mmn T u A3i i
( )r =n mmn
nnn T n u A4
( ) ( )r =mmu 0, A5
with the covariant derivative,∇μ.7 Here nν=−α∇νt, γμν= gμν+
nμnν, and is the specific heating rate of the radioactive heating.Equations (A3), (A4), and (A5) are rewritten in the forms
( )
( )a gd
a b a g ga
¶ + ¶ +
=- ¶ + ¶ - ¶ +
S S v P
S S Shw
S1
2, A6
t i k ik
ik
i k ik
jk ijk
i0
[ ( )]( )
g b
g a a g ar
¶ + ¶ + +
= - ¶ + +
S S v P v
S S K , A7
t kk k k
iji j ij
ij
0 0
*
( ) ( )r r¶ + ¶ =v 0, A8t kk
* *
respectively. Here Kij denotes the extrinsic curvature, and theother variables that newly appear in the above equations are
defined as follows:
⎜ ⎟⎛⎝
⎞⎠
( )
ˆ
ˆ
( )
g gr r g
ar r
r rr
r g
==== =
= = -
= +
=
w
w uS u hu
S e hwP
w
S hu u P
vu
u
det ,
,
,,
,
,
. A9
ij
t
i i i
ij i j ij
ii
t
0
*
* *
* *
A.1.1. Basic Equations in the Spherical Coordinates for theAxisymmetric System
In our calculation, the hydrodynamics equations are solvedin the fixed background and imposing the axisymmetry. Thebasic equations in the spherical coordinates are written as
( ˜ ) ( ˜ )( ˜ ) ( )
( )
( )
qr qrqr
¶ + 
r r v
r v
sin sin
sin 0, A10t r
r2 2* *
*
⎡⎣
⎤⎦
( ˜ ) [ ( ˜ ˜ )]( ˜ )
˜ ˜ ˜ ˜ ˜
˜ ( ˜ ˜ ) ˜
( )
( ) ( )( )
( )( )
( )( )
( )( )( )( )
( )( )
( )( )
( )
q q a g
q
q a b a g g
a ga
¶ + ¶ +
+ 
= - ¶ + ¶ - 
+ + + +
jj
r S r S v P
r S v
r S S S
rP
rS v S v
hwS
sin sin
sin
sin1
22 1
,
A11
t r r rr
r
r i ri
i j ri j
r
2 2
20
⎡⎣
⎤⎦
( ˜ )( ˜ ) [ ( ˜ ˜ )]
˜ ˜
˜ ˜ ˜
˜ ˜ ˜
( )
( )
( )( )
( )( )
( )( )
( )( )( )( )
( )( )
( )
q
q q a g
q a b
a g g
a g q qa
+ ¶ + ¶ +
= - ¶ + 
- 
+ + +
q
q q qq
q q
q
jj
q
r S
r S v r S v P
r Sr
Sr
Sr
rP
rS v
hwS
sin
sin sin
sin1 1
1
2
1
1cot
1cot ,
A12
t
rr
ii
i ji j
3
3 2
30
( ˜ ) ( ˜ )
( ˜ ) ˜ ( )( ) ( )
( )
( )( )
( )
q q
q qa
¶ + 
+ ¶ =
j j
q jq
j
r S r S v
r S v rhw
S
sin sin
sin sin , A13
t rr3 2 3 2
2 2 3 2
( ˜ ){ [ ˜ ˜ ( )]}{ [ ˜ ˜ ( )]}
[ ˜ ˜ ˜ ˜
˜ ] ( )
( ) ( ) ( )
( ) ( ) ( )
( )( )( ) ( ) ( )( )
( )( )
qq g b
q g b
q g a a gar
¶+ ¶ + +
+ ¶ + +
= - ¶ ++
qq q q
r S
r S v P v
r S v P v
r S S K
sin
sin
sin
sin
. A14
t
rr r r
i ji j i j
i j
20
20
0
2
*
7 We note that this treatment for the radioactive heating is not self-consistentbecause the total energy and momentum are not conserved with this. The self-consistent treatment of the radioactive heating requires an elaborated formalism(see Takahashi et. al. 2016 and Uchida et. al. 2017). However, our purpose foradding these heating terms is to demonstrate that the radioactive heating is notessential in the present study as shown in Section 2. Thus, we employ theseformulae for simplicity in this paper.
16
The Astrophysical Journal, 913:100 (24pp), 2021 June 1 Kawaguchi et al.

Here the definitions for the new variables are given as follows:
( )
˜˜
( )
˜
˜
˜ ˜ ˜
˜
( )( ) ( ) ( )
( )( ) ( ) ( )
( ) ( ) ( ) ( )
( ) ( ) ( )
( ) ( ) ( )
( ) ( ) ( )
( )( ) ( ) ( )
g g
q
gq
g
rqr
qb b b b b q b
q q q
= L L
= L L
L = L = L = L = ¹
=
=
= = == = =
= = =
= L L
jj
q q j j
q q j j
q q j j
A15
K K
r ri j
r
rv v v rv v r v
r r
Sr
S Sr
S Sr
S
S S
,
,
1,1
,1
sin, 0 ,
1
sin,
1
sin,
, , sin ,
, , sin ,1
sin,
1
sin,
1
sin,
.
i j ik
jl
kl
i j ik
jl
kl
rr
ij
r r
r r
r r
i j ik
jl
kl
2
2
2 3 3 2
* *
The indices without parentheses denote the tensor components withrespect to the coordinate basis. We note that, in the flat spacetime,the indices with parentheses ((i), i= r, θ, j) denote the tensorcomponents of the unit normal basis in the spherical coordinates.
For the case of a = 0, β( i)= 0, (̃ )( ) ( )( )g y d=i j i j4 , and ( )( ) =K i j
0, which hold for the nonrotating black hole spacetime in theisotropic coordinates, the equation of energy conservation can besimplified in the following form:
( ˜ ) [ ( ˜ ˜ )][ ( ˜ ˜ )] ˜ ( )
( ) ( )
( ) ( )
a q a q g
a q g a qr
¶ + ¶ +
+ ¶ + =qq q
r S r S v P v
r S v P v r
sin sin
sin sin . A16
t rr r2
02
0
02 2
*In this work, we solve the set of equations above by employinga Kurganov–Tadmor scheme (Kurganov & Tadmor 2000) witha piecewise parabolic reconstruction for the quantities of cellinterfaces and the minmod-like filter introduced in Kurganov &Tadmor (2000) for the flux limiter.
A.2. Test Problems
A.2.1. Point Explosion (Nonrelativistic Limit)
As the first test, we show that our code reproduces theanalytic solution for the nonrelativistic point explosion(Taylor 1941; Von Neumann 1941; Sedov 1946). We set thegas with uniform density of ρ0= 1 and inject E0= 1 of theinternal energy uniformly in the region of r� 1 (in arbitraryunits). We employ the ideal-gas EOS with the adiabatic indexof Γ= 5/3. The simulation is performed by employing the gridstructure described in Equation (15) with J= 500, =r 0min ,and =r 100max . Figure 15 shows the radial distribution of thedensity, velocity, and pressure at t= 20,000 and the location ofthe density maximum as a function of time with those obtainedby the exact solution (Taylor 1941; Von Neumann 1941; Sedov1946). We check that the L1 norm error between the conservedmass density of the simulation, ρ* (see Equation (A9)), and theexact solution, ρ*,exact, which we define by
≔∣ ∣
( )òò
r r
r
-I
d x
d x, A17
,exact3
,exact3
* *
*
is smaller than 2% and that the shock location agrees with theexact solution within 0.5% at t= 20,000.
A.2.2. Homologously Expanding Ejecta
As the second test problem, we inject the outflow profile of ahomologously expanding ejecta to the inner boundary toexamine whether our code can evolve the homologouslyexpanding phase appropriately. The outflow that corresponds tothe homologously expanding ejecta with the following densityprofile is employed:
Figure 15. Left panel: radial distribution of the density, velocity, and pressure at t = 20,000 for the nonrelativistic point explosion test problem (in arbitrary units).Those for the exact solution (Taylor 1941; Von Neumann 1941; Sedov 1946) are plotted with the dashed curves. Right panel: time evolution of the location of thedensity maximum for the simulation (blue solid) and the exact solution (green dashed).
⎧
⎨
⎪
⎩⎪
{ }{ }
( )( )( )
( )
( )
( )
( )[ ( )]
[ ( )]r q
r
r=
+
+
q p
q p
-
+ - -
+ - -
v
c v c
c v c,
0.01 0.025 0.3
0.01 0.01 0.025
0 else
. A18
v
c
v
c
0 0.025
3 0.99
1 exp 20 4
0 0.025
6 0.99
1 exp 20 4
17
The Astrophysical Journal, 913:100 (24pp), 2021 June 1 Kawaguchi et al.

The total mass is set to be≈ 7.4× 10⁻³ Me. For thisexamination, the ideal-gas EOS with the adiabatic index ofΓ= 4/3 is employed, and we switch off the effect of gravity bysetting the black hole mass to be 0. The same grid structure asin the fiducial HD simulation is employed for this test.
Figure 16 shows the rest-mass density profile, relativedifference of the rest-mass density profile from the exact solution,and relative difference of the radial velocity profile from thatassuming the homologous expansion obtained by the snapshot att= 0.1 days. We confirm that the ejecta profile keeps thehomologous feature for a sufficiently long period with reasonableaccuracy by checking that the L1 norm error between thesimulation result and the exact solution defined in Equation (A17)is≈ 3% and the deviation of the velocity from that for thehomologous expansion is less than 0.3% at t= 0.1 days.
A.2.3. Black Hole Torus
Finally, to examine whether the effect of gravity is taken intoaccount appropriately, we evolve the axisymmetric isentropicequilibrium state of a black hole torus system. The initialprofile is prepared in the same way as in Fujibayashi et al.(2020a, 2020b) with n= 1/7, but for the fixed nonrotatingblack hole background. The inner and outer edges of the torusare set to be 15MBH and 30MBH, respectively, and the totalmass of the torus is set to be 10−3MBH, with MBH being theblack hole mass. For this examination, the ideal-gas EOS withthe adiabatic index of Γ= 4/3 is employed. The following grid
structure is employed for the radial direction:
⎡⎣
⎤⎦
( )
( )
= --
+ = +r r rj
Jr j J
1, 1 1,
A19
j out in in
2
with J= 256, =r M10min BH, and =r M40max BH. For the θ-direction, 128 grids uniformly covering the angle from θ= π/3to π/2 are employed.Figure 17 shows the rest-mass density profiles of a black
hole torus simulation at the initial time and at the time of the200 orbital periods at the rest-mass density maximum. Exceptfor the small leak of the torus material into the atmosphere dueto the numerical diffusion, our code indeed keeps the profile ofthe stationary solution for a long period. The L1 norm error ofthe conserved mass density between the initial profile and thatat the time of the 200 orbital periods is smaller than ≈4%. Wealso check that the maximum rest-mass density always keepsthe original value within 1% during the simulation.
Appendix BEffect of the Truncation in the Outflow Injection
To investigate how the result depends on the method oftruncating the ejecta injection, we perform the HD simulationsin which the outflow injection from the inner boundary iscontinued even after the outflow data run out. Here the ejectaprofile at the end of the outflow data but with the density valuesuppressed by [ ( ) ]t- -t texp end is employed for extendedoutflow injection, where tend and τ are the end time of the
Figure 16. Left panel: rest-mass density profile of the homologously expanding ejecta obtained by the snapshot at t = 0.1 days. Middle panel: relative difference of therest-mass density profile from the exact solution at t = 0.1 days. Right panel: relative difference of the radial velocity profile from that assuming the homologousexpansion.
Figure 17. Rest-mass density profiles of a black hole torus simulation at the initial time (left panel) and at the time of the 200 orbital periods at the rest-mass densitymaximum (right panel).
18
The Astrophysical Journal, 913:100 (24pp), 2021 June 1 Kawaguchi et al.

outflow data and the timescale of extension, respectively. Thisprescription is justified by the fact that ejecta in the late phase(t> 5 s) indicate approximately the same property (Fujibayashiet al. 2020c). Note that the fiducial setup can be regarded as thecase of τ→ 0.
Figure 18 shows the late-time evolution of the total mass inthe computational domain for the fiducial setup and for thecases with τ= 2.5 s and τ= 5 s. The total outflow masscomputed from the mass flux on the inner boundary is 0.108,0.112, and 0.116 Me, respectively. Note that the total inputmass for τ= 5 s agrees approximately with the ejecta mass thatwas measured in the NR simulation including the bulkcomponent which had not yet escaped from the extractionradius at the end of the NR simulation (≈0.114Me; see Table 3in Fujibayashi et al. 2020c). Since the ejecta formation seemedto be terminated at the end of the NR simulation (see thedashed curve in the top left panel of Figure 5 in Fujibayashiet al. 2020c), we expect that the case of τ= 5 s mimics theoutflow data obtained by the NR simulation in which thecalculation is continued until the entire ejected material escapesfrom the extraction radius.
The mass in the computational domain only reaches 0.107,0.108, and 0.112 Me at the peaks for the fiducial model and forthe cases with τ= 2.5 s and τ= 5 s, respectively, and they aresmaller than the total mass computed from the mass flux on theinner boundary. This indicates that a fraction of the materialfalls back from r= rin even though the outflow injection iscontinued. The mass in the computational domain decreasesafter reaching the peak, and it converges to 0.096, 0.102, and
0.109 Me, respectively. A smaller fraction of the material fallsback for the case with a larger value of τ. This indicates that alarger amount of material in the bound orbits is accelerated forthe model with the outflow injection extended for a longertimescale. Nevertheless, the mass of the ejecta that reaches thehomologously expanding phase only varies by≈ 10%. More-over, as we show in the right panel of Figure 18, we find thatthe resulting kilonova light curves particularly for t� 6 days donot strongly depend on how long the outflow data are extended.This is because the material additionally injected by the outflowextension typically has a small value of velocity (0.05 c) andthe diffusion timescale of photons emitted from it is long(6 days).
Appendix CEffect of Heating in the Hydrodynamics Evolution
Figure 19 compares the gzK-band light curves between thefiducial ejecta model and the ejecta model calculated byomitting the heating source term in the HD simulation. Theemission for the ejecta model calculated by omitting theheating source term is slightly fainter than that for the fiducialmodel. This is due to the difference in the internal energyinitially set in the radiative transfer simulations taking over theresults of the HD simulations. Indeed, we confirm this bychecking that the light curves for the ejecta models obtained bythe HD simulation without the heating source term agreeapproximately with those for the fiducial model if the sameamount of internal energy is initially imposed.
Figure 18. Left panel: total mass in the computational domain as a function of time for the models with the extended outflow injection. The purple, green, and bluecurves denote the result for the models in which the outflow injection is truncated after the time at the end of the outflow data, extended by the timescale of τ = 2.5 s,and extended by τ = 5 s, respectively. The dotted curves denote the total input mass determined by the outflow data. The black dotted vertical line denotes the time atwhich the material injection from the inner boundary is terminated. Right panel: comparison of the gzK-band light curves between the fiducial ejecta model (solidcurves) and the ejecta model in which the outflow injection is extended by the timescale of τ = 2.5 s (dashed curves) and by τ = 5 s (dotted curves).
19
The Astrophysical Journal, 913:100 (24pp), 2021 June 1 Kawaguchi et al.

Appendix DEffect of Underestimating the Internal Energy
As is discussed in Section 2.2.2, the radioactive heating afterthe temperature drops below ≈6–7 GK is not taken intoaccount in the NR simulation, and the internal energy isunderestimated typically by≈ 40% at the time when thematerial reaches the extraction radius of the NR simulation.To check how this affects the results, we performed the HDsimulation and the radiative transfer simulation with the initialinternal energy of the HD simulation (at the time when thematerial reached r= rin) increased by 40%.
The left panel of Figure 20 shows the rest-mass densityprofile of the ejecta at t≈ 0.1 days for the HD simulation inwhich the injected internal energy is enhanced by 40%.
Comparing with Figure 4, the ejecta is slightly extended in thevelocity space owing to the acceleration induced by theincrease in the internal energy. Nevertheless, we find that theacceleration of the ejecta velocity due to the increase in theinternal energy is only within≈ 5%.The right panel of Figure 20 compares the gzK-band light
curves observed from 0°� θ� 20° between the fiducial ejectamodel and the ejecta model in which the injected internalenergy is enhanced by 40%. We find that the light curvesbetween these two models approximately agree with eachother. Note that the slight enhancement in the g-bandmagnitude for t� 1 day is due to the slightly extended densityprofile of the model with the enhanced internal energyinjection.
Figure 19. Comparison of the gzK-band light curves between the fiducial ejecta model (solid curves) and the ejecta model calculated by omitting the heating sourceterm for the HD simulation (dashed curves). The light curves observed from 0° � θ � 20° (left panel) and 86° � θ � 90° (right panel) are shown.
20
The Astrophysical Journal, 913:100 (24pp), 2021 June 1 Kawaguchi et al.

Appendix EHomologously Expanding Phase
To examine at which time the ejecta reach the homologouslyexpanding phase, we define
( )òò r
=ve d x
d x2 , E1ave
kin3
3*
( )òò r
=ve d x
d x2 , E2int
int3
3*
∣ ∣∣ ∣
( )( )( )òò
r
rá D ñ =
-v
w v r t d x
d x, E3r
r 3
3*
*
∣ ∣∣ ∣
( )( )( )ò
ò
r
rá ñ =q
q
vw v d x
d x, E4
3
3*
*
∣ ∣∣ ∣
( )( )( )ò
ò
r
rá ñ =j
j
vw v d x
d x, E5
3
3*
*and compare the time evolution of these quantities inFigure 21. Here ( )r= -e w 1kin *
and ( ˆ )r= -e e wint *
denote the kinetic and internal energy density, respectively,and vave, vint, ∣ ∣( )á D ñv r , ∣ ∣( )á ñqv , and ∣ ∣( )á ñjv denote the rmsvelocity calculated from the total kinetic energy, characteristicvelocity calculated from the total internal energy, mass-averaged deviation of the radial velocity from that assumingthe homologous expansion, mass-averaged absolute valueof the latitudinal velocity, and mass-averaged absolute valueof the longitudinal velocity of ejecta, respectively. In thehomologously expanding phase, we expect that vint, ∣ ∣( )á D ñv r ,∣ ∣( )á ñqv , and ∣ ∣( )á ñjv are smaller than vave. Indeed, Figure 21shows that such a condition is satisfied for t 1000 s sincevave is larger than other values by more than an order ofmagnitude.Figure 22 shows the 2D profiles for the ratio of the internal
energy density to the kinetic energy density (left panel) and therelative difference of the radial velocity from that in thehomologous phase (right panel) at t≈ 0.1 days. The internalenergy density is much smaller than the kinetic energy density,by more than orders of magnitude, and the deviation of theradial velocity distribution from that assuming the homologousexpansion is also smaller than≈ 1% for the entire ejecta. Thus,we can safely consider that the ejecta are in the homologouslyexpanding phase at t= 0.1 days.
Figure 20. Left panel: rest-mass density profile of the ejecta at t ≈ 0.1 days for the HD simulation in which the injected internal energy is enhanced by 40%. Thedashed curves denote the ejecta that escape from the extraction radius of the NR simulation at t = 0.02, 0.1, 1, and 5 s. Right panel: comparison of the gzK-band lightcurves observed from 0° � θ � 20° between the fiducial ejecta model (dashed curves) and the ejecta model in which the injected internal energy is enhanced by 40%(solid curves).
21
The Astrophysical Journal, 913:100 (24pp), 2021 June 1 Kawaguchi et al.

Appendix FHigher-viscosity Model
The left panel of Figure 23 shows the time evolution of thetotal mass in the computational domain for the modelemploying the outflow data of the NR simulation with a largeviscous parameter (“DD2-125M-h” in Fujibayashi et al.2020c). The total input mass calculated from the mass flux ofthe outflow data is also shown in the figure. For the higher-viscosity model, the outflow data run out at t≈ 1.7 s. We notethat≈ 0.05Me of ejecta still remained inside the extractionradius of the NR simulation (=8000 km) at the end of the NRsimulation.
As is the case for the fiducial model, the total mass in thecomputational domain agrees with the total input masscalculated from the mass flux of the outflow data until thesimulation time reaches the end of the outflow data. Twodistinct mass ejection phases are seen: one found in the earlyphase (tin 0.4 s), and the other found in the late phase
(tin 0.4 s). Due to the larger viscous parameter (αvis= 0.10),the mass ejection occurs in a shorter timescale than for thefiducial model (αvis= 0.04). After the simulation time reachesthe end of the outflow data, the total ejecta mass in thecomputational domain starts to decrease, and it convergesto≈ 0.15Me for t� 100 s owing to the vanishing pressuresupport from the inner boundary. The mass of the material inthe unbound trajectory reaches the peak at the time when theoutflow data run out and slightly decreases subsequently. Thissubsequent decrease indicates the deceleration of the materialdue to the pressure from the preceding ejecta.The right panel of Figure 23 shows the rest-mass density
profile of the ejecta obtained by the HD simulation att≈ 0.1 days. Due to the larger viscous parameter, the ejectaare more extended to higher velocity than the fiducial model,and the early-time ejecta component (tin 0.4 s) exhibits amildly oblate shape. The late-time ejecta component (tin0.4 s) shows approximately a prolate morphology as is the casefor the fiducial model.
Figure 21. Comparison of vave, vint, ∣ ∣( )á D ñv r , ∣ ∣( )á ñqv , and ∣ ∣( )á ñjv (see the main text for their definitions). The black dotted vertical line denotes the time at which thematerial injection from the inner boundary is truncated.
Figure 22. Left panel: ratio of the internal energy density to the kinetic energy density at t ≈ 0.1 days. Right panel: relative difference of the radial velocity from thatin the homologous phase at t ≈ 0.1 days.
22
The Astrophysical Journal, 913:100 (24pp), 2021 June 1 Kawaguchi et al.

ORCID iDs
Kyohei Kawaguchi https://orcid.org/0000-0003-4443-6984Sho Fujibayashi https://orcid.org/0000-0001-6467-4969Masaru Shibata https://orcid.org/0000-0002-4979-5671Masaomi Tanaka https://orcid.org/0000-0001-8253-6850Shinya Wanajo https://orcid.org/0000-0002-4759-7794
References
Aasi, J., Abbott, B. P., Abbott, T., et al. 2015, CQGra, 32, 074001Acernese, F., Agathos, M., Agatsuma, K., et al. 2015, CQGra, 32, 024001Ackley, K., Amati, L., Barbieri, C., et al. 2020, A&A, 643, A113Anand, S., Coughlin, M. W., Kasliwal, M. M., et al. 2021, NatAs, 387, 38Andreoni, I., Ackley, K., Cooke, J., et al. 2017, PASA, 34, e069Andreoni, I., Goldstein, D. A., Kasliwal, M. M., et al. 2020, ApJ, 890, 131Arcavi, I. 2018, ApJL, 855, L23Arcavi, I., Hosseinzadeh, G., Howell, D. A., et al. 2017, Natur, 551, 64Arnowitt, R., Deser, S., & Misner, C. 1960, PhRv, 118, 1100Balbus, S. A., & Hawley, J. F. 1998, RvMP, 70, 1Banerjee, S., Tanaka, M., Kawaguchi, K., Kato, D., & Gaigalas, G. 2020, ApJ,
901, 29Banik, S., Hempel, M., & Bandyopadhyay, D. 2014, ApJS, 214, 22Barnes, J., Kasen, D., Wu, M.-R., & Martínez-Pinedo, G. 2016, ApJ, 829, 110Barnes, J., Zhu, Y., Lund, K., et al. 2020, arXiv:2010.11182Bauswein, A., Goriely, S., & Janka, H. T. 2013, ApJ, 773, 78Bernuzzi, S., Breschi, M., Daszuta, B., et al. 2020, MNRAS, 497, 1488Blinnikov, S. I., Novikov, I. D., Perevodchikova, T. V., & Polnarev, A. G.
1984, SvAL, 10, 177Bovard, L., Martin, D., Guercilena, F., et al. 2017, PhRvD, 96, 124005Boyle, A., Sim, S. A., Hachinger, S., & Kerzendorf, W. 2017, A&A, 599,
A46Bulla, M. 2019, MNRAS, 489, 5037Bulla, M., Kyutoku, K., Tanaka, M., et al. 2021, MNRAS, 501, 1891Carrasco, F., & Shibata, M. 2020, PhRvD, 101, 063017Christie, I. M., Lalakos, A., Tchekhovskoy, A., et al. 2019, MNRAS,
490, 4811Ciolfi, R., & Kalinani, J. V. 2020, ApJL, 900, L35Coughlin, M. W., Dietrich, T., Antier, S., et al. 2020a, MNRAS, 492, 863Coughlin, M. W., Dietrich, T., Antier, S., et al. 2020b, MNRAS, 497, 1181Coughlin, M. W., Dietrich, T., Margalit, B., & Metzger, B. D. 2019, MNRAS,
489, L91Coulter, D. A., Foley, R. J., Kilpatrick, C. D., et al. 2017, Sci, 358, 1556Cowan, J. J., Sneden, C., Lawler, J. E., et al. 2021, RvMP, 93, 15002Cowperthwaite, P. S., Berger, E., Villar, V. A., et al. 2017, ApJL, 848, L17Darbha, S., & Kasen, D. 2020, ApJ, 897, 150
Dessart, L., Ott, C., Burrows, A., Rosswog, S., & Livne, E. 2009, ApJ,690, 1681
Díaz, M. C., Macri, L. M., Garcia Lambas, D., et al. 2017, ApJL, 848, L29Dietrich, T., & Ujevic, M. 2017, CQGra, 34, 105014Dietrich, T., Ujevic, M., Tichy, W., Bernuzzi, S., & Bruegmann, B. 2017,
PhRvD, 95, 024029Drout, M. R., Piro, A. L., Shappee, B. J., et al. 2017, Sci, 358, 1570Eastman, R. G., & Pinto, P. A. 1993, ApJ, 412, 731Eichler, D., Livio, M., Piran, T., & Schramm, D. N. 1989, Natur, 340, 126Evans, P. A., Cenko, S. B., Kennea, J. A., et al. 2017, Sci, 358, 1565Fernández, R., Foucart, F., Kasen, D., et al. 2017, CQGra, 34, 154001Fernández, R., Quataert, E., Schwab, J., Kasen, D., & Rosswog, S. 2015,
MNRAS, 449, 390Fernández, R., Tchekhovskoy, A., Quataert, E., Foucart, F., & Kasen, D. 2019,
MNRAS, 482, 3373Fontes, C. J., Fryer, C. L., Hungerford, A. L., Wollaeger, R. T., & Korobkin, O.
2020, MNRAS, 493, 4143Freiburghaus, C., Rosswog, S., & Thielemann, F. K. 1999, ApJL, 525, L121Friend, D. B., & Castor, J. I. 1983, ApJ, 272, 259Fujibayashi, S., Kiuchi, K., Nishimura, N., Sekiguchi, Y., & Shibata, M. 2018,
ApJ, 860, 64Fujibayashi, S., Shibata, M., Wanajo, S., et al. 2020a, PhRvD, 101, 083029Fujibayashi, S., Shibata, M., Wanajo, S., et al. 2020b, PhRvD, 102, 123014Fujibayashi, S., Wanajo, S., Kiuchi, K., et al. 2020c, ApJ, 901, 122Gaigalas, G., Kato, D., Rynkun, P., Radziute, L., & Tanaka, M. 2019, ApJS,
240, 29Goriely, S., Chamel, N., & Pearson, J. M. 2010, PhRvC, 82, 035804Grossman, D., Korobkin, O., Rosswog, S., & Piran, T. 2014, MNRAS,
439, 757Hotokezaka, K., Kiuchi, K., Kyutoku, K., et al. 2013, PhRvD, 87, 024001Hotokezaka, K., & Nakar, E. 2020, ApJ, 891, 152Hotokezaka, K., & Piran, T. 2015, MNRAS, 450, 1430Hotokezaka, K., Tanaka, M., Kato, D., & Gaigalas, G. 2021, arXiv:2102.07879Hu, L., Wu, X., Andreoni, I., et al. 2017, SciBu, 62, 1433Just, O., Bauswein, A., Pulpillo, R. A., Goriely, S., & Janka, H. T. 2015,
MNRAS, 448, 541Kasen, D., Badnell, N. R., & Barnes, J. 2013, ApJ, 774, 25Kasen, D., Fernandez, R., & Metzger, B. 2015, MNRAS, 450, 1777Kasen, D., Metzger, B., Barnes, J., Quataert, E., & Ramirez-Ruiz, E. 2017,
Natur, 551, 80Kasen, D., Thomas, R. C., & Nugent, P. 2006, ApJ, 651, 366Kasliwal, M. M., Nakar, E., Singer, L. P., et al. 2017, Sci, 358, 1559Kastaun, W., & Galeazzi, F. 2015, PhRvD, 91, 064027Kawaguchi, K., Shibata, M., & Tanaka, M. 2018, ApJL, 865, L21Kawaguchi, K., Shibata, M., & Tanaka, M. 2020a, ApJ, 889, 171Kawaguchi, K., Shibata, M., & Tanaka, M. 2020b, ApJ, 893, 153Kiuchi, K., Kyutoku, K., Sekiguchi, Y., & Shibata, M. 2018, PhRvD, 97,
124039
Figure 23. Left panel: same as Figure 1, but for the ejecta model employing the outflow data of the NR simulation with a large viscous parameter (α = 0.10). Theblack dotted vertical line denotes the time at which the material injection from the inner boundary is terminated. Right panel: same as the top panel of Figure 4, but forthe ejecta model employing the outflow data of the NR simulation with a large viscous parameter. The dashed curves denote the ejecta that escape from the extractionradius of the NR simulation at t = 0.02, 0.1, 0.4, and 1 s.
23
The Astrophysical Journal, 913:100 (24pp), 2021 June 1 Kawaguchi et al.

Klion, H., Duffell, P. C., Kasen, D., & Quataert, E. 2021, MNRAS, 502, 865Korobkin, O., Wollaeger, R. T., Fryer, C. L., et al. 2021, ApJ, 910, 116Krüger, C. J., & Foucart, F. 2020, PhRvD, 101, 103002Kulkarni, S. R. 2005, arXiv:astro-ph/0510256Kurganov, A., & Tadmor, E. 2000, JCoPh, 160, 241Kuroda, K. 2010, CQGra, 27, 084004Kurucz, R. L., & Bell, B. 1995, Atomic Line List (Cambridge, MA:
Smithsonian Astrophysical Observatory)Kyutoku, K., Fujibayashi, S., Hayashi, K., et al. 2020, ApJL, 890, L4Kyutoku, K., Ioka, K., Okawa, H., Shibata, M., & Taniguchi, K. 2015, PhRvD,
92, 044028Landau, L. D., & Lifshitz, E. M. 1975, The Classical Theory of Fields (Oxford:
Pergamon Press)Lattimer, J. M., & Schramm, D. N. 1974, ApJL, 192, L145Li, L.-X., & Paczynski, B. 1998, ApJL, 507, L59Lippuner, J., Fernández, R., Roberts, L. F., et al. 2017, MNRAS, 472, 904Lipunov, V. M., Gorbovskoy, E., Kornilov, V. G., et al. 2017, ApJL, 850, L1Lucy, L. B. 2005, A&A, 429, 19Matsumoto, T., Ioka, K., Kisaka, S., & Nakar, E. 2018, ApJ, 861, 55Metzger, B., & Berger, E. 2012, ApJ, 746, 48Metzger, B. D., & Fernández, R. 2014, MNRAS, 441, 3444Metzger, B. D., Martinez-Pinedo, G., Darbha, S., et al. 2010, MNRAS,
406, 2650Mösta, P., Radice, D., Haas, R., Schnetter, E., & Bernuzzi, S. 2020, ApJL,
901, L37Murguia-Berthier, A., Ramirez-Ruiz, E., De Colle, F., et al. 2021, ApJ,
908, 152Nativi, L., Bulla, M., Rosswog, S., et al. 2020, MNRAS, 500, 1772Nedora, V., Bernuzzi, S., Radice, D., et al. 2021, ApJ, 906, 98Nedora, V., Schianchi, F., Bernuzzi, S., et al. 2020, arXiv:2011.11110Nissanke, S., Kasliwal, M., & Georgieva, A. 2013, ApJ, 767, 124Paczynski, B. 1986, ApJL, 308, L43Perego, A., Bernuzzi, S., & Radice, D. 2019, EPJA, 55, 124Perego, A., Radice, D., & Bernuzzi, S. 2017, ApJL, 850, L37Perego, A., Rosswog, S., Cabezón, R. M., et al. 2014, MNRAS, 443, 3134Pian, E., D’Avanzo, P., Benetti, S., et al. 2017, Natur, 551, 67Piro, A. L., & Kollmeier, J. A. 2018, ApJ, 855, 103Pozanenko, A., Barkov, M. V., Minaev, P. Y., et al. 2018, ApJL, 852, L30Prantzos, N., Abia, C., Cristallo, S., Limongi, M., & Chieffi, A. 2020,
MNRAS, 491, 1832Price, D., & Rosswog, S. 2006, Sci, 312, 719Radice, D., Galeazzi, F., Lippuner, J., et al. 2016, MNRAS, 460, 3255Radice, D., Perego, A., Hotokezaka, K., et al. 2018, ApJ, 869, 130Rosswog, S., Korobkin, O., Arcones, A., Thielemann, F., & Piran, T. 2014,
MNRAS, 439, 744Rosswog, S., Liebendoerfer, M., Thielemann, F. K., et al. 1999, A&A,
341, 499Rosswog, S., Sollerman, J., Feindt, U., et al. 2018, A&A, 615, A132
Ruffert, M., Ruffert, H. T., & Janka, H. T. 2001, A&A, 380, 544Ruiz, M., Shapiro, S. L., & Tsokaros, A. 2018, PhRvD, 98, 123017Sedov, L. I. 1946, JApMM, 10, 241Sekiguchi, Y., Kiuchi, K., Kyutoku, K., & Shibata, M. 2015, PhRvD, 91,
064059Sekiguchi, Y., Kiuchi, K., Kyutoku, K., Shibata, M., & Taniguchi, K. 2016,
PhRvD, 93, 124046Shibata, M. 2015, Numerical Relativity (Singapore: World Scientific), doi:10.
1142/9692Shibata, M., Fujibayashi, S., Hotokezaka, K., et al. 2017, PhRvD, 96, 123012Shibata, M., Fujibayashi, S., & Sekiguchi, Y. 2021, PhRvD, 103, 043022Shibata, M., & Hotokezaka, K. 2019, ARNPS, 69, 41Siegel, D. M., & Metzger, B. D. 2017, PhRvL, 119, 231102Siegel, D. M., & Metzger, B. D. 2018, ApJ, 858, 52Smartt, S. J., Chen, T.-W., Jerkstrand, A., et al. 2017, Natur, 551, 75Steiner, A. W., Hempel, M., & Fischer, T. 2013, ApJ, 774, 17Stovall, K., Freore, P. C. C., Chatterjee, S., et al. 2018, ApJL, 854, L22Takahashi, K., Yoshida, T., Umeda, H., Sumiyoshi, K., & Yamada, S. 2016,
MNRAS, 456, 1320Tanaka, M., & Hotokezaka, K. 2013, ApJ, 775, 113Tanaka, M., Hotokezaka, K., Kyutoku, K., et al. 2014, ApJ, 780, 31Tanaka, M., Kato, D., Gaigalas, G., et al. 2018, ApJ, 852, 109Tanaka, M., Kato, D., Gaigalas, G., & Kawaguchi, K. 2020, MNRAS,
496, 1369Tanaka, M., Utsumi, Y., Mazzali, P. A., et al. 2017, PASJ, 69, 102Tanvir, N. R., Levan, A. J., González-Fernández, C., et al. 2017, ApJL,
848, L27Taylor, G. 1941, British Report RC-210Troja, E., Piro, L., van Eerten, H., et al. 2017, Natur, 551, 71Uchida, H., Shibata, M., Yoshida, T., Sekiguchi, Y., & Umeda, H. 2017,
PhysRevD, 96, 083016Utsumi, Y., Tanaka, M., Tominaga, N., et al. 2017, PASJ, 69, 101Valenti, S., Sand, D. J., Yang, S., et al. 2017, ApJL, 848, L24Villar, V. A., Guillochon, J., Berger, E., et al. 2017, ApJL, 851, L21Vincent, T., Foucart, F., Duez, M. D., et al. 2020, PhRvD, 101, 044053Von Neumann, J. 1941, Bethe [Bet47], 13Wanajo, S. 2018, ApJ, 868, 65Wanajo, S., Sekiguchi, Y., Nishimura, N., et al. 2014, ApJL, 789, L39Watson, D., Hansen, C. J., Selsing, J., et al. 2019, Natur, 574, 497Waxman, E., Ofek, E. O., Kushnir, D., & Gal-Yam, A. 2018, MNRAS,
481, 3423Wollaeger, R. T., Korobkin, O., Fontes, C. J., et al. 2018, MNRAS, 478, 3298Wu, M.-R., Barnes, J., Martinez-Pinedo, G., & Metzger, B. D. 2019, PhRvL,
122, 062701Wu, M.-R., Fernández, R., Martínez-Pinedo, G., & Metzger, B. D. 2016,
MNRAS, 463, 2323Zhu, J.-P., Yang, Y.-P., Liu, L.-D., et al. 2020, ApJ, 897, 20Zhu, Y. L., Lund, K., Barnes, J., et al. 2021, ApJ, 906, 94
24
The Astrophysical Journal, 913:100 (24pp), 2021 June 1 Kawaguchi et al.