a literature review - green logistics 1 - transport management a literature review heriot-watt...
TRANSCRIPT
- 1 -
TRANSPORT MANAGEMENT
A Literature Review
Heriot-Watt University January 2007
Green Logistics Project Work Module 1
- 2 -
ABSTRACT Purpose The purpose of this paper is to review literature relating to vehicle utilisation, transport optimisation and the implementation of ‘green’ transport management measures within the freight industry with a view to minimise the negative impact of road freight transport on the environment. Design/Methodology/Approach This report first reviews the key constraints on vehicle utilisation, before examining opportunities to optimise transport operations. Within the remit of this report, three key areas for improved efficiencies within the industry are identified: logistical efficiency, vehicle utilisation and driver training and behaviour. Search terms: green logistics; transport management; vehicle utilisation; transport optimisation. Findings Environmental issues will increasingly influence the way transport managers do their jobs. Currently, there is a growing field of governmental literature offering advice and guidance. Research Limitations/implications The scope of this review is limited by the availability of literature and time. As a broad study, it does not present the full range of literature on the state of green transport management, but attempts to give an overview of the main concerns and areas for improvement. The text and case studies are illustrative of the previous work done in this field. Practical implications This report highlights limitations faced by transport managers in attempting to operate vehicles efficiently and draws together environmentally-related literature that offers guidance to transport managers. Originality/value As a literature review it aims to synthesise previous work rather than develop new perspectives. It should provide a foundation for future research in this field.

- 3 -
CONTENTS
ABSTRACT ....................................................................................................... - 2 - CONTENTS....................................................................................................... - 3 - TABLES............................................................................................................. - 5 - FIGURES........................................................................................................... - 5 - 1. INTRODUCTION .......................................................................................... - 6 - 2. KEY PERFORMANCE INDICATORS & ISSUES: Measuring vehicle utilisation & efficiency ........................................................................................................ - 7 -
2.1 Measures applicable to both macro- and micro-level data ...................... - 7 - 2.1.1 Tonne-kilometres per vehicle per annum (tkm) ................................ - 7 - 2.1.2 Weight-based loading factor............................................................. - 7 - 2.1.3 Empty running .................................................................................. - 8 - 2.1.4 Lading factor................................................................................... - 10 -
2.2 Measures applicable to micro-level data ............................................... - 11 - 2.2.1 Space-utilisation / vehicle fill........................................................... - 11 - 2.2.2 Productive time............................................................................... - 12 - 2.2.3 Efficiency of vehicle usage (tkm/mkm) ........................................... - 13 - 2.2.4 Overall Vehicle Effectiveness (OVE) .............................................. - 13 -
3. KEY CONSTRAINTS / ISSUES FOR VEHICLE UTILISATION.................. - 14 - 3.1 Sourcing, distribution and delivery ........................................................ - 14 -
3.1.1 Demand fluctuations....................................................................... - 14 - 3.1.2 Just-in-Time (JIT) delivery .............................................................. - 15 - 3.1.3 Postponement ................................................................................ - 16 - 3.1.4 E-commerce and the growth of home delivery ............................... - 17 - 3.1.5 Priority given to the outbound delivery service ............................... - 17 - 3.1.6 Unreliability of delivery schedules: congestion .............................. - 18 -
3.2 Unitisation: unit loads ............................................................................ - 19 - 3.2.1 Vehicle size and weight restrictions................................................ - 19 - 3.2.2 Incompatibility of vehicles and products: procurement ................... - 19 - 3.2.3 Warehouse configuration and interface interactions....................... - 20 - 3.2.4 Handling and packaging requirements ........................................... - 21 -
3.3 Industry pressures................................................................................. - 23 - 3.3.1 Lack of support from Senior Managers........................................... - 23 - 3.3.2 Government regulations: ................................................................ - 23 -
4. POTENTIAL EFFICIENCY IMPROVEMENTS IN THE FREIGHT INDUSTRY: LOGISTICAL EFFICIENCY ............................................................................. - 25 -
4.1 Sourcing, distribution and delivery ........................................................ - 25 - 4.1.1 Local sourcing ................................................................................ - 25 - 4.1.2 Backloading................................................................................... - 26 - 4.1.3 Postponement ................................................................................ - 27 - 4.1.4 More transport-efficient order and sales cycles .............................. - 27 - 4.1.4 Unattended delivery........................................................................ - 28 - 4.1.5 Telematics ...................................................................................... - 29 -
4.2 Collaboration & relationships ................................................................ - 29 - 4.2.1 Use of primary consolidation centres.............................................. - 29 - 4.2.2 Data sharing: collaboration & network sharing ............................... - 30 -

- 4 -
4.2.3 Reverse Logistics ........................................................................... - 30 - 4.3 Efficient unit loading .............................................................................. - 31 -
4.3.1 Packaging....................................................................................... - 31 - 4.4 Enhanced status of transport managers within the supply chain .......... - 32 -
5. POTENTIAL EFFICIENCY IMPROVEMENTS: VEHICLE EFFICIENCY... - 33 - 5.1 Fuel consumption.................................................................................. - 33 -
5.1.1 Alternative Fuels............................................................................. - 33 - 5.1.2 Driver Efficiency.............................................................................. - 34 -
5.2 Aerodynamic features ........................................................................... - 36 - 5.2.1 Rolling Resistance.......................................................................... - 36 - 5.2.2 Aerodynamic Styling....................................................................... - 37 -
5.3 Vehicle design....................................................................................... - 39 - 5.3.1 Enhanced capacity within current EU regulations: Double-deckers (DD) - 39 - 5.4.2 Increasing permitted EU weights & dimensions: Longer, heavier vehicles .................................................................................................... - 41 -
6. CONCLUSIONS & KEY OUTSTANDING ISSUES..................................... - 44 - REFERENCES ................................................................................................ - 45 -

- 5 -
TABLES & FIGURES
TABLES 1. Percentage empty running ………………….………………………………… - 8 - 2. Lading factor by vehicle type in 2005 ………………………………………....- 10 - 3. Summary of KPI findings for the Freight Best Practice Programme ……... - 14 - 4. Emissions (per vehicle km) in urban areas ………………………………..…- 20 - 5. Calculation of weight utilisation for different tertiary types ………………… - 22 - 6. Comparative LHV characteristics for Robinson’s & Denby’s rig …..……… - 42 -
FIGURES 1. Weekly demand pattern for one of the major UK-based producers ….…..- 15 -

- 6 -
1. INTRODUCTION Offering the greatest flexibility in terms of timings and destinations compared with
other modes, road transport dominants freight distribution in the UK (64.4% of all
goods transported (tonne-kms) in 2005 was carried by road) (Department for
Transport, 2006a). In moving this amount of freight by road, companies use 11
billion litres of fuel and produce 28 million tonnes of CO2 each year (Freight
Transport Association, 2003), or approximately 5% of total CO2 emissions in the
UK (McKinnon, 2007). Aside from the direct negative effects of greenhouse-gas
emissions, freight traffic contributes to increased noise levels, congestion and
accidents. Current forecasts suggest that the number of truck-kms will increase
by 10-11% between 2000 and 2010 (Department for Transport, 2006a).
It is against this backdrop of projected growth and associated environmental
impacts that the government has set objectives for improving environmental
performance of freight transport by improving vehicle efficiency, minimising
congestion, making better use of road infrastructure and reducing greenhouse gas
emissions (Department for the Environment, Transport and the Regions, 1999a).
Within this context, the European Commission highlights five main approaches to
the adoption of environmental concerns in freight transport (European
Commission, 2001).
1. Reducing the impact of freight through cleaner, alternative fuels and
improved truck design;
2. Driver training and behaviour;
3. Improving vehicle utilisation by increasing load factors, utilising new
information technology, improving routing and collaboration between
companies;
4. Switching to more environmentally-friendly modes; &
5. City logistics.

- 7 -
This report considers the first three EC approaches, and will examine the
optimisation of transport, the utilisation of vehicles and associated transport
management decisions. The rest of this report is organised as follows: Section 2
outlines key performance measures associated with vehicle utilisation; Section 3
highlights constraints on the optimisation of freight transport; Sections 4-5
considers various efficiency measures aimed at either reducing fuel consumption
or maximising vehicle use and Section 6 draws conclusions and makes
suggestions for future research.
2. KEY PERFORMANCE INDICATORS & ISSUES: Measuring vehicle utilisation & efficiency In order to understand the issue of vehicle utilisation, it is first necessary to
understand how such utilisation can be measured. There are various indices that
can be used to calculate the utilisation of vehicle fleet, each giving a different
impression of transport efficiency.
2.1 Measures applicable to both macro- and micro-level data
2.1.1 Tonne-kilometres per vehicle per annum (tkm)
This main indicator of freight demand is essentially a productivity indicator, and as
such, generally presents the trucking industry in a favourable light. Over the last
half century average annual amounts of work undertaken by trucks has increased
five-fold, mainly as a result of hauliers taking advantage of increases in maximum
truck weight and vehicles being used for more hours in the day (McKinnon, 2007).
Since the late 1990s this metric has levelled off for the UK lorry fleet (Department
for Transport, 2006b). A limitation of this indicator is that no account is taken of the
utilisation of vehicle carrying capacity (Léonardi & Baumgartner, 2004).
2.1.2 Weight-based loading factor
This measure is generally expressed as the ratio of the actual weight of goods to
the maximum weight that could have been carried on a laden trip. It gives a less-
favourable impression of the industry as average load factors have declined in
- 8 -
this country from 63% in 1990 to 57% in 2005 (Department for Transport, 2006a).
Again, a limitation of this ratio is that being exclusively weight-based, this ratio can
only be described as a partial measure. The use of vehicle space / deck area
should be considered to give a more realistic assessment.
2.1.3 Empty running
Transport managers have to make quite difficult decisions regarding the loading of
vehicles, owing to the almost exclusively one-directional movement of freight
consignments from point of production to point of consumption. The challenge in
the freight industry is to find backloads for returning vehicles, by making use of
spare capacity on the return leg of a delivery journey (McKinnon & Ge, 2006).
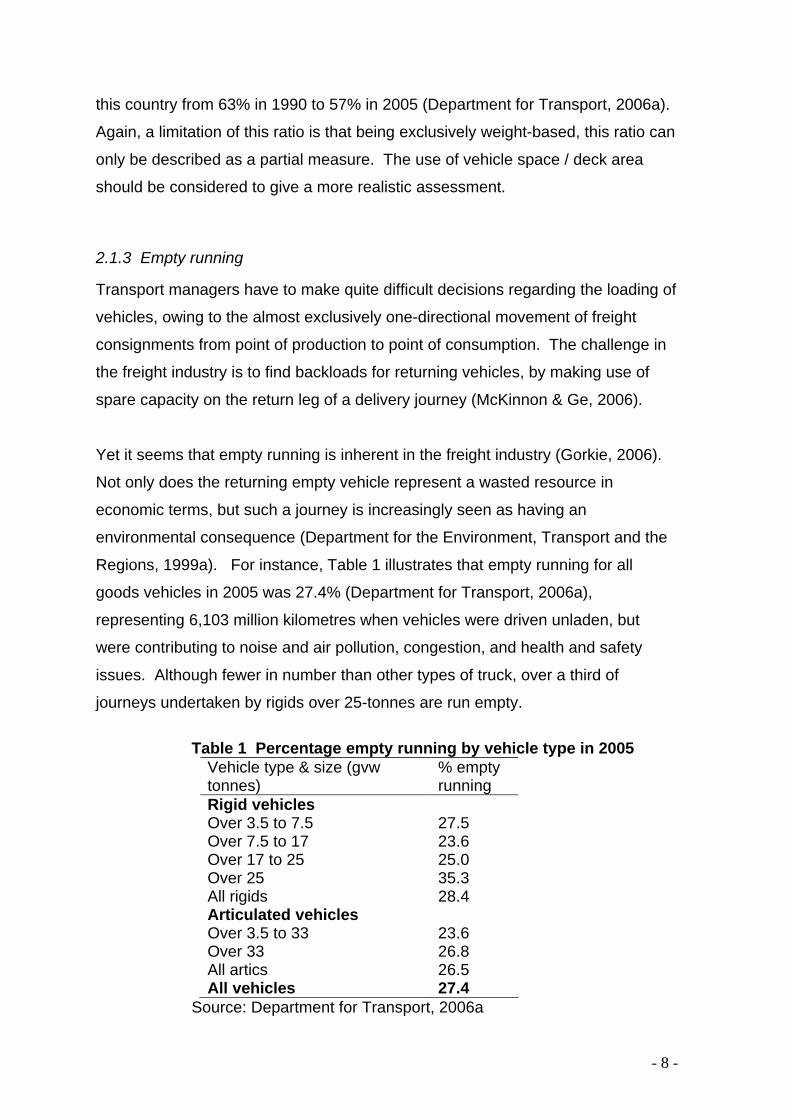
Yet it seems that empty running is inherent in the freight industry (Gorkie, 2006).
Not only does the returning empty vehicle represent a wasted resource in
economic terms, but such a journey is increasingly seen as having an
environmental consequence (Department for the Environment, Transport and the
Regions, 1999a). For instance, Table 1 illustrates that empty running for all
goods vehicles in 2005 was 27.4% (Department for Transport, 2006a),
representing 6,103 million kilometres when vehicles were driven unladen, but
were contributing to noise and air pollution, congestion, and health and safety
issues. Although fewer in number than other types of truck, over a third of
journeys undertaken by rigids over 25-tonnes are run empty.
Table 1 Percentage empty running by vehicle type in 2005
Vehicle type & size (gvw tonnes)
% empty running
Rigid vehicles Over 3.5 to 7.5 27.5 Over 7.5 to 17 23.6 Over 17 to 25 25.0 Over 25 35.3 All rigids 28.4 Articulated vehicles Over 3.5 to 33 23.6 Over 33 26.8 All artics 26.5 All vehicles 27.4
Source: Department for Transport, 2006a
- 9 -
Over the last 30 years in the UK the proportion of empty running by trucks has
steadily declined, with resultant economic and environmental benefits (McKinnon
& Ge, 2006); although in the last couple of years this downward trend has faltered,
leaving the question as to whether stable levels have been reached. Ultimately
though, some transport practitioners believe that empty running will stabilise at
around the mid- to low 20s% (McKinnon, 2006, per. comm.).
Within these overall figures there can be wide variations between sectors, even
when different fleets are engaged in similar delivery patterns. Léonardi &
Baumgartner (2004) found that in Germany the container transportation business
recorded almost half their truck kilometers as running empty (48%), whilst in
Britain the retail sector tends to have slightly lower than average empty running of
vehicles (McKinnon, 2004). This may possibly be explained by the sector using
‘dedicated’ equipment, such as roll cages that are not necessarily classed as
empty running when returned from supermarkets (Department for Transport,
2003a). Despite being essential to the retail logistics operation, dedicated
equipment could be consolidated into returns of fewer trips, thereby freeing-up
vehicle capacity for other deliveries (Department for the Environment, Transport
and the Regions, 1999b).
Empty-running data collected at the micro-level during one-off studies, tend to be
lower than average annual values (McKinnon et al, 2003; Léonardi & Baumgartner,
2004). The 48-hour snap-shot of the food supply chain in 2002 found only 19% of
journeys were empty running, although again with wide variations across the
sample (Department for Transport, 2003a; McKinnon et al, 2003).
Causes of empty running are numerous. ECR Europe (2000) list the following:
• Lack of co-operation between shippers and carriers within a region;
• Lack of co-ordination in planning and scheduling;
• Competitive and legal constraints;
• Imbalances in goods flows within and between regions;
• Insufficient visibility of opportunities for building efficient circuits;

- 10 -
• Replenishment practices which inhibit circuit operation (lack of
synchronisation of collection and delivery windows);
• Incompatibility between vehicle characteristics and product requirements
(e.g. need for temperature control).
2.1.4 Lading factor
A more sophisticated indicator is the lading factor, which is defined as the ratio of
the actual goods moved to the actual tonne-kilometres achievable if a vehicle,
whenever loaded, was loaded to its maximum carrying capacity on every loaded
journey (Department for Transport, 2006a).
Generally, the heavier the vehicle, the greater the lading factor, with the road
freight sector as a whole having a lading factor of 57% in 2005 (Table 2). This
overall value though has fallen in recent years, reflecting the trends towards the
carriage of lightweight goods, notably food and electronics (Skills for Logistics,
2005).
Table 2 Lading factor by vehicle type in 2005 Vehicle type & size (gvw tonnes)
% lading factor
Rigid vehicles Over 3.5 to 7.5 41 Over 7.5 to 17 39 Over 17 to 25 46 Over 25 64 All rigids 53 Articulated vehicles Over 3.5 to 33 43 Over 33 59 All artics 58 All vehicles 57
Source: Department for Transport, 2006a
Combining the ratio of empty-running and the laden factor suggests that on the
average km travelled in 2005 UK trucks carried only 45.7% of the total possible
load. Compared with other EU countries, the UK has average payloads a third
below the EU-wide average, at just 9-tonnes, although this figure is increasing

- 11 -
year-on-year (Eurostat, 2006). These ratios indicate that there are considerable
opportunities to improve overall vehicle utilisation in the UK.
2.2 Measures applicable to micro-level data
2.2.1 Space-utilisation / vehicle fill
Vehicle fill can be measured with respect to pallet numbers and height. Low-
weight, bulky products, such as toys, clothing, electronics and luggage will fill
available space (cube-out) before weight limits are reached, and as a result,
weight-based load factors tend to under-estimate the actual level of utilisation,
whilst measures based on pallet numbers tend to give higher utilisation rates
(Department for the Environment, Transport and the Regions, 1999b). Conversely,
heavy, dense products (canned foods, building products and bulk paper goods)
will use available weight before utilising available cube. AT Kearney (1997)
commented that 15% more grocery trucks were required across Europe because
vehicles were not loaded to their maximum heights.
Assessing vehicle fill for the industry as a whole is problematic as analysis of the
available data for the UK reveals that there is no systematic collection of
volumetric data on road freight flows. McKinnon (2003) commented that collecting
such volumetric data would be hard on a consistent basis. As a result, only a few
studies have been undertaken on the cube utilisation of vehicles, and these tend
to be one-off surveys (Mackie & Harding, 1983; McKinnon & Campbell, 1997;
Samuelson & Tilanus, 1997; Department for the Environment, Transport and the
Regions, 1999b).
In a 48-hour survey examining the trips undertaken by 46 vehicle fleets across the
UK, just over a half (54%) of the journeys carried pallets to an average height of
1.5-1.7m (Department for the Environment, Transport and the Regions, 1999b), a
height that corresponded to approximately the maximum slot height of most
warehouse racking systems.

- 12 -
Stack height within vehicles, therefore, can be limited by constraints imposed at
the warehouse, as racking systems there, especially in the fast-moving consumer
goods sector (FMCG), have a standard slot height for pallets of 1.6m, a height
which is significantly below the vertical clearance (of at least 2.4m) in most
articulated trucks (McKinnon, 2006). On average, the 48-hour survey revealed
that approximately two-thirds the available height in the vehicles was actually used,
although over one-fifth of vehicles recorded pallet heights of below 1.5m
(Department for the Environment, Transport and the Regions, 1999b).
Deck-area is usually the confining factor when there are tight limits on the stacking
height of products. Again, using the data from the 48-hour survey, when average
height utilisation (65%) was multiplied by average deck-area coverage (78%) an
estimate of 50% for the cube utilisation of vehicles on loaded trips was calculated
(Department for the Environment, Transport and the Regions, 1999b).
2.2.2 Productive time
Productive time may be measured in hours and minutes during the day when a
vehicle is utilised, with the ideal ‘time-efficient’ vehicle being used continuously on
a non-stop 24-hour basis. Obviously, this is an unobtainable goal, as vehicles
generally operate to shifts, need loading and unloading and require both
preventative and corrective maintenance stops. Under-use can also indicate a
lack of business (Samuelson & Tilanus, 2002). Nonetheless, vehicles are being
used more and more, and it is the transport manager’s responsibility to achieve
the highest possible utilisation, whilst remaining flexible to scheduling demands, a
difficult trade-off to achieve.
According to the food transport KPI survey, the average truck spent just over a
third of its time (28%) running on the road. Loading and unloading adds an
additional 16% to the time, whilst it remains empty or idle for 28% of the time.
(McKinnon and Ge, 2004). IGD (2003) found that this ‘idle-time’ was considerably
greater, at up to 47% of a typical day (IGD, 2003).
- 13 -
2.2.3 Efficiency of vehicle usage (tkm/mkm)
Léonardi & Baumgartner (2004) proposed the efficiency of vehicle usage (Evu)
ratio which takes account of the overall weight of vehicles, not just the load being
carried. It is calculated by taking the tonnes/km and divides these by an indicator,
mass kilometres (mkm). In turn, the mkm is calculated by adding the weight of the
empty vehicle (t2) to the payload (t1), giving the total weight (m) of the vehicle.
Evu = t/km / [(t2 + t1) x km]
The resultant ratio indicates how much more physical transport capacity was
actually carried out (Léonardi & Baumgartner, 2004). Unfortunately, it cannot be
applied to the freight industry as a whole, as no data for ‘average’ vehicle weight
are available, although individual vehicles or fleet level information related to case
studies may be obtained.
2.2.4 Overall Vehicle Effectiveness (OVE)
This ratio, devised by Simon et al. (2004), is adapted from a similar well-
established manufacturing measure. Total vehicle performance is derived from
the following aspects: driver breaks, excess loading times, vehicle fill loss, speed
loss and quality delays, which are considered on whether they add value or are
wasteful to the overall transport operation.
Taking these five aspects into account, the use of a vehicle is assessed on its
availability, performance and quality of delivery. For instance, if a vehicle fleet has
an availability of 87%, a performance of 55% and a quality of 100%, as in the case
of the company examined by Simons et al. (2004), the OVE is 48% (87x55x100).
The rigorous combination effect of this ratio led the authors to state that the OVE
is ‘a severe test and provides a full measure of the vehicle’s effectiveness and
productivity’, and they recommended its use both by government and individual
companies for assessing overall transport effectiveness.

- 14 -
3. KEY CONSTRAINTS / ISSUES FOR VEHICLE UTILISATION
The Department for Transport’s Freight Best Practice Programme established
benchmark findings for three sectors of the industry (pallet networks; non-food
retail and food retail), based on Key Performance Indicators (KPIs). As can be
seen from the following table (Table 3), in summary-form they give a clear
understanding of the extent of under-utilisation of vehicles within the freight
industry, with the food retail sector, in particular, faring poorly. Possible reasons
for these inefficiencies will be the focus of this section of the report.
Table 3 Summary of KPI findings for the Freight Best Practice Programme Pallet networks Non-food retail Food retail Vehicle fill 73% 51% 53% Empty running 8% 11% 19% Productive time 46% 38% 28% Deviation from schedule
35% 19% 29%
Source: Freight Transport Association (2006)
3.1 Sourcing, distribution and delivery
3.1.1 Demand fluctuations
Demand fluctuations form one of the major constraints on vehicle utilisation.
Variability of sales volumes implying variable transportation needs over daily,
weekly, monthly and seasonal cycles results often in a significant vehicle capacity
under-utilisation. Vehicles which are acquired with sufficient space or weight to
accommodate peak loads, inevitably spend much of their time running with excess
capacity. While companies subject mainly to seasonal fluctuations can hire
additional vehicles or outsource more of their transport at peak periods and carry
only a regular base-load of traffic on their own vehicles during the year, for
suppliers exposed to daily demand volatility the efficient management of transport
capacity presents a much greater challenge (McKinnon, 2006).

- 15 -
Figure 1
Weekly demand pattern for one of the major UK bread producers (no of loafs)
0
500
1000
1500
2000
2500
SUN MON TUE WED THU FRI SAT
Thou
sand
s
A case study of one of the largest bread and morning goods manufacturers in the
UK has shown great variations in the daily sales figures and resulting
transportation needs (Figure 1). Additionally, due to the nature of the products-
mainly bread and rolls- all customers require deliveries in the morning to have the
merchandise ready on shelves at the store opening time. This prevents the
company from optimising its transportation resources and the vehicles run
inevitably only partially loaded on the less busy days. Keeping this spare capacity
is necessary, as the final demand for transport is not known until the late
afternoon of the day proceeding the delivery date, which make transportation
planning very challenging.
Limitations to optimum vehicle utilisation experienced due to weekly demand
fluctuations by a major steel products distributor were also described by McKinnon
(2006).
3.1.2 Just-in-Time (JIT) delivery
The Just-in-Time (JIT) concept implies a continuous flow of materials through the
supply chain, and aims to keep inventory to a minimum by synchronising transport
to the production process (Böge, 1994; Allen, 1994). However, it appears that this
process can generate more transport (Yang et al., 2005; Lamming and Hampson,
1996; Swenseth and Buffa, 1990), as total vehicle miles increase to accommodate
the more frequent movement of smaller quantities of goods. Fuel consumption
also increases, as smaller vehicles consume more fuel per tonne moved than

- 16 -
larger vehicles (Copper et al., 1994) and produce more pollution. The average
small van (1.5- tonnes) generates around 4.6 times more CO2 per tonne km
moved (Department for Transport, 2003a).
With regard to overall transport efficiency, JIT has the effect of depressing vehicle
load factors (McKinnon, 2000b), and in the absence of buffer stocks, production
and distribution, operations become much more vulnerable to departures from the
delivery schedule (Cooper, 1994).
Nevertheless, companies seem prepared to accept the resultant lower vehicle
utilisation and higher transport costs in return for large reductions in inventory and
other productivity benefits, such as the more efficient use of labour. This need not
be the case, however, if a company were to reconfigure its inbound logistics, the
adverse effects of JIT on transport efficiency may be mitigated (Allen, 1994;
McKinnon, 2007). This was explored by the Nissan car company who in the
1990s implemented a remote, load consolidation scheme, which helped alleviate
transport inefficiencies (Department for Environment, Transport and the Regions,
1998a).
Low inventory policies and JIT delivery are now the norm in many industrial
sectors and road transport operations have largely adapted to the related
scheduling requirements. Recently there have been calls for the abandonment of
JIT on environmental grounds. For example, Gorick’s has pleaded that “we need
to step back from this approach or we will never optimise vehicle fill” (Gorick, 2006,
pp.26). Increasing transport costs and declining delivery reliability on congested
infrastructure may also force a relaxation of JIT replenishment.
3.1.3 Postponement
Postponement involves delaying the customization of products and/ or the
dispersal of inventory as long as possible, preferably until the customer has
placed an order. It has been motivated primarily by the desire to reduce inventory,
though can also have the effect of improving transport utilization (van Hoek & van
Dierdonck, 2000). It often results in processes which add volume and weight to a

- 17 -
product (such as packaging) being delayed until they reach a point close to the
final customer (McKinnon and Forster, 2001; Twede et al., 2000) It can also
entail holding inventory back at a central location until a consolidated load has
accumulated. On the other hand, logistics postponement (Pagh and Cooper,
1998), like JIT delivery, can involve using less-than-truck load deliveries to
minimise response-times from the initial order to delivery. The dispatch of orders
from central locations (such as factories or national distribution centres) directly to
customers also increases the amount of packaging requiring, adversely affecting
vehicle utilisation (Garnett, 2003).
3.1.4 E-commerce and the growth of home delivery
Potentially, there could be significant negative environmental implications with the
forecast exponential growth of e-commerce and home deliveries over the next few
years (McIntyre, 2007). Transport management is facing an increasing challenge
with the development of B2C e-commerce, resulting in rising demand for many
small deliveries (usually parcels- around 60 per cent of UK home delivery market)
in the widespread geographical area (Department for Trade and Industry, 2001).
The need to deliver within tight time windows often in the congested urban areas
causes great difficulties in ensuring optimal utilisation of fleet capacity (OECD,
2004).
3.1.5 Priority given to the outbound delivery service
Transport managers tend to give priority to outbound distribution to customers as
customers increasingly have higher delivery expectations, and companies feel
‘duty-bound’ to deliver on time. Backloading increases the risk that a vehicle will
be out-of-position when required to collect its next outbound load destined for the
consumer. McKinnon (1996) identified this fear by companies as the main
constraint to backloading.

- 18 -
3.1.6 Unreliability of delivery schedules: congestion
This reluctance by transport managers to engage in securing backhaul
arrangements is further exacerbated by the effects of traffic congestion on
logistical efficiency, as congestion interferes with delivery schedules and can be
blamed for decreased productivity through delays and stock-outs. Furthermore,
unpredictable traffic incidents, such as accidents, road works and events often
intensify congestion, and hauliers frequently have limited choice other than to ride
out congestion owing to the timing and routing of deliveries or restricted access
legislation (Scottish Executive, 2005).
Such congestion-induced uncertainty has been associated with additional indirect
costs to the freight industry. McKinnon (1999) extrapolated from previous studies
that these costs could be between £96 - £132 million per annum, yet in his survey
of 7 UK-based distribution centres (DCs) handling FMCG, only 2 of them reported
significant disruption to their warehousing operations as a result of congestion.
This is similarly supported by a later study (McKinnon & Ge, 2004) when observed
delays occurred in 29% of journeys, with congestion accounting for only a third of
these stoppages (equivalent to a delay of approximately 15 minutes). To a certain
extent, many delivery schedules offer the flexibility to accommodate such delays
within the usual 30 minutes booking-in slot, and other factors disturbed schedules
more severely than traffic congestion. McKinnon (1999) highlighted these factors
as delays at retail distribution centres (RDCs); delays in the production process;
absenteeism of staff, particularly drivers; vehicle breakdowns; problems with
delivery paperwork and inclement weather.
Nevertheless, it should be noted that traffic growth is forecast to increase in the
UK by 22% between 2000 and 2010, and congestion by 15% across the whole UK
road network (Department for Transport, 2004a). A similar situation is occurring
across Europe, with the European Commission predicting that if nothing is done,
road congestion will increase significantly by 2010, and associated costs would
account for 1% of community GDP (European Commission, 2001).

- 19 -
This is a prediction, that Fernie et al. (2000) state, has not gone unnoticed by retail
logistics managers in the UK, who perceive traffic congestion to be a future issue
for the retail grocery industry. In recent years, greater priority has been given,
particularly in the FMCG sector, to ‘transport optimisation’ (e.g. ECR UK, 2005).
This has been partly motivated by concern about increasing traffic congestion.
3.2 Unitisation: unit loads
3.2.1 Vehicle size and weight restrictions
Under the EC Directive 96/53/EEC (previously 85/3/EEC) trucks with 5 or more
axles undertaking international journeys have a weight limit of up to 40 tonnes,
although some EU countries (including the UK) operate higher maximum weight
limits for domestic operations. Hauliers do not necessarily operate up to this
maximum weight, and Henderson (2005) claimed that in Europe only 5% of freight
run to ‘gross’ maximum payload, as most cube-out before maximum payloads are
reached. Conversely, some high-density loads do actually reach the maximum
weight limit without filling available space.
3.2.2 Incompatibility of vehicles and products: procurement
Fleet configuration (i.e. matching the capacity of the vehicles to the freight
demands) is a key responsibility of any transport manager, and this is especially
true when the procurement of new vehicles is considered, as the less flexible a
vehicle is in its carrying capacity, the fewer the opportunities that there are for load
consolidation. Some vehicles require specialist handling equipment or
refrigeration capabilities and are, therefore, limited to carrying only certain
dedicated loads, whilst others are restricted by the nature of the load that they
carry and prohibit opportunities for the carriage of mixed consignments.
A further complication is the vintage of fleets. Rapid turnover of trucks is not
common in the freight industry, as most fleet are only replaced infrequently.
Almost half of all trucks (44.6%) were more than 5 years old at the end of 2005,
and over a quarter of rigids (>3.5 – 7.5 tonnes) are at least 10 years old, with

- 20 -
average ages of articulated and rigid vehicles about 4.6 and 6.2 years
respectively (DVLA, 2006) (Appendices A & B).
Consequently, once a transport manager has decided on a fleet configuration, it
may be several years before the company can take advantage of newly-
introduced technologies or even adapt to changes in market demand for different
products. Additionally, there are also direct environmental implications of an
ageing fleet, as older vehicles emit more pollution (Department for Transport,
2006a), and do not have to conform to the recent, more stringent Euro emission
standards (Table 4).
Table 4 Emissions (per vehicle km) in urban conditions
CO HC NOx PM10 CO2 Rigid trucks Pre-1993 25 118 349 277 361 1993-1996 14 43 442 141 361 1997-2001 12 34 377 86 361 2002- 8 23 261 71 361 Articulated trucks Pre-1993 29 101 981 407 591 1993-1996 40 107 1173 371 523 1997-2001 31 88 809 224 483 2002- 22 61 560 185 483
Source: Department for Transport (2006a)
3.2.3 Warehouse configuration and interface interactions
Poor packaging has a negative impact on warehouse layout, design and overall
productivity (Grant et al., 2006), and warehouse design, in turn, can greatly
influence the efficient handling of packaged goods (Ballou, 1987). Nevertheless, it
is the warehouse-transport interface that can have the greatest influence on
transport efficiency (Yang et al., 2004). The nature of loading and unloading
equipment affects turnaround times, with counterbalance trucks requiring
additional yard space, impacting on a site’s capacity, whilst loading bays can
restrict the type of vehicle that they can take, although offer all-round weather
protection and reduce the distance goods have to be taken from truck to storage
(Meczes, 2005). Research into this area of operation is extremely limited and
confined to theoretical modelling.

- 21 -
The transport KPI surveys in the food supply chain also found evidence of
refrigerated lorries being pre-loaded many hours before they were due to leave in
order to smooth workloads in the cold store. This improved staff productivity in the
warehouse, but at the expense of vehicle operating efficiency and energy
consumption. Usually much more energy is required to keep loads refrigerated in
a truck than in a cold storage.
3.2.4 Handling and packaging requirements
Limited research has been undertaken into the interface of product design and
logistics (Dowlatshahi, 1999). Previously, designers had attempted to consider
only marketing and manufacturing requirements in product development and
packaging design (Vasquez et al, 2003), and latterly, the recyclability and recovery
of the product. Tsoulfas and Pappis (2005) even failed to consider logistical
aspects of product design when they examined the impact of environmental
principles on supply chain designs and operations; similarly, studies concerning
vehicle utilisation usually exclude any reference to the nature of the products
being carried (McKinnon & Forester, 2001). Nevertheless, logistics and product
design are undeniably linked through the activities of handling, packaging,
stacking and transporting.
Unconventionally-shaped packaging causes problems all along the supply chain,
as the larger and more oddly-shaped the range of packaging sizes, the greater the
handling and delivery complexity and consequently, the less efficient the transport
operation will be. By way of example, McKinnon & Forester (2001) observed that
during the 2001 World Cup, a large British brewer designed a special multi-pack
for canned beer in the shape of a football stadium, only handling 10 cans in the
space usually occupied by 24. The result, a unit efficiency reduction from 65% to
27%, although no comment was made on the success of the promotion in terms of
beer sales! So despite marketers wishing to attract customers with variety and
speciality in packaging styles, from a transport efficiency viewpoint,
standardisation and conformity are the most desirable packaging attributes.

- 22 -
Therefore, it should come as no surprise that a high percentage of products are
conveniently packaged in rectangularly-shaped packaging i.e. boxes (Hoare &
Beasley, 2001), which in turn, are repacked using tertiary packaging (i.e. handling
equipment). More than two-thirds of all products are repacked at this stage,
mostly from pallets to roll-cages (AT Kearney, 1997). Here again there are
problems with proliferation (Penman, 1997), for instance, within Europe there are
more than 30 different types of pallet.
Table 5 Calculation of weight utilisation for different tertiary types
Euro pallet
Slip sheet No Tertiary Item
Maximum permissible weight of truck (tons) 40 40 40 - Empty weight of tuck (tons) 15 15 15 = Available weight (tons) 25 25 25 - Weight of tertiary items 0.83 0.17 0 = Available product payload (Weight available for carrying products) (tons)
24.17 24.83 25
Potential Weight Utilisation (Payload/Available Weight) (%)
96.7 99.3 100
Source: ECR Europe (2000)
Also, as is evident from Table 5, the very presence of teritiary packaging impacts
on vehicle utilization by reducing the available product payload (ECR Europe,
2000). Many companies trade-off poorer vehicle utilization for more efficient
loading and unloading. It appears therefore, that in optimizing the trade-off
between transport, handling and damage costs the under-utilisation of vehicle
space is almost inevitable (McKinnon, 2003a).
Even so, it should be noted that an inadequate logistical interface will lead to poor
handling times within the warehouse, at the despatch bay and in stores, and
under-utilisation of vehicles, resulting in additional vehicle journeys and increased
stop times.

- 23 -
3.3 Industry pressures
3.3.1 Lack of support from Senior Managers
Transport logistics has in the past received little attention or support from senior
management, and the person responsible for day-to-day transport-related
administration within a company may lack both managerial status and financial
authority within the firm. Yet, senior managers would soon note inefficient
transport operations that impact on a company’s financial statement or a poor
delivery service that does little to encourage repeat business. Therefore,
Giunipero et al. (2006) called for transport managers to be allowed more strategic
roles within companies, contributing as they do to a company’s bottom line and
customer relationships (Day, 1998).
3.3.2 Government regulations:
1. Working time regulations (WTR)
Working long hours in the freight industry is common practice. Currently, around
25% of transport-related workers and 33% of all men in the industry work over 48-
hours a week (USDAW, 2004). However, the introduction of the Road Transport
(Working Time) Regulations, which came into force in April 2005, has had a
significant impact on working practices in the industry. These regulations detail
the working hours for truck drivers in the EU, and allow an average of 48-hours
per week, with a maximum of 60-hours in any one week. All loading, unloading
and maintenance of the vehicle is to be included in the driver’s hours worked,
along with any administrative duties they may have. Overall, however, the UK
government’s relatively flexible interpretation of the ‘Periods of Availability’
requirements has given vehicle operators greater flexibility than they expected.
Importantly for transport scheduling, the WTD also state a maximum of 10-hours
work in any 24-hours, if night-time working is included (Department for Transport,
2005a; Lowe, 2007). Although already implemented, the Road Transport
legislation will not come into effect fully until 2009 when owner-drivers must
adhere to the regulations.

- 24 -
It was feared that the WTD would reduce the take-up of backhauling opportunities
within the industry. It is not yet known to what extend the WTD has had this effect.
Clarke and Smeeton (2003) also argued that the introduction of the WTD,
particularly its effects on night working, would mean more vehicles travelling at
peak times, causing more congestion and an increase in pollution. It may also
make it difficult for some companies to take advantage of the proposed relaxation
of current night delivery curfews, outlined in a recently-issued guidance note
(Department for Transport, 2006c; Freight Transport Association, 2006).
Moreover, in order to maintain previously offered levels of service, companies
could be forced to renegotiate delivery schedules and increase both radial
distribution fleets and the number of warehouses (Clarke and Smeeton, 2003).
No research has been found on the actual effect of WTD for either the
environment or transport operations.
2. Health and safety regulations (HSR)
Being struck by a moving vehicle is one of the most common causes of death at
work, claiming 40 workers lives in 2001/2 (Health & Safety Executive, 2002),
whilst 85% of all handling injuries in the food and drinks industries occur when
loads are being handled manually (Health & Safety Executive, 2000). Therefore,
working in the freight industry can be a risky business. Health and safety
regulations have been formulated to safeguard workers’ welfare (Health & Safety
Commission, 1999), though they have had a negative effect on some companies’
vehicle utilisation. Enforced maximum loading weights and stack heights reduce
the levels of freight that can be carried per square metre of deck space (McKinnon
& Campbell, 1997).
3. Fuel tax and vehicle excise duty
Road freight operators in the UK incur the highest taxes in the EU, mainly in the
form of fuel duty. This puts added pressure on UK companies to operate their
lorries efficiently.

- 25 -
4. POTENTIAL EFFICIENCY IMPROVEMENTS IN THE FREIGHT INDUSTRY: LOGISTICAL EFFICIENCY
There are several opportunities in the supply chain for transport managers to
directly influence efficiencies, both to save money and reduce freight’s
environmental impact.
These opportunities will be considered under the following headings:
• Logistical Efficiency
• Vehicle Efficiency
• Driver Efficiency
• Route Efficiency
4.1 Sourcing, distribution and delivery
4.1.1 Local sourcing
A move to more locally and regionally-sourced goods would significantly reduce
the mileage travelled by trucks, although with the inevitable trade-off between
distance, vehicle size and transport efficiency. More local sourcing might involve
the use of smaller, more polluting vehicles, and potentially carry products in less-
than-full loads (Department of the Environment, Food and Rural Affairs, 2005).
Nevertheless, both suppliers and retailers need to be mindful of consumers’
preferences, as there is growing evidence that consumers are becoming more
ethically-aware in their selection of products, and consider the issue of food miles
in their purchasing choices (Garnett, 2003). This can be seen in the recent surge
in popularity for buying locally-grown foods from farmers markets up and down the
country (Bullock, 2002).
Saunders et al. (2006), on the other hand, has argued that to use the concept of
‘food miles’ alone in comparisons is ‘spurious as it does not consider total energy
use especially in the production of the product’. Similar views have been
expressed by Mason et al. (2002) and DEFRA (2005). Full life-cycle analysis is

- 26 -
required to weigh up the environmental costs and benefits of sourcing products
over different distance ranges.
4.1.2 Backloading
Backloading is a key priority in reducing inefficiencies in vehicle utilisation (whilst
increasing overall vehicle load factors) (McKinnon & Ge, 2006; Sankaran et al.,
2005; Department for Transport, 2005b). The result, when employed effectively,
is overall improved operational efficiency, reduced emissions and lower road
congestion. As such, backhauling in the grocery retail sector became a key
feature in retailers’ logistics strategies (Fernie et al., 2000). Rather than a vehicle
returning empty from delivery to a store, where possible, it would return via a
supplier’s factory or warehouse.
During the mid-1990s, Tesco implemented such a system with its Supplier
Collection and Onward Supply Schemes, thereby eliminating primary and
secondary return journeys. The result was considerable fuel savings and vehicle
usage was reduced by around 3 million journeys per annum (Department for the
Environment, Transport and the Regions, 1998b).
Problems associated with backhauling used to be viewed from the perspective of
uncertainty and the complexities of scheduling arrangements, with a single
‘decision-maker’ planning internal schedules within a company, based on the best
information available. Today, internet-based transport exchanges enable supplies
and hauliers to be matched nationwide, resulting in potentially more backloading
arrangements (Sarkis et al., 2000). Rowlands (2000) suggests that growth of
online freight exchanges is likely to match traffic flows more closely to the
available transport capacity, thus increasing opportunities for finding backloads.
However, some studies (Hesse, 2002; Clements 2001) imply very limited potential
of online freight marketplaces to re-organise and improve management of freight
operations, mainly due to uncertainty in carriers and shippers participation and the
‘spot’ character of many freight exchanges. The actual experience of many freight
trading platforms contradicts this view (Sarkis et al., 2004; Mansell, 2001 & 2006).
- 27 -
4.1.3 Postponement
Such initiatives as Just-in-Time, Efficient Consumer Response, Quick Response
and Supply Chain Management strategies all assist in shortening order lead times
and reducing inventory. Twede et al. (2000) argued that waiting until the last
moment to add packaging could have substantial benefits through reduced
inventory and transportation costs. In spite of concerns regarding transport
implications, logistics postponement can help to remove uncertainty in product
demand across geographical markets. It is less likely that items will either stock-
pile at one location or stock-out at another, as finished inventory is kept at a
central location, and shipped directly only on demand.
Illustrated by the international operations of Hewlett-Packard, adopting a
postponement strategy can lead to substantial savings. Hewlett-Packard found
that both cube space requirements and long-distance transport costs halved when
the space occupied with a ‘bare’ printer was compared with that of a fully-
packaged version (Feitzinger & Lee, 1997).
4.1.4 More transport-efficient order and sales cycles
Order fulfilment practice can influence to a great extend the efficiency of logistics
operations. Two basic modifications to this process that may lead to significant
transport utilisation improvement and reduction of the overall negative of a
company’s logistics are presented in the literature (e.g. McKinnon, 1999).
Nominated Day Delivery System (NDDS)
This system allows a company to ensure a much higher level of transport
efficiency by giving customers an incentive to adhere to a fixed ordering and
delivery timetable. On a ‘nominated’ day a delivery vehicle is scheduled to visit a
particular area and customers willing to receive a delivery on that day need to
place their orders a minimum number of days in advance. Customers that fail to
comply with the order schedule have to wait for the next scheduled delivery.
Concentrating deliveries in particular areas on particular days results in higher

- 28 -
levels of load consolidation, drop density and vehicle utilisation, thus leading to
cost savings and reduced overall environmental impact of the transport operation
(McKinnon, 2006).
However, introduction of NDDS meets often a great opposition for sales and
marketing managers, fearing that the imposition of ordering constraints will
weaken the company’s competitive position and jeopardise sales. Nevertheless,
the experience of companies operating NDDS contradicts this view (McKinnon,
2000a). Furthermore, research conducted by Zografos and Giannouli has shown
that a substantial increase in NDD is expected in all sectors where this concept is
applicable (Zografos & Giannouli, 2001).
Abandoning the monthly payment cycle
A common practice among companies is to invoice the customers at the end of
each month. Hence, customers placing their orders at the beginning of the month
are given a 30-days interest-free credit. As a consequence, demand for freight
transport tends to increase significantly at the start of the period as the company
needs to accommodate the extra orders. Fluctuating delivery volumes make the
maintaining of a high level of vehicle utilisation particularly difficult (McKinnon,
2002). It has been suggested, that relaxing the monthly payment cycle and
moving to a system of ‘rolling credit’, where customers are still granted the same
payment terms but from the date of the order rather than the start of the month,
suppliers could significantly improve the average utilisation of their logistics assets.
However, the transport efficiency improvements attributable to ‘rolling credit’
system implementation require further investigation (McKinnon, 2003).
4.1.4 Unattended delivery
Unattended delivery solutions allow deliveries to be made when no-one is there to
receive them. It permits out-of-hours delivery, increases delivery flexibility,
increases average drop density and, as a consequence, increases the efficiency
of the delivery operation (McKinnon et al., 2003; Punakivi et al., 2001). Research
in Helsinki has suggested that the use of reception boxes can cut delivery
distances and transport costs by as much as 40%. Attempts to sell reception

- 29 -
boxes to domestic users have so far proved unsuccessful, causing their suppliers
to re-orient their marketing from the B2C to the B2B sector. Unattended delivery
of spare parts, sales catalogues and business parcels is increasing. Recent
innovations in the unattended delivery solutions (e.g. Shopbox) are likely to further
support managers in optimising their resources in the future (Anon, 2006a).
4.1.5 Telematics
Route and load planning are essential to maximize vehicle utilization and reduce
the incidence of empty-running (McKinnon, 2003b), yet little work has so far been
undertaken on transport efficiency and fuel savings that can be achieved from IT-
based systems . Most guides to the subject concentrate on the technology
software and its use (Department for Transport, 2003c).
Nevertheless, potential freight transport benefits of IT-based systems include:
• Greater transparency of the operations activities;
• Increase in the vehicle load factor;
• Decrease in the average transport distance;
• Planning and rescheduling of transport operations during the day
(Léonardi & Baumgartner, 2004).
As route and scheduling efficiency are the focus of another report, they will not be
considered further here.
4.2 Collaboration & relationships
4.2.1 Use of primary consolidation centres
Prior to 1980, most grocery stores received deliveries directly from supplies. With
the advent of RDCs, retailers took responsibility for deliveries to their stores, with
products being consolidated before delivery took place. Further developments
during the 1990s involved the use of primary consolidation centres (PCCs). Not
only could RDCs be supplied more easily, but PCCs ensured that only full loads of
required products were delivered to RDCs, thus minimising vehicle movements
(Christensen, 2002). By increasing the use of PCCs, Potter et al. (2003) modelled

- 30 -
a potential reduction of 28% in the mileage associated with transporting less-than-
truckload consignments to RDCs. The number of PCCs in the UK grocery supply
chain increased from 11 in 1998 to over 100 by 2003 (IGD, 2003).
The 500 suppliers of the Co-op Group found considerable savings from the
opening of its National DC in Coventry in early 2005. Fewer trips were made, and
with predominantly full truck loads and full pallets (Rowat, 2006). The end result
for the Co-op Group was that product availability was maintained at 95% plus, and
wine promotion availability increased from the low 90s% to 97% (Rowat, 2006).
4.2.2 Data sharing: collaboration & network sharing
Internet-based transport exchanges enable suppliers and hauliers to be matched,
potentially resulting in less empty-running (Sarkis et al., 2000). Further transport
efficiencies can be achievable when competing retailers are willing to combine
their independent, but often parallel distribution networks (so called ‘horizontal
collaboration’).
Cross company/industry collaboration can be achieved by swaps, pooling and
sharing of resources, backloading of vehicles and containers and skills
development (McKinnon & Braithwaite, 2005). Energy savings in terms of
reduced distances travelled can be significant, as in theory, each collaborative
partner, having a vested interest in the success of any venture, should work to
achieve best results. Unfortunately, in reality there may be a reluctance to discuss
issues and problems in the supply chains with ‘perceived’ competitors. Care
must also be taken to ensure that competition laws are not infringed.
4.2.3 Reverse Logistics
The still relatively new area of reverse logistics (the use of forward supply chain
facilities and transport for the recovery of products or parts) has received much
attention in the last few years (Dowlatshahi, 2000; Rahman, 2003; Rogers &
Tibben-Lembke, 2001; Rosenau et al., 1996; Ross & Evans, 2003), and has
considerable potential to reduce the incidence of empty running. A recent study

- 31 -
(Cranfield University et al., 2004) has suggested that savings of 20-40% could be
made in the reverse logistics channel for returned retail products, many of them in
the transport function.
However, aside from acknowledging the environmental contribution of reverse
logistics, this area of logistics activity is the focus of another report, and therefore,
will not be considered further here.
4.3 Efficient unit loading
4.3.1 Packaging
Several authors consider packaging to be one of the most important activities in
supply chains and distribution networks (Jahre & Hatteland, 2004, Gustaffson et al.
2006), as it is the packaging that enables a product to be unitized, protected and
transported securely (Robertson, 1990; Prendergast, 1995). Consequently, the
packaging’s shape, volume and weight, which may differ to that of the product
inside, has a significant impact on logistics activities (Ballou, 1987).
Packaging designed for efficiency allows convenient handling, and effective
transportation and storage. To this end, the relatively new sub-discipline of
‘Packaging logistics’ has developed, which has been defined as “the interaction
between the logistics and the packaging system that improve ‘add on’ values to
the whole supply chain from raw material producer to end-user, and the disposal
of the empty package, eg. by re-use, materials recycling, incineration or landfill”
(Chan et al., 2006).
Primary packaging characteristics are often take for granted by designers,
marketers and handlers, when slight modifications could impact positively on
transport efficiency. For instance, the familiar round tin can is not ideally suited to
maximise transport capacity, but metal square cans have proven difficult and
expensive to construct (Jahre & Hatteland, 2004). Nevertheless, Hoogovens
Packaging Steel in the Netherlands has succeeded in developing a square-
shaped can (Sonneveld, 2000). Not only does the new can offer enhanced

- 32 -
decorative opportunities to please the designers and marketers, but it also saves
20% in space, and allows a weight reduction of 15% compared with traditional
cans, thus improving load performance (Sonneveld, 2000).
Similarly, considerable economic and environmental savings can be achieved
when secondary and tertiary packaging are redesigned. García et al. (2006)
outlined a series of management and design measures that were undertaken at a
Spanish food sector manufacturer. Through a series of actions, such as
increasing unit weights or sale units, resizing trays and cardboard boxes and
designing an air extractor machine to decrease the volume of plastic packaging in
the bagging process, the company improved the energy efficiency of palletisation
by between 8% and 68% depending on the product, whilst saving the company
over €600,000.
4.4 Enhanced status of transport managers within the supply chain
A study conducted by Accenture (2004) among 184 executives in 31 countries has
shown that 60% of companies have a Supply Chain Decision-maker among the
board members. Additionally, in another survey of over 100 business executives,
nearly 90 percent of senior managers questioned indicated that the supply chain is
very important or critical to their business. An equal percentage have increased
their supply chain investments in recent years (Accenture, 2003). A clear link
between supply chain performance and the bottom line (a supply chain can
account for 40 percent to 70 percent of a company’s operating costs) has resulted
in logistics and supply chain managers gaining higher status and greater clout
within companies. This is helping to give transport management a higher profile
within companies (Accenture, 2005).

- 33 -
5. POTENTIAL EFFICIENCY IMPROVEMENTS: VEHICLE EFFICIENCY
5.1 Fuel consumption Fuel generally accounts for between 25-35% of the costs of operating a truck
(Department for Transport, 2005c; IGD, 2003), and any efficiency savings in fuel
will impact on overall transport costs.
5.1.1 Alternative Fuels
Choice of fuel is a key factor within any fuel management programme. As this
involves a medium to long-term decision, transport managers need to give
carefully considerations to the characteristics of alternative fuels (AF). Most trucks
over 3.5-tonnes operate on diesel fuels, although interest in AF is growing, as they
have proven to offer environmental benefits over conventional fuels (Lowe, 2007).
The main alternative fuel/energy types include compressed natural gas (CNG),
liquid petroleum gas (LPG) (predominantly propane in liquid form at normal
temperatures), biofuels and electricity (Appendix C).
Compressed Natural Gas
CNG is a colourless, odourless gas consisting of 85-95% methane, and is a well-
known alternative to diesel fuel. The infrastructural support for CNG is still at an
early stage, with in 2005 approximately 25 refuelling sites around the UK (Freight
Transport Association 2006a). Larger companies determined to use CNG usually
install a fuel bunker at their depot.
Transco National Logistics, when acquiring more tractor units, considered CNG
vehicles, as they were perceived to be cleaner and to produce less exhaust
emissions than diesel-operated vehicles (Department for Transport, 2003a). The
food retailer, Somerfield, already has 300 CNG-powered vehicles in service (Lowe,
2007), and these vehicles are much quieter (anything up to 10dB quieter) than
conventional diesel-powered vehicles, so are more suitable for night-time

- 34 -
deliveries in residential areas (Department of the Environment, Transport and the
Regions, 2001).
Biofuels
These liquid fuels are produced either from plant materials or organic waste oils
and fats. Within this group, biodiesel is the substitute for diesel, and having
similar physical characteristics to diesel, it is typically mixed with diesel in low-
percentage blends (E5 and E10). Biodiesel performs favourably in terms of
carbon monoxide (CO) and hydrocarbon (HC) emissions, although emits more
nitrogen oxides (NOx) than conventional diesel (Khare & Sharma, 2003). So far
there have been almost no reported incompatibility issues with the use of blended
mixes (International Energy Agency, 2004), so the appeal of E5 and E10 is that
they can be used in normal diesel engines, without the need for modifications or
engine adjustments. Truck manufacturers are reluctant to approve higher %
biodiesel blends as these could adversely affect engine life and performance and
increase maintenance costs.
AF are making only slow progress in the market place owing to higher initial
procurement costs for AF technology, and in some cases, the fuels themselves
are more costly than conventional diesel (Schipper & Fulton, 2003). To this end
the HM Treasury impose significantly lower fuel tax on AF. From 7 December
2006 ultra-low sulphur petrol and diesel, as well as sulphur-free petrol and diesel
are liable for duty of 48.35 pence per litre (ppl). Biodiesel and bioethanol are
liable for duty of 28.35 ppl. As higher production and distribution costs largely
offset this fuel duty differential, the pump price offers little financial incentive to
switch to biofuel.
5.1.2 Driver Efficiency
Training schemes
Training and motivating drivers in fuel-efficient driving techniques is one of the
most cost-effective approaches to fuel saving, as inappropriate driving can negate
all fuel-saving measures and devices (Department for Transport, 2002). For
instance, BOC Gases introduced a driver-training programme across its workforce

- 35 -
that resulted in a 4% improvement in vehicle fuel economy, saving the company
£240,000 (Department for Transport, 2002 & 2004c).
Therefore, it is not surprising that training is widely offered by companies.
Léonardi & Baumgartner (2004), in their telephone interview of 53 randomly-
selected UK and German companies, found that just over half of them had trained
their drivers in fuel-saving driving techniques in the previous 5 years. Similarly, in
a recent UK skills survey, 64% of respondents offered driver training, ranging from
only 40% for companies with 5 or fewer vehicles to 90% for hauliers operating 100
plus vehicles (Freight Transport Association, 2003).
Transport managers may need to convince skeptical drivers of the worth of such
schemes. Any ‘trainer’ coming into a company will need to be an accomplished
driver themselves, who is able to demonstrate their lessons in practice on the road
(Department for Transport, 2002). Additionally, visible management support will
give credibility to any training schemes, although again reassurances need to be
given that drivers’ jobs are not being assessed and therefore put at risk.
Results can be impressive, a leading UK confectioner achieved a 6.5%
improvement in fleet fuel consumption after the implementation of a fuel
management programme. Not only were vehicle performances monitored, but
importantly, managers regularly spent time encouraging drivers and operational
staff of the importance and merits of the programme (Department for Transport,
2004e). To ensure that improvements in driver performance are maintained it is
usually necessary to introduce incentive schemes.
Strategies may include assessing drivers’ knowledge and skills at the recruitment
stage, providing on-going training, development and training plans, as well as
giving feedback and league tables on driver and company performance
(Department for Transport, 2005c). Such training is likely to become mandatory
by 2009, under EU Directive 2003/59, when every new driver entering the industry
will have to hold a Certificate of Professional Competence (CPC). Existing drivers
will have to renew their CPC every five years by demonstrating that they have
- 36 -
undergone the equivalent of 35 hours formal training over that period (Hagan,
2005).
Implications of high staff turnover
An issue of concern is that until any on-going ‘efficiency’ training is part of a
continuous professional development programme for drivers, its impact will be
negated by the problem of high staff turnover within the freight industry. Minn and
Emam (2002) state in their American study of driver retention that “the key to
substantial productivity gains in trucking is stability in truck driver’s jobs”. Good
practice therefore, can be difficult to embed in a company owing to a lack of staff
continuity. One company has partially overcome this problem by issuing
employment contracts that bind drivers to working for the company for at least
three years (Hagan, 2005).
5.2 Aerodynamic features
5.2.1 Rolling Resistance
Fuel savings can be achieved with the use of lower rolling-resistance tyres.
Radial-ply tyres increase considerably the fuel efficiency of vehicles compared
with cross-ply tyres that offer greater resistance (Lowe, 2007). Tests show that
lower rolling-resistance tyres have the potential to save between 7-13% on fuel
consumption compared with standard tyres, with the greatest savings associated
with vehicles undertaking longer distances (Department for Transport, 2004b).
Owing to their reduced tread, energy-efficient tyres may need replacing more
frequently than standard tyres, although using re-treads and remoulds that have
the same resistance as new tyres, may be a cost-effective alternative, at least in
monetary terms (Department for Transport, 2005d). Even the use of
‘inappropriate’ standard tyres may affect a vehicle’s energy-efficient. A UK-based
industrial gas company noticed that two of its vehicles were fitted with wide, single
tyres on the steer axle. By replacing these with standard-width tyres, 3.5% fuel
savings were observed (Department for Transport, 2002). Under-inflation of tyres
also significantly impairs the fuel efficiency of trucks.

- 37 -
5.2.2 Aerodynamic Styling
It has been estimated that 50-70% of a vehicle’s power is used to overcome
aerodynamic resistance, compared with around 20-30% for rolling resistance and
10-15% in the transmission system (Modi et al., 1995). Therefore, an
aerodynamic vehicle will use considerably less fuel than one without any
aerodynamic styling, as change in fuel consumption is linearly proportionate to the
change in drag (Hucho & Sovran, 1993). As a rule of thumb, fuel savings of
between 6-12% can be achieved (Department for Transport, 2004c), with some
case studies highlighting even greater savings.
Any potential savings, however, are affected by three key issues (ETSU &
MIRA, 2001).
1. The higher the speed the greater the effect of aerodynamic drag on fuel
economy, with savings being most readily achieved on motorways, where
high constant speeds can be maintained.
2. The larger the cross-sectional area of the front of the vehicle, the higher the
aerodynamic drag.
3. Poor initial aerodynamic design will increase the overall drag, although this
may be overcome by aerodynamic add-on equipment.
Such aerodynamic stylings are generally financially self-funding in the short term.
BOC, the industrial gas company, despite achieving a reasonably modest 4%
improvement in fuel consumption when trialling an Air Flow Deflector kit, found
that the kit paid for itself in fuel savings in five-months (Department for Transport,
2002).
Trailer modification
When there is considerable height differential between a cab (even one fitted with
aerodynamic styling) and the trailer, the ‘boxy’ vertical front bulkhead of the trailer
offers great resistance and therefore is extremely inefficient. Recently, several
trailer tests have indicated fuel savings with the use of aerodynamically-profiled

- 38 -
trailers. Somerfield redesigned their double-deck trailers to include a fuel-saving
curve, (by removing the ‘dead-space’ at the front of the trailer). Over a three-day
trial period the new design achieved fuel savings of over 7% (Department for
Transport, 2006d). Similarly, Don-Bur, the Stoke-on-Trent based Group, have
recently tested their new aerodynamic ‘Eco-Stream’ double-decker, and recorded
an impressive 16.7% in fuel savings (Don-Bur, 2006).
Tractor add-ons
TNT Express reported average fuel savings of 15.8% when they tested
aerodynamic styling equipment fitted to two 32-tonne tractor units over a 10-month
trial period (Department for Transport, 2006d). Not only did CO2 savings amount
to over 29,000kg per vehicle per year, but drivers reported both a smoother ride
and improved performance, especially in head-wind conditions. Importantly, the
cab roof deflector accounted for 85% of the fuel savings, allowing hauliers who do
not operate their own trailers to benefit from aerodynamic adaptations to their
tractor units (Department for Transport, 2006d).
Other issues
The gap between the cab and the trailer significantly affects the drag of a vehicle.
By reducing this cab-gap, fuel economies can be improved by between 1-7%
(Department for Transport, 2004d). The proposed Blade Runner (road-rail hybrid)
vehicle uses a ‘fifth-wheel’, turnable coupling that eliminates the gap between the
cab and the trailer all together (Henderson, 2005).
The lighter the vehicle’s tare (empty) weight, the greater will be its efficiency.
Léonardi & Baumgartner (2004), using the mass-kilometres ratio, calculated that
on the assumption that all German companies below 0.5tkm/mkm bought the
lightest vehicle available (then 11-tonnes), a potential reduction of 20% in CO2
emissions from road freight could have been achieved. No work has been found
on actual case studies.
Nevertheless, transport managers need to consider the long-term perspective on
aerodynamic-styling. Gutierrez et al., (1996) cautioned that “most aerodynamic
devices currently in operation are effective in terms of up-front costs; however,

- 39 -
some devices are not cost effective when their life-cycle cost is estimated and
parameters like additional maintenance, effects on neighboring components, and
reduced accessibility are included”.
The routing and timing of journeys can play a part, as two trucks when driven in
tandem always present less drag than trucks operating in isolation. Hammache et
al. (2001) established, using wind tunnel experiments, that total drag savings for
two trucks in tandem could be as much as 30%.
5.3 Vehicle design
5.3.1 Enhanced capacity within current EU regulations: Double-deckers (DD)
Transport managers can maximize their fleet carrying-capacity by using
combinations of trailer units i.e. drawbar-trailer combinations and double-deck
trailers. Samuelson & Tilanus (1997) canvassed a panel of Dutch and Nordic
experts on their opinions of vehicle utilization and recommended, among other
things, investigating the installation of double-deckers after establishing very poor
average load height (of less than 50% utilization) across the industry.
Here in the UK the freight industry is unusual in having no legal maximum height
of trucks, whereas most of the EU operates to a maximum height of 4.2m
(McKinnon, 2005). As a result, British hauliers have tended to adopt a maximum
height of 5m, partly reflecting the height-clearance requirements for DD buses on
UK roads. Consequently, the number of high cube and double-deck trucks has
increased dramatically over the last few years (Adams, 2006, pers. comm.).
Two-tier vehicles have been promoted to offer considerable increases in the
vehicle load factor without necessarily increasing the external dimensions of a
truck (Department for Transport, 2005e). To take full advantage of the available
height clearances, however, many operators use high-cube trailers that are not
only taller but also run on smaller wheels closer to the road surface. Some
companies only operate a handful of double-deck trailers, whilst the leading UK

- 40 -
food retailer operates approximately 500 double-deckers (Adams, 2006, pers.
comm.)
Efficiency tests on double-deckers have proved promising. Focus (DIY)
conducted a nine-month feasibility trial. By replacing two single deck trailer trips
from their Tamworth DC to Skipton and Leeds respectively, the moving DD vehicle
saved almost half the mileage (and corresponding CO2 emissions), and increased
the average vehicle utilisation by 7% per mile (Department for Transport, 2005e).
In 2003 Somerfield introduced 28 double-deck semi-trailers to their fleet operating
out of their NDC at Wellington. Carrying 45 roll-cages, the financial savings of
these trailers were obvious, however, it was noted that fuel efficiency declined,
owing to the increase in cab/semi-trailer height differential (Department for
Transport, 2006d). Consumption of fuel per pallet-km was, nevertheless,
substantially improved.
Another often overlooked issue with double-deckers is the combination weight of
the internal lifting mechanism and the moveable deck, which together can weigh
between 15 and 16-tonnes (Adams, 2006 pers. com). When this is added to a
tractor weight, the overall tare weight not only reduces the maximum available
payload capacity of a DD quite considerably, but also accounts for a sizeable
proportion of the CO2 emitted by the truck even when operating to full capacity.
Recognising this issue, Van Eck, the Dutch trailer manufacturer, offers a DD
loading system weighing approximately 9-tonnes, which features an internal lift
combined with a conventional exterior tail-lift (Swallow, 2005).
The Department for Transport cautioned that by using double-deckers, some
companies, especially those that carry mixed loads, may not be able to maximize
vehicle utilisation by using double-deckers (Department for Transport, 2005e),
although, carriers of low-density products would see benefits. McKinnon &
Campbell (1997) estimated annual reductions in CO2 emissions of over half a
million tonnes and haulage cost savings of £340 million per annum with double-
decking of articulated vehicles carrying low-density loads. Articulated vehicle
traffic would also fall by 5%.

- 41 -
5.4.2 Increasing permitted EU weights & dimensions: Longer, heavier vehicles
‘Road trains’ in the Australian outback are quite common sights, and their use, it is
claimed, enhances productivity in areas with sparsely-distributed economic bases
(York & Maze, 1996). Likewise, much research has been undertaken into the
issue of increasing truck size in the US (Transportation Research Board, 2002),
although reaching national consensus on their use there has proved difficult,
owing to the legacy of different federal, state and local requirements (Clarke,
2000). Even assessing safety issues associated with longer, heavier vehicles
(LHVs) has been problematic because of a lack of reliable data collection methods
(Scopatz & DeLucia, 2000).
Within the EU, regulations permit a maximum vehicle length of 18.75m including
trailers (EU 96/53 EG). By combining a tractor and trailer and swap body, greater
overall lengths of up to 25.25m can be achieved in a so-called modular system.
This combination is based on the CEN standardized 7.82m long unit load carrier
and the 13.6m long semi-trailer (Swedish National Road Administration, 1999).
Since 1997, those countries using this ‘modular-concept’ have been exempt from
regulation (EU96/53 EG), allowing trucks in Sweden and Finland to operate up to
25.25m. Consequently, Sweden, Norway and Denmark have increased their
maximum vehicle weights to 60-tonnes, 50-tonnes and 48-tonnes respectively
(Ramberg, 2004). A Dutch trial, using the Swedish-Finnish truck lengths, has
recently been completed and initial results seem promising.
Nevertheless, the general public are not in favour of bigger trucks. A recent NOP
poll, (commissioned by ASLEF, the train drivers’ union) found that 67% of those
polled were against their introduction, with 86% of respondents in favour of a rail
alternative (Anon, 2006b). Whilst issues of safety and increased congestion have
been raised against LHVs, supporters of these vehicles claim that LHVs improve
fuel efficiency by an average of 20%, trip frequency is reduced by an average of
32.7% and cost savings are about 23% (Backman & Nordström, 2002; Ramberg,
2004).

- 42 -
It also appears that wear and tear on road surfaces is also reduced, as any
damage is affected by the weight per axle passing over the road (Swedish
National Road Administration, 1999). Trucks of 25.25m have 7 or 8 axles
compared with the 5 or 6 axles on a standard-regulation truck, meaning that
vehicles using the modular system actually have lower average weight per axle,
and therefore, potentially inflict less damage to road surfaces (Ramberg, 2004).
UK experience of LHVs
In the UK, two hauliers, Dick Denby and Stan Robinson, have been promoting the
use of LHVs, and the comparative characteristics of their rigs are displayed in
Table 6.
Table 6 Comparative LHV characteristics for Robinson’s & Denby’s rigs
Characteristics Robinson’s rig Denby’s Eco-Link Axles 11 8 Overall weight (tonnes) 84 60 Length 30m approx. 25.5m Capacity (imperial pallets) 52 42 Capacity (Euro pallets) 78 59 Fuel consumption 4.92mpg 6.42mpg Source: adapted from Basey (2006) & Anon (2005)
Denby’s rig conforms to current EU dimensions and during independent tests,
achieved better fuel consumption than the Robinson rig, yet the Robinson rig is
more practical as it requires only slight modification of the standard tractor and
semi-trailer (Basey, 2006), and although using 54% more fuel than a conventional
44-tonne truck, carries twice the payload (Anon, 2005). In addition, Denby’s Eco-
Link would take up less road space than conventional articulated trucks to carry
the same payload and overall trip frequency would be reduced (Weatherley, 2004).
Based on a major retailer’s actual weekly deliveries from a NDC to its RDCs, the
Eco-link in combination with DD and conventional single-deck trailers reduced
vehicle journeys by 35% (Basey, 2006).
Opponents of LHVs voice concerns that once permitted on motorways it would be
only a small step before ‘bigger lorries’ were allowed to use other roads in the UK
(Transport 2000, 2005), and increases in vehicle dimensions may limit access to
- 43 -
delivery addresses (Samuelson & Tilanus, 1997). Currently, DD do not generally
deliver to stores directly, although some major retailers are re-examining this
possibility (Adams, 2006, per. comm.).
As a much larger proportion of goods carried are already volume-constrained,
rather than weight-constrained, greater economic and environmental benefits
would be gained from increasing vehicle dimensions rather than increasing the
weight allowance (McKinnon, 2005). Recently, the Department for Transport has
commissioned TRL (and Heriot-Watt University) to re-examine the issue of LHVs
in the UK (TRL, 2006) and results from this desk study are expected in summer
2007.

- 44 -
6. CONCLUSIONS & KEY OUTSTANDING ISSUES ‘Green’ issues and transport are very much at the top of the political agenda at the
moment, with the recent, highly-publicised publication of the Stern and Eddington
reports. Not only are companies looking to reduce financial costs within their
business, but increasingly, attention is being focused on the environmental
consequences of their actions, and ways that these environmental costs may be
lessened. As a result, transport operations are now being more closely
scrutinised, with opportunities for improved transport efficiencies regularly being
sought.
This report has highlighted that there is considerable scope for improving transport
efficiency across the freight industry, and transport managers have a plentiful
supply of advice and guidance on measures that can be implemented to make
their operations more efficient, and, therefore, more sustainable.
What is noticeable, however, is that the format of this advice (mostly presented
through the government’s Freight Best Practice Programme) is given in a rather
fragmented, piecemeal way. Admittedly, there are some excellent case studies
outlining green ‘champions’ within the industry, but for a transport manager
making initial enquiries, there is no one source of guidance, nor indeed a
framework for them to systematically work through. Likewise, currently there is a
scarcity of academic studies (with some notable exceptions!) on ‘green’ transport
management, leaving plenty of possibilities for future work in this area.

- 45 -
REFERENCES Accenture (2003), Connecting with the Bottom Line. Accenture (2004), Consulting, Technology, Outsourcing. Accenture (2005), Executive Issues 2005. Adams, M. (2006), Personal Communications, Director, Trans-Dek, meeting at Heriot-Watt University, Edinburgh, 15th November, 2006. Allen,J. (1994) ‘Just-in-Time and the Environment’ , Comment issue no.3, Exel Logistics, Bedford. Anon (2006a), Box clever: Transforming home grocery shopping, Strategic Direction, Vol.22, No.9, pp.32-33. Anon (2006b), Heavy lorries banned after union campaign victory, The Locomotive Journal, January 2006, pp.6. Backman, H. & R. Nordström, (2002), Improved Performance of European Long Haulage Transport, TFK – Institutet för Transportforskning: Stockholm. Ballou, R.H. (1987), Basic Business Logistics: Transportation, Materials Management, Physical Distribution, 2nd Edition, Prentice-Hall, Inc: New Jersey. Basey, D. (2006), Will Britain catch the road train?, Logistics & Transport Focus, November 2006, pp.36-41. Bausch, D.O., G.G. Brown & D. Ronen (1995), Consolidating and dispatching truck shipments of Mobil Oil heavy petroleum products, Interfaces, Vol.25, No.2, pp.1-17. Brewer, P.J. & C.R. Plott (2002), A decentralized, smart-market solution to a class of back-haul transportation problems: Concept and experimental test beds, Interfaces, Vol.32, No.5, pp.13-36. Böge, S. (1994), The well-travelled yogurt pot: Lessons for new freight transport policies and regional production, World Transport Policy & Practice, Vol.1, No.1, pp.7-11. Bullock S. (2002), The Economic Benefits of Farmer’s Markets, Friends of the Earth. Clarke, J. & C. Smeeton (2003), Working time legislation: forthcoming changes, Logistics & Transport Focus, March, pp.18-22. Cooper, J. (1994), Logistics and Distribution Planning: Strategies for Management, 2nd Edition, Kogan Page: London.

- 46 -
Cooper J., M. Browne & M. Peters (1994), European Logistics: Markets, Management and Strategy, 2nd Edition, Blackwells: Oxford. Cranfield University, Sheffield Hallam University and CILT (2004), ‘The Efficiency of Reverse Logistics’ Department for Transport. Available for downloading from http://www.ciltuk.org.uk/pages/revlog Day, A. (1998), Getting logistics managers into the boardroom, Internal Journal of Physical Distribution & Logistics Management, Vol.28, No.9/10, pp.661-665. Department of the Environment, Transport and the Regions (1997), National Road Traffic Forecasts (Great Britain) 1997, Department of the Environment, Transport and the Regions: London. Department of the Environment, Transport and the Regions (1998a), Efficient JIT Supply Chain Management: Nissan Motor Manufacturing (UK) Ltd., Good Practice Case Study 374. Department of the Environment, Transport and the Regions (1998b), Energy Savings from Integrated Logistics Management: Tesco plc, Best Practice Programme, Good Practice Case Study 364. Department of the Environment, Transport and the Regions (1999a), Sustainable Development: A Strategy, Department of the Environment, Transport and the Regions: London. Department of the Environment, Transport and the Regions (1999b), Benchmarking vehicle utilisation and energy consumption: Measurement of Key Performance Indicators, Energy Consumption Guide 76, Department of the Environment, Transport and the Regions (2001), The Future Direction of the Powershift Programme: A Consultation Paper, Department of the Environment, Transport and the Regions: London.
Department of Trade and Industry, (2001), Overview of the home deliveries in the UK, DTI: London.
Department for Transport (2002), Fuel Champion saves Equivalent of 50 Trailers Loads of Carbon Dioxide a Year, Best Practice Programme, Good Practice Case Study 398, Department for Transport: London. Department for Transport (2003a), Key Performance Indicators for the Food Supply Chain, Benchmarking Guide 78, Department for Transport: London. Department for Transport (2003b), Reducing the Environmental Impact of Distribution: Transco National Logistics, Best Practice Programme, Good Practice Case Study 2101. Department for Transport (2003c), Telematics Guide, Best Practice Programme, Good Practice Guide 341, Department for Transport: London.

- 47 -
Department for Transport (2004a), Transport Ten Year Plan 2000, Department for Transport: London. Department for Transport (2004b), Save Fuel with Lower Rolling Resistance Tyres, Best Practice Programme, Department for Transport: London. Department for Transport (2004c), The Streamlined Guide to Truck Aerodynamic Styling, Transport Energy Best Practice Programme. Department for Transport (2004d), Fuel Saving Tips, Energy Best Practice Programme. Department for Transport (2004e), Proactive Driver Performance Management keeps Fuel Efficiency on Track, Department for Transport: London. Department for Transport (2005a), Advice on the new Working Time Regulations for Mobile Workers in the Road Transport Sector, Department for Transport: London. Department of Transport (2005b), Make Back-hauling Work for You, Freight Best Practice Guide, Department for Transport: London. Department for Transport (2005c), Efficient Public Sector Fleet Operations, Freight Best Practice Programme, HMSO: London. Department for Transport (2005d), In-fleet Trials of Fuel Saving Interventions for Trucks, Freight Best Practice Programme, HMSO: London. Department for Transport (2005e), Focus on Double Decks, Freight Best Practice Programme, HMSO: London. Department for Transport (2006a), Transport Statistics Great Britain 2006, 32nd Edition, TSO: London. Department for Transport (2006b), Road Freight Statistics, 2005, Transport Statistics Bulletin, Department for Transport: London. Department for Transport (2006c), Delivering the Goods: Guidance on Delivery Restrictions, Department for Transport: London. Department for Transport (2006d), Smoothing the flow at TNT Express and Somerfield using Truck Dynamic Styling, Freight Best Practice Programme, HMSO: London. DON-BUR (2006), Eco-Stream – Aerodynamic Sloping Roof Profile, www.don-bur.co.uk/DON-BUR_News.htm, accessed 29th November 2006. Dowlatshahi, S. (1999), A modelling approach to logistics in concurrent engineering, European Journal of Operational Research, Vol.115, pp.59-76.

- 48 -
Dowlatshahi, S. (2000), Developing a theory of reverse logistics, Interfaces, Vol.30, No.3, pp.143-155. Driver and Vehicle Licensing Agency (2006), Vehicle Licensing Statistics, 2005, Department for Transport: London. Efficient Consumer Response Europe (2000), The Transport Optimisation Report, University of St. Gallen, ECR Europe. ETSU & The Motor Industry Research Association (2001), Truck Aerodynamic Styling, Good Practice Guide 308, Energy Efficiency Best Practice Programme. European Commission (2000), Good Practice in Freight Transport: A Sourcebook, Office of the Official Publications of the European Communities: Luxembourg. European Commission (2001), European Transport Policy for 2010: Time to Decide, White Paper, Office of the Official Publications of the European Communities: Luxembourg. Eurostat (2006), Road Freight Transport 2000-2004: Average Vehicle Load and Regional Aspects, Statistics in Focus, Eurostat: Luxembourg. Fawcett, S.E. & J.A.Ogden, G.M.Magram & B. Cooper (2006), Organizational commitment and governance for supply chain success, Internal Journal of Physical Distribution & Logistics Management, Vol.36, No.1, pp.22-35. Feitzinger, E. & H.L. Lee (1997), Mass customization at Hewlett Packard: The power of postponement, Harvard Business Review, Vol.75, No.1, pp.116-121. Fernie, J., F. Pfab & C. Marchant (2000), Retail grocery logistics in the UK, International Journal of Logistics Management, Vol.11, No.2, pp.83-90. Freight Transport Association (2003), Solving the Skills Shortage 2003, Conference Report, 27th October 2003, FTA. Freight Transport Association (2006a), Fuel Management Guide, FTA: HMSO: London. Freight Transport Association (2006), Delivering the Goods: A Toolkit for Improving Night-time Deliveries, FTA. García-Arca J., J.C. Prado-Prado & A. García-Lorenzo (2006), Logistics improvement through packaging rationalization: A practical experience, Packaging Technology & Science, (in press). Garnett, T. (2003), Wise Moves: Exploring the Relationship between Food, Transport and CO2, London: Transport 2000.

- 49 -
Giunipero, L., R.B. Handfield, R. Eltantawy, Supply management’s evolution: key skills set for the supply manager of the future, International Journal of Operations & Production Management, Vol.26, No.7, pp.822-844. Gorick, J, (2006), Running on empty?, Logistics & Transport Focus, Volume 8, No.10, December 2006, pp.25-26. Grant, D.B., D.M. Lambert, J.R. Stock & L.M. Ellram (2006), Fundamentals of Logistics Management, McGraw Hill Education: Maidenhead. Gustaffson, K., Jonson, G., Smith, D. & Sparks, L. (2006), Retail Logistics & Fresh Food Packaging, Kogan Page, London. Gutierrez, W.T., B.Hassan, R.H.Croll & W.H.Rutledge (1996), Aerodynamics overview of the ground transportation systems (GTS) project for heavy vehicle drag reduction, paper given to SEA International Congress & Exposition, Detroit, Michigan. Hagan, P. (2005), Skills for life, Commercial Motor,15th December 2005, pp.36-7. Hammache, M., M. Michaelian & F. Browland (2001), Aerodynamic forces on truck models, including two trucks in tandem, Califormia PATH research report, UCB-ITS-PRR-2001-27. Health & Safety Commission (1999), The Management of Health & Safety at Work Regulations, Approved Code of Practice, Statutory Instrument No.3242, Health & Safety Executive: London. Health & Safety Executive (2000), Injuries and Ill Health caused by Handling in the Food and Drink Industries, Food Information Sheet No.23, HSE Information Sheet. Henderson, C. (2005), Blade Runner: The next transport revolution, Evolution of Modern Traction Conference, Imperial College, London, 5 November 2005. Hesse, M. (2002), Shipping news: the implications of electronic commerce for logistics and freight transport, Resources Conservation & Recycling, Vol.36, No.3 pp.211-240. HM Revenue & Customs, http://hmrc.gov.uk, accessed on 12th December 2006. HM Treasury, http://www.hm-treasury.gov.uk, accessed on 12th December 2006. Hoare N.P. & J.E. Beasley (2001), Placing boxes on shelves: A case study, Journal of Operational Research Society, Vol.52, pp.605-614. Hucho, W-H. & G. Sovran (1993), Aerodynamics of road vehicles, Annual review of fluid mechanics, Vol.25, pp.485-537. IGD (2003), Transport Optimisation: Sharing Best Practice in Distribution Management, IGD: Watford.

- 50 -
International Energy Agency (2004), Biofuels for Transport: An International Perspective, OECD: Paris. Jahre, M. & C. J. Hatteland (2004), Packages and physical distribution: Implications for integration and standardisation, International Journal of Physical Distribution and Logistics Management, Vol.34, No.2, pp.123-139. Khare, M. & P. Sharma (2003), Fuel options, Chapter 9 in Hensher, D.A. & K.J. Button (eds.), Handbook of Transport & the Environment, Elsevier: Amsterdam. Lamming, R. & J. Hampson, (1996), The environment as a supply chain management issue, British Journal of Management, Vol.7, Issue 1, Special Issue, pp.45-64. Léonardi, J. & M. Baumgartner (2004), CO2 efficiency in road freight transportation: Status quo, measures and potential, Transportation Research Part D, Vol.9, pp.451-464. Lowe, D. (2007), The Transport Manager’s and Operator’s Handbook 2007, Kogan Page: London. Lyons, G. & K. Chatterjee (2002), Transport Lessons from the Fuel Tax Protests of 2000, Ashgate: London. Mackie P.J. & S.B. Harding (1982), The case for heavier goods vehicles – some new evidence, Traffic Engineering & Control, Vol.23, November, pp.544-546. Mansell, G. (2001), The development of online freight markets, Logistics & Transport Focus, Vol.3 No.7, pp.18-21. Mansell, G. (2006) ‘Transport Tendering Comes of Age’ Logistics & Transport Focus, May 2006. Mason, R., D. Simons, C. Peckham & T. Wakeman (2002) ‘Life-cycle Modelling CO2 Emissions for Lettuces, Apples and Cherries.’ available at the Department for Transport website: http://www.dft.gov.uk/stellent/groups/dft_freight/documents/page/dft_freight_508272.hcsp McIntyre, K. (2007), Delivering sustainability through supply chain management, Chapter 15 in D.Waters (ed.), Global Logistics and Distribution Planning, 5th Edition, Kogan Page: London. McKinnon, A.C. (1999), The effect of traffic congestion on the efficiency of logistical operations, International Journal of Logistics: Research & Applications, Vol.2, No.2, pp.111-128.

- 51 -
McKinnon, A.C. (1999b), Vehicle utilisation and Energy Efficiency in the Food Supply Chain, Full Report of the Service Performance Indicator Survey, Heriot Watt University, Edinburgh, November. McKinnon, A.C. (1999c), A Logistical Perspective on Fuel Efficiency of Road Freight Transport, in Improving Fuel Efficiency in Road Freight: The Role of Information Technologies, International Energy Agency and European Conference of Ministers of Transport, OECD, ECMT & IEA, Workshop Proceedings, Paris. McKinnon, A.C. (2000a), International Logistics, in Tayeb, M. (ed.), International Business: Theories, Policies and Practices, Pearson Education: London. McKinnon, A.C. (2000b), Sustainable distribution: opportunities to improve vehicle loading, UNEP Industry and Environment, Vol.23, No.4, October-December 2000, pp.26-30. McKinnon A.C. (2002), Influencing Company Logistics Management, International Seminar: Managing the Fundamental Drivers of Transport Demand, European Conference of Ministers of Transport, Brussels. McKinnon, A.C. (2003a), Logistics and the Environment, Chapter 37 in Hensher, D.A. & K.J. Button (eds.), Handbook of Transport & the Environment, Elsevier: Amsterdam. McKinnon, A.C. (2003b), The Effects of ICT and E-commerce on Logistics; A review of Policy Issues, BPR Logistics. McKinnon, A.C. (2004), Benchmarking the Efficiency of Retail Deliveries in the UK ‘BRC Solutions’ Magazine, British Retail Consortium. McKinnon, A.C. (2005), The economic and environmental benefits of increasing maximum truck weight, The British experience, Transportation Research Part D, Vol.10, pp.77-95. McKinnon, A.C. (2006), Personal communications, 5th October 2006. McKinnon, A.C. (2006), Road Transport Optimisation, Chapter 17 in D. Waters (ed.), Global Logistics and Distribution Planning, 5th Edition, Kogan Page: London. McKinnon, A.C. (2007), CO2 Emissions from the Freight Transport Sector, paper prepared for the Climate Change Working Group of the Commission for Integrated Transport, London (forthcoming). McKinnon, A.C. & Braithwaite, A. (2005), European chemical supply-chain: Threats and opportunities, Logistics & Transport Focus, April 2005, pp.30-35. McKinnon A.C. & J. Campbell (1997), Opportunities for Consolidating Volume-constrained loads in Double-deck and High-cube Vehicles, Christian Salvesen Logistics Research Paper No.1, Heriot-Watt University, Edinburgh.

- 52 -
McKinnon, A.C. & M. Forester (2001), Effects of product design and packaging on freight vehicle utilisation, Proceedings of the 6th Logistics Research Network Conference, Edinburgh, UK, 12-14th September 2001. McKinnon, A.C. & Y. Ge (2004), Use of a synchronised vehicle audit to determine opportunities for improving transport efficiency in a supply chain, International Journal of Logistics: Research & Applications, Vol.7, No.3, pp.219-238.
McKinnon, A.C. & D. Tallam (2003), Unattended delivery to the home: an assessment of the security implications, International Journal of Retail & Distribution Management, Vol.31 No.1, pp. 30-41;
McKinnon, A.C., Y.Ge & D.Leuchars (2003), Analysis of Transport Efficiency in the UK Food Supply Chain, Full Report of the 2002 Key Performance Indicator Survey, Logistics Research Centre, Heriot-Watt University, Edinburgh. Meczes, R. (2005), A loaded question, Commercial Motors, 21st July, pp.48-51. Minn,H. & A. Emam (2002), Developing the profiles of truck drivers in their successful recruitment and retention: A data mining approach, International Journal of Physical Distribution & Logistics Management, Vol.33, No.2, pp.149-162. Modi, V.J., S.S.Hill & T.Yokomizo (1995), Drag reduction of trucks through boundary-layer control, Journal of Wind Engineering & Industrial Aerodynamics, Vol. 54-55, pp.583-594. OECD (2004), Digital delivery in distribution & logistics, OECD: Paris.
Pagh J. D. & M.C. Cooper (1998), Supply chain postponement and speculation strategies: How to choose the right strategy, Journal of Business Logistics, Vol.19, No.2, pp.13-32. Penman, I. (1997), Efficient unit loads, Logistics Focus, Vol.5, No.5, June 2, pp.4-6. Potter, A., C. Lalwani, S. Disney & H. Velho (2003), Modelling the impact of factory gate pricing on transport & logistics, Proceedings of the 8th International Symposium on Logistics, pp.625-630. Prendergast, G. (1995), The logistical implications of the EC directive on packaging and packaging waste, Logistics Information Management, Vol.8, No.3, pp.10-17. Prendergast, G. & L. Pitt (1996), Packaging, marketing, logistics and the environment: Are there trade-offs? International Journal of Physical Distribution & Logistics Management, Vol.26, No.6, pp.60-72.

- 53 -
Punakivi M., H. Yrjola & J. Holmstrom (2001), Solving the last mile issue: reception box or delivery box?, International Journal of Physical Distribution and Logistics, Vol.31, No.6, pp. 427-439. Rahman, S. (2003), Reverse logistics: An overview and a causal model, Chapter 38 in Hensher, D.A. & K.J. Button (eds.), Handbook of Transport & the Environment, Elsevier: Amsterdam. Ramberg, K. (2004), Fewer trucks improve the environment: three short become two long, if the EU follows the example set by Sweden and Finland, Transport and Infrastructure, Svenskt Näringsliv. Rogers, D.S. & R. Tibben-Lembke (1998), Going backwards: Reverse logistics trends & practices, Centre for Logistics Management, University of Nevada, Reno. Rogers, D.S. & R. Tibben-Lembke (2001), An examination of reverse logistics practices, Journal of Business Logistics, Vol.22, No.2, pp.129-148. Rosenau, W.V., D. Twede, M.A. Mazzeo, S. P. Singh (1996), Returnable/reusable logistics packaging: a capital budgeting investment decision framework, Journal of Business Logistics, Vol.17, No.2, pp.139-165. Ross, S. & D. Evans (2003), The environmental effect of reusing and recycling a plastic-based packaging system, Journal of Cleaner Production, Vol.11, pp.561-571. Rowat, C. (2006), Collaboration for improved product availability, Logistics & Transport Focus, April 2006, pp.18-20. Samuelson, A. & B. Tilanus (1997), A framework efficiency model for goods transportation, with an application to regional less-than-truckload distribution, Transport Logistics, Vol.1, No.2, pp.139-151. Samuelson, A. & B. Tilanus (2002), A framework efficiency model for goods transportation, with an application to regional less-than-truckload distribution, Chapter 22 in A. McKinnon et al (eds.), Transport Logistics, Edward Elgar Publishing: Cheltenham. Sankaran, J.K., A. Gore & B. Coldwell (2005), The impact of road traffic congestion on supply chains: insights from Aukland, New Zealand, International Journal of Logistics: Research & Applications, Vol.8, No.2, pp.159-180. Sarkis, J., L.M. Meade & S. Talluri (2000), E-logistics and the natural environment, Supply Chain Management: An International Journal, Vol.9, No.4, pp.303-321. Saunders, C., A. Barber & G. Taylor (2006), Food miles – Comparative energy/emissions performance of New Zealand’s Agriculture Industry, Research Report No. 285, July, Lincoln University, New Zealand.

- 54 -
Schipper, L.J. & L. Fulton (2003), Cardon dioxide emissions from transportation: Trends, driving factors, and forces for change, Chapter 11 in Hensher, D.A. & K.J. Button (eds.), Handbook of Transport & the Environment, Elsevier: Amsterdam. Scopatz, R.A. & B.H. DeLucia (2000), Longer Combination Vehicle Safety Data Collection, American Automobile Association: Washington. Scottish Executive (2005), Examining Sustainable Ways to Improve the Efficiency of the Road Freight Transport Sector, Final Report, June 2005. Sonneveld ,K. (2000), What drives (food) packaging innovation?, Packaging Technology & Science, Vol.13, pp.29-35. Swallow K. (2005), Double Dutch, Commercial Motor, 21st July 2005, pp.62-63. Swedish National Road Administration (1999), Legal Loading: Weight and Dimension Limits for Heavy Vehicles, Ref. No. VV88216, Swedish National Road Administration, Vägverket, Borlänge, Sweden. Swedish National Road Administration (2002), Sustainable Fuels: Introduction of Biofuels, Ref. 220:144, Swedish National Road Administration, Vägverket, Borlänge, Sweden. Swenseth, S.R. & F.P. Buffa, (1990), Just-in-time: Some effects on the logistics function, International Journal of Logistics Management, Vol.1, No.2, pp.25-34. Transport 2000 (2005), Road Haulage Industry wants Bigger Lorries…Not on my Street, A briefing for communities from Transport 200 Campaigns, Issued 1 March 2005. Transportation Research Board, (2002), Regulation of Weights, Lengths and Widths of Commercial Motor Vehicles, Special Report (Committee for the Study of the Regulations of Weights, Lengths and Widths of Commercial Road Vehicles), Transportation Research Board, Washington DC. TRL (2006), Stakeholder opinion sought for longer & vehicle goods vehicle study, Press Release 27th October 2006. Tsoulfas, G.T. & C.P. Pappis (2005), Environmental principles applicable to supply chains design and operation, Journal of Cleaner Production, Vol.14, pp.1593-1602. Twede D., R.H.Clarke & J. A. Tait (2000), Packaging postponement: A global packaging strategy, Packaging Technology & Science, Vol.13, pp.103-115. USDAW (2004), Working-time – Promoting Regulation and Protection, An Executive Council Statement to the 2004 ADM. Vasquez, D., M.Bruce & R.Studd (2003), A case study exploring the packaging design management process with a UK food retailer, British Food Journal, Vol.105, No.9, pp.602-617.

- 55 -
van Hoek, R. I. & R. van Dierdonck (2000), Postponed manufacturing supplementary to transportation services?, Transportation Research Part E, Vol.36, pp.205-217. Weatherley B. (2004), At the Double!, Commercial Motor, 3 June 2004, pp.50-53. Wu, H-J. & S.C. Dunn (1995), Environmentally responsible logistics systems, International Journal of Physical Distribution & Logistics Management, Vol.25, No.2, pp.20-38. Yang , B. A. Potter & C. Lalawani (2004), A simulation study of despatch bay performance, Paper 11 in Lalwani, C. R. Mason, A. Potter & B. Yang (eds.), Transport in Supply Chains, Cardiff University: Cardiff. Yang B., Y. Yang & J. Wijngaard (2005), Impact of postponement on transport: an environmental perspective, International Journal of Logistics Management, Vol.16, No.2, pp.192-204. York, J. & T.H. Maze (1996), Applicability of performance-based standards for U.S. truck size and weight regulations, Semisequicentennial Transportation Conference Proceedings, Iowa State University, Ames, Iowa, May 1996. Zografos K. G. & I.M. Giannouli (2001), Development and Application of a Methodological Framework for Assessing Supply Chain Management Trends, International Journal of Logistics, Vol.4, No.2, pp.153-190.

- 56 -
Uncertainty Although there are some measures to assess the effects of each of the proposed improvements, there is still uncertainty about the relationships between all the factors as they are interdependent. Trends Likewise, it is difficult to predict future trends because of the complex inter-relationships between the various parameters in the system. Methods/Techniques/Tools For academic studies, conducted a literature search using library databases covering the major journals in the logistics and transport field. In addition other operations management journals were considered. Additionally, guidance advice notes published by the government were reviewed. Sectors All Geography Global, with emphasis on the UK