a-level economics feedback on units 1&2...
TRANSCRIPT

Version 1.0
AQA qualification training A-level Economics Feedback on Units 1&2 (ECON1&ECON2) Pre-event reading (To get the most from the online training, please read this document in advance.)
Published date: Autumn 2013 version 1.0
08 Fall

Permission to reproduce all copyright materials have been applied for. In some cases, efforts to contact copyright holders have been unsuccessful and AQA will be happy to rectify any omissions of acknowledgements in future documents if required.

Contents Page
ECON1 June 2013 Question Paper 4 ECON1 June 2013 Mark Scheme 22 ECON2 June 2013 Question Paper 43 ECON2 June 2013 Mark Scheme 58 Price elasticity of demand task sheet 82 Exemplars 1 & 2 ECON2 Context 1 85 Exemplars 3 & 4 ECON2 Context 1 86 Exemplars 5, 6 & 7 ECON1 Context 2 87 Exemplars 8, 9 & 10 ECON1 Context 1 88 Exemplars 11 & 12 ECON2 Context 2 90 Exemplar 13 ECON1 Context 1 Part [03] 91 Exemplar 14 ECON1 Context 1 Part [03] 92 Exemplar 15 ECON2 Context 2 Part [07] 93 Exemplar 16 ECON2 Context 2 Part [07] 94 Exemplar 17 Application ECON2 04 95 Exemplar 19 ECON1 Part 08 97 Exemplar 21 ECON1 08 Analysis 99 Exemplar 22 ECON1 08 Analysis Activity 1 102 Exemplar 23 ECON1 08 Analysis Activity 2 103 Exemplar 28 Evaluation clip 1 ECON2 105 Exemplar 30 Evaluation clip 2 ECON2 106 Exemplar 32 ECON1 Part [08] Conclusions 107 Exemplar 34 ECON1 Part [04] (Full 25 marks)
110
3

General Certificate of EducationAdvanced Subsidiary ExaminationJune 2013
Economics ECON1Unit 1 Markets and Market Failure
Monday 13 May 2013 9.00 am to 10.15 am
For this paper you must have: an objective test answer sheet a black ball-point pen an AQA 8-page answer book.You may use a calculator.
Time allowed 1 hour 15 minutes
Section A (ECON1/1) Answer all questions on your objective test answer sheet. Use a black ball-point pen. Do not use pencil. Do all rough work in this question paper, not on your objective test answer sheet.
Section B (ECON1/2) Answer EITHER Context 1 OR Context 2. Use black ink or black ball-point pen. Pencil should only be used for drawing. Write the information required on the front of your answer book. The Examining Body for this
paper is AQA. The Paper Reference is ECON1/2.
Information The maximum mark for this paper is 75. There are 25 marks for Section A. Each question carries one mark. No deductions will be made
for wrong answers. There are 50 marks for Section B. The marks for questions are shown in brackets. You will be marked on your ability to: – use good English – organise information clearly – use specialist vocabulary where appropriate.
Advice You are advised to spend no more than 25 minutes on Section A and at least 50 minutes on
Section B.
ECON1G/K92229/Jun13/ECON1 6/6/6/6 4
G/K92229/Jun13/ECON1
Section A: Objective Test
Answer all questions in Section A.Each question carries 1 mark. No deductions will be made for wrong answers.
You are advised to spend no more than 25 minutes on Section A.
For each question there are four alternative responses, A, B, C and D. When you have selected the response which you think is the best answer to a question, mark this response on your objective test answer sheet. If you wish to change your answer to a question, follow the instructions on your
objective test answer sheet.
1 The main economic objective of firms in a market economy is most likely to be the
A achievement of economies of scale.
B maximisation of consumer satisfaction.
C achievement of an efficient allocation of resources.
D maximisation of profits.
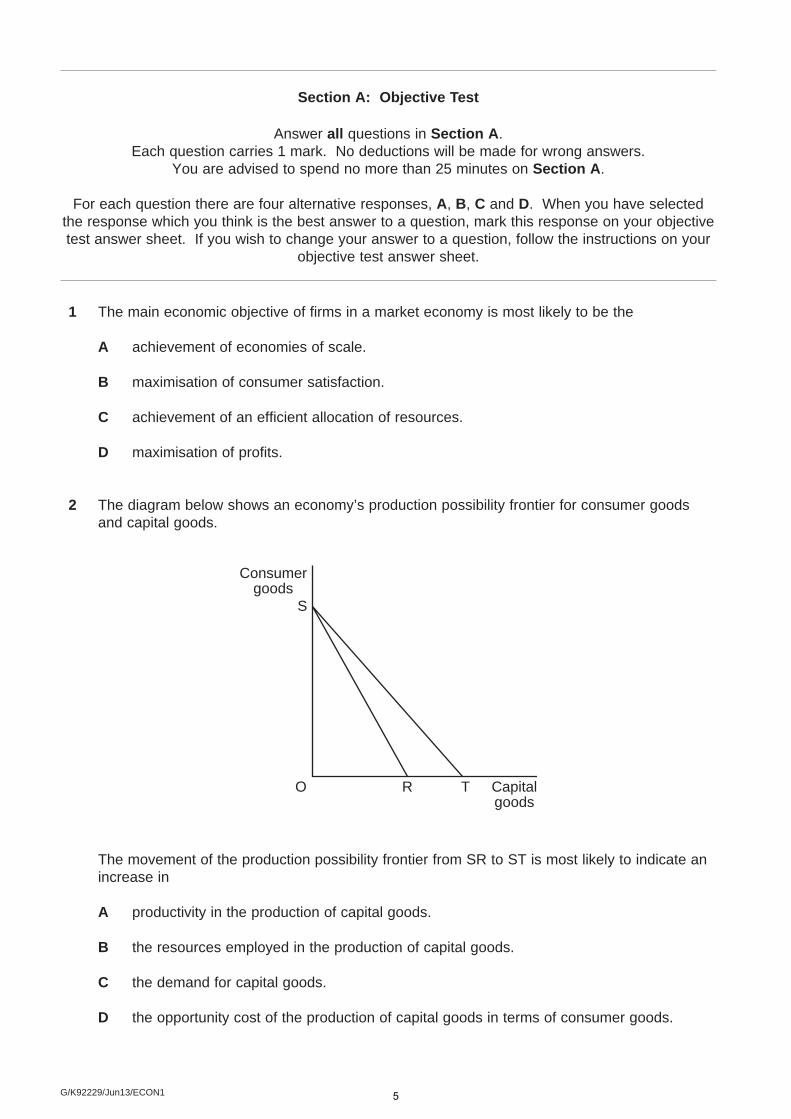
2 The diagram below shows an economy’s production possibility frontier for consumer goods and capital goods.
Consumergoods
S
O R T Capitalgoods
The movement of the production possibility frontier from SR to ST is most likely to indicate an increase in
A productivity in the production of capital goods.
B the resources employed in the production of capital goods.
C the demand for capital goods.
D the opportunity cost of the production of capital goods in terms of consumer goods.
5
G/K92229/Jun13/ECON1
Turn over
3 The price elasticity of supply for most goods is
A zero.
B between zero and –1.
C between –1 and minus infinity.
D positive.
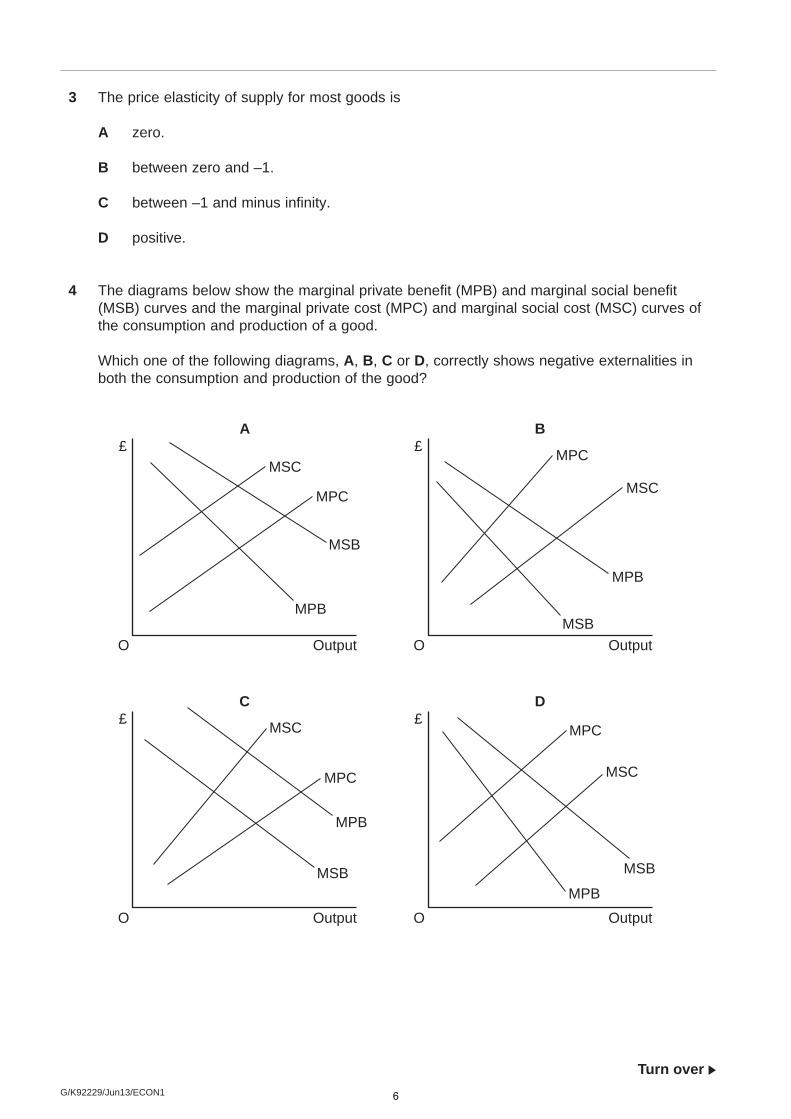
4 The diagrams below show the marginal private benefit (MPB) and marginal social benefit (MSB) curves and the marginal private cost (MPC) and marginal social cost (MSC) curves of the consumption and production of a good.
Which one of the following diagrams, A, B, C or D, correctly shows negative externalities in both the consumption and production of the good?
£
O
A
Output
MSC
MPC
MSB
MPB
£
O
B
Output
MSC
MPC
MSB
MPB
£
O
C
Output
MSC
MPC
MSB
MPB
£
O
D
Output
MSC
MPC
MSB
MPB
6

G/K92229/Jun13/ECON1
5 Which one of the following is most likely to lead to greater labour productivity in an industry?
A An increase in market demand
B A fall in wages in the industry
C An increase in the number of firms in the industry
D An increase in capital investment in the industry
6 The table below indicates various types of market failure, the consequence of each of these failures and examples of possible intervention.
Situation Type of market failure
Consequence of market failure Example of intervention
A Factor immobility Inefficient allocation of resources Increase in indirect taxation
B Public goods Not provided Government provision
C Demerit goods Over-consumed Maximum price controls
D Merit goods Under-provided Minimum price controls
In which one of these situations is the example of intervention most appropriate?
A Situation A
B Situation B
C Situation C
D Situation D
7
G/K92229/Jun13/ECON1
Turn over
7 The existence of scarcity in an economy implies that
A there are no free goods.
B there are no public goods.
C individuals must make choices.
D there has been a misallocation of resources.
8 An increase in UK incomes leads to an increase in demand for holidays abroad and a decrease in demand for holidays in the UK. It can therefore be concluded that
A holidays in the UK are an inferior good while holidays abroad are a normal good.
B the demand for holidays abroad is income elastic while the demand for holidays in the UK is income inelastic.
C there is a negative cross price elasticity of demand between holidays abroad and holidays in the UK.
D holidays abroad have a high price elasticity of demand while holidays in the UK have a low price elasticity of demand.
9 The UK Government currently subsidises the building of social housing. Social housing is provided to low income households at rents which are lower than the free market rent.
Which one of the following would provide an economic justification for these subsidies?
A The unequal distribution of income and wealth caused by the free market results in an unsatisfactory allocation of resources.
B Subsidising low cost housing reduces inequalities in the distribution of wealth.
C Social housing is a public good because it is both non-rival and non-excludable.
D There is market failure in the housing market because of the existence of missing markets.
8
G/K92229/Jun13/ECON1
10 Which one of the following best describes the relationship between the demand for air travel and the demand for airline pilots?
A Composite demand
B Derived demand
C Joint demand
D Complementary demand
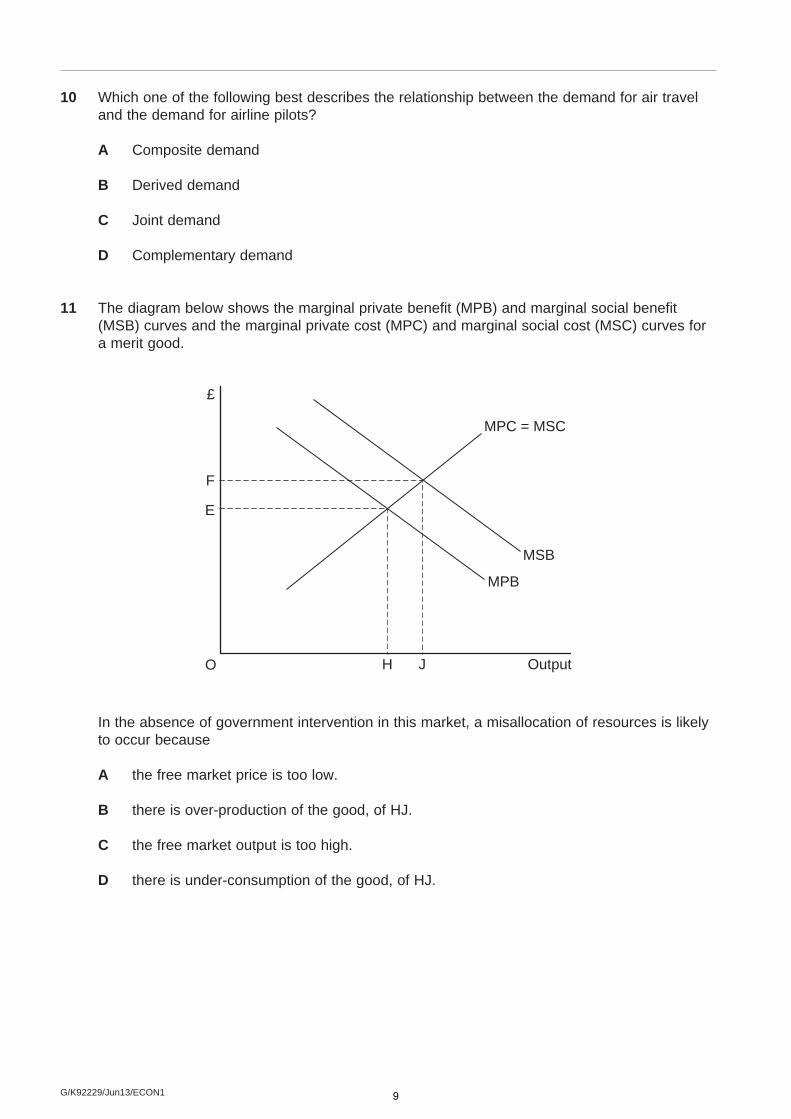
11 The diagram below shows the marginal private benefit (MPB) and marginal social benefit (MSB) curves and the marginal private cost (MPC) and marginal social cost (MSC) curves for a merit good.
£
MPC = MSC
MPB
MSB
F
E
O OutputH J
In the absence of government intervention in this market, a misallocation of resources is likely to occur because
A the free market price is too low.
B there is over-production of the good, of HJ.
C the free market output is too high.
D there is under-consumption of the good, of HJ.
9

G/K92229/Jun13/ECON1
12 The diagram below shows the demand (D) and supply (S) curves for cigarettes.
O 50 60
S2
S1
9
D
Quantity
Price ofcigarettes
(£)
65
The government imposes an indirect tax on cigarettes which shifts the supply curve from S1 to S2. Which one of the following, A, B, C or D, shows the share of the total tax revenue paid by producers and the share paid by consumers?
Producers (£) Consumers (£)
A 50 150
B 150 50
C 0 200
D 450 360
13 When money is used as a medium of exchange,
A barter or swapping of goods is likely to become more common.
B trade is likely to increase.
C the relative prices of goods never change.
D specialisation and the division of labour are made more difficult.
Turn over 10
G/K92229/Jun13/ECON1
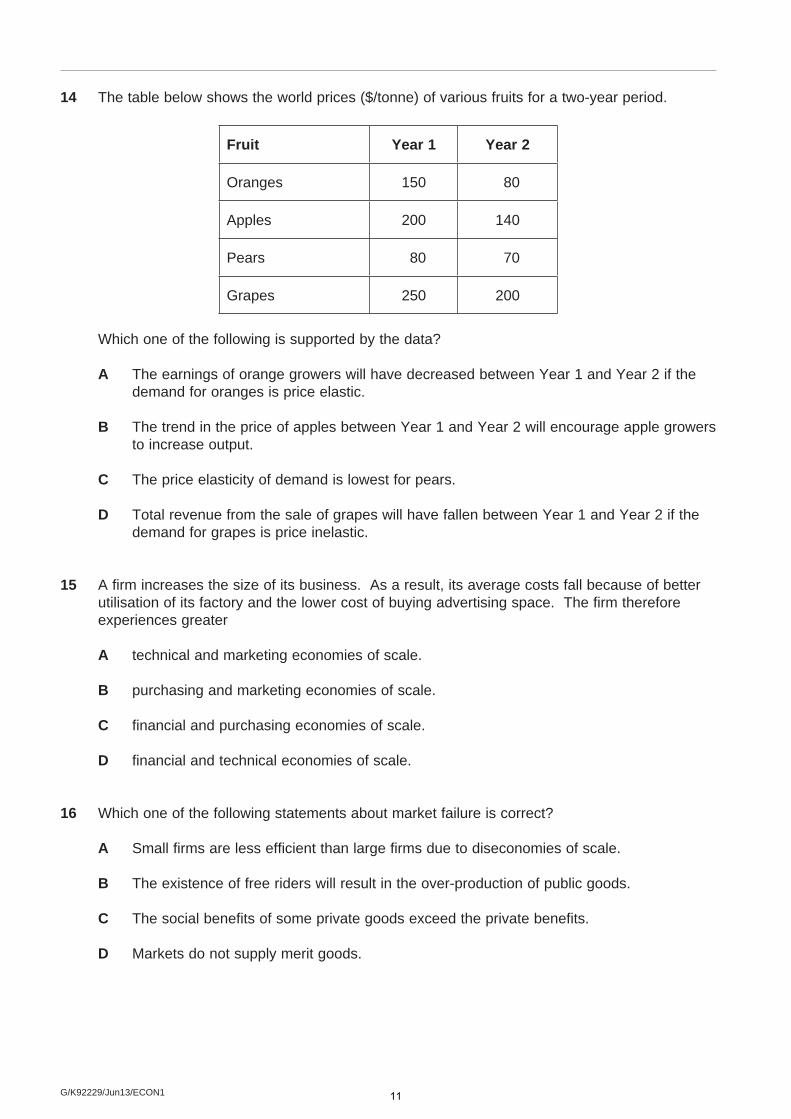
14 The table below shows the world prices ($/tonne) of various fruits for a two-year period.
Fruit Year 1 Year 2
Oranges 150 80
Apples 200 140
Pears 80 70
Grapes 250 200
Which one of the following is supported by the data?
A The earnings of orange growers will have decreased between Year 1 and Year 2 if the demand for oranges is price elastic.
B The trend in the price of apples between Year 1 and Year 2 will encourage apple growers to increase output.
C The price elasticity of demand is lowest for pears.
D Total revenue from the sale of grapes will have fallen between Year 1 and Year 2 if the demand for grapes is price inelastic.
15 A firm increases the size of its business. As a result, its average costs fall because of better utilisation of its factory and the lower cost of buying advertising space. The firm therefore experiences greater
A technical and marketing economies of scale.
B purchasing and marketing economies of scale.
C financial and purchasing economies of scale.
D financial and technical economies of scale.
16 Which one of the following statements about market failure is correct?
A Small firms are less efficient than large firms due to diseconomies of scale.
B The existence of free riders will result in the over-production of public goods.
C The social benefits of some private goods exceed the private benefits.
D Markets do not supply merit goods.
11

G/K92229/Jun13/ECON1
Turn over
17 A misallocation of resources is most likely to occur in monopoly if
A other firms enter the industry.
B higher prices are charged than under competitive conditions.
C market output increases.
D there are economies of scale.
18 The diagram below shows the marginal private benefit (MPB) and marginal social benefit (MSB) curves and the marginal private cost (MPC) and marginal social cost (MSC) curves for Good X produced by a firm. The free market equilibrium position is at point J.
O
H
MPB = MSB
MSC
MPC
Output
£
G
FE
J
Which one of the following government policies should be used to correct the market failure that exists at point J?
A A per unit subsidy of FH
B A per unit tax of FG
C A per unit subsidy of EG
D A per unit tax of EG
12
G/K92229/Jun13/ECON1
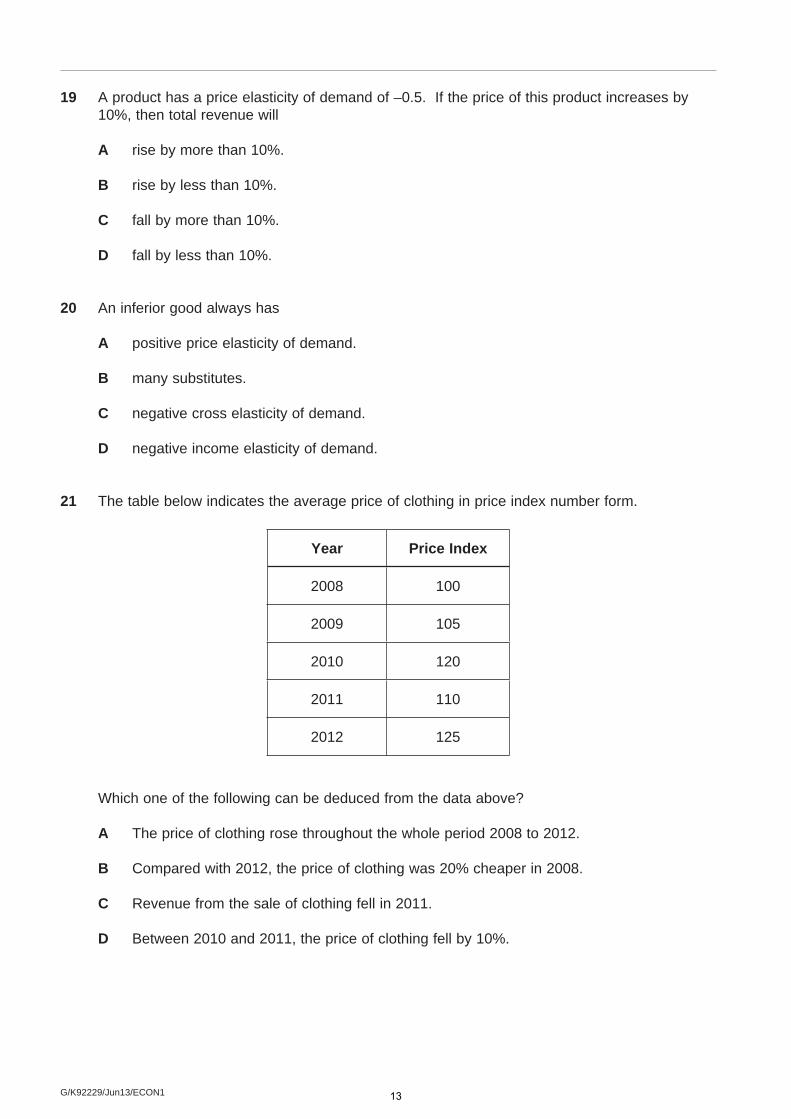
19 A product has a price elasticity of demand of –0.5. If the price of this product increases by 10%, then total revenue will
A rise by more than 10%.
B rise by less than 10%.
C fall by more than 10%.
D fall by less than 10%.
20 An inferior good always has
A positive price elasticity of demand.
B many substitutes.
C negative cross elasticity of demand.
D negative income elasticity of demand.
21 The table below indicates the average price of clothing in price index number form.
Year Price Index
2008 100
2009 105
2010 120
2011 110
2012 125
Which one of the following can be deduced from the data above?
A The price of clothing rose throughout the whole period 2008 to 2012.
B Compared with 2012, the price of clothing was 20% cheaper in 2008.
C Revenue from the sale of clothing fell in 2011.
D Between 2010 and 2011, the price of clothing fell by 10%.
13

G/K92229/Jun13/ECON1
Turn over
22 Which one of the following is most likely to be an example of the immobility of a factor of production? Workers’ unwillingness to
A change jobs.
B accept lower wages.
C improve productivity.
D attend training courses.
23 Market failure arises when
A prices rise in response to excess demand.
B no account is taken of positive externalities in consumption.
C firms are unprofitable and go out of business.
D costs increase as firms expand their production.
24 The diagram below illustrates the market demand (D) and supply (S) curves for a good. The production of the good creates a negative externality.
O Quantity
D
S
Q1Q2
P2
P1
P3
Price
To reduce production and consumption of the good to OQ2, the government could impose a
A price ceiling of OP3.
B tax of P2P3.
C minimum price of OP2.
D tax of P2P1.
14
G/K92229/Jun13/ECON1
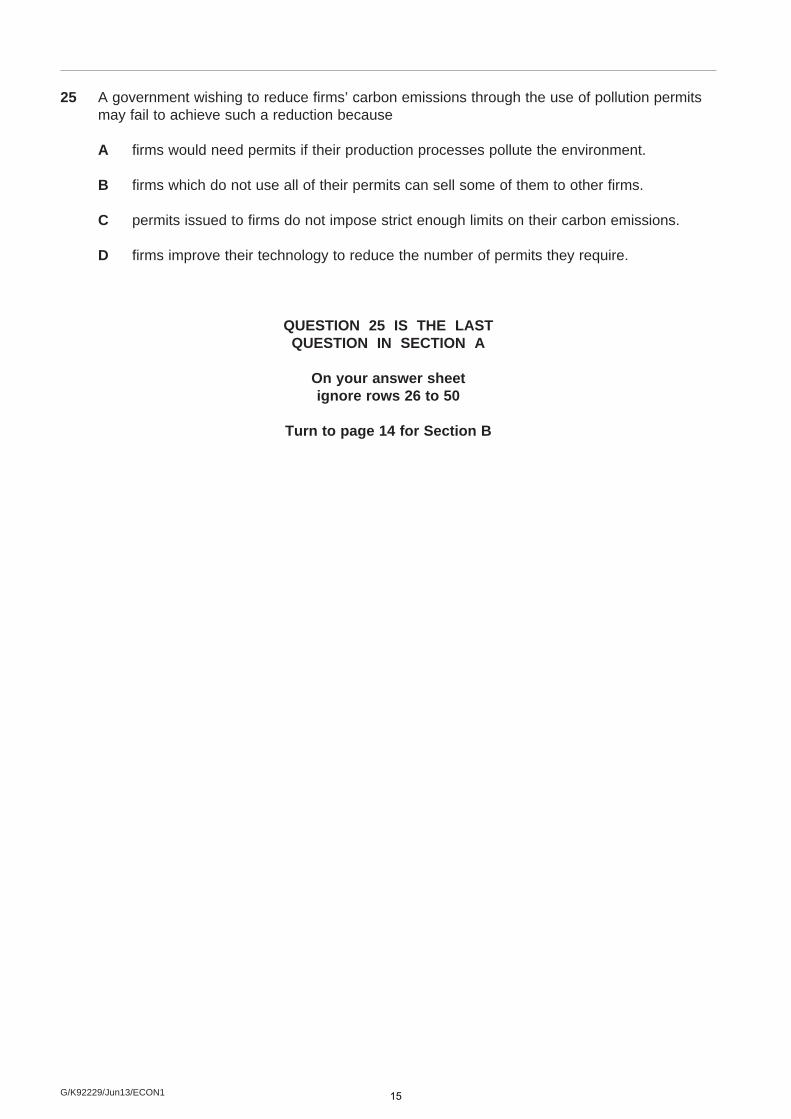
25 A government wishing to reduce firms’ carbon emissions through the use of pollution permits may fail to achieve such a reduction because
A firms would need permits if their production processes pollute the environment.
B firms which do not use all of their permits can sell some of them to other firms.
C permits issued to firms do not impose strict enough limits on their carbon emissions.
D firms improve their technology to reduce the number of permits they require.
QUESTION 25 IS THE LASTQUESTION IN SECTION A
On your answer sheetignore rows 26 to 50
Turn to page 14 for Section B
15

G/K92229/Jun13/ECON1
Turn over
Turn over for Section B
16

G/K92229/Jun13/ECON1
Section B: Data Response
Answer EITHER Context 1 OR Context 2.You are advised to spend at least 50 minutes on Section B.
EITHER Total for this Context: 50 marks
Context 1
THE PROVISION OF HIGHER EDUCATION IN THE UK
Study Extracts A, B and C, and then answer all parts of Context 1 which follow.
Extract A: Students in higher education in the UK in thousands, by type of course, 1980/1981 and 2008/2009
Undergraduate
Full-time 473 1328
Part-time 247 686
Postgraduate
Full-time 62 269
All higher education 827 2557
Part-time 45 274
1980/81 2008/09
Source: Social Trends 41, 2011
Extract B: Students should not have to pay fees for attending university
Universities need more income if they are to continue to provide quality education and to compete in international education markets. Where is this money to come from?
Some suggest that universities should be fi nanced, as they were before 1998, largely through government spending and taxation. Subsidies were paid directly to universities; students received grants from government to help fi nance their living costs. UK students did not have to pay tuition fees.
Others argue that universities should be fi nanced by increasing the amount of money they receive from selling their research to commercial companies. However, even in the case of the most successful universities in the USA, business provides only about 1% to 2% of university income. Less successful American universities raise much less money in this way.
Another option is to persuade rich individuals and companies to donate money to universities. Top American universities such as Harvard and Yale are very successful in appealing for gifts of this kind. Even so, US universities fail to raise suffi cient gift money to pay for most of the education they provide. Britain is very different from America and lacks a culture of charitable giving to universities.
1
5
10
15
Source: news reports, 2012
17
G/K92229/Jun13/ECON1
Turn over
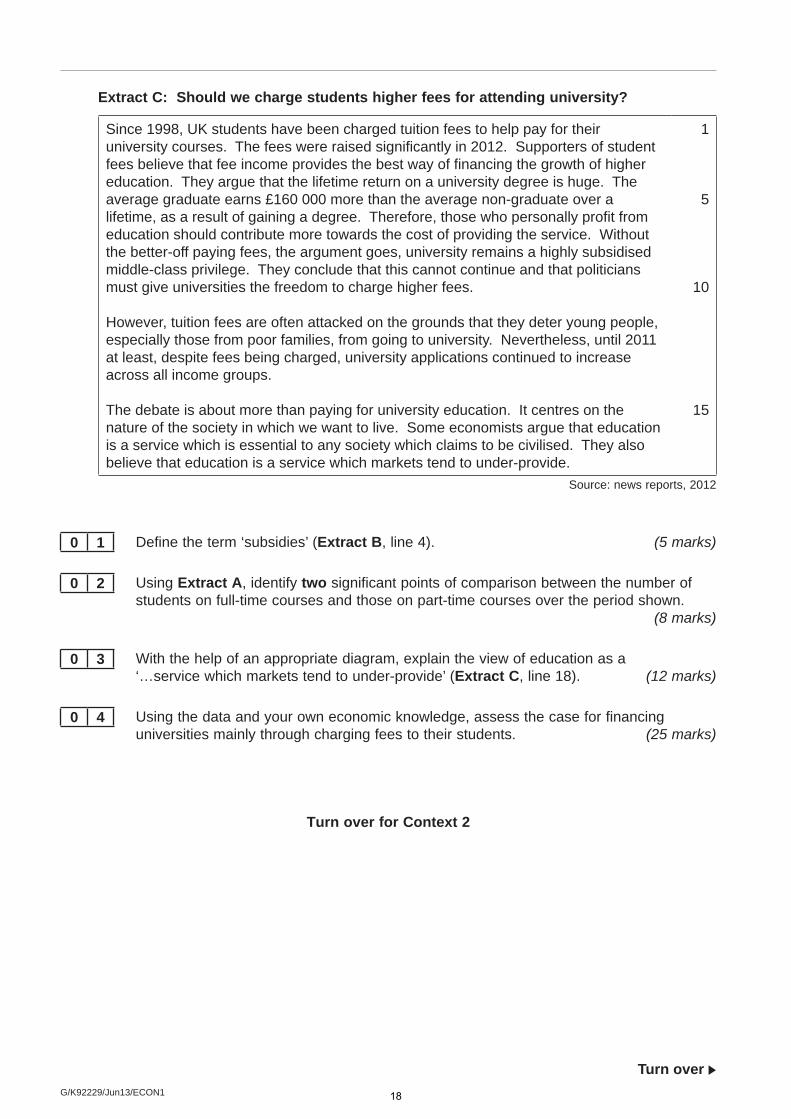
Extract C: Should we charge students higher fees for attending university?
Since 1998, UK students have been charged tuition fees to help pay for their university courses. The fees were raised signifi cantly in 2012. Supporters of student fees believe that fee income provides the best way of fi nancing the growth of higher education. They argue that the lifetime return on a university degree is huge. The average graduate earns £160 000 more than the average non-graduate over a lifetime, as a result of gaining a degree. Therefore, those who personally profi t from education should contribute more towards the cost of providing the service. Without the better-off paying fees, the argument goes, university remains a highly subsidised middle-class privilege. They conclude that this cannot continue and that politicians must give universities the freedom to charge higher fees.
However, tuition fees are often attacked on the grounds that they deter young people, especially those from poor families, from going to university. Nevertheless, until 2011 at least, despite fees being charged, university applications continued to increase across all income groups.
The debate is about more than paying for university education. It centres on the nature of the society in which we want to live. Some economists argue that education is a service which is essential to any society which claims to be civilised. They also believe that education is a service which markets tend to under-provide.
1
5
10
15
Source: news reports, 2012
0 1 Defi ne the term ‘subsidies’ (Extract B, line 4). (5 marks)
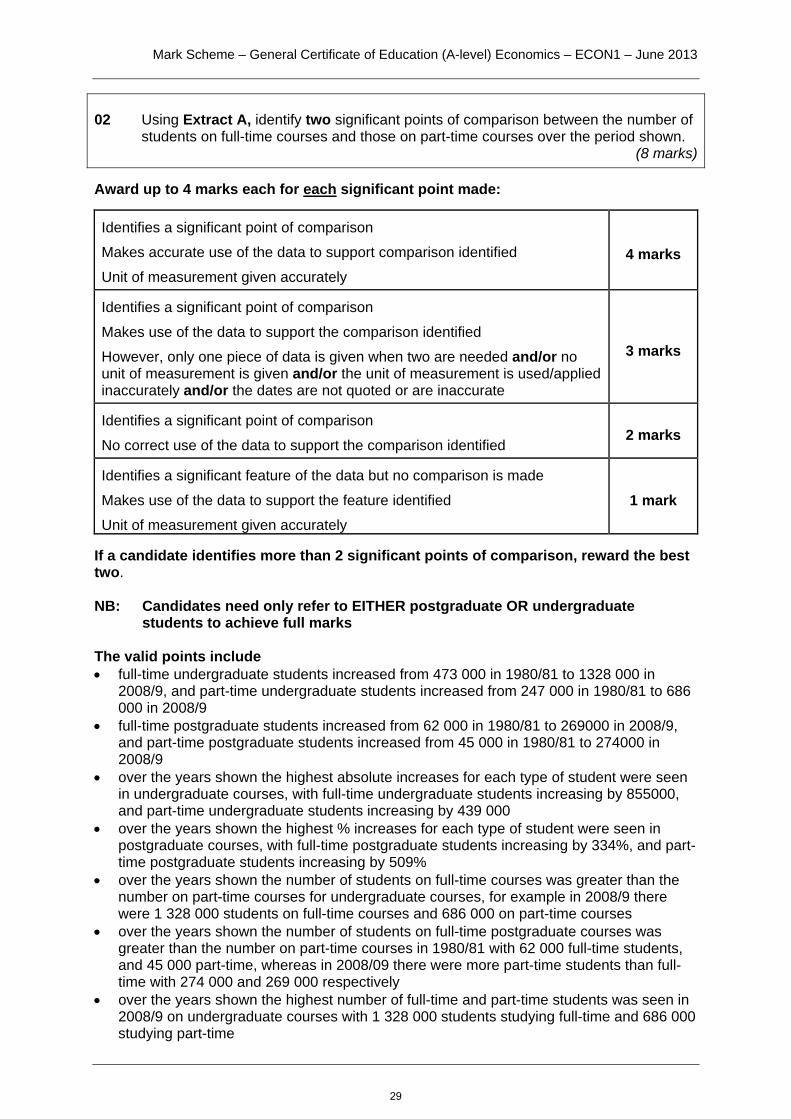
0 2 Using Extract A, identify two significant points of comparison between the number of students on full-time courses and those on part-time courses over the period shown.
(8 marks)
0 3 With the help of an appropriate diagram, explain the view of education as a ‘…service which markets tend to under-provide’ (Extract C, line 18). (12 marks)
0 4 Using the data and your own economic knowledge, assess the case for fi nancing universities mainly through charging fees to their students. (25 marks)
Turn over for Context 2
18

G/K92229/Jun13/ECON1
Do not answer Context 2 if you have answered Context 1.
Total for this Context: 50 marks
OR
Context 2
MARKETS FOR SMARTPHONES
Study Extracts D, E and F, and then answer all parts of Context 2 which follow.
Extract D: Market shares (%) of selected smartphone brands in the US market, May 2010 to May 2011
0 %May2010
Jul2010
Sep2010
Nov2010
Jan2011
Mar2011
May2011
5 %
10 %
15 %
20 %
25 %
30 %
35 %
40 %
45 %
Brands usingAndroid software
Blackberry
Apple iphone
Source: news reports, 2012
Extract E: The use and production of smartphones
A smartphone is a device that lets the user make telephone calls, but also adds in features which, in the past, would have been found only on devices such as computers. These include the ability to send and receive e-mails. The worldwide smartphone market enjoyed explosive growth of 54.7% in 2011. In the UK, smartphones now account for one in three mobile phones, and an increasing proportion of the sales of new mobile phones.
A number of factors increased the sales of smartphones and some also caused their prices to fall in 2011. One of the factors was fashion. A smartphone is now viewed by many people, particularly the young, as a ‘must-have’ item. Fashion also means that some users want to buy the latest, most advanced, smartphone as soon as it is advertised, replacing the model bought the year before. Other factors include substantial economies of scale, improvements in productive effi ciency and the entry of new fi rms into the market.
1
5
10
19
G/K92229/Jun13/ECON1
Smartphones are assembled from a very large number of components produced in low-cost factories located mostly in Asia. Some people believe that the main reason why manufacturing costs are low stems from the low wages paid to Asian workers.
Smartphone manufacturers, with their headquarters in the USA and other rich countries, have been accused of exploiting the workers in poor countries whom they employ to make their phones.
15
Source: news reports, 2012
Extract F: Mobile phone use and possible health risks
The World Health Organisation (WHO) has stated that there “could be some risk” of mobile phone use causing cancer. Some national radiation advisory authorities have recommended measures to minimise exposure of their citizens to radiation emitted by mobile phones. However, an assessment by a European Commission Scientific Committee concluded that “exposure is unlikely to lead to an increase in cancer in humans”.
Another area of concern is radiation emitted by the broadcasting masts which provide the link to and from mobile phones. In contrast to mobile handsets, this radiation is emitted continuously. People who spend long periods of time a short distance from active telecommunications equipment may be at risk of much greater exposure to radiation than the general population.
In February 2009, a French telecom company was ordered to take down a mobile phone mast due to uncertainty about its effect on health. However, the general presumption taken by courts of law is that mobile phone users themselves, and not governments, should take responsibility for avoiding health risks. They should do this, for example, by using hands-free devices to decrease radiation to the head. The use of mobile phones when driving can also cause accidents.
1
5
10
15
Source: news reports, 2009 –2012
0 5 Defi ne the term ‘productive effi ciency’ (Extract E, line 12). (5 marks)
0 6 Using Extract D, identify two significant points of comparison between the market shares of smartphone brands over the period shown. (8 marks)
0 7 With the help of the information in Extract E, explain two possible reasons for the change in the sales of smartphones in 2011. (12 marks)
0 8 Using the information in the data and your own economic knowledge, evaluate the economic case for and against governments attempting to influence how mobile phones are manufactured and used. (25 marks)
END OF QUESTIONS
20

G/K92229/Jun13/ECON1
There are no questions printed on this page
21
V
GJ
E
(
U
V1.0
GeneraJune 20
Econo
(Spec
Unit 1
al Certi013
omics
cificati
: Mar
ficate o
s
ion 21
rkets a
of Edu
140)
and M
F
cation
Market
Fina
(A-lev
t Failu
al
Mar
vel)
ure
rk S
ECON
Sche
N1
eme
e
22

Mark schemes are prepared by the Principal Examiner and considered, together with the relevant questions, by a panel of subject teachers. This mark scheme includes any amendments made at the standardisation events which all examiners participate in and is the scheme which was used by them in this examination. The standardisation process ensures that the mark scheme covers the students’ responses to questions and that every examiner understands and applies it in the same correct way. As preparation for standardisation each examiner analyses a number of students’ scripts: alternative answers not already covered by the mark scheme are discussed and legislated for. If, after the standardisation process, examiners encounter unusual answers which have not been raised they are required to refer these to the Principal Examiner. It must be stressed that a mark scheme is a working document, in many cases further developed and expanded on the basis of students’ reactions to a particular paper. Assumptions about future mark schemes on the basis of one year’s document should be avoided; whilst the guiding principles of assessment remain constant, details will change, depending on the content of a particular examination paper.
Further copies of this Mark Scheme are available from: aqa.org.uk Copyright © 2013 AQA and its licensors. All rights reserved. Copyright AQA retains the copyright on all its publications. However, registered schools/colleges for AQA are permitted to copy material from this booklet for their own internal use, with the following important exception: AQA cannot give permission to schools/colleges to photocopy any material that is acknowledged to a third party even for internal use within the centre. Set and published by the Assessment and Qualifications Alliance. The Assessment and Qualifications Alliance (AQA) is a company limited by guarantee registered in England and Wales (company number 3644723) and a registered charity (registered charity number 1073334). Registered address: AQA, Devas Street, Manchester M15 6EX.
23
Mark Scheme – General Certificate of Education (A-level) Economics – ECON1 – June 2013
AQA Advanced Subsidiary Economics
June 2013 ECON1/1
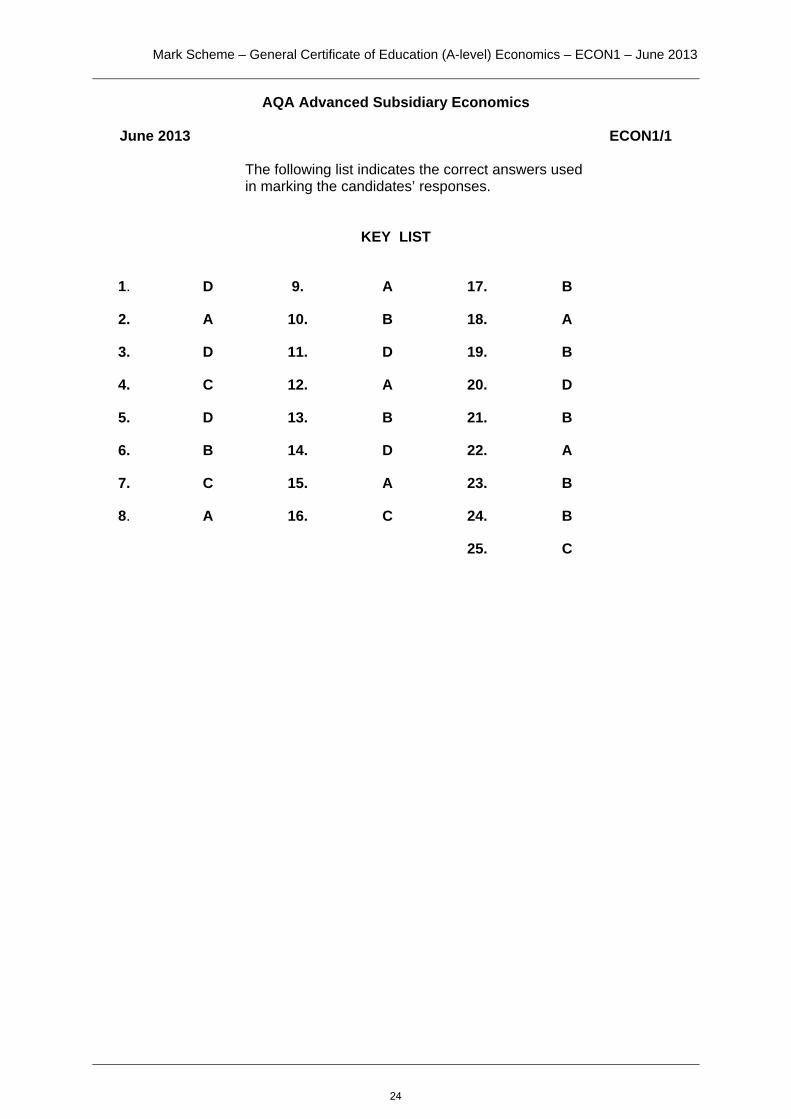
The following list indicates the correct answers used in marking the candidates’ responses.
KEY LIST
1. D 9. A 17. B
2. A 10. B 18. A
3. D 11. D 19. B
4. C 12. A 20. D
5. D 13. B 21. B
6. B 14. D 22. A
7. C 15. A 23. B
8. A 16. C 24. B
25. C
24
Mark Scheme – General Certificate of Education (A-level) Economics – ECON1 – June 2013
Advanced Subsidiary Economics June 2013 ECON1/2
Mark Scheme
Section B: Data Response General Instructions Marks awarded to candidates should be in accordance with the following mark scheme and examiners should be prepared to use the full range of marks available. The mark scheme for most questions is flexible, permitting the candidate to score full marks in a variety of ways. Where the candidate’s response to a question is such that the mark scheme permits full marks to be awarded, full marks MUST be given. A perfect answer is not necessarily required for full marks. But conversely, if the candidate’s answer does not deserve credit, then no marks should be given. Occasionally, a candidate may respond to a question in a reasonable way, but the answer may not have been anticipated when the mark scheme was devised. In this situation, OR WHENEVER YOU HAVE ANY DOUBT ABOUT THE INTERPRETATION OF THE MARK SCHEME, you must in the first instance telephone your team leader to discuss how to proceed. (i) An issue based approach. The mark scheme for questions 01, 02, 03, 05, 06 and
07 of the data response questions adopts this approach. The mark scheme lists the marks that can be awarded for particular issues (and associated development) that the candidate might include in the answer.
A levels approach. This approach is used for marking questions 04 and 08 of the data response questions. The Levels of Response Mark Scheme on the next page identifies five levels representing differences in the quality of work. A range of marks is allocated at each level. First decide the level into which an answer falls. The level chosen should be the one which best fits the answer provided by the candidate. It is not intended that the answer should satisfy every statement in the level description. Then think in terms of awarding the mid-point mark which has been identified for that level (eg 13 marks for Level 3). Move up and down from this notional mark by considering the extent to which the answer meets the level description overall. Strength in one skill can outweigh weakness in another. When using the Levels Mark Scheme the marker must identify where a particular skill is being demonstrated. The key to be used to identify the skill is given after the levels descriptions. The question-specific mark scheme summarises the information which could be used to answer the question, but without attaching marks to particular issues.
25

Mark Scheme – General Certificate of Education (A-level) Economics – ECON1 – June 2013
LEVELS OF RESPONSE MARK SCHEME: QUESTIONS 04 AND 08 ONLY
AS
LEVELS OF RESPONSE
AO1 KNOWLEDGE
and UNDERSTANDING of theories, concepts
and terminology
AO2 APPLICATION
of theories, concepts and terminology
AO3 ANALYSIS
of economic problems and
issues
AO4 EVALUATION of economic
arguments and evidence, making
informed judgements
Level 5 22-25 marks
(mid-point 24)
Good analysis and good evaluation
Good throughout the answer with few errors and weaknesses
Good application to issues
Good use of data to support answer
Relevant and precise with a clear and logical chain of reasoning
Good with a clear final judgement
Level 4 17-21 marks
(mid-point 19)
Good analysis but limited evaluation
OR
Good throughout the answer with few errors and weaknesses
Good application to issues
Good use of data to support answer
Relevant and precise with a clear and logical chain of reasoning
Limited but showing some appreciation of alternative points of view
Reasonable analysis and reasonable evaluation
Good throughout much of the answer with few errors and weaknesses
Some good application to issues.
Some good use of data to support answer
Largely relevant and well organised with reasonable logic and coherence
Reasonable, showing an appreciation of alternative points of view
Level 3 10-16 marks
(mid-point 13)
Reasonable answer, including some correct
analysis but very limited evaluation
Satisfactory but some weaknesses shown
Reasonable application to issues
Reasonable use of data to support answer
Reasonably clear but may not be fully developed and is perhaps confused in places with a few errors present
Superficial, perhaps with some attempt to consider both sides of the issue(s)
Level 2 4-9 marks
(mid-point 7)
Weak with some understanding
Limited and some errors are made
Partial application to issues with some errors
Limited use of data to support answer
Partial but confused at times, lacking focus and development
Limited logic and coherence
A very basic and simplistic attempt is made which is unsupported by analysis
Level 1 0-3 marks
(mid-point 2)
Very weak
Weak with a number of errors
Little, if any, application to issues
No use of data to support answer
Poor and lacking clarity and focus
No relevant evaluation
26

Mark Scheme – General Certificate of Education (A-level) Economics – ECON1 – June 2013
THE KEY TO BE USED WHEN USING THE ‘LEVELS’ MARKING SCHEME D Where a particular economic term is correctly DEFINED in order to help the
candidate to answer the question properly. I where a relevant ISSUE is raised by the candidate. K Where the candidate demonstrates KNOWLEDGE of recent developments or
features of the economy which help enhance the candidate’s response to the question. This should also be used where the candidate quotes relevant examples.
Ap Where the candidate demonstrates the ability to APPLY knowledge and CRITICAL UNDERSTANDING to problems and issues. An Where the candidate demonstrates the ability to ANALYSE the problem using
appropriate economic ideas. E Where the candidate EVALUATES and makes judgements about the significance of
various issues and arguments.
QUALITY OF WRITTEN COMMUNICATION
Quality of Written Communication (QWC) will be assessed in Questions 04 and 08 only. Candidates will be assessed according to their ability to:
ensure that text is legible, and that spelling, grammar and punctuation are accurate, so that meaning is clear
select and use a form and style of writing appropriate to purpose and complex subject matter
organise information clearly and coherently, using specialist vocabulary when appropriate.
No specific marks are awarded for QWC. However, examiners should take into account QWC when determining the mark to be awarded for an answer. This means an answer could be taken either up (for exceptional QWC) or down (for very poor QWC) by 1 mark (and no more).
27

Mark Scheme – General Certificate of Education (A-level) Economics – ECON1 – June 2013
EITHER Context 1 Total for this Context: 50 marks
For an acceptable definition, eg payments by the government/authority which reduce the costs of
production of goods or services payments by the government which increase the supply of goods or
services/shift the supply curve to the right money paid by the government to firms in order to reduce their costs and
/or increase competitiveness money paid by the government to reduce the market price money paid by the government to increase consumption.
5 marks
Full marks should be awarded to a candidate who demonstrates a clear understanding of the term ‘subsidies’ even if the definition isn’t exactly the same as the acceptable examples quoted above.
If the definition is inaccurate or incomplete, award a maximum of 4 marks which may be broken down, for example as follows:
Grants/payments to firms by the government. 2 marks
Diagram to illustrate a subsidy: 1 mark for labels, 1 for information shown. 2 marks
Money received by firms 1 mark
A form of government spending/intervention 1 mark
Payments of money 1 mark
The opposite of taxes 1 mark
An example of a good/service which may be subsidised (other than education).
1 mark
NB: If the candidate refers to for example, ‘reduces costs of production’/‘shifts
supply curve to the right’ with no reference to ‘payment’ and ‘government’, this should be awarded 2 marks for each statement.
Maximum of 4 marks if definition is incomplete or inaccurate
MAXIMUM FOR PART 01: 5 MARKS
01 Define the term ‘subsidies’ (Extract B, line 4). (5 marks)
28
Mark Scheme – General Certificate of Education (A-level) Economics – ECON1 – June 2013
02 Using Extract A, identify two significant points of comparison between the number of students on full-time courses and those on part-time courses over the period shown.
(8 marks) Award up to 4 marks each for each significant point made:
Identifies a significant point of comparison
Makes accurate use of the data to support comparison identified
Unit of measurement given accurately 4 marks
Identifies a significant point of comparison
Makes use of the data to support the comparison identified
However, only one piece of data is given when two are needed and/or no unit of measurement is given and/or the unit of measurement is used/applied inaccurately and/or the dates are not quoted or are inaccurate
3 marks
Identifies a significant point of comparison
No correct use of the data to support the comparison identified 2 marks
Identifies a significant feature of the data but no comparison is made
Makes use of the data to support the feature identified
Unit of measurement given accurately
1 mark
If a candidate identifies more than 2 significant points of comparison, reward the best two. NB: Candidates need only refer to EITHER postgraduate OR undergraduate
students to achieve full marks The valid points include full-time undergraduate students increased from 473 000 in 1980/81 to 1328 000 in
2008/9, and part-time undergraduate students increased from 247 000 in 1980/81 to 686 000 in 2008/9
full-time postgraduate students increased from 62 000 in 1980/81 to 269000 in 2008/9, and part-time postgraduate students increased from 45 000 in 1980/81 to 274000 in 2008/9
over the years shown the highest absolute increases for each type of student were seen in undergraduate courses, with full-time undergraduate students increasing by 855000, and part-time undergraduate students increasing by 439 000
over the years shown the highest % increases for each type of student were seen in postgraduate courses, with full-time postgraduate students increasing by 334%, and part-time postgraduate students increasing by 509%
over the years shown the number of students on full-time courses was greater than the number on part-time courses for undergraduate courses, for example in 2008/9 there were 1 328 000 students on full-time courses and 686 000 on part-time courses
over the years shown the number of students on full-time postgraduate courses was greater than the number on part-time courses in 1980/81 with 62 000 full-time students, and 45 000 part-time, whereas in 2008/09 there were more part-time students than full-time with 274 000 and 269 000 respectively
over the years shown the highest number of full-time and part-time students was seen in 2008/9 on undergraduate courses with 1 328 000 students studying full-time and 686 000 studying part-time
29

Mark Scheme – General Certificate of Education (A-level) Economics – ECON1 – June 2013
over the years shown the lowest number of both full-time and part-time students was seen in 1980/81 on postgraduate courses with 62 000 students studying full-time and 45 000 students studying part-time.
For ease of reference: the absolute increase over the period for full-time undergraduate students was 855 000 the absolute increase over the period for part-time undergraduate students was 439 000 the absolute increase over the period for full-time postgraduate students was 207 000 the absolute increase over the period for part-time postgraduate students was 229 000. or the % increase over the period for full-time undergraduate students was 181% the % increase over the period for part-time undergraduate students was 178% the % increase over the period for full-time postgraduate students was 334% the % increase over the period for part-time postgraduate students was 509%. or the absolute increase over the period for full-time students on both courses was 535 000
to 1597 000 the absolute increase over the period for part-time students on both courses was 292 000
to 962 000 or the % increase over the period for full-time students on both courses was 199% the % increase over the period for part-time students on both courses was 229% Allow a margin of error of 10 000 or +/- 1 per cent when judging the changes.
MAXIMUM FOR PART 02: 8 MARKS
30

03 W w
When aeconom All three Diagramexternathe pos Diagraminformafollowin Diagramprovidedprice (w
The ant Breakd For labhorizonprovisiperfect
For dediagra
For debenefit
Horizoexterna
Any otshownunderc
Mark Sche
With the hewhich mark
awarding mamically valid
e diagrams
m 1 assumelities which itive externa
m 2 relates ttion, which g receipt of
m 3 is a cond at an uns
when the su
ticipated re
down of the
belling both ntal coordinon of educat informatio
epicting socim
epicting socits with and
ontal coordinalities or lac
her relevan or welfare
consumptio
eme – Gener
elp of an appkets tend to
arks for the response e
analyse ed
es that consbenefit soc
alities, unde
to the alternalternativel
f the full info
nventional subsidised mpply curve i
esponse fo
e marks for
axes, the pnate, labelleation in a mn are taken
ial cost rela
ial benefit rewithout full
nate accurack of perfec
nt feature ofgain/loss sn, the size o
ral Certificate
propriate diaunder–prov
diagram, it even if it is n
ucation pro
sumption of ciety as a werconsumpt
native way oy could be
ormation, co
upply and dmarket priceis S2).
or the diagr
r Diagrams
private cost ed for exam
market beforn into accou
ative to priva
elative to prinformation
ately drawn ct informatio
f the diagramhown; undeof an inform
e of Educatio
agram, expvide’ (Extra
t is importannot exactly
ovision in te
education gwhole. Becation and the
of defining adrawn as aonsumption
demand diae (when the
ram
s 1 and 2
and benefiple Q1, to sre externalitunt.
ate cost acc
rivate benefn) accuratel
after takingon.
m, eg margerproductionmation gap c
on (A-level) E
plain the viewact C, line 1
nt to rewardthe same a
rms of educ
generates pause a free ence also un
a merit goo demand an
n and thence
agram show supply curv
t curves, anhow the levties or the la
curately on t
fit (or margiy on the dia
g account of
inal externan or correctly lab
Economics –
w of educat8).
d candidatess diagrams
cation being
positive conmarket failsnderproduc
d in terms ond supply de provision
wing the quave is S1), an
nd the vel of ack of
the
nal agram.
f the
al benefit
belled.
ECON1 – Ju
tion as a ‘…(12
s who produs 1, 2 or 3 be
g a merit go
nsumption s to take accction occurs
of imperfectdiagram wheis higher.
antity of edund at a sub
1
1
1
1
1 mark up to a m
2
une 2013
…service marks)
uce an elow.
ood.
count of .
t en,
ucation sidised
mark
mark
mark
mark
per featuremaximum omarks
e of
31

Mark Scheme – General Certificate of Education (A-level) Economics – ECON1 – June 2013
Breakdown of the marks for Diagram 3
For labelling both axes, the demand curve and the supply curve S1, and the horizontal coordinate, labelled for example Q1, to show the level of provision of education in a market before the effect of a subsidy (for example) is taken into account.
1 mark
For showing a second supply curve, in this graph S2, having taken into account the effect of a subsidy. 1 mark
For showing a second horizontal coordinate, Q2. 1 mark
For labelling the distance between Q1 and Q2 underproduction or underconsumption, or labelling Q2 as the socially optimal level of consumption.
1 mark
Any other relevant feature of the diagram, eg the free-market price of education; the subsidised price of education; quantity of education demanded if education is provided free.
1 mark per feature up to a maximum of 2 marks
Note: (i) To earn the first mark in the grids, all the listed tasks must have been completed correctly.
(ii) For the task of labelling axes, costs and benefits, c/b and/or price or a monetary
symbol such as the £ sign on the vertical axis and quantity, output, or units of education are all valid, as are P and Q.
Up to a MAXIMUM of 4 marks for diagram or diagrams The anticipated written response The quote or prompt at the beginning of the question, drawn from the last line of Extract C states that education is a service which markets tend to underprovide. However, neither Extract B nor Extract C offers any further prompts and no mention is made of education as a merit good. However, AS students are well versed in the fact that education can be classed as a merit good and they are expected to have developed their explanations accordingly. In the context of externalities, to be completely accurate the answers should focus on consumption externalities, but allow answers that simply refer to positive externalities without mentioning the word consumption.
32

Mark Scheme – General Certificate of Education (A-level) Economics – ECON1 – June 2013
Define a relevant concept such as a merit good, marginal private, external and social costs and benefits, positive externality, an information gap, demand, supply.
1 mark per definition Maximum of 2 marks
Example of a private benefit 1 mark
Example of an external benefit/positive externality 1 mark
For the explanation, award 2 marks for each logical link in the chain of reasoning, for example
Education, a merit good (2 marks) may be underconsumed (or underprovided) because consumers only consider the private benefits (2 marks) so the positive (consumption) externalities are not taken into account (2 marks) so the MPB is less than the MSB (2 marks) the level of consumption ends up below the socially optimum level (2 marks) and there is a deadweight loss of social welfare (2 marks).
Up to 10 marks
Consumers of education only consider the short term benefits (2 marks) because they possess imperfect information (2 marks) they do not fully consider the long-term benefits (2 marks) of eg higher eventual income (1 mark eg) so consumption occurs at the privately optimum level (2 marks) rather than the socially optimum level (2 marks) resulting in a misallocation of resources (2 marks) and which could be avoided by subsidising consumption (or production) of education (2 marks).
Up to 10 marks
Alternatively/in addition to the above, other links include:
in the education market there is evidence of market failure the market produces where MPB is equal to MPC the market does not produce where MSB is equal to MSC consumers possess imperfect information of the long term
private benefits less is consumed than if perfect information existed the ‘perceived’ benefit is less than the ‘actual’ benefit social benefits outweigh the private benefits the MPC of production outweighs the MSC of production a positive external benefit of production exists.
2 marks for each alternative /additional link in the chain
of reasoning Up to 10 marks
Note: Do not award marks for simply describing what the diagram shows.
Up to a MAXIMUM of 10 marks for the written explanation
MAXIMUM FOR PART 03: 12 MARKS
33
Mark Scheme – General Certificate of Education (A-level) Economics – ECON1 – June 2013
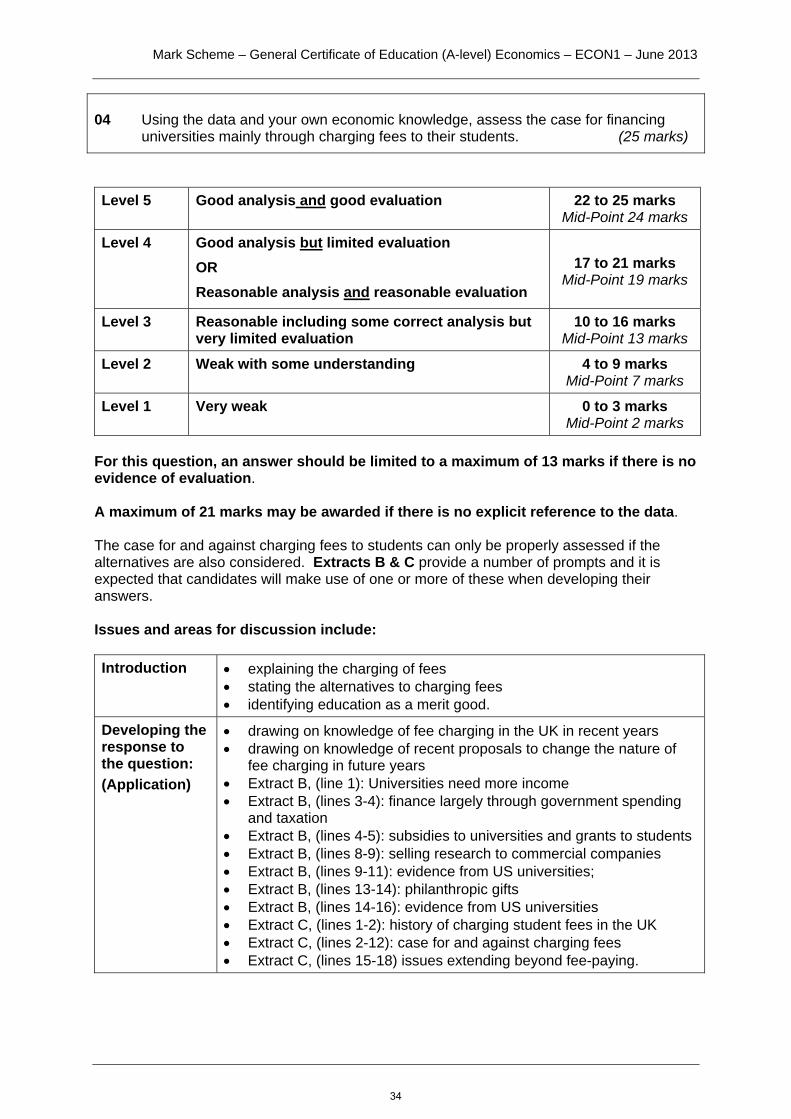
04 Using the data and your own economic knowledge, assess the case for financing universities mainly through charging fees to their students. (25 marks)
Level 5 Good analysis and good evaluation 22 to 25 marks
Mid-Point 24 marks
Level 4 Good analysis but limited evaluation OR Reasonable analysis and reasonable evaluation
17 to 21 marks Mid-Point 19 marks
Level 3 Reasonable including some correct analysis but very limited evaluation
10 to 16 marks Mid-Point 13 marks
Level 2 Weak with some understanding 4 to 9 marks Mid-Point 7 marks
Level 1 Very weak 0 to 3 marks Mid-Point 2 marks
For this question, an answer should be limited to a maximum of 13 marks if there is no evidence of evaluation. A maximum of 21 marks may be awarded if there is no explicit reference to the data. The case for and against charging fees to students can only be properly assessed if the alternatives are also considered. Extracts B & C provide a number of prompts and it is expected that candidates will make use of one or more of these when developing their answers. Issues and areas for discussion include: Introduction
explaining the charging of fees stating the alternatives to charging fees identifying education as a merit good.
Developing the response to the question: (Application)
drawing on knowledge of fee charging in the UK in recent years drawing on knowledge of recent proposals to change the nature of
fee charging in future years Extract B, (line 1): Universities need more income Extract B, (lines 3-4): finance largely through government spending
and taxation Extract B, (lines 4-5): subsidies to universities and grants to students Extract B, (lines 8-9): selling research to commercial companies Extract B, (lines 9-11): evidence from US universities; Extract B, (lines 13-14): philanthropic gifts Extract B, (lines 14-16): evidence from US universities Extract C, (lines 1-2): history of charging student fees in the UK Extract C, (lines 2-12): case for and against charging fees Extract C, (lines 15-18) issues extending beyond fee-paying.
34

Mark Scheme – General Certificate of Education (A-level) Economics – ECON1 – June 2013
Developing the response to the question: (Analysis)
developing a chain of reasoning to explain how education possesses the properties of a merit good
developing the opposite case to explain how a free market can provide education
analysing subsidies using a diagram to illustrate the effect of a subsidy developing a chain of reasoning as to why market provision may
result in under-provision analysis of the case for and against universities being financed
through charging student fees analysis of the case for and against universities being financed
through business contracts analysis of the case for and against universities being financed
through philanthropy or gifts analysis of the case for and against universities being financed
through government spending and taxation use of the evidence in the Extracts and in the candidate’s economic
knowledge to back up the analysis.
Evaluation
discussing the analytical consequences of treating education as a merit good
evaluating the strength of the merit good argument discussing possible unintended consequences of subsidised or free
provision discussing why business contracts and philanthropy may not be able
to finance universities evaluating the case for charging students fees evaluating the case against charging students fees opportunity cost arguments discussing the correct size, if any, of a subsidy discussing whether or not different methods of finance should be
used in tandem discussing the implications of ‘mainly’ evaluating the evidence in the data evaluating market failure and government failure considerations overall evaluation of the case for versus the case against.
Examiners should note that credit can be given for basic evaluation if a candidate simply states but does not develop arguments in favour or against different methods of financing higher education. Basic evaluation (and good analysis) would allow the answer to achieve low Level 4. Stronger evaluation is provided by candidates who are able to support arguments both for and against different types of finance, and by clearly stating the assumptions underlying the arguments being used. Reward the relevant use of diagrams to support arguments, eg merit good and subsidy diagrams.
USE THE DETAILED LEVELS MARK SCHEME ON PAGE 5 FOR FURTHER CLARIFICATION
MAXIMUM FOR PART 04: 25 MARKS
35

Mark Scheme – General Certificate of Education (A-level) Economics – ECON1 – June 2013
OR Context 2 Total for this Context: 50 marks 05 Define the term ‘productive efficiency’ (Extract E, line 12). (5 marks)
For an acceptable definition, eg the lowest-average cost level of output/production production takes place at the lowest point on a ‘u’- shaped average
cost curve maximising output from available inputs minimising inputs to produce given output when it is impossible to produce more of one good without reducing
production of another good production takes place where AC=MC (not in AS specification).
5 marks
Full marks should be awarded to a candidate who demonstrates a clear understanding of the term ‘productive efficiency’ even if the definition isn’t exactly the same as the acceptable examples quoted above.
If the definition is inaccurate or incomplete, award a maximum of 4 marks which may be broken down, for example, as follows:
Stating that it occurs at lowest average cost – no reference to output/production. 4 marks
Stating that productive efficiency occurs at all points on a firm/economy’s production possibility frontier. 2 marks
When all resources are fully utilised 2 marks
Illustrating productive efficiency on a cost curve or PPF diagram: 1 mark for labels, 1 for information shown.
2 marks per diagram
(max 2 marks)
Stating that production takes place at lowest cost – no reference to average unit. 2 marks
Defining efficiency in a ‘general’ way, eg reference to economies of scale, but without reference to production/minimising average costs. 1 mark
Defining production/productive 1 mark
Stating productive efficiency is an example of static efficiency. 1 mark Do not reward an answer which confuses productive efficiency with allocative efficiency (the latter is not in the specification, but some candidates have learnt the concept). Maximum of 4 marks if definition is incomplete or inaccurate
MAXIMUM FOR PART 05: 5 MARKS
36

Mark Scheme – General Certificate of Education (A-level) Economics – ECON1 – June 2013
06 Using Extract D, identify two significant points of comparison between the market shares of smartphone brands over the period shown. (8 marks)
Award up to 4 marks each for each significant point made Identifies a valid significant point of comparison. Makes accurate use of the data to support comparison identified. Unit of measurement given accurately.
4 marks
Identifies a significant point of comparison. Makes use of the data to support the comparison identified. However, no unit of measurement is given and/or the unit of measurement is used/applied inaccurately and/or the dates are not quoted or are inaccurate.
3 marks
Identifies a significant point of comparison. No use of the data to support the comparison identified. 2 marks
Identifies a significant feature of the data but no comparison is made. Makes use of the data to support the feature identified. Unit of measurement given accurately.
1 mark
If a candidate identifies more than 2 significant points of comparison, reward the best two. A candidate only needs to compare 2 of the lines in the graph. The valid points include: comparing the first and last points of the iphone and Blackberry data series, the market
share of the iphone grew (from about 24% to about 27%), whereas the share of Blackberry fell (from about 42% to about 25%)
comparing the first and last points of the iphone and Android brands data series, the market share of the iphone grew (from about 24% to about 27%), whereas the share of Android grew (from about 13% to about 38%)
comparing the first and last points of the Android brands and Blackberry data series, the market share of the Android brands grew (from about 13% to about 38%), whereas the share of Blackberry fell (from about 42% to about 25%)
the iphone’s market share was above Blackberry’s market share in the latter part of the data period from April 2011 until May 2011, rising from about 26% to about 27%
Blackberry’s market share fell continuously throughout the data period, whereas the iphone’s market share fell only in two short periods (June/July 2010 from about 24% to about 23.5% and December 2010/January 2011 from about 25% to about 24.75%)
the market shares of Blackberry and Android brands were equal (at approx. 31%) in December 2010/January 2011
the market shares of Android brands and iphone were equal (at approx. 25%) in October/November 2010
the market shares of Blackberry and iphone were equal (at approx. 26%) in March/April 2011
the largest market share (approx. 42%) of Blackberry was in May 2010, compared with that of the iphone (approx. 27%) in May 2011, or Android brand (approx. 38%) in May 2011
37

Mark Scheme – General Certificate of Education (A-level) Economics – ECON1 – June 2013
the smallest market share (approx. 25%) of Blackberry was in May 2011, compared with that of the iphone (approx. 24%) in July 2010, or Android brand (approx. 13%) in May 2010 Allow a margin of error of +/- 1 per cent when judging market shares.
MAXIMUM FOR PART 06: 8 MARKS
38

Mark Scheme – General Certificate of Education (A-level) Economics – ECON1 – June 2013
07 With the help of the information in Extract E, explain two possible reasons for the change in the sales of smartphones in 2011. (12 marks)
Extract E mentions two sets of factors that affected smartphone sales in 2011. These were a demand-side factor (fashion) and supply-side factors (economies of scale, productive efficiency and market entry). In the logical chains of reasoning below, only award once ‘causes demand to increase’, ‘causes supply to increase’, and ‘and causes sales to increase’. Define demand, supply, equilibrium quantity, excess supply, or any other relevant term. Do not reward a definition of productive efficiency.
1 mark per definition Maximum of 2 marks
For each of the following explanations, award 2 marks for each logical link in the chain of reasoning.
A smartphone is a fashion item (2 marks) and users replace their phones with the latest model in response to an advertising campaign (2 marks) which increases the demand for smartphones (2 marks) and causes sales to increase (2 marks).
Up to 8 marks
As smartphone technology improves (2 marks) consumers are likely to embrace this as it enables them to enjoy more efficient means of communication (2 marks) this increases the demand for smartphones (2 marks) and causes sales to increase (2 marks).
Up to 8 marks
Economies of scale (2 marks) reduce (average) costs (2 marks) and increase supply (2 marks) and causes sales to increase (2 marks). Up to 8 marks
Gains in productive efficiency (2 marks) reduce (average) costs (2 marks) and increase supply (2 marks) and cause sales to increase (2 marks). Up to 8 marks
The entry of new firms (2 marks) increases supply (2 marks), increases competition in the market (2 marks) which drives down prices (2 marks) and cause sales to increase (2 marks).
Up to 8 marks
For an explanation of the adjustment process: for example an increase in demand causes excess demand at the original equilibrium (2 marks) and an extension along the supply curve (2 marks).
Up to 4 marks
For diagrams which are consistent with the written explanation, eg a diagram showing the effect of a shift of demand; a diagram showing the effect of a shift of supply. Award marks as follows: for labelling both axes, original supply and demand curves, price
and quantity co-ordinates drawn in and labelled for example P1 Q1 1 mark
a relevant shift of the demand and/or the supply curve: 1 mark for each shift
horizontal and vertical co-ordinates drawn in at the new equilibrium and labelled for example P2 Q2: 1 mark
any other relevant feature of the diagram (eg excess demand; excess supply): 1 mark max.
Up to 4 marks
39

Mark Scheme – General Certificate of Education (A-level) Economics – ECON1 – June 2013
Note: (i) Maximum of 8 marks if only one relevant reason is explained (ii) Full marks can be earned without the use of a diagram (iii) Award no marks for the diagram if there is no reference to it in the text
MAXIMUM FOR PART 07: 12 MARKS
40

Mark Scheme – General Certificate of Education (A-level) Economics – ECON1 – June 2013
08 Using the information in the data and your own economic knowledge, evaluate the economic case for and against governments attempting to influence how mobile phones are manufactured and used. (25 marks)
Level 5 Good analysis and good evaluation 22 to 25 marks
Mid-Point 24 marks Level 4 Good analysis but limited evaluation
OR Reasonable analysis and reasonable evaluation
17 to 21 marks Mid-Point 19 marks
Level 3 Reasonable including some correct analysis but very limited evaluation
10 to 16 marks Mid-Point 13 marks
Level 2 Weak with some understanding 4 to 9 marks Mid-Point 7 marks
Level 1 Very weak 0 to 3 marks Mid-Point 2 marks
For this question, an answer should be limited to a maximum of 13 marks if there is no evidence of evaluation. Answers discussing only policies cannot rise above 16 marks A maximum of 21 marks may be awarded if there is no explicit reference to the data. Answers discussing only phone manufacture or phone use cannot rise above 21 marks. Candidates are likely to develop their answers to apply what they have been taught, namely governments regulating or intervening in how mobile phones are manufactured and used. While this is a valid response to the question, the wording also tries to prompt discussion of how governments may try to ‘nudge’ manufacturers and phone users into certain types of behaviour. For example, smartphone manufacturers such as Apple may voluntarily change the way they hire labour and phone users may take action to minimise the chance of suffering health problems. Issues and areas for discussion include:
Introduction
stating that a mobile phone is manufactured by assembling a large number of components into a finished phone
stating that a mobile phone is usually used next to the ear but can be used in other ways
stating that mobile phones emit radiation when used and that phone masts also emit radiation
stating different ways in which governments can attempt to influence how mobile phones are manufactured and used.
Developing the response to the question: (Application)
drawing on knowledge of discussion in newspaper and TV programmes about manufacturing conditions and the alleged health hazards of using mobile phones
extract E Line 16: low wages paid to Asian workers extract E Lines 18-19: manufacturers exploiting workers extract F Lines 1-2: there "could be some risk" of mobile phone use
causing cancer extract F Lines 4-6: European Commission Scientific Committee
concluded that "exposure is unlikely to lead to an increase in cancer in humans"
41

Mark Scheme – General Certificate of Education (A-level) Economics – ECON1 – June 2013
Extract F (line 7): radiation emitted by the broadcasting masts Extract F (lines 9-10): workers who spend long periods of time at a
short distance from active telecommunications equipment may also be at risk
Extract F (lines 12-13): French telecom company ordered to take down a mobile phone mast due to uncertainty about its effect on health;
Extract F (lines 13-15): the general presumption taken by courts of law is that mobile phone users themselves, and not governments, should take responsibility for avoiding health risks.
Developing the response to the question: (Analysis)
developing a chain of reasoning to explain why production of mobile phones in competitive markets without any attempt by governments to influence production may lead to low costs, greater consumer choice and higher employment
developing a chain of reasoning to explain why production of mobile phones in competitive markets without any attempt by governments to influence production may lead to market failure, eg in the form of income inequalities and the emission of negative externalities of consumption and production
analysing how governments may attempt to influence how mobile phones are manufactured and used
analysing the question with cost and externality diagrams analysing the question in terms of the signalling, incentive and
rationing/resource allocation functions of the price mechanism.
Evaluation questioning the assumptions made when developing the chains of reasoning outlined above
distinguishing between the different cases relating to phone manufacture and phone use
contrasting the advantages and disadvantages of government action and leaving things to the free market
evaluating the evidence in the data evaluating market failure and government failure considerations overall evaluation of the cases for versus the cases against, both for
manufacture and use. Examiners should note that credit can be given for basic evaluation if a candidate simply states but does not develop arguments. Basic evaluation (and good analysis) would allow the answer to achieve low Level 4. Stronger evaluation is provided by candidates who are able to support arguments both for and against. Reward the relevant use of diagrams to support arguments.
USE THE DETAILED LEVELS MARK SCHEME ON PAGE 5 FOR FURTHER CLARIFICATION
MAXIMUM FOR PART 08: 25 MARKS
42

General Certificate of EducationAdvanced Subsidiary ExaminationJune 2013
Economics ECON2Unit 2 The National Economy
Friday 17 May 2013 1.30 pm to 2.45 pm
For this paper you must have: an objective test answer sheet a black ball-point pen an AQA 8-page answer book.You may use a calculator.
Time allowed 1 hour 15 minutes
Section A (ECON2/1) Answer all questions on your objective test answer sheet. Use a black ball-point pen. Do not use pencil. Do all rough work in this question paper, not on your objective test answer sheet.
Section B (ECON2/2) Answer EITHER Context 1 OR Context 2. Use black ink or black ball-point pen. Pencil should only be used for drawing. Write the information required on the front of your answer book. The Examining Body for this
paper is AQA. The Paper Reference is ECON2/2.
Information The maximum mark for this paper is 75. There are 25 marks for Section A. Each question carries one mark. No deductions will be made
for wrong answers. There are 50 marks for Section B. The marks for questions are shown in brackets. You will be marked on your ability to: – use good English – organise information clearly – use specialist vocabulary where appropriate.
Advice You are advised to spend no more than 25 minutes on Section A and at least 50 minutes on
Section B.
ECON2G/T90774/Jun13/ECON2 6/6/6/ 43

G/T90774/Jun13/ECON2
Section A: Objective Test
Answer all questions in Section A.Each question carries 1 mark. No deductions will be made for wrong answers.
You are advised to spend no more than 25 minutes on Section A.
For each question there are four alternative responses, A, B, C and D. When you have selected the response which you think is the best answer to a question, mark this response on your objective test answer sheet. If you wish to change your answer to a question, follow the
instructions on your objective test answer sheet.
1 Which one of the following is most likely to shift the short-run aggregate supply curve to the left? A rise in
A money wages.
B government spending.
C the exchange rate.
D labour productivity.
2 In the short run, a fall in a budget deficit is most likely to increase
A imports.
B unemployment.
C interest rates.
D inflation.
3 The UK economy is in recession. The government increases its budget deficit whilst, at the same time, the exchange rate of the pound falls. These events are most likely to lead to a rise in
A the rate of growth of GDP and a fall in unemployment.
B the foreign currency price of UK exports and a rise in inflation.
C the price in pounds of UK imports and a rise in unemployment.
D labour productivity and a fall in the size of the positive output gap in the economy.
44
G/T90774/Jun13/ECON2
Turn over
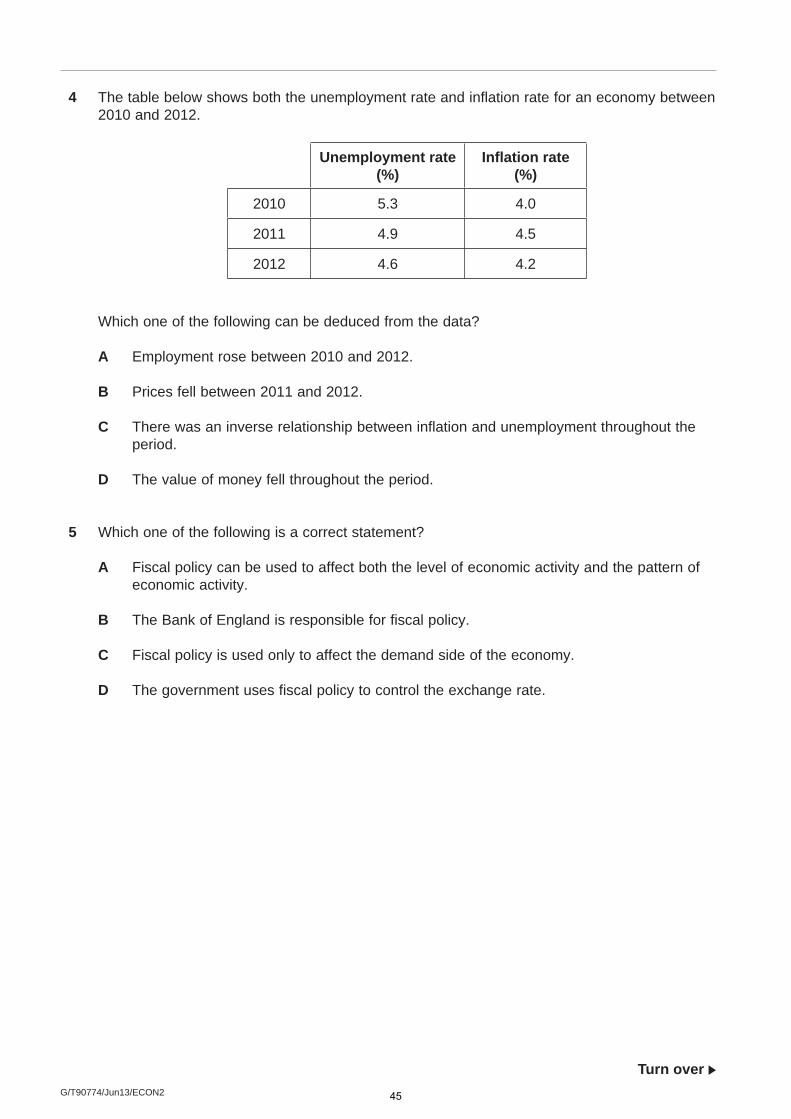
4 The table below shows both the unemployment rate and inflation rate for an economy between 2010 and 2012.
Unemployment rate (%)
Inflation rate (%)
2010 5.3 4.0
2011 4.9 4.5
2012 4.6 4.2
Which one of the following can be deduced from the data?
A Employment rose between 2010 and 2012.
B Prices fell between 2011 and 2012.
C There was an inverse relationship between inflation and unemployment throughout the period.
D The value of money fell throughout the period.
5 Which one of the following is a correct statement?
A Fiscal policy can be used to affect both the level of economic activity and the pattern of economic activity.
B The Bank of England is responsible for fiscal policy.
C Fiscal policy is used only to affect the demand side of the economy.
D The government uses fiscal policy to control the exchange rate.
45

G/T90774/Jun13/ECON2
6 The diagram below shows the aggregate demand (AD), the short-run aggregate supply (SRAS) and the long-run aggregate supply (LRAS) curves for an economy.
O Real national
output
Pricelevel
AD
SRAS
LRAS
X
The economy is currently operating at point X. At this point, the economy must be experiencing
A inflation caused by excess demand.
B inflation caused by increasing costs.
C unemployment of labour.
D a low rate of economic growth.
7 Deflation is
A a fall in the external value of the domestic currency.
B a fall in the rate of inflation.
C a loss in value of capital stock due to physical wear and tear.
D a rise in the real value of money over time.
46
G/T90774/Jun13/ECON2
Turn over
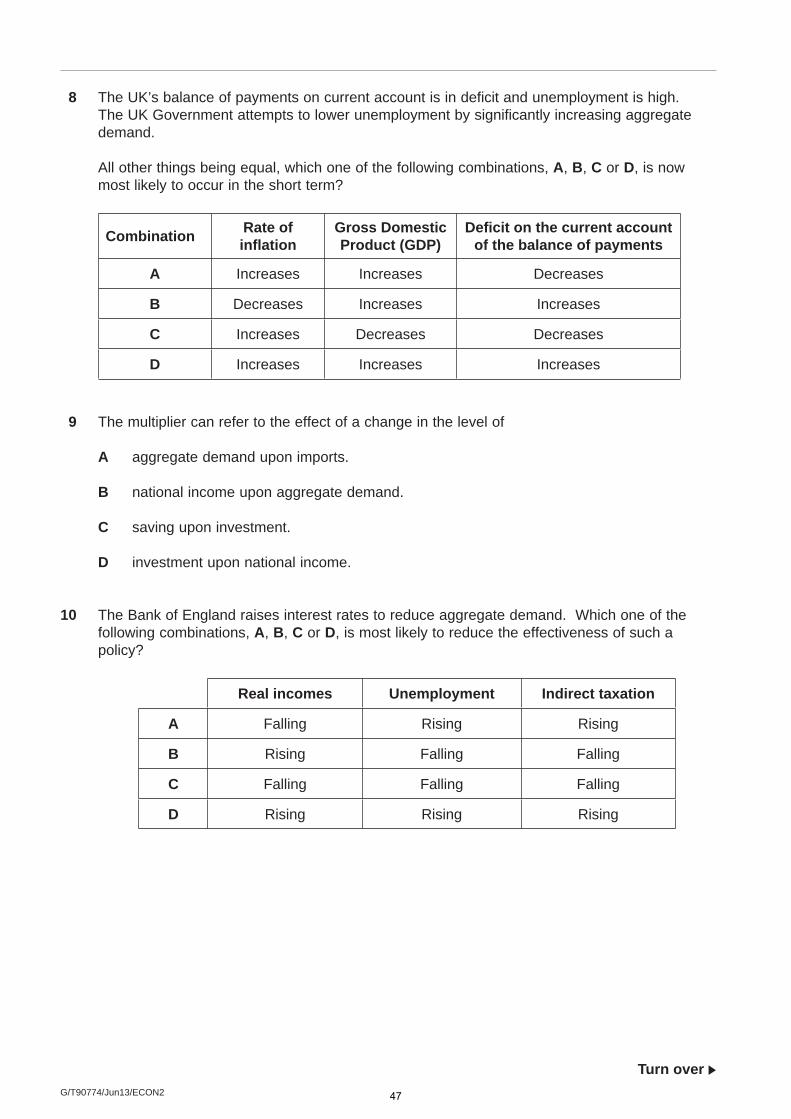
8 The UK’s balance of payments on current account is in deficit and unemployment is high. The UK Government attempts to lower unemployment by significantly increasing aggregate demand.
All other things being equal, which one of the following combinations, A, B, C or D, is now most likely to occur in the short term?
Combination Rate of inflation
Gross Domestic Product (GDP)
Deficit on the current account of the balance of payments
A Increases Increases Decreases
B Decreases Increases Increases
C Increases Decreases Decreases
D Increases Increases Increases
9 The multiplier can refer to the effect of a change in the level of
A aggregate demand upon imports.
B national income upon aggregate demand.
C saving upon investment.
D investment upon national income.
10 The Bank of England raises interest rates to reduce aggregate demand. Which one of the following combinations, A, B, C or D, is most likely to reduce the effectiveness of such a policy?
Real incomes Unemployment Indirect taxation
A Falling Rising Rising
B Rising Falling Falling
C Falling Falling Falling
D Rising Rising Rising
47
G/T90774/Jun13/ECON2
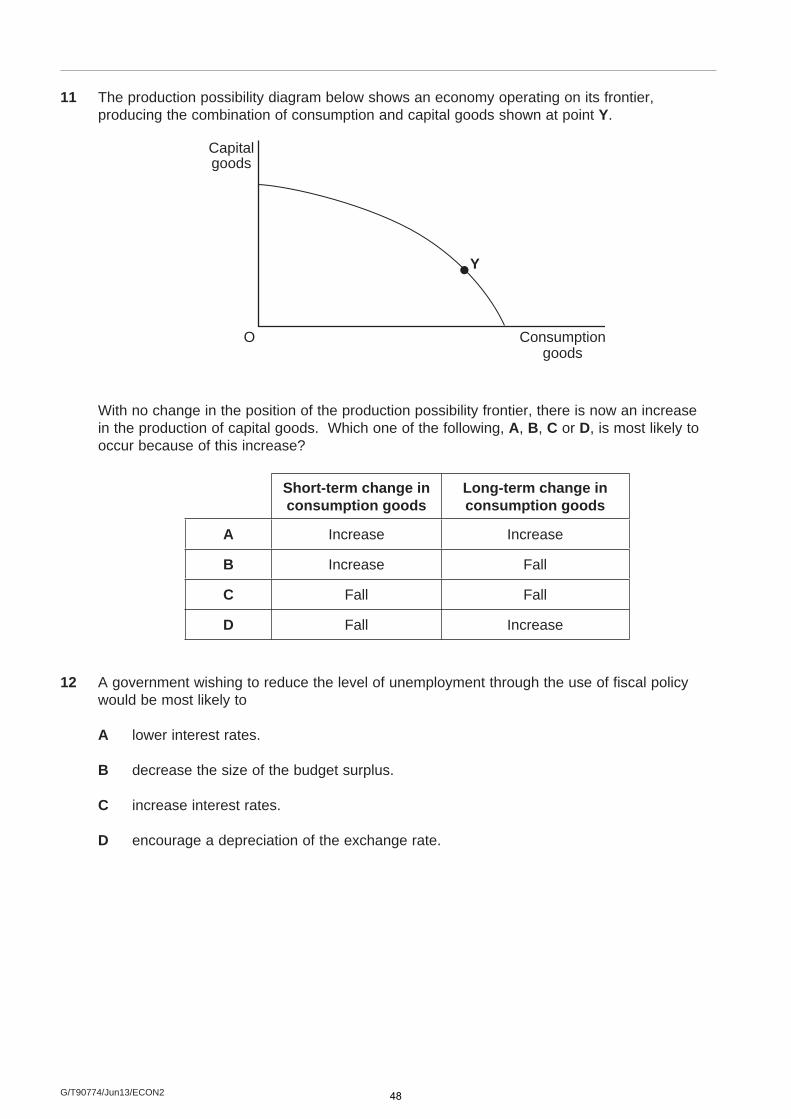
11 The production possibility diagram below shows an economy operating on its frontier, producing the combination of consumption and capital goods shown at point Y.
Consumption
goods
Capitalgoods
Y
O
With no change in the position of the production possibility frontier, there is now an increase in the production of capital goods. Which one of the following, A, B, C or D, is most likely to occur because of this increase?
Short-term change in consumption goods
Long-term change in consumption goods
A Increase Increase
B Increase Fall
C Fall Fall
D Fall Increase
12 A government wishing to reduce the level of unemployment through the use of fiscal policy would be most likely to
A lower interest rates.
B decrease the size of the budget surplus.
C increase interest rates.
D encourage a depreciation of the exchange rate.
48

G/T90774/Jun13/ECON2
13 One of the main functions of supply-side policies in the UK economy is to
A lower the long-run trend rate of growth of the economy.
B create incentives designed to improve economic performance.
C cause the rate of growth of aggregate supply to exceed the rate of growth of aggregate demand.
D reduce the UK’s budget deficit.
14 The economy is growing below its underlying trend rate and unemployment is rising. Which one of the following policies would be the best course of action to remedy the situation?
An increase in
A interest rates to encourage investment
B the exchange rate to increase exports
C indirect taxes to raise consumption
D government spending to boost aggregate demand
15 Which one of the following types of unemployment is best defined as ‘unemployment for short lengths of time between jobs’?
A Frictional
B Seasonal
C Cyclical
D Structural
Turn over 49
G/T90774/Jun13/ECON2
16 If the world economy goes into recession, this is likely to increase unemployment in the UK because
A the ability of other economies to supply UK industry with basic commodities will be reduced.
B the value of goods and services exported from the UK will fall.
C the price of oil and other raw materials is likely to rise.
D the value of the pound will fall on the foreign exchange market.
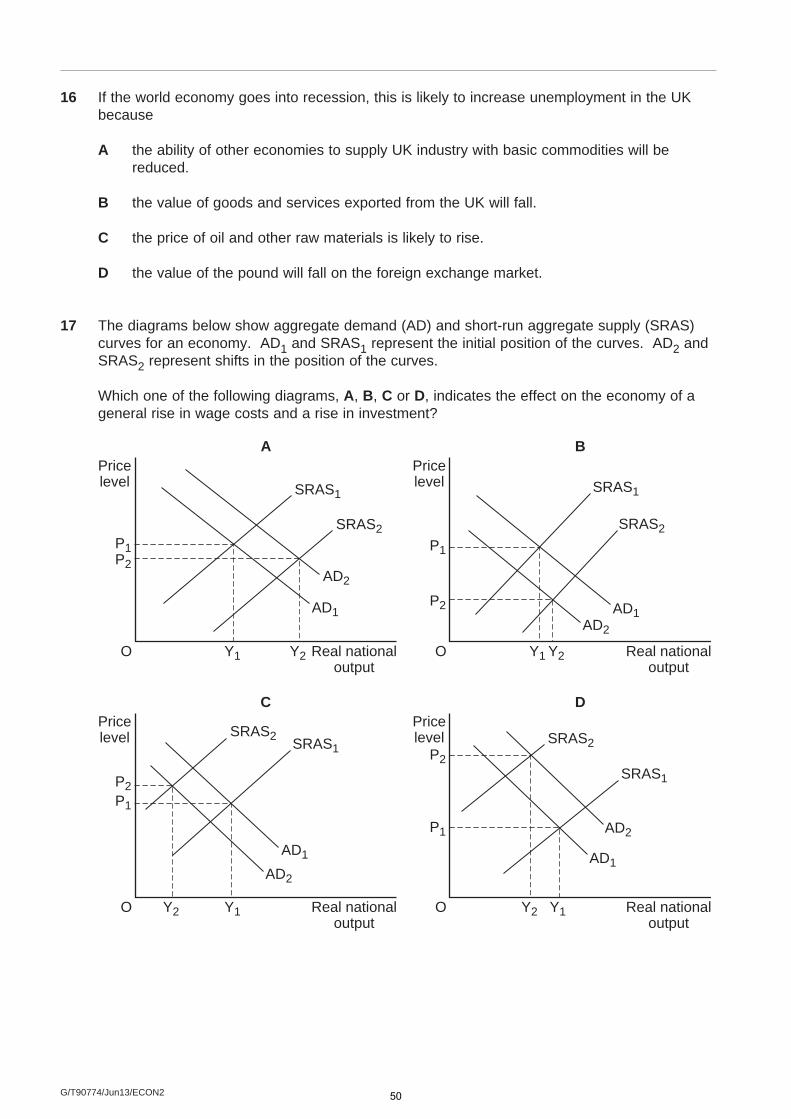
17 The diagrams below show aggregate demand (AD) and short-run aggregate supply (SRAS) curves for an economy. AD1 and SRAS1 represent the initial position of the curves. AD2 and SRAS2 represent shifts in the position of the curves.
Which one of the following diagrams, A, B, C or D, indicates the effect on the economy of a general rise in wage costs and a rise in investment?
Pricelevel
Real nationaloutput
A
O
SRAS2
SRAS1
P1
Y1 Y2
P2AD2
AD1
Pricelevel
Real nationaloutput
B
O
SRAS2
SRAS1
P1
Y1 Y2
P2
AD2
AD1
Pricelevel
Real nationaloutput
C
O
SRAS2 SRAS1
P1
Y1Y2
P2
AD2
AD1
Pricelevel
Real nationaloutput
D
O
SRAS2
SRAS1
P1
Y1Y2
P2
AD2
AD1
50

G/T90774/Jun13/ECON2
Turn over
18 All other things being equal, a fall in the value of the pound against the euro would be expected to affect the UK economy because it is likely to lead to
A an increase in aggregate demand.
B a fall in raw material prices.
C a rise in the euro price of UK exports.
D a reduction in the rate of interest.
19 Which one of the following is a correct statement about monetary policy in the UK?
A Monetary policy is used mainly to affect the supply side of the economy.
B Whenever the government uses contractionary fiscal policy, the Bank of England will use expansionary monetary policy to offset the effects.
C Higher interest rates may reduce inflationary pressure but they may also reduce employment.
D Monetary policy may involve the expansion of the money supply to reduce aggregate demand.
20 In recent years, the UK has experienced large deficits on its balance of payments on current account.
All other things being equal, which one of the following would be most likely to reduce such deficits? A fall in
A aggregate supply
B the exchange rate
C income tax rates
D labour productivity
51

G/T90774/Jun13/ECON2
21 The diagram below shows the aggregate demand (AD) and the short-run aggregate supply (SRAS) curves for an economy, with the initial equilibrium being at point X.
O
U
XV T
S
AD1
AD2
AD3
SRAS3SRAS1
SRAS2
Real nationaloutput
Pricelevel
All other things being equal, what would be the new equilibrium position following a rise in productivity and an increase in imports into the country?
A Point S
B Point T
C Point U
D Point V
22 The long-run trend rate of growth in an economy is declining and the economy is also experiencing an increase in its rate of unemployment. Which one of the following is likely to be most effective in dealing with these problems?
A An expansionary fiscal policy and a restrictive monetary policy
B A restrictive monetary policy and a restrictive fiscal policy
C An expansionary monetary policy and additional supply-side measures
D A restrictive fiscal policy and additional supply-side measures
52

G/T90774/Jun13/ECON2
Turn over
23 Which one of the following is most likely to reduce inflationary pressures in the UK economy?
A An increase in labour productivity
B A fall in the value of the pound
C The emergence of a positive output gap
D A reduction in the rate of interest paid on mortgages
24 A negative output gap necessarily means that the economy
A is in recession.
B is suffering from demand-pull inflation.
C is operating inside its production possibility frontier.
D has a productive potential below its current level of Gross Domestic Product (GDP).
25 Which one of the following is a fundamental determinant of long-run aggregate supply?
A The multiplier
B The output gap
C Real national output
D The institutional structure of the economy
QUESTION 25 IS THE LASTQUESTION IN SECTION A
On your answer sheetIgnore rows 26 to 50
Turn over for Section B
53

G/T90774/Jun13/ECON2
Section B: Data Response
Answer EITHER Context 1 OR Context 2.You are advised to spend at least 50 minutes on Section B.
Total for this Context: 50 marks EITHER
Context 1
GROWTH OF THE UK ECONOMY
Study Extracts A, B and C, and then answer all parts of Context 1 which follow.
Extract A: UK index of real GDP and total employment, 2004 to 2010
2004 2005 2006 2007 2008 2009 2010
Index of real GDP(2008 = 100) 93.3 95.2 97.7 101.1 100.0 95.6 97.3
Employment (millions) 28.48 28.77 29.02 29.23 29.44 28.96 29.04
Source: official statistics, November 2011
Extract B: Growth in 2011 is disappointing
After the severe recession of 2008/2009, it was hoped that the UK economy would stage a strong recovery in the years that followed. However, whilst the economy began its recovery in 2010, the most recent estimate of growth in 2011 is just 0.9%. Meanwhile, in the year up to November 2011, unemployment, as measured by the Labour Force Survey, has risen from 7.9% of the working population to 8.3%.
The Government’s tightening of fiscal policy, designed to reduce the size of the budget deficit, clearly had an impact on growth in 2011 but this alone does not account for the low rate of economic growth. The problems in the eurozone, which affected business and consumer confidence, had an adverse effect on UK exports to Europe and on domestic consumption. However, perhaps the most important reason for low growth was the squeeze on real household disposable income. During 2011, the growth in average weekly earnings was 1.9%, whereas the CPI rate of inflation was 4.2%. The Office for Budget Responsibility says that the fall in real incomes in 2011 was the biggest reduction since the end of the Second World War in 1945. Consumer spending has never been so depressed at this stage of an economic recovery.
1
5
10
15Source: news reports, January 2012
54
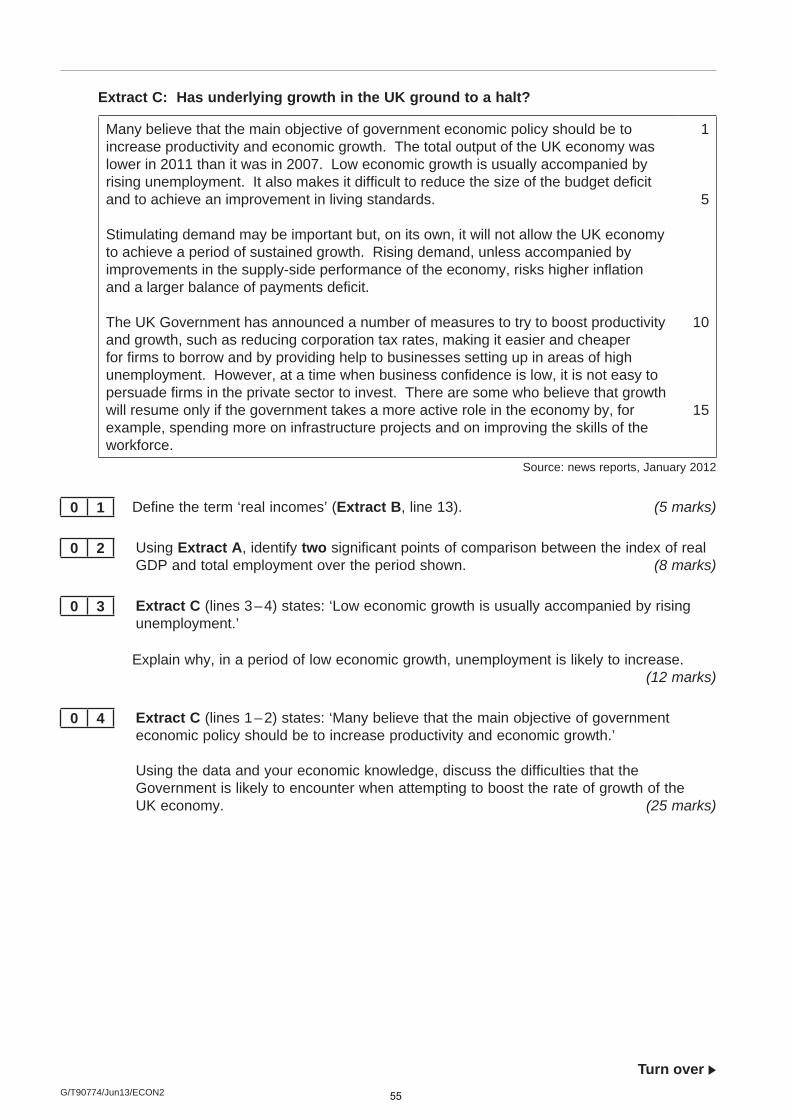
G/T90774/Jun13/ECON2
Turn over
Extract C: Has underlying growth in the UK ground to a halt?
Many believe that the main objective of government economic policy should be to increase productivity and economic growth. The total output of the UK economy was lower in 2011 than it was in 2007. Low economic growth is usually accompanied by rising unemployment. It also makes it difficult to reduce the size of the budget deficit and to achieve an improvement in living standards.
Stimulating demand may be important but, on its own, it will not allow the UK economy to achieve a period of sustained growth. Rising demand, unless accompanied by improvements in the supply-side performance of the economy, risks higher inflation and a larger balance of payments deficit.
The UK Government has announced a number of measures to try to boost productivity and growth, such as reducing corporation tax rates, making it easier and cheaper for firms to borrow and by providing help to businesses setting up in areas of high unemployment. However, at a time when business confidence is low, it is not easy to persuade firms in the private sector to invest. There are some who believe that growth will resume only if the government takes a more active role in the economy by, for example, spending more on infrastructure projects and on improving the skills of the workforce.
1
5
10
15
Source: news reports, January 2012
0 1 Define the term ‘real incomes’ (Extract B, line 13). (5 marks)
0 2 Using Extract A, identify two significant points of comparison between the index of real GDP and total employment over the period shown. (8 marks)
0 3 Extract C (lines 3 – 4) states: ‘Low economic growth is usually accompanied by rising unemployment.’
Explain why, in a period of low economic growth, unemployment is likely to increase.(12 marks)
0 4 Extract C (lines 1 – 2) states: ‘Many believe that the main objective of government economic policy should be to increase productivity and economic growth.’
Using the data and your economic knowledge, discuss the difficulties that the Government is likely to encounter when attempting to boost the rate of growth of the UK economy. (25 marks)
55
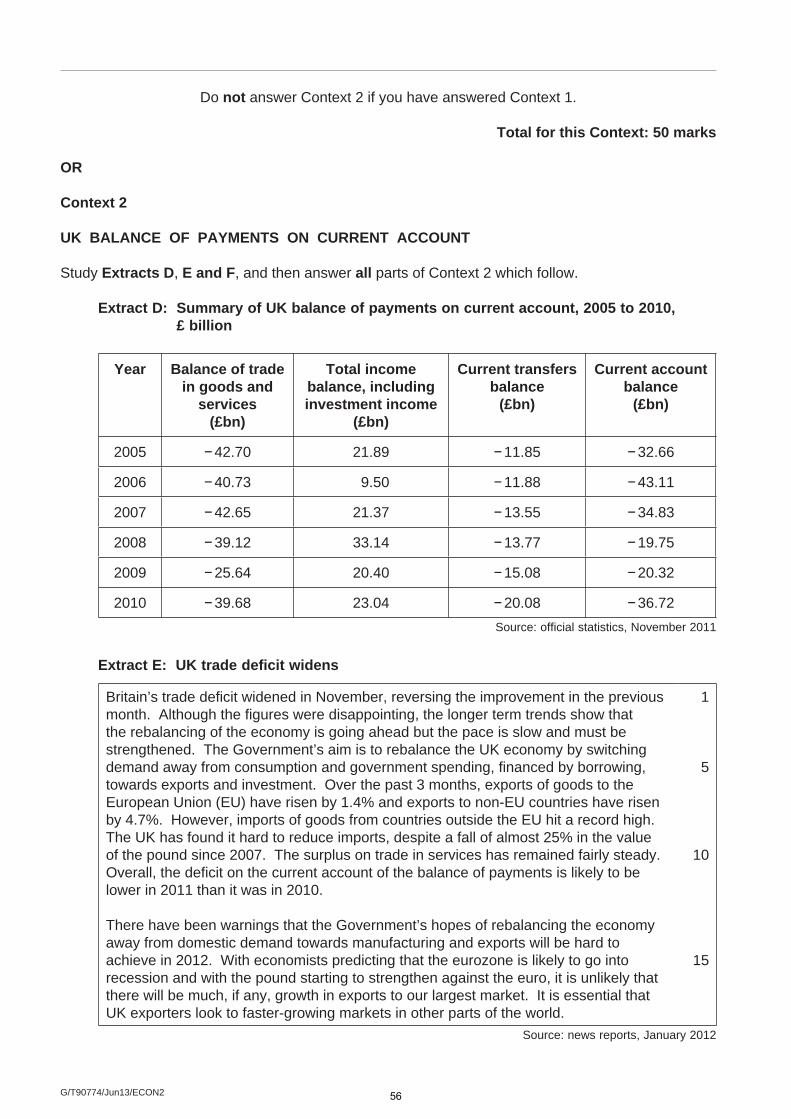
G/T90774/Jun13/ECON2
Do not answer Context 2 if you have answered Context 1.
Total for this Context: 50 marks
OR
Context 2
UK BALANCE OF PAYMENTS ON CURRENT ACCOUNT
Study Extracts D, E and F, and then answer all parts of Context 2 which follow.
Extract D: Summary of UK balance of payments on current account, 2005 to 2010, £ billion
Year Balance of trade in goods and
services(£bn)
Total income balance, including investment income
(£bn)
Current transfers balance
(£bn)
Current account balance
(£bn)
2005 − 42.70 21.89 − 11.85 − 32.66
2006 − 40.73 9.50 − 11.88 − 43.11
2007 − 42.65 21.37 − 13.55 − 34.83
2008 − 39.12 33.14 − 13.77 − 19.75
2009 − 25.64 20.40 − 15.08 − 20.32
2010 − 39.68 23.04 − 20.08 − 36.72Source: official statistics, November 2011
Extract E: UK trade deficit widens
Britain’s trade deficit widened in November, reversing the improvement in the previous month. Although the figures were disappointing, the longer term trends show that the rebalancing of the economy is going ahead but the pace is slow and must be strengthened. The Government’s aim is to rebalance the UK economy by switching demand away from consumption and government spending, financed by borrowing, towards exports and investment. Over the past 3 months, exports of goods to the European Union (EU) have risen by 1.4% and exports to non-EU countries have risen by 4.7%. However, imports of goods from countries outside the EU hit a record high. The UK has found it hard to reduce imports, despite a fall of almost 25% in the value of the pound since 2007. The surplus on trade in services has remained fairly steady. Overall, the deficit on the current account of the balance of payments is likely to be lower in 2011 than it was in 2010.
There have been warnings that the Government’s hopes of rebalancing the economy away from domestic demand towards manufacturing and exports will be hard to achieve in 2012. With economists predicting that the eurozone is likely to go into recession and with the pound starting to strengthen against the euro, it is unlikely that there will be much, if any, growth in exports to our largest market. It is essential that UK exporters look to faster-growing markets in other parts of the world.
1
5
10
15
Source: news reports, January 2012
56
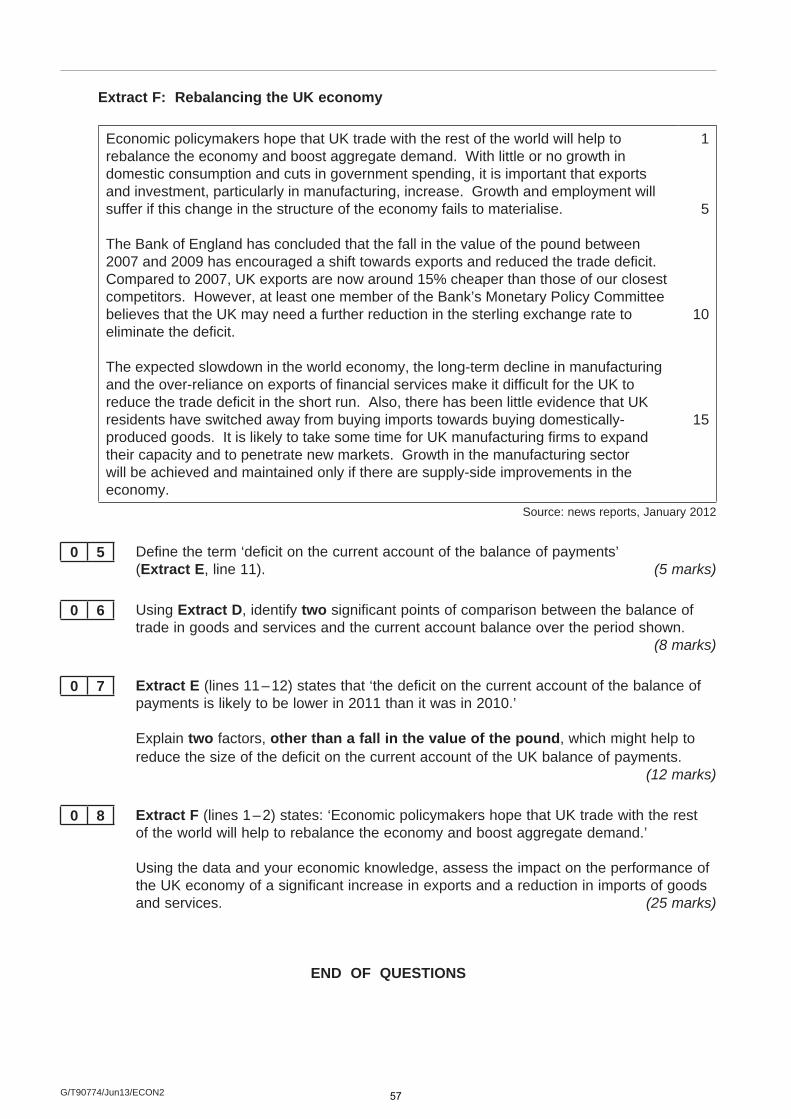
G/T90774/Jun13/ECON2
Extract F: Rebalancing the UK economy
Economic policymakers hope that UK trade with the rest of the world will help to rebalance the economy and boost aggregate demand. With little or no growth in domestic consumption and cuts in government spending, it is important that exports and investment, particularly in manufacturing, increase. Growth and employment will suffer if this change in the structure of the economy fails to materialise.
The Bank of England has concluded that the fall in the value of the pound between 2007 and 2009 has encouraged a shift towards exports and reduced the trade deficit. Compared to 2007, UK exports are now around 15% cheaper than those of our closest competitors. However, at least one member of the Bank’s Monetary Policy Committee believes that the UK may need a further reduction in the sterling exchange rate to eliminate the deficit.
The expected slowdown in the world economy, the long-term decline in manufacturing and the over-reliance on exports of financial services make it difficult for the UK to reduce the trade deficit in the short run. Also, there has been little evidence that UK residents have switched away from buying imports towards buying domestically-produced goods. It is likely to take some time for UK manufacturing firms to expand their capacity and to penetrate new markets. Growth in the manufacturing sector will be achieved and maintained only if there are supply-side improvements in the economy.
1
5
10
15
Source: news reports, January 2012
0 5 Define the term ‘deficit on the current account of the balance of payments’ (Extract E, line 11). (5 marks)
0 6 Using Extract D, identify two significant points of comparison between the balance of trade in goods and services and the current account balance over the period shown.
(8 marks)
0 7 Extract E (lines 11 – 12) states that ‘the deficit on the current account of the balance of payments is likely to be lower in 2011 than it was in 2010.’
Explain two factors, other than a fall in the value of the pound, which might help to reduce the size of the deficit on the current account of the UK balance of payments.
(12 marks)
0 8 Extract F (lines 1 – 2) states: ‘Economic policymakers hope that UK trade with the rest of the world will help to rebalance the economy and boost aggregate demand.’
Using the data and your economic knowledge, assess the impact on the performance of the UK economy of a significant increase in exports and a reduction in imports of goods and services. (25 marks)
END OF QUESTIONS
57

V
GJ
E
(
U
V1.0
GeneraJune 20
Econo
(Spec
Unit 2
al Certi013
omics
cificati
2: The
ficate o
s
ion 21
Natio
of Edu
140)
onal E
F
cation
Econo
Fina
(A-lev
omy
al
Mar
vel)
rk S
ECON
Sche
N2
eme
e
59
Mark schemes are prepared by the Principal Examiner and considered, together with the relevant questions, by a panel of subject teachers. This mark scheme includes any amendments made at the standardisation events which all examiners participate in and is the scheme which was used by them in this examination. The standardisation process ensures that the mark scheme covers the students’ responses to questions and that every examiner understands and applies it in the same correct way. As preparation for standardisation each examiner analyses a number of students’ scripts: alternative answers not already covered by the mark scheme are discussed and legislated for. If, after the standardisation process, examiners encounter unusual answers which have not been raised they are required to refer these to the Principal Examiner. It must be stressed that a mark scheme is a working document, in many cases further developed and expanded on the basis of students’ reactions to a particular paper. Assumptions about future mark schemes on the basis of one year’s document should be avoided; whilst the guiding principles of assessment remain constant, details will change, depending on the content of a particular examination paper.
Further copies of this Mark Scheme are available from: aqa.org.uk Copyright © 2013 AQA and its licensors. All rights reserved. Copyright AQA retains the copyright on all its publications. However, registered schools/colleges for AQA are permitted to copy material from this booklet for their own internal use, with the following important exception: AQA cannot give permission to schools/colleges to photocopy any material that is acknowledged to a third party even for internal use within the centre. Set and published by the Assessment and Qualifications Alliance. The Assessment and Qualifications Alliance (AQA) is a company limited by guarantee registered in England and Wales (company number 3644723) and a registered charity (registered charity number 1073334). Registered address: AQA, Devas Street, Manchester M15 6EX.
60

Mark Scheme – General Certificate of Education (A-level) Economics – ECON2 – June 2013
AQA Advanced Subsidiary Economics
June 2013 ECON2/1
Section A: Objective Test (ECON 2/1) The following list indicates the correct answers used in marking the candidates’
responses.
KEY LIST
1. A 9. D 17. D
2. B 10. B 18. A
3. A 11. D 19. C
4. D 12. B 20. B
5. A 13. B 21. C
6. C 14. D 22. C
7. D 15. A 23. A
8. D 16. B 24. C
25. D
61
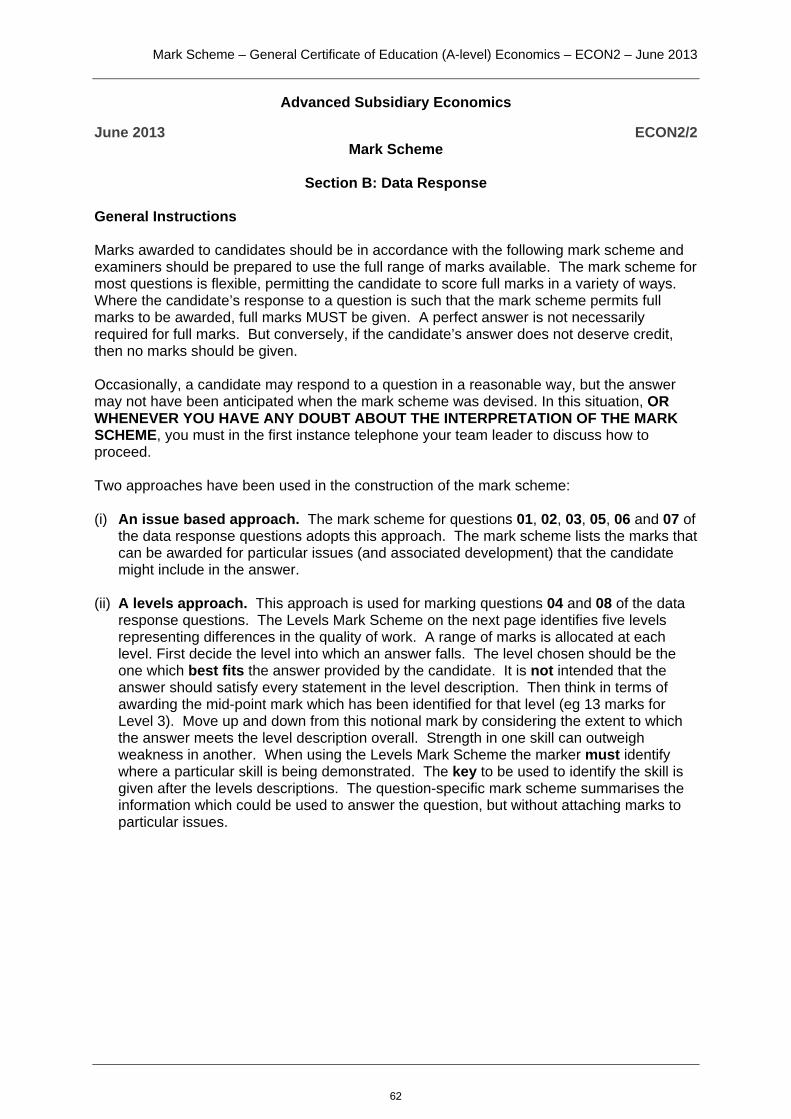
Mark Scheme – General Certificate of Education (A-level) Economics – ECON2 – June 2013
Advanced Subsidiary Economics
June 2013 ECON2/2 Mark Scheme
Section B: Data Response
General Instructions Marks awarded to candidates should be in accordance with the following mark scheme and examiners should be prepared to use the full range of marks available. The mark scheme for most questions is flexible, permitting the candidate to score full marks in a variety of ways. Where the candidate’s response to a question is such that the mark scheme permits full marks to be awarded, full marks MUST be given. A perfect answer is not necessarily required for full marks. But conversely, if the candidate’s answer does not deserve credit, then no marks should be given. Occasionally, a candidate may respond to a question in a reasonable way, but the answer may not have been anticipated when the mark scheme was devised. In this situation, OR WHENEVER YOU HAVE ANY DOUBT ABOUT THE INTERPRETATION OF THE MARK SCHEME, you must in the first instance telephone your team leader to discuss how to proceed. Two approaches have been used in the construction of the mark scheme: (i) An issue based approach. The mark scheme for questions 01, 02, 03, 05, 06 and 07 of
the data response questions adopts this approach. The mark scheme lists the marks that can be awarded for particular issues (and associated development) that the candidate might include in the answer.
(ii) A levels approach. This approach is used for marking questions 04 and 08 of the data response questions. The Levels Mark Scheme on the next page identifies five levels representing differences in the quality of work. A range of marks is allocated at each level. First decide the level into which an answer falls. The level chosen should be the one which best fits the answer provided by the candidate. It is not intended that the answer should satisfy every statement in the level description. Then think in terms of awarding the mid-point mark which has been identified for that level (eg 13 marks for Level 3). Move up and down from this notional mark by considering the extent to which the answer meets the level description overall. Strength in one skill can outweigh weakness in another. When using the Levels Mark Scheme the marker must identify where a particular skill is being demonstrated. The key to be used to identify the skill is given after the levels descriptions. The question-specific mark scheme summarises the information which could be used to answer the question, but without attaching marks to particular issues.
62
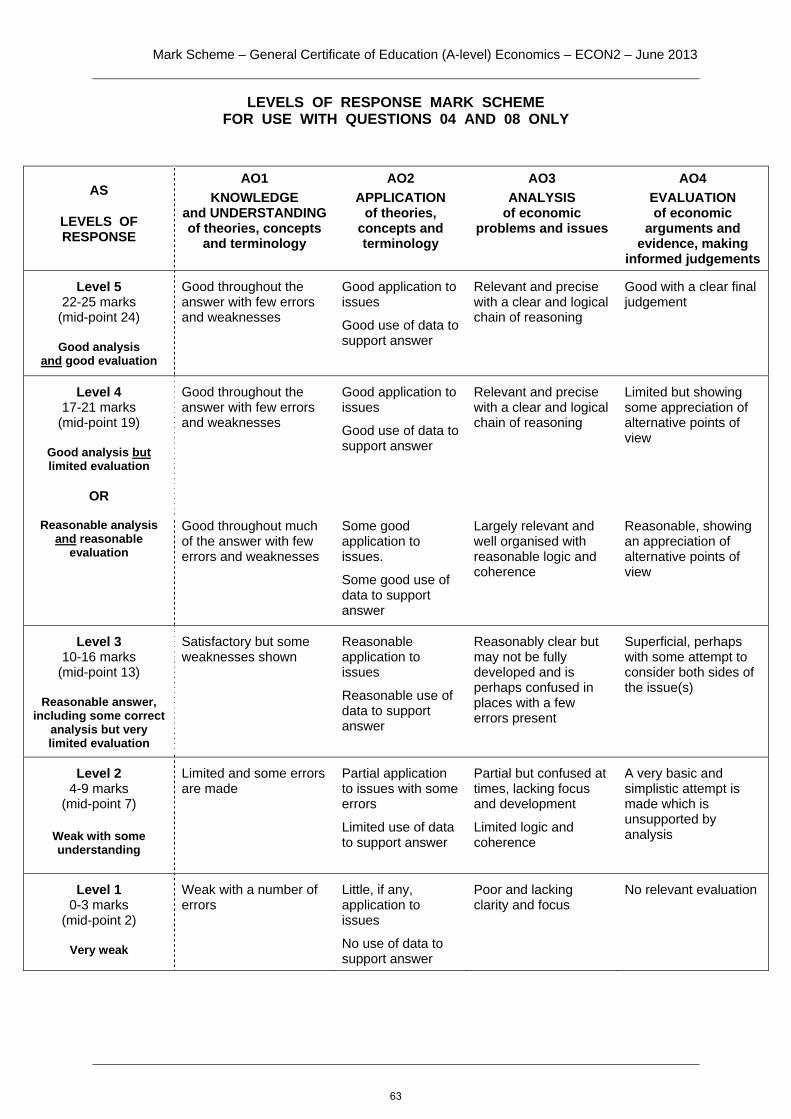
Mark Scheme – General Certificate of Education (A-level) Economics – ECON2 – June 2013
LEVELS OF RESPONSE MARK SCHEME FOR USE WITH QUESTIONS 04 AND 08 ONLY
AS
LEVELS OF RESPONSE
AO1 KNOWLEDGE
and UNDERSTANDING of theories, concepts
and terminology
AO2 APPLICATION
of theories, concepts and terminology
AO3 ANALYSIS
of economic problems and issues
AO4 EVALUATION of economic
arguments and evidence, making
informed judgements
Level 5 22-25 marks
(mid-point 24)
Good analysis and good evaluation
Good throughout the answer with few errors and weaknesses
Good application to issues
Good use of data to support answer
Relevant and precise with a clear and logical chain of reasoning
Good with a clear final judgement
Level 4 17-21 marks
(mid-point 19)
Good analysis but limited evaluation
OR
Good throughout the answer with few errors and weaknesses
Good application to issues
Good use of data to support answer
Relevant and precise with a clear and logical chain of reasoning
Limited but showing some appreciation of alternative points of view
Reasonable analysis and reasonable
evaluation
Good throughout much of the answer with few errors and weaknesses
Some good application to issues.
Some good use of data to support answer
Largely relevant and well organised with reasonable logic and coherence
Reasonable, showing an appreciation of alternative points of view
Level 3 10-16 marks
(mid-point 13)
Reasonable answer, including some correct
analysis but very limited evaluation
Satisfactory but some weaknesses shown
Reasonable application to issues
Reasonable use of data to support answer
Reasonably clear but may not be fully developed and is perhaps confused in places with a few errors present
Superficial, perhaps with some attempt to consider both sides of the issue(s)
Level 2 4-9 marks
(mid-point 7)
Weak with some understanding
Limited and some errors are made
Partial application to issues with some errors
Limited use of data to support answer
Partial but confused at times, lacking focus and development
Limited logic and coherence
A very basic and simplistic attempt is made which is unsupported by analysis
Level 1 0-3 marks
(mid-point 2)
Very weak
Weak with a number of errors
Little, if any, application to issues
No use of data to support answer
Poor and lacking clarity and focus
No relevant evaluation
63

Mark Scheme – General Certificate of Education (A-level) Economics – ECON2 – June 2013
THE KEY TO BE USED WHEN USING THE LEVELS MARK SCHEME D Where a particular economic term is correctly DEFINED in order to help the
candidate to answer the question properly. I Where a relevant ISSUE is raised by the candidate. K Where the candidate demonstrates KNOWLEDGE of recent developments or
features of the economy which help enhance the candidate’s response to the question. This should also be used where the candidate quotes relevant examples.
Ap Where the candidate demonstrates the ability to APPLY knowledge and CRITICAL
UNDERSTANDING to problems and issues. An Where the candidate demonstrates the ability to ANALYSE the problem using
appropriate economic ideas. E Where the candidate EVALUATES and makes judgements about the significance
of various issues and arguments.
QUALITY OF WRITTEN COMMUNICATION
Quality of Written Communication (QWC) will be assessed in Questions 04 and 08 only. Candidates will be assessed according to their ability to:
ensure that text is legible, and that spelling, grammar and punctuation are accurate, so that meaning is clear
select and use a form and style of writing appropriate to purpose and complex subject matter
organise information clearly and coherently, using specialist vocabulary when appropriate.
No specific marks are awarded for QWC. However, examiners should take into account QWC when determining the mark to be awarded for an answer. This means an answer could be taken either up (for exceptional QWC) or down (for very poor QWC) by 1 mark (and no more)
64

Mark Scheme – General Certificate of Education (A-level) Economics – ECON2 – June 2013
EITHER Context 1 Total for this Context: 50 marks
For an acceptable definition such as: the amount of money coming into a household (received by an
individual) over a period of time after the effects of inflation have been removed
income is the flow of money coming into a household/received by an individual. ‘Real’ means that the effects of inflation have been removed
it is the value of a person’s wage/salary after the effects of inflation have been taken into account.
the monetary value of the total output produced by the economy adjusted for inflation
5 marks
Full marks should be awarded to a candidate who demonstrates a clear understanding of the term ‘real incomes’ even if the definition is not exactly the same as the acceptable examples quoted above.
If the definition is inaccurate or incomplete, marks may be broken down, for example, as follows:
Real means that the effects of inflation have been removed. Also accept: Inflation has been taken into account
Nominal/money income minus inflation
3 marks
Income is the amount of money coming into a household over a period of time. OR Income is the flow of money coming into a household/received by an individual.
3 marks
For ‘money coming into the household’ or ‘money earned’ without mentioning ‘flow’ or ‘over a period of time’.
The marks can be awarded for a statement such as ‘the amount of money a household receives after paying tax and national insurance’ even though this indicates a confusion between ‘real’ and ‘disposable’ income.
2 marks
For examples such as: wages/salary, dividends, interest on savings, commissions and bonuses. DO NOT accept items of wealth such as: shares, savings
1 mark per example - up to a maximum of
2 marks for examples
NB: Candidates who define incomes in terms of the total flow of money received by all households in the economy should not be penalised. This is equally acceptable.
Maximum of 4 marks if the definition is incomplete or inaccurate MAXIMUM FOR PART 01: 5 MARKS
01 Define the term ‘real incomes’ (Extract B line 13). (5 marks)
65

Mark Scheme – General Certificate of Education (A-level) Economics – ECON2 – June 2013
Award up to 4 marks for each significant point made.
Identifies a significant point of comparison Makes accurate use of the data to support the comparison identified Unit of measurement given accurately.
4 marks
Identifies a significant point of comparison Makes use of the data to support the comparison identified However, no unit of measurement is given and/or the unit of measurement is used/applied inaccurately and/or the dates aren’t quoted or are inaccurate. NB A unit of measurement is NOT required for ‘the index of real GDP’
3 marks
Identifies a significant point of comparison No correct use of the data to support the comparison identified 2 marks
Identifies a significant feature of one data series but no comparison is made. Makes use of the data to support the feature identified Unit of measurement given accurately
1 mark
If a candidate identifies more than 2 significant points of comparison, reward the best two. The valid points include: At the start of the period, the index of real GDP was lower (index of 93.3) than at the end
of the period (index of 97.3). Employment was also lower at the start of the period (28.48 million) than at the end of the period (29.04 million)
The lowest index of real GDP was in 2004 (93.3) and employment was also at its lowest in 2004 (28.48 million)
The highest index of real GDP was in 2007 (101.1) whereas employment was at its
highest in 2008 (29.44 million)
For most of the period, there is a positive (also allow ‘direct relationship’ but NOT ‘proportional’) relationship between real GDP and employment. For example, between 2004 and 2007 both real GDP (93.3 to 101.1) and employment increase (28.48 million to 29.23 million).
OR The only time when there is an inverse relationship between real GDP and employment
is between 2007 and 2008. The index of GDP falls from 101.1 to 100.0 whereas employment rises from 29.23 million to 29.44 million
The data shows evidence of a cyclical pattern. The economy is growing between 2004 and 2007, it goes into recession between 2007 and 2009 before starting to recover in 2010. This must be supported by quoting figures for BOTH employment and real GDP
The variation in the index of real GDP is between 93.3 and 101.1 whereas employment varies between 28.48 million and 29.44 million.
MAXIMUM FOR PART 02: 8 MARKS
02 Using Extract A, identify two significant points of comparison between the index of real GDP and total employment over the period shown. (8 marks)
66
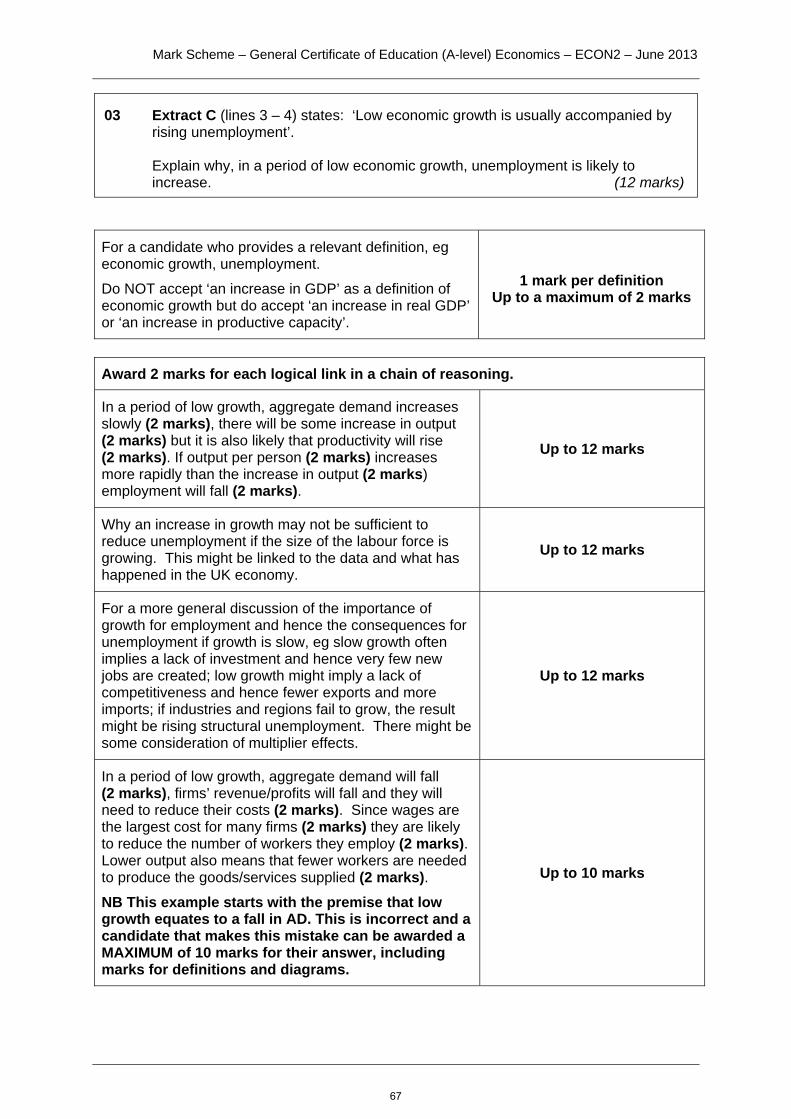
Mark Scheme – General Certificate of Education (A-level) Economics – ECON2 – June 2013
For a candidate who provides a relevant definition, eg economic growth, unemployment.
Do NOT accept ‘an increase in GDP’ as a definition of economic growth but do accept ‘an increase in real GDP’ or ‘an increase in productive capacity’.
1 mark per definition Up to a maximum of 2 marks
Award 2 marks for each logical link in a chain of reasoning.
In a period of low growth, aggregate demand increases slowly (2 marks), there will be some increase in output (2 marks) but it is also likely that productivity will rise (2 marks). If output per person (2 marks) increases more rapidly than the increase in output (2 marks) employment will fall (2 marks).
Up to 12 marks
Why an increase in growth may not be sufficient to reduce unemployment if the size of the labour force is growing. This might be linked to the data and what has happened in the UK economy.
Up to 12 marks
For a more general discussion of the importance of growth for employment and hence the consequences for unemployment if growth is slow, eg slow growth often implies a lack of investment and hence very few new jobs are created; low growth might imply a lack of competitiveness and hence fewer exports and more imports; if industries and regions fail to grow, the result might be rising structural unemployment. There might be some consideration of multiplier effects.
Up to 12 marks
In a period of low growth, aggregate demand will fall (2 marks), firms’ revenue/profits will fall and they will need to reduce their costs (2 marks). Since wages are the largest cost for many firms (2 marks) they are likely to reduce the number of workers they employ (2 marks). Lower output also means that fewer workers are needed to produce the goods/services supplied (2 marks). NB This example starts with the premise that low growth equates to a fall in AD. This is incorrect and a candidate that makes this mistake can be awarded a MAXIMUM of 10 marks for their answer, including marks for definitions and diagrams.
Up to 10 marks
03 Extract C (lines 3 – 4) states: ‘Low economic growth is usually accompanied by rising unemployment’.
Explain why, in a period of low economic growth, unemployment is likely to
increase. (12 marks)
67

Mark Scheme – General Certificate of Education (A-level) Economics – ECON2 – June 2013
Award up to 4 additional marks for the use of relevant diagrams, eg an AD/AS diagram that illustrates why a small rise in aggregate demand, and hence growth, will lead to an increase in the size of the negative output gap if underlying growth, illustrated by a rightward shift in the LRAS curves is greater than the rise in AD (or short-run growth). Candidates who show a leftward shift in the AD curve leading to falling real GDP can also be awarded up to 4 marks for their diagram. They may, or may not, show an increase in the size of the negative output gap. Candidates should also be rewarded for appropriate use of a production possibility diagram. To achieve 4 marks for such a diagram, the candidate must show that the gap between the current level of output and potential output (ie the PPC boundary) has increased.
Similarly, candidates should be rewarded for appropriate use of a ‘trend growth diagram’. To achieve 4 marks they must show an increase in the size of the negative output gap.
A maximum of 4 marks can be awarded for diagrams.
Breakdown of the marks for the diagram if an AD/AS diagram is used:
Axes labelled (allow on the vertical axis: Inflation or PL or £ but not Price or P; allow on the horizontal axis: Real GDP, National Output, Output or Y but not Quantity or Q). Original AD (and AS curve) labelled correctly. Dotted lines and showing the original price level and real GDP (PL1 Y1).
1 mark only
For showing a valid shift in the AD curve (must be consistent with the written explanation). 2 marks
For showing a rightward shift in the LRAS curve 1 mark
Dotted lines and associated labelling showing the new level of real GDP and price level. 1 mark
For clearly labelling the negative output gap 1 mark
Breakdown of the marks for the diagram if a PPC diagram is used:
Axes labelled (eg allow: ‘Consumer Goods and Capital Goods’, ‘Goods and Services’ or ‘Good A and Good B’). Original PPC boundary and the initial output of the economy. The initial output can be either on or inside the boundary.
1 mark only
For showing a rightward shift in the PPC boundary. 1 mark
The new position of the economy; for 2 marks, this must show an increase in the size of the negative output gap. If the diagram just shows a negative output gap then only 1 mark can be awarded.
2 marks
For clearly labelling the increase in the negative output gap 1 mark
68

Mark Scheme – General Certificate of Education (A-level) Economics – ECON2 – June 2013
Breakdown of the marks for the diagram if a ‘trend growth diagram’ is used:
Axes labelled (allow on the vertical axis: Real GDP, National Output, Output or Y but not just GDP. Also, do not allow Growth or GDP growth unless the trend growth curve is shown as a horizontal straight line; only allow on the horizontal axis: time). The trend growth and actual growth lines labelled.
1 mark only
For both marks, the new position of the economy must show that there has been an increase in the size of the negative output gap. If the diagram just shows a negative output gap then only 1 mark can be awarded.
2 marks
For clearly labelling the increase in the negative output gap 1 mark
If the candidate only explains why a fall in an aggregate demand/output will lead to an increase in unemployment, then a maximum of 10 marks in total can be awarded. If, anywhere in their answer, the candidate indicates that low growth means a fall in AD or a fall in output, this constraint must be applied. For example, the constraint will apply if they draw a diagram showing AD shifting to the left.
MAXIMUM FOR PART 03: 12 MARKS
69

ExampAD/AS Ideally, the LRAgrowth, as the in
In Figur
In Figur Howevehence hAn AD/Aachieve
Price
O
Price
O
Mark Sche
les of suitadiagram: the diagram
AS (AS) curthe negativ
ncrease in t
re 1, the neg
re 2, the neg
er, if the ADhigher une/AS diagrame up to 4 m
Level
AD
Level
AD
eme – Gener
able diagra
m should shrve should sve output gathe product
gative outpu
gative outpu
D/AS diagremploymenm that just
marks
D1
AD
D1
A
ral Certificate
ams include
how a rightwshift by moreap is likely tive capacity
ut gap incre
ut gap incre
ram just shnt, up to 4 m
shows a r
YE1
D2
YE1 YN1
LRAS1
AD2
e of Educatio
e:
ward shift ine than the Ato increase y of the eco
eases from
eases from
hows a fall marks can ightward s
SRAS1
YE2
YFE1
SRAS1
YE21
on (A-level) E
n both the AAD curve tobecause A
onomy.
(OYN1 – OY
(OYFE1 – OY
in AD leadstill be aw
shift in the
YN
LRAS
Economics –
D and LRAo show that,D does not
YE1) to (OYN
YE1) to (OY
ing to lowearded for tLRAS curv
Re
SRAS2
YFE2
Re
SRAS2
N2
2
ECON2 – Ju
AS (AS) curv, in a periodincrease as
N2 – OYE2)
YFE2 – OYE2)
er output athe diagramve can also
Figure 1
eal GDP
eal GDP
Figure 2
une 2013
ves but d of low s much
and m. o
2
70

Mark Scheme – General Certificate of Education (A-level) Economics – ECON2 – June 2013
A PPC diagram
The movement from X to Y represents the low growth of the economy resulting from an increase in AD. The rightward shift in the PPC represents the increase in the productive capacity of the economy. The diagram shows that since the increase in AD is less than the increase in productive capacity, a negative output gap will emerge. This means that unemployment will increase. Point X does NOT have to be on the PPC boundary. However, to get full marks for the diagram, the distance between X and Y should be less than the distance between the two PPCs. This indicates an increase in unemployment because the negative output gap will be bigger at point Y than at point X.
A PPC diagram showing a negative output gap, such as the one above, can be awarded up to 2 marks. Both the initial and the final position of the economy are required for 2 marks.
Goods
Services
. X
. Y
Services
Goods
. Y
. X
71

Mark Scheme – General Certificate of Education (A-level) Economics – ECON2 – June 2013
A trend growth diagram that illustrates the economic cycle
The diagram shows that, over time, as the economy moves from point X to point Y, the size of the negative output gap increases. In a period of low growth, the amount of spare capacity increases and hence unemployment also increases. To get the full 4 marks for the diagram, the vertical distance between the actual and trend growth lines must be larger at point Y than at point X.
MAXIMUM FOR PART 03: 12 MARKS
X Y
Real GDP
Time
Trend growth
Actual growth
72

Mark Scheme – General Certificate of Education (A-level) Economics – ECON2 – June 2013
Extracts B and C provide some help to candidates and it is expected that they will make use of this material when developing their answers. It is anticipated that good answers will analyse demand-side and supply-side policies that might be used to try to increase economic growth. Good answers will also discuss the pros and particularly the cons of individual policies and consider possible conflicts between economic growth and other policy objectives. For this question, an answer should be limited to a maximum of 13 marks if there is no evidence of evaluation. A maximum of 21 marks may be awarded if there is no explicit use of the data, eg through the use of quotes or referring explicitly to the extracts.
Level 5 Good analysis and good evaluation 22-25 marks Mid-point 24
Level 4 Good analysis but limited evaluation OR Reasonable analysis and reasonable evaluation
17-21 marks Mid-point 19
Level 3 Reasonable answer, including some correct analysis but very limited evaluation
10-16 marks Mid-point 13
Level 2 Weak with some understanding 4-9 marks Mid-point 7
Level 1 Very weak 0-3 marks Mid-point 2
Introduction
define economic growth, perhaps distinguishing between short-run growth (actual growth) and long-run growth (underlying growth)
explain the phrase ‘to boost the rate of economic growth’ mention that growth might conflict with other policy objectives draw a diagram to illustrate what is meant by economic growth, eg a
PPC diagram or an AD/AS diagram identify policies that might be adopted to boost economic growth.
Developing the response to the question: (Application)
the application of economic theory in a manner which is relevant to the question asked
Extract B refers to ‘The Government’s tightening of fiscal policy’ and candidates might use this when discussing aggregate demand and supply-side fiscal measures designed to stimulate growth
Extract C mentions that boosting demand to stimulate growth ‘risks higher inflation and a larger balance of payments deficit’
Extract C also mentions that ‘when business confidence is fragile, it is not easy to persuade firms in the private sector to invest’
04 Extract C (lines 1 – 2) states: ‘Many believe that the main objective of government economic policy should be to increase productivity and economic growth.’
Using the data and your economic knowledge, discuss the difficulties that the Government is likely to encounter when attempting to boost the rate of growth of the UK economy. (25 marks)
73
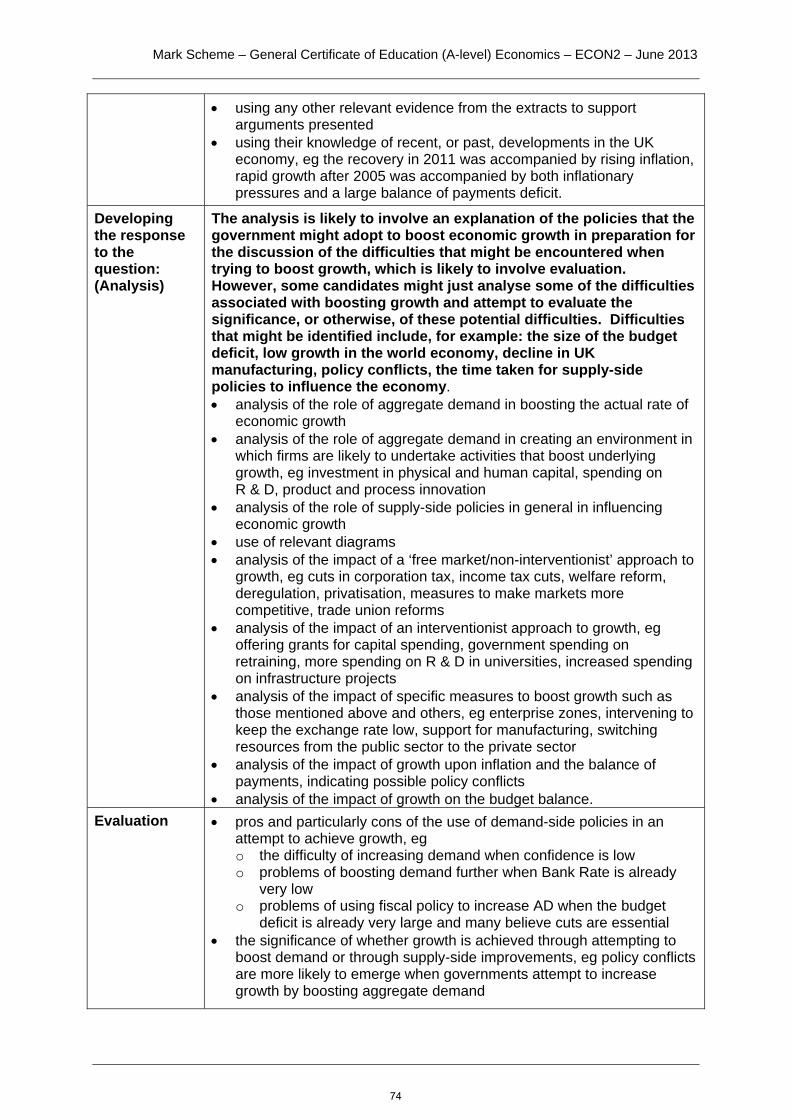
Mark Scheme – General Certificate of Education (A-level) Economics – ECON2 – June 2013
using any other relevant evidence from the extracts to support arguments presented
using their knowledge of recent, or past, developments in the UK economy, eg the recovery in 2011 was accompanied by rising inflation, rapid growth after 2005 was accompanied by both inflationary pressures and a large balance of payments deficit.
Developing the response to the question: (Analysis)
The analysis is likely to involve an explanation of the policies that the government might adopt to boost economic growth in preparation for the discussion of the difficulties that might be encountered when trying to boost growth, which is likely to involve evaluation. However, some candidates might just analyse some of the difficulties associated with boosting growth and attempt to evaluate the significance, or otherwise, of these potential difficulties. Difficulties that might be identified include, for example: the size of the budget deficit, low growth in the world economy, decline in UK manufacturing, policy conflicts, the time taken for supply-side policies to influence the economy. analysis of the role of aggregate demand in boosting the actual rate of
economic growth analysis of the role of aggregate demand in creating an environment in
which firms are likely to undertake activities that boost underlying growth, eg investment in physical and human capital, spending on R & D, product and process innovation
analysis of the role of supply-side policies in general in influencing economic growth
use of relevant diagrams analysis of the impact of a ‘free market/non-interventionist’ approach to
growth, eg cuts in corporation tax, income tax cuts, welfare reform, deregulation, privatisation, measures to make markets more competitive, trade union reforms
analysis of the impact of an interventionist approach to growth, eg offering grants for capital spending, government spending on retraining, more spending on R & D in universities, increased spending on infrastructure projects
analysis of the impact of specific measures to boost growth such as those mentioned above and others, eg enterprise zones, intervening to keep the exchange rate low, support for manufacturing, switching resources from the public sector to the private sector
analysis of the impact of growth upon inflation and the balance of payments, indicating possible policy conflicts
analysis of the impact of growth on the budget balance. Evaluation pros and particularly cons of the use of demand-side policies in an
attempt to achieve growth, eg o the difficulty of increasing demand when confidence is low o problems of boosting demand further when Bank Rate is already
very low o problems of using fiscal policy to increase AD when the budget
deficit is already very large and many believe cuts are essential the significance of whether growth is achieved through attempting to
boost demand or through supply-side improvements, eg policy conflicts are more likely to emerge when governments attempt to increase growth by boosting aggregate demand
74

Mark Scheme – General Certificate of Education (A-level) Economics – ECON2 – June 2013
the problems of introducing some supply-side measures when there is already a large budget deficit, eg spending to improve the transport network or improve education and training
if the government spends more on supply-side measures it will either have to cut spending elsewhere, raise taxes or borrow more. However, if higher growth is achieved, this may help to reduce the budget deficit, particularly as a percentage of GDP
attempts to boost growth might increase inflation but increasing capacity and productivity can help to moderate inflationary pressures
attempts to boost growth might increase the current account deficit but, in the long run, increasing productivity and competitiveness may help to reduce the current account deficit
supply-side improvements are unlikely to be achieved quickly and policies designed to improve supply-side performance aren’t always effective
growth may require some rebalancing of the UK economy from services to manufacturing and/or from the public to private sectors. This is not easy to achieve and may result in some structural unemployment
Growth is more dependent on external factors rather than government policy, eg technological change, developments in financial markets, growth in Europe and the world economy
use of the data from Extracts B and C to support arguments presented use of own knowledge of developments in the UK economy to support
the issues raised.
Examiners should note that credit can be given for basic evaluation. For example, a candidate might simply identify some pros and cons of supply-side policies designed to achieve growth. Basic evaluation (and good analysis) would allow the answer to achieve low Level 4. Stronger evaluation is provided by candidates who demonstrate that they recognise that there is a variety of approaches that can be adopted to try to stimulate growth but that the effectiveness of these policies cannot be guaranteed. Good evaluation is also likely to include discussion of the particular difficulties that exist at the present time and possible policy conflicts.
THE LEVELS MARK SCHEME ON PAGES 5 & 6TO DETERMINE THE MARK TO BE AWARDED FOR THE CANDIDATE’S RESPONSE TO THIS QUESTION
MAXIMUM FOR PART 04: 25 MARKS
75

Mark Scheme – General Certificate of Education (A-level) Economics – ECON2 – June 2013
OR Context 2 Total for this Context: 50 marks
For an acceptable definition such as: the current account of the balance of payments records trade in goods
and services, income flows (or investment income) and current transfers. The account is in deficit when the debit items (outflows/negatives) are greater than credit items (inflows/positives).
the current account of the balance of payments records trade in goods and services, income flows (or investment income) and current transfers. The account is in deficit when imports are greater than exports.
it is when the imports of both visible and invisible items is greater than the export of visible and invisible items.
5 marks
Full marks should be awarded to a candidate who demonstrates a clear understanding of the term ‘deficit on the current account of the balance of payments’ even if the definition is not exactly the same as the acceptable examples quoted above.
If the definition is inaccurate or incomplete, marks may be broken down, for example, as follows:
The current account is in deficit when imports of goods and services are greater than exports of goods and services 4 marks
The current account is in deficit when imports are greater than exports.
Although this is not correct, allow ‘when the volume of imports is greater than the volume of exports’.
3 marks
The current account of the balance of payments records trade in goods and services, income flows (or investment income) and current transfers, ie there is no indication of what is meant by ‘deficit’.
3 marks
The balance of payments is a record of a country’s financial transactions with the rest of the world. 2 marks
The current account records exports and imports of goods and services. 2 marks
The current account records exports and imports. 1 mark
Defining income flows or giving an example of an ‘income flow’. 1 mark
Defining current transfers or giving an example of a ‘current transfer’. 1 mark
Giving an example of a service that might be exported or imported. 1 mark
Maximum of 4 marks if the definition is incomplete or inaccurate MAXIMUM FOR PART 05: 5 MARKS
05 Define the term ‘deficit on the current account of the balance of payments’ (Extract E, line 11). (5 marks)
76

Mark Scheme – General Certificate of Education (A-level) Economics – ECON2 – June 2013
Award up to 4 marks for each significant point made
Identifies a significant point of comparison Makes accurate use of the data to support the comparison identified Unit of measurement given accurately
4 marks
Identifies a significant point of comparison Makes use of the data to support the comparison identified However, no unit of measurement is given and/or the unit of measurement is used/applied inaccurately and/or the dates aren’t quoted or are inaccurate.
3 marks
Identifies a significant point of comparison No correct use of the data to support the comparison identified
2 marks
Identifies a significant feature of one data series but no comparison is made. Makes use of the data to support the feature identified Unit of measurement given accurately
1 mark
If a candidate identifies more than 2 significant points of comparison, reward the best two The valid points include: At the start of the period the deficit on the balance of trade in goods and services was
higher than at the end of the period (the deficit fell from £42.70 billion to £39.68 billion). On the other hand, the deficit on the current account was lower at the start of the period than at the end of the period (the deficit increased from £32.66 billion to £36.72 billion).
The lowest deficit on the balance of trade in goods and services was in 2009 (£25.64 billion) whereas the lowest deficit on the current account was in 2008 (£19.75 billion)
The highest deficit on the balance of trade in goods and services was in 2005 (£42.70 billion) whereas the highest deficit on the current account was in 2006 (£43.11 billion)
Over the period the balance of trade in goods and services fluctuated less than the current account balance. The range for the balance of trade in goods and services was £17.06 billion whereas the range for the current account balance was £23.36 billion.
With the exception of 2006, the deficit on the balance of trade in goods and services was always higher than the deficit on the current account. For example, in 2010 the deficit on the balance of trade in goods and services was £39.68 billion whereas the deficit on the current account was £36.72 billion. OR
The only year in which the deficit on the balance of trade in goods and services was lower than the deficit on the current account was 2006. In 2006, deficit on the balance of trade in goods and services was £40.73 billion whereas the current account deficit was higher at £43.11 billion.
Both the balance of trade in goods and services and the current account balance are in deficit throughout the period, for example, in 2007 the deficit on balance of trade in goods and services was £42.65 billion and the current account deficit was £34.83 billion.
MAXIMUM FOR PART 06: 8 MARKS
06 Using Extract D, identify two significant points of comparison between the balance of trade in goods and services and the current account balance over the period shown. (8 marks)
77
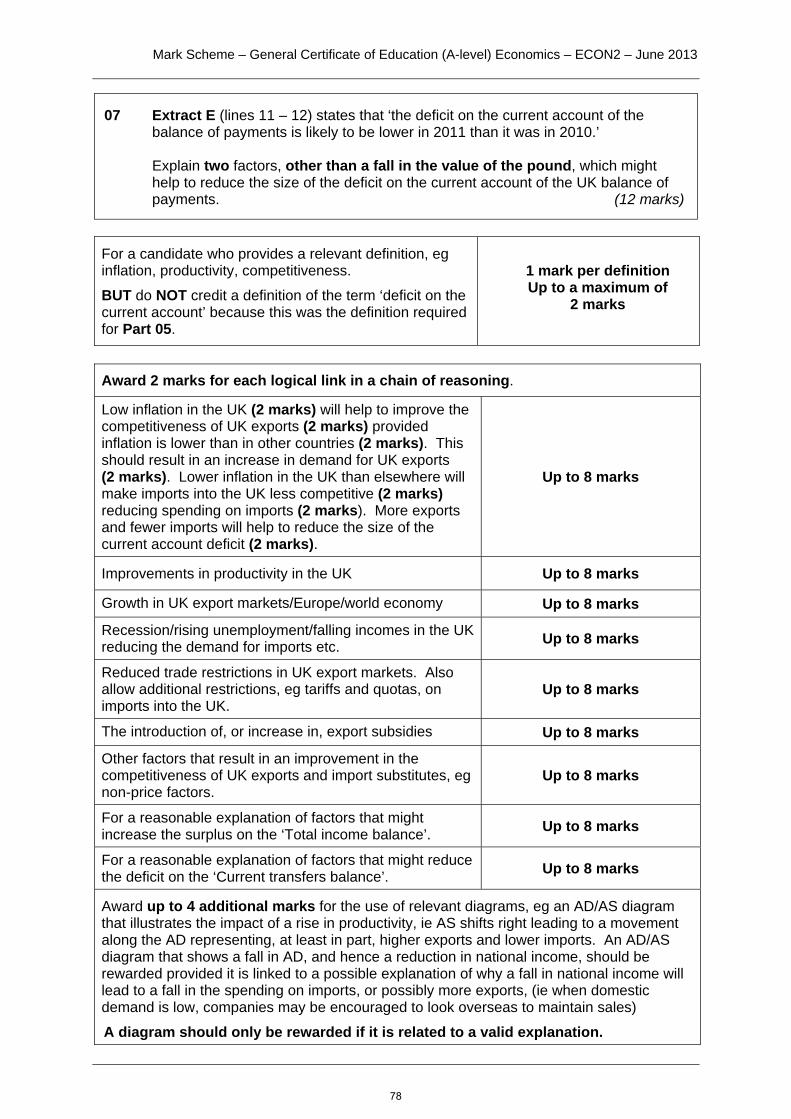
Mark Scheme – General Certificate of Education (A-level) Economics – ECON2 – June 2013
For a candidate who provides a relevant definition, eg inflation, productivity, competitiveness.
BUT do NOT credit a definition of the term ‘deficit on the current account’ because this was the definition required for Part 05.
1 mark per definition Up to a maximum of
2 marks
Award 2 marks for each logical link in a chain of reasoning.
Low inflation in the UK (2 marks) will help to improve the competitiveness of UK exports (2 marks) provided inflation is lower than in other countries (2 marks). This should result in an increase in demand for UK exports (2 marks). Lower inflation in the UK than elsewhere will make imports into the UK less competitive (2 marks) reducing spending on imports (2 marks). More exports and fewer imports will help to reduce the size of the current account deficit (2 marks).
Up to 8 marks
Improvements in productivity in the UK Up to 8 marks
Growth in UK export markets/Europe/world economy Up to 8 marks
Recession/rising unemployment/falling incomes in the UK reducing the demand for imports etc. Up to 8 marks
Reduced trade restrictions in UK export markets. Also allow additional restrictions, eg tariffs and quotas, on imports into the UK.
Up to 8 marks
The introduction of, or increase in, export subsidies Up to 8 marks
Other factors that result in an improvement in the competitiveness of UK exports and import substitutes, eg non-price factors.
Up to 8 marks
For a reasonable explanation of factors that might increase the surplus on the ‘Total income balance’. Up to 8 marks
For a reasonable explanation of factors that might reduce the deficit on the ‘Current transfers balance’. Up to 8 marks
Award up to 4 additional marks for the use of relevant diagrams, eg an AD/AS diagram that illustrates the impact of a rise in productivity, ie AS shifts right leading to a movement along the AD representing, at least in part, higher exports and lower imports. An AD/AS diagram that shows a fall in AD, and hence a reduction in national income, should be rewarded provided it is linked to a possible explanation of why a fall in national income will lead to a fall in the spending on imports, or possibly more exports, (ie when domestic demand is low, companies may be encouraged to look overseas to maintain sales)
A diagram should only be rewarded if it is related to a valid explanation.
07 Extract E (lines 11 – 12) states that ‘the deficit on the current account of the balance of payments is likely to be lower in 2011 than it was in 2010.’
Explain two factors, other than a fall in the value of the pound, which might
help to reduce the size of the deficit on the current account of the UK balance of payments. (12 marks)
78

Mark Scheme – General Certificate of Education (A-level) Economics – ECON2 – June 2013
Breakdown of the marks for a diagram:
Axes labelled (allow on the vertical axis: Inflation or PL or £ but not Price or P; allow on the horizontal axis: Real GDP, National Output, Output or Y but not Quantity or Q). Original AD (and AS curve) labelled correctly. Dotted lines and showing the original price level and real GDP (PL1 Y1).
1 mark only
For showing a valid shift in the curve (must be consistent with the written explanation). 2 marks
Dotted lines and associated labelling showing the new level of real GDP and the new price level (PL2 Y2).
1 mark
Do not award any marks for defining the exchange rate or explaining the effect of a change in the exchange rate on the current account balance. Award a maximum of 10 marks if only ONE factor is identified. However, 12 marks can be awarded provided the candidate has identified two factors, even if one of the factors is not valid. For example, 8 marks could be awarded for a valid explanation of one factor plus 4 marks for a relevant diagram.
MAXIMUM FOR PART 07: 12 MARKS
79
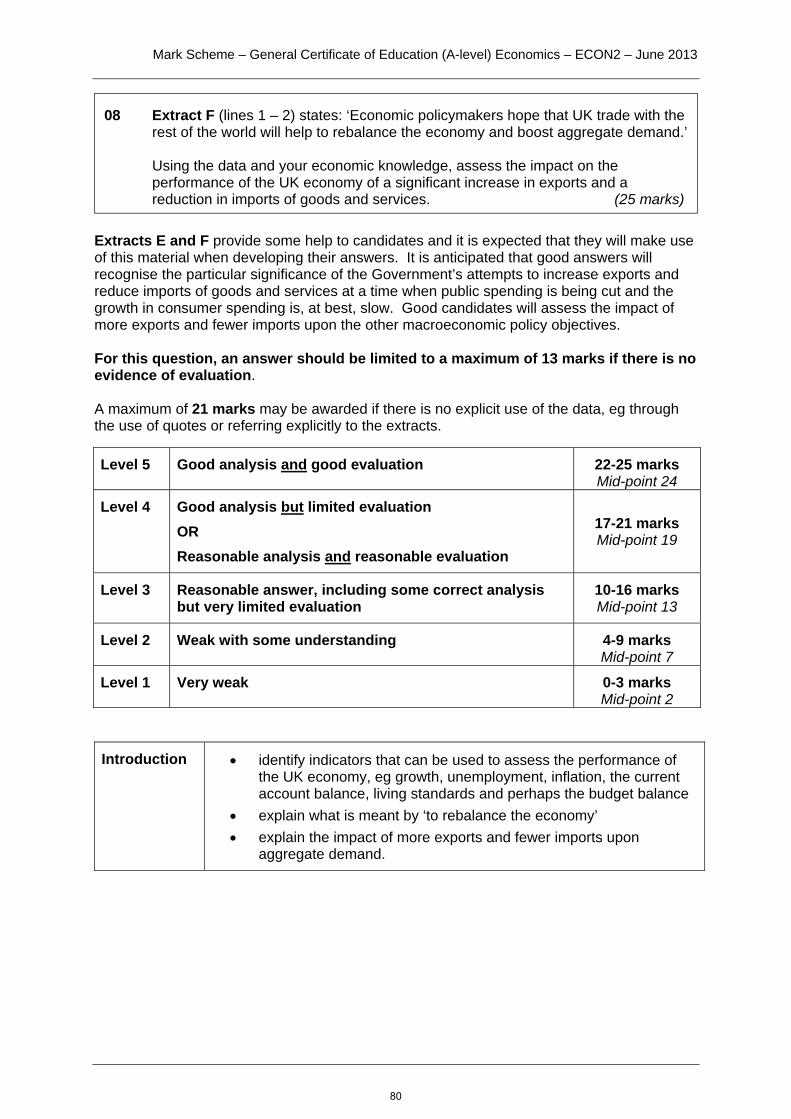
Mark Scheme – General Certificate of Education (A-level) Economics – ECON2 – June 2013
Extracts E and F provide some help to candidates and it is expected that they will make use of this material when developing their answers. It is anticipated that good answers will recognise the particular significance of the Government’s attempts to increase exports and reduce imports of goods and services at a time when public spending is being cut and the growth in consumer spending is, at best, slow. Good candidates will assess the impact of more exports and fewer imports upon the other macroeconomic policy objectives. For this question, an answer should be limited to a maximum of 13 marks if there is no evidence of evaluation. A maximum of 21 marks may be awarded if there is no explicit use of the data, eg through the use of quotes or referring explicitly to the extracts.
Level 5 Good analysis and good evaluation 22-25 marks Mid-point 24
Level 4 Good analysis but limited evaluation OR Reasonable analysis and reasonable evaluation
17-21 marks Mid-point 19
Level 3 Reasonable answer, including some correct analysis but very limited evaluation
10-16 marks Mid-point 13
Level 2 Weak with some understanding 4-9 marks Mid-point 7
Level 1 Very weak 0-3 marks Mid-point 2
Introduction
identify indicators that can be used to assess the performance of
the UK economy, eg growth, unemployment, inflation, the current account balance, living standards and perhaps the budget balance
explain what is meant by ‘to rebalance the economy’ explain the impact of more exports and fewer imports upon
aggregate demand.
08 Extract F (lines 1 – 2) states: ‘Economic policymakers hope that UK trade with the rest of the world will help to rebalance the economy and boost aggregate demand.’
Using the data and your economic knowledge, assess the impact on the
performance of the UK economy of a significant increase in exports and a reduction in imports of goods and services. (25 marks)
80

Mark Scheme – General Certificate of Education (A-level) Economics – ECON2 – June 2013
Developing the response to the question: (Application)
the application of economic theory in a manner which is relevant to the question asked
comments in Extract E referring to the difficulties that are likely to be encountered in achieving an increase in exports and cut in imports
Extract F – the importance to the economy when there is ‘little or no growth in domestic consumption and cuts in government spending’
Extract F – the importance for growth and unemployment – ‘Growth and employment will suffer if this change in the structure of the economy fails to materialise.’
using other evidence from the extracts to support arguments presented
using their knowledge of recent, or past, developments in the UK economy.
Developing the response to the question: (Analysis)
the impact upon aggregate demand and possible multiplier and accelerator effects
analysis of the impact on the actual rate of economic growth use of AD/AS analysis to illustrate the impact analysis of the impact of the consequent increase in aggregate
demand on employment and unemployment analysis of the possible impact upon structural unemployment, eg
the growth in exports may require transferring resources from services into manufacturing
analysis of the possible impact upon the underlying rate of economic growth
analysis of the impact of more exports and fewer imports and the consequent increase in aggregate demand upon inflation
analysis of the impact upon the exchange rate and hence inflationary pressures (Not expected at AS level but some candidates might include this in their answer and should be rewarded for doing so)
impact on the performance of different sectors of the economy, eg manufacturing compared to services, public sector compared to the private sector, regional consequences
analysis of possible effects on living standards.
Evaluation discussion of the significance of the way in which the rebalancing is achieved and the impact on the performance of the UK economy, eg whether it results from a fall in the exchange rate, growth in the rest of the world or underlying supply-side improvements
depends on the magnitude of the increase in exports and fall in imports whether or not the change is sustained
why boosting exports and reducing imports is particularly important at a time when the budget deficit is being reduced and domestic consumption is constrained
whether the change is likely to help or hinder in the achievement of the other macroeconomic policy objectives.
81
Mark Scheme – General Certificate of Education (A-level) Economics – ECON2 – June 2013
an overall assessment of whether or not a significant increase in exports and reduction in imports of goods and services is likely to be beneficial for the UK economy
the difficulties that are likely to be encountered when attempting to achieve a significant increase in exports and reduction in imports of goods and services
use of the data from Extracts E and F to support arguments presented
use of own knowledge of developments in the UK economy to support or cast doubt on the views presented.
Examiners should note that credit can be given for basic evaluation. For example, a candidate might just explain the impact on the other macroeconomic policy objectives and, as a result, judge whether or not a significant increase in exports and reduction in imports is likely to improve the performance of the UK economy. Basic evaluation (and good analysis) would allow the answer to achieve low Level 4. Stronger evaluation is provided by candidates who are able to assess the impact on the UK economy in relation to current economic circumstances and who recognise that the effects will depend on the way in which the increase in exports and reduction in imports is achieved.
THE LEVELS MARK SCHEME ON PAGES 5 & 6 TO DETERMINE THE MARK TO BE
AWARDED FOR THE CANDIDATE’S RESPONSE TO THIS QUESTION
MAXIMUM FOR PART 08: 25 MARKS
82

Price Elasticity of Demand Tasks Question 1 Price e _ _ _ t _ _ _ _ y of de _ _ _ _ (PED) measures the extent to which a change in the _ _ _ ce of the product a _ fe _ ts the quantity demanded. The formula used to cal _ _ la _ e the p _ _ _ e elasticity of demand is: PED = Question 2 Complete the following sentences: If a given percentage change in the price of the product leads to a greater percentage change in the quantity demand then demand is If a given percentage change in the price of the product leads to a smaller percentage change in the quantity demand then demand is Question 3 Price elasticity of demand is always negative. Explain why. _____________________________________________________________________________________
_____________________________________________________________________________________
_____________________________________________________________________________________
Question 4 Cross out the incorrect words in the following two sentences Ignoring the sign, if demand is elastic, the numerical value of the price elasticity of demand is greater than/equal to/less than 1. Ignoring the sign, if demand is inelastic, the numerical value of the price elasticity of demand is greater than/equal to/less than 1.
83
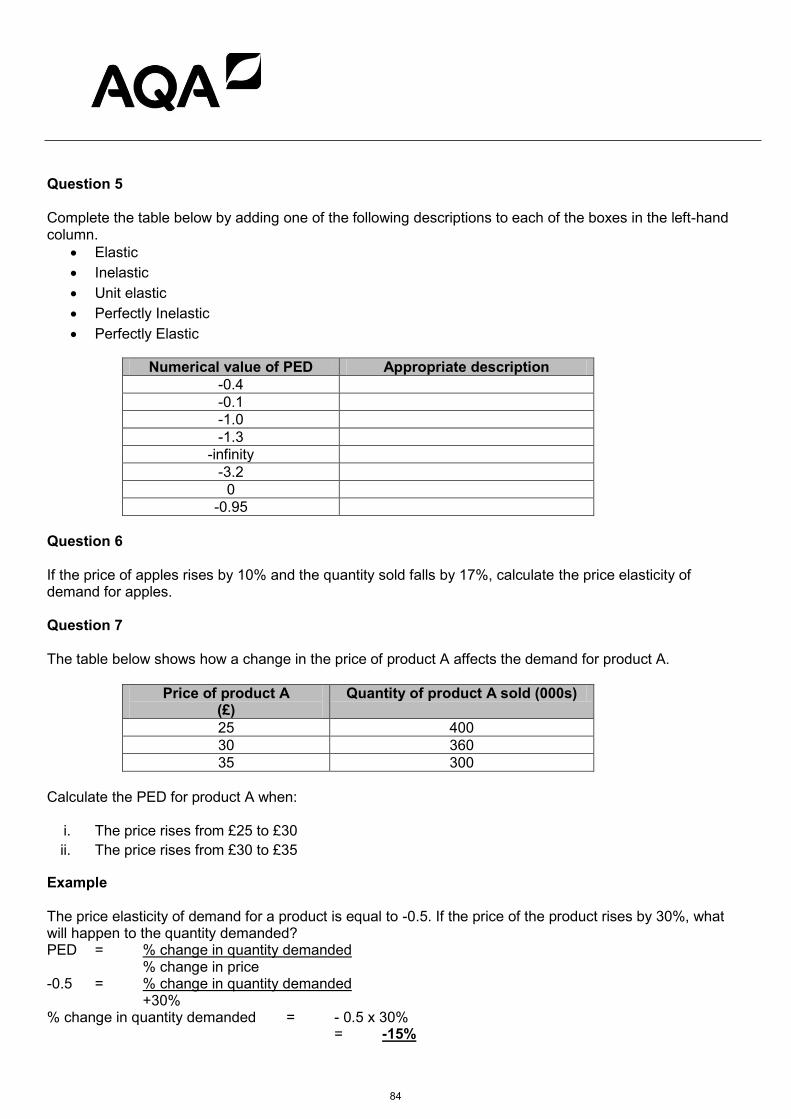
Question 5 Complete the table below by adding one of the following descriptions to each of the boxes in the left-hand column.
Elastic Inelastic Unit elastic Perfectly Inelastic Perfectly Elastic
Numerical value of PED Appropriate description -0.4 -0.1 -1.0 -1.3
-infinity -3.2
0 -0.95
Question 6 If the price of apples rises by 10% and the quantity sold falls by 17%, calculate the price elasticity of demand for apples. Question 7 The table below shows how a change in the price of product A affects the demand for product A.
Price of product A (£)
Quantity of product A sold (000s)
25 400 30 360 35 300
Calculate the PED for product A when:
i. The price rises from £25 to £30 ii. The price rises from £30 to £35
Example The price elasticity of demand for a product is equal to -0.5. If the price of the product rises by 30%, what will happen to the quantity demanded? PED = % change in quantity demanded % change in price -0.5 = % change in quantity demanded +30% % change in quantity demanded = - 0.5 x 30% = -15%
84

Question 8 The price elasticity of demand for a product is equal to -2.0. If the price of the product rises by 8%, calculate what will happen to the quantity demanded? Question 9 The price elasticity of demand for a product is equal to -0.75. If the price of the product rises by 12%, calculate what will happen to the quantity demanded? Question 10 A product has a price elasticity of demand of 3.0%. If the price of the product falls by 5%:
i. What will happen to the quantity sold?
ii. Will the total revenue the firm receives from selling the product rise, fall or remain the same?
iii. Explain your answer.
Question 11 A product has a price elasticity of demand of 0.6%. If the price of the product rises by 10%:
i. What will happen to the quantity sold?
ii. Will the total revenue the firm receives from selling the product rise, fall or remain the same?
iii. Explain your answer.
Question 12 Fill in the missing words so that what is written in each cell explains what will happen to total revenue when the price changes, as indicated in the left-hand column of the table, and the price elasticity of demand, as shown in the top row of the table. PED>1 PED=1 PED<1
Price rises
Total revenue will: Total revenue will: Total revenue will:
Price falls
Total revenue will: Total revenue will: Total revenue will:
85

ECON2 Context 1 [01] Define the term ‘real incomes’ (Extract B, line 13). Student Exemplar 1
Student Exemplar 2
86
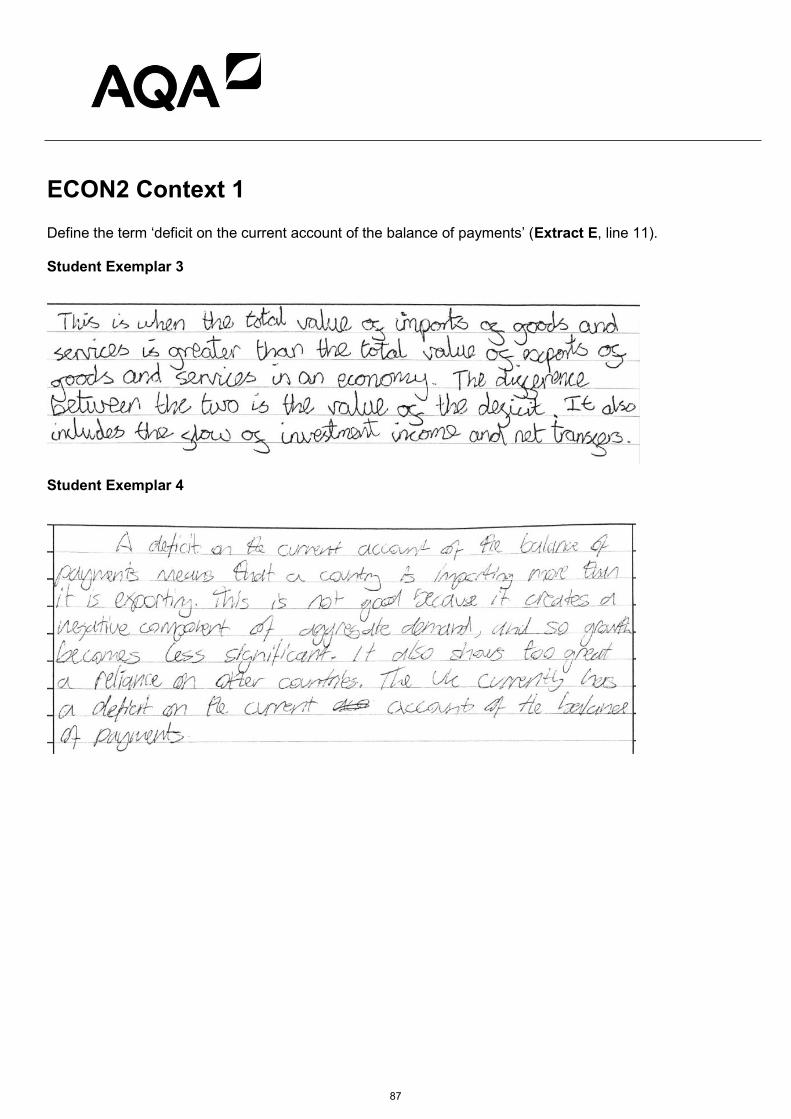
ECON2 Context 1 Define the term ‘deficit on the current account of the balance of payments’ (Extract E, line 11). Student Exemplar 3
Student Exemplar 4
87

ECON1 Context 2 Define the term ‘productive efficiency’ (Extract E, line 12). Student Exemplar 5
Student Exemplar 6
Student Exemplar 7
88
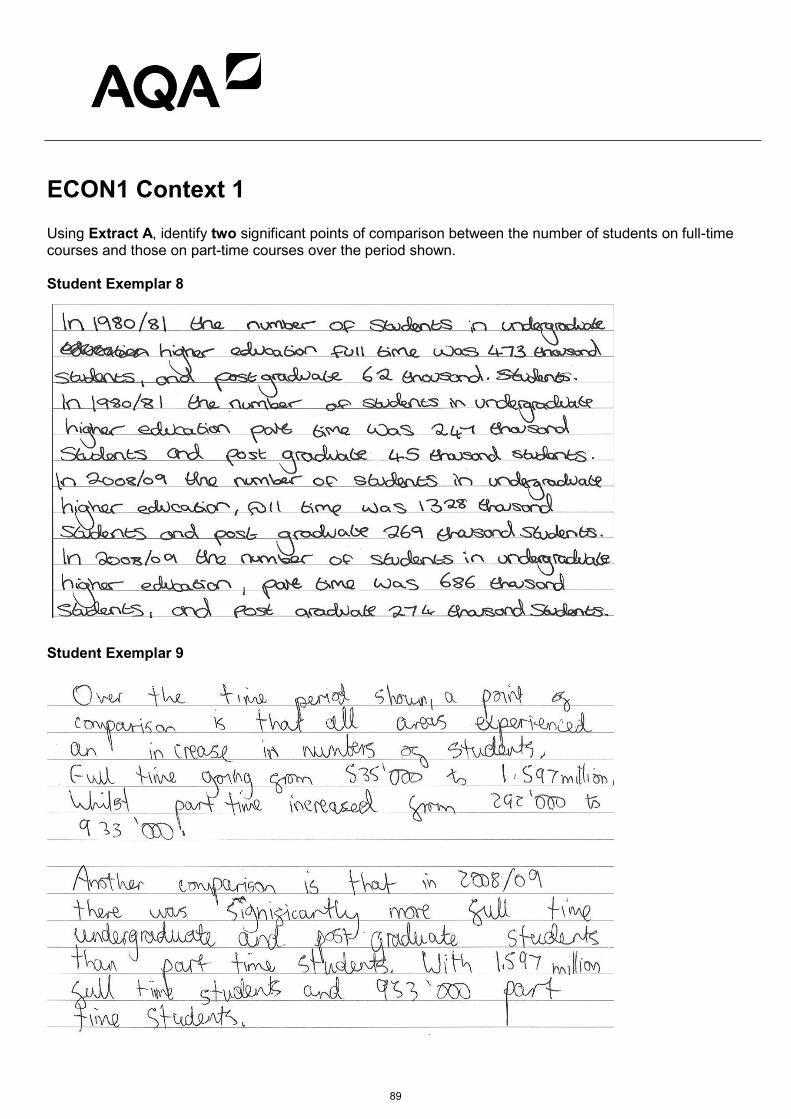
ECON1 Context 1 Using Extract A, identify two significant points of comparison between the number of students on full-time courses and those on part-time courses over the period shown. Student Exemplar 8
Student Exemplar 9
89
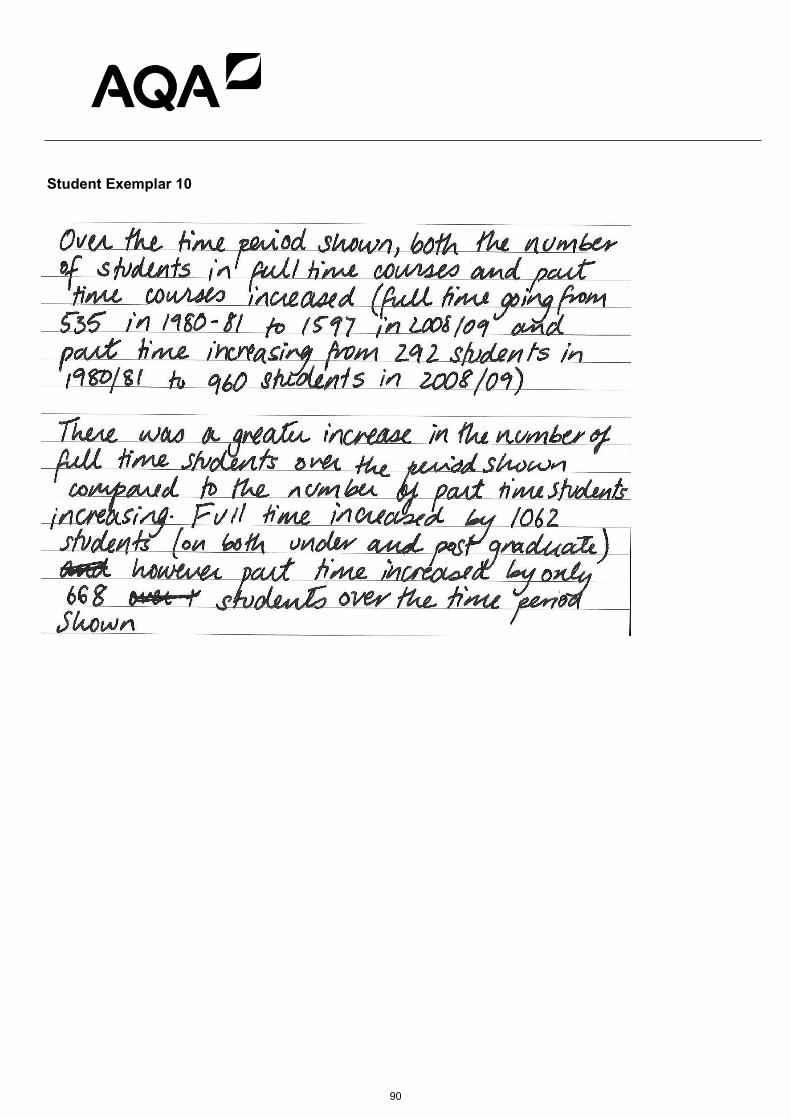
Student Exemplar 10
90

ECON2 Context 2 Using Extract D, identify two significant points of comparison between the balance of trade in goods and services and the current account balance over the period shown. Student Exemplar 11
Student Exemplar 12
91
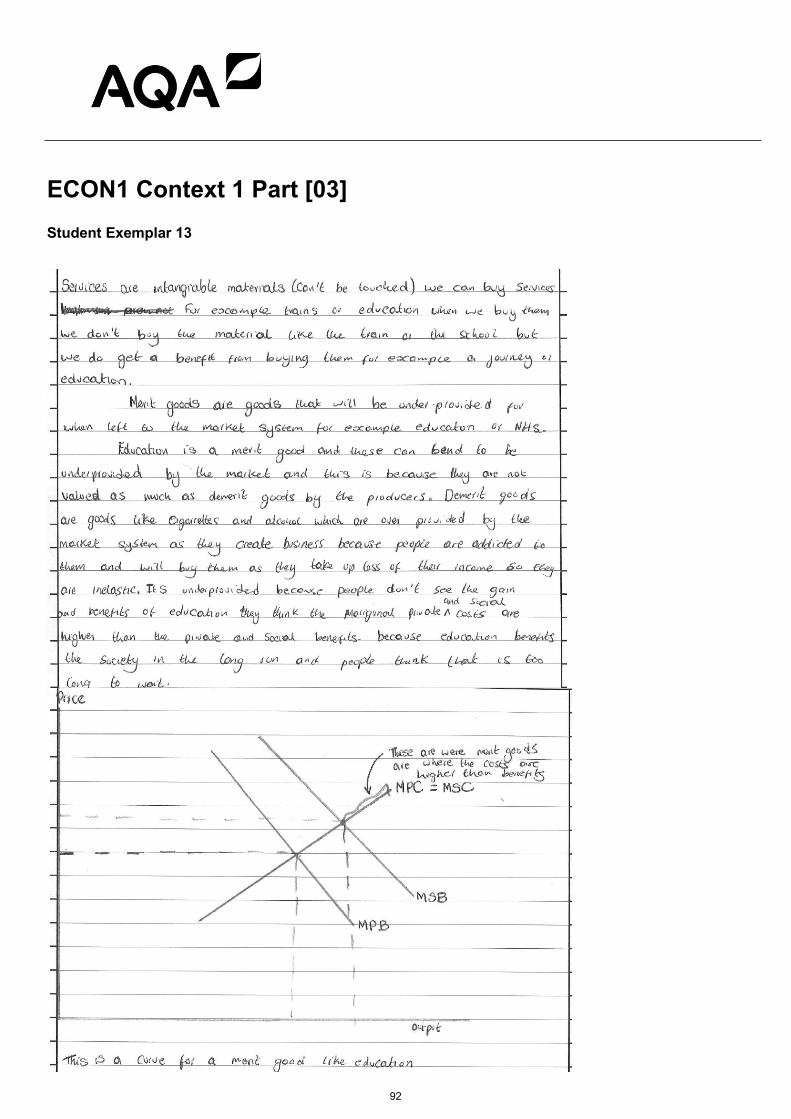
ECON1 Context 1 Part [03] Student Exemplar 13
92

ECON1 Context 1 Part [03] Student Exemplar 14
93

ECON2 Context 2 Part [07] Extract E (lines 11 – 12) states that ‘the deficit on the current account of the balance of payments is likely to be lower in 2011 than it was in 2010.’ Explain two factors, other than a fall in the value of the pound, which might help to reduce the size of the deficit on the current account of the UK balance of payments. Student Exemplar 15
94

ECON2 Context 2 Part [07] Extract E (lines 11 – 12) states that ‘the deficit on the current account of the balance of payments is likely to be lower in 2011 than it was in 2010.’ Explain two factors, other than a fall in the value of the pound, which might help to reduce the size of the deficit on the current account of the UK balance of payments. Student Exemplar 16
95

Application ECON2 Part 04 – Student Exemplar 17 Using the data and your economic knowledge, discuss the difficulties that the Government is likely to encounter when attempting to boost the rate of growth of the UK economy. Example 1
Example 2 Example 2
96

Example 3 Example 4 Example 4
97

Exemplar 19 ECON1 Part 08
98
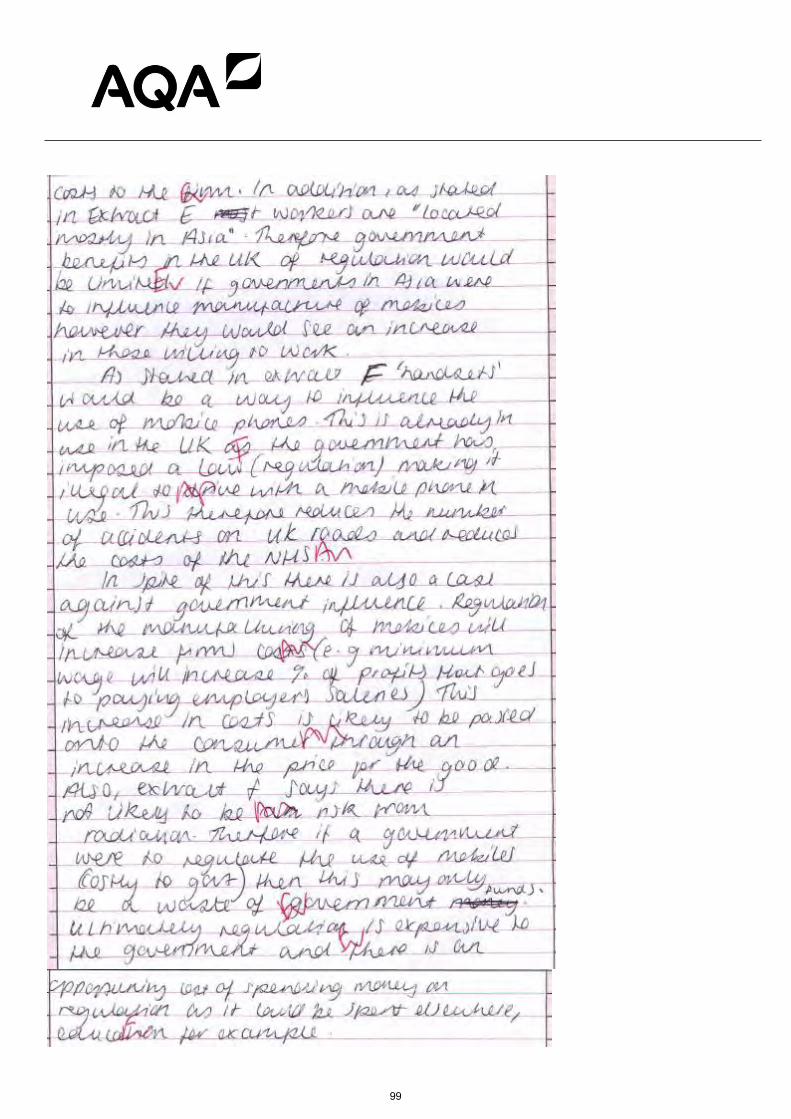
99
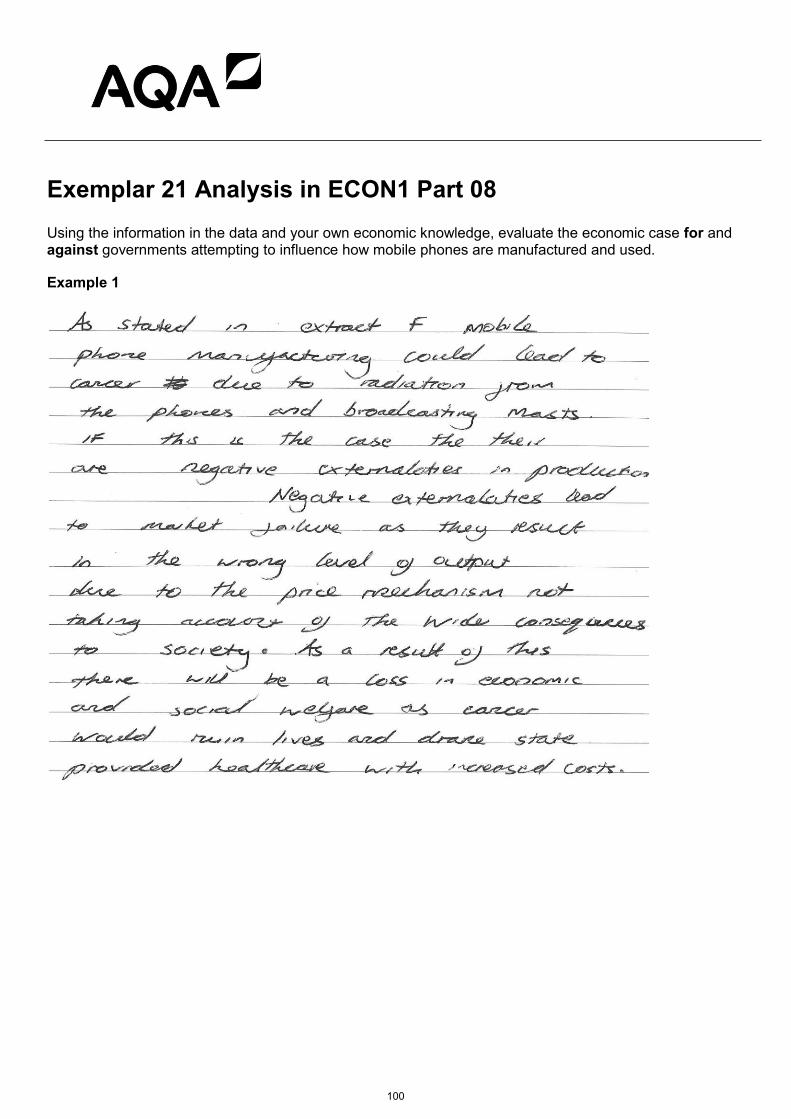
Exemplar 21 Analysis in ECON1 Part 08 Using the information in the data and your own economic knowledge, evaluate the economic case for and against governments attempting to influence how mobile phones are manufactured and used.
Example 1
100

Example 2 Using the information in the data and your own economic knowledge, evaluate the economic case for and against governments attempting to influence how mobile phones are manufactured and used.
101

Example 3 Using the information in the data and your own economic knowledge, evaluate the economic case for and against governments attempting to influence how mobile phones are manufactured and used.
102
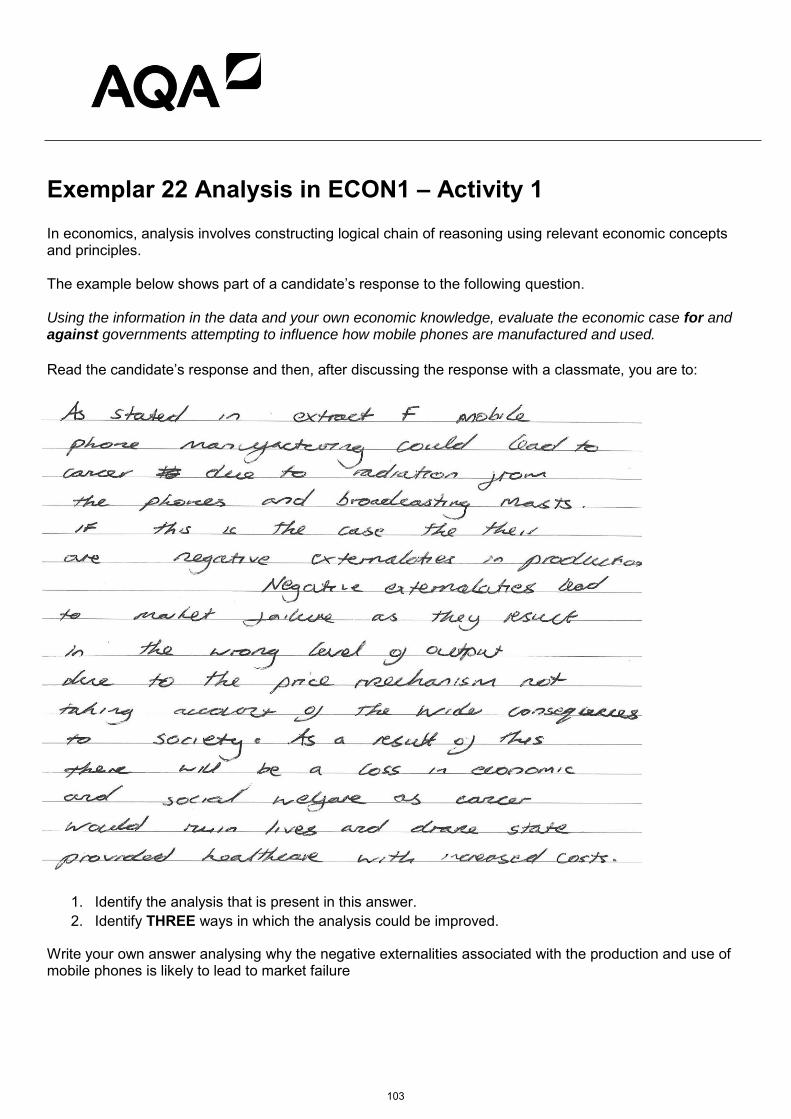
Exemplar 22 Analysis in ECON1 – Activity 1 In economics, analysis involves constructing logical chain of reasoning using relevant economic concepts and principles. The example below shows part of a candidate’s response to the following question. Using the information in the data and your own economic knowledge, evaluate the economic case for and against governments attempting to influence how mobile phones are manufactured and used.
Read the candidate’s response and then, after discussing the response with a classmate, you are to:
1. Identify the analysis that is present in this answer. 2. Identify THREE ways in which the analysis could be improved.
Write your own answer analysing why the negative externalities associated with the production and use of mobile phones is likely to lead to market failure
103

Exemplar 23 Analysis in ECON1 – Activity 2 Using the information in the data and your own economic knowledge, evaluate the economic case for and against governments attempting to influence how mobile phones are manufactured and used.
(Summer 2013)
The following examples are extracted from two candidates’ responses to the above question. Each answer is attempting to analyse why the existence of negative externalities in the manufacture and use of mobile phones is likely to result in market failure.
READ both examples and discuss them with a classmate before answering the questions which follow the examples.
Example 1
104

Example 2
1. Identify three ways in which the analysis contained in Example 2 is better than the analysis in
Example 1.
The following question is taken from the same examination paper.
Using the data and your own economic knowledge, assess the case for financing universities mainly through charging fees to their students.
(25 marks)
Education is usually classified as a merit good. As part of the answer to this question, it would be sensible to analyse why the existence of a merit good, i.e. education, would be a source of market failure.
2. You are to write an answer that analyses why, without government intervention, markets are likely to underprovide education.
105

Exemplar 28 Evaluation ECON2 Context 1 Part [04] Using the data and your economic knowledge, discuss the difficulties that the Government is likely to encounter when attempting to boost the rate of growth of the UK economy. Example 1
106
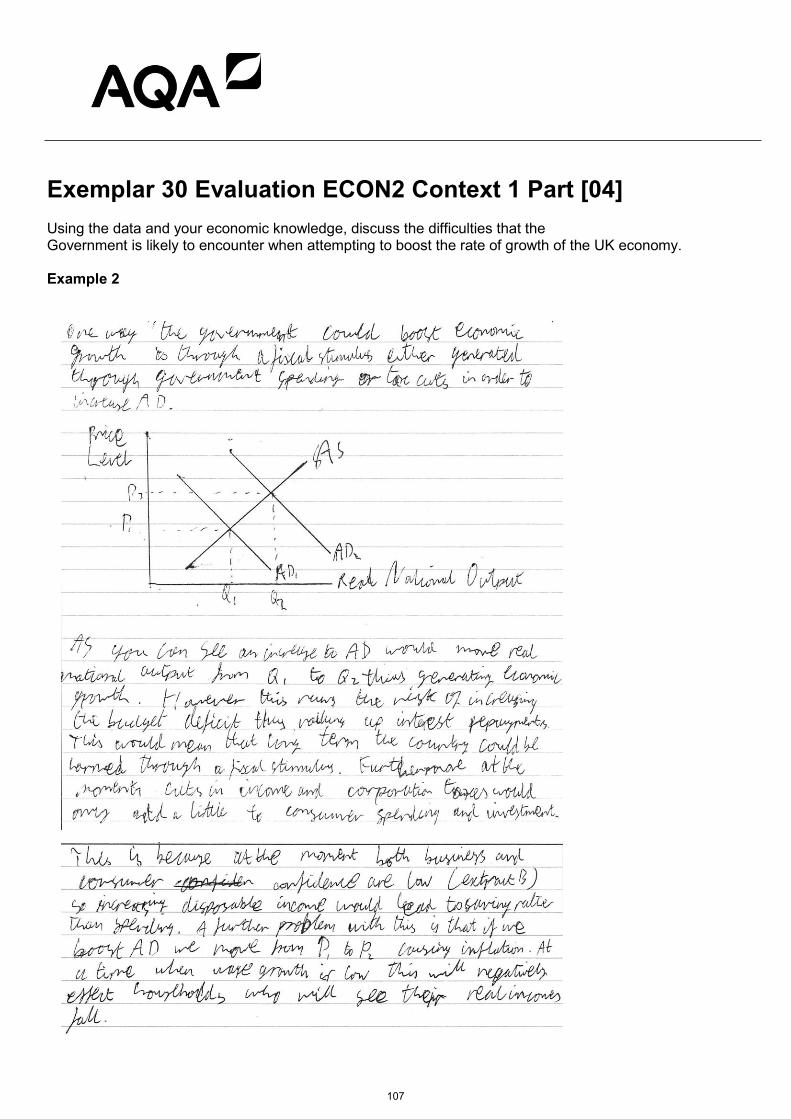
Exemplar 30 Evaluation ECON2 Context 1 Part [04] Using the data and your economic knowledge, discuss the difficulties that the Government is likely to encounter when attempting to boost the rate of growth of the UK economy. Example 2
107

Exemplar 32 ECON1 Context 2 part [08] A weak conclusion
A slightly better conclusion
108

A reasonable conclusion
109

A good conclusion However, the last sentence isn’t quite right. Intervention doesn’t lead to market failure.
110

Exemplar 34 ECON1 Part 04 (Full 25 marks)
111

112

113