a large scale exploratory analysis of software vulnerability life cycles muhammad shahzad dept. of...
TRANSCRIPT

A Large Scale Exploratory Analysis of Software Vulnerability Life Cycles
Muhammad ShahzadDept. of Computer Science and Engineering
Michigan State University
Joint work withMuhammad Zubair Shafiq and Alex X. Liu

2ICSE 2012, Zürich
Software Vulnerabilities A Software vulnerability is a weakness in software that allows
attackers to compromise the security of a system. An exploit is a means of taking advantage of a software
vulnerability to compromise the security of a system.─ In form of a piece of software, or a sequence of commands.
A patch is a means of fixing the vulnerability so that exploit becomes ineffective.
Vulnerability lifecycle
ICSE 2012, Zürich

3ICSE 2012, Zürich
Why Study Software Vulnerability Lifecycle
Software vendors are adversely affected by vulnerability announcements.─ Lost money: vendors loses 0.63% in market value on
disclosure date [Telang and Vattal 2007]─ Lost reputation
Goal: to know how the software industry is doing w.r.t vulnerabilities

4ICSE 2012, Zürich
Data Set Sources
─ National Vulnerability Database (NVD)─ Open Source Vulnerability Database (OSVDB)─ Vulnerability data by Frei et al (FVDB)
46310 vulnerabilities─ 9667 vulnerabilities with patch dates─ 15456 vulnerabilities with exploit dates
Software vendors─ Over 11 thousand vendors and 17 thousand products

5ICSE 2012, Zürich
Vulnerability Information Risk Score: low, medium, or high
─ Assigned by Common Vulnerability Scoring System (CVSS)
Access Vector: Local, Adjacent Network, Network─ From which place hackers can launch attacks
Access Complexity: low, medium, or high─ Complexity of the attack that exploits a vulnerability
Integrity Impact: none, partial, or complete─ Impact of the attack that exploits a vulnerability
Disclosure date: when a vulnerability is disclosed Exploit date: when an exploit is available Patch date: when the patch is available Text description of the vulnerability

6ICSE 2012, Zürich
Vulnerability Disclosure Rate
1990199119931995199719992001200220042006200820100
250
500
750
1000
1250
1500
0
5000
10000
15000
20000
25000
30000
35000
40000
45000
50000
Year
Mon
thly
dis
clos
ures
Cum
mul
ativ
e di
sclo
sed
vul
-ne
rabi
liti
es

7ICSE 2012, Zürich
Access Vector
199019921994199619982000200220042006200820100
102030405060708090
100Local Access
Adjacent Network
Year
Acc
ess
Vec
tor

8ICSE 2012, Zürich
Access Complexity
199019921994199619982000200220042006200820100
20
40
60
80
100
Low Complexity
Medium Complexity
High Complexity
Year
Acc
ess
Com
plex
ity

9ICSE 2012, Zürich
Integrity Impact
199019921994199619982000200220042006200820100
102030405060708090
100NonePartialComplete
Year
Inte
grit
y Im
pact

Evolution of Different Types of Vulnerabilities

11ICSE 2012, Zürich
Vulnerability Clustering Data set does not have vulnerability type. The total number of vulnerability types is unknown. Solution: use clustering algorithms to determine
type and number of vulnerabilities.─ Extracted relevant keywords from text description─ Keywords used as features for clustering─ Obtained 7 clusters
● EXE (Executables)● DoS (Denial of Service)● BO (Buffer Overflow)● SQL injection● XSS (Cross Site Scripting)● PHP● Misc

12ICSE 2012, Zürich
Vulnerability Evolution by Type
'99 '00 '01 '02 '03 '04 '05 '06 '07 '08 '09 '10 '110
200
400
600
800
1000
1200
1400
1600 PHPExeDoSBOSQLXSS
Num
ber o
f vul
nera
biliti
es o
f eac
h ty
pe
Years

Evolution of Exploitation Behavior

14ICSE 2012, Zürich
ted = Exploit Date - Disclosure Date ted < 0
─ 2.8% vulnerabilities
ted = 0─ 88.2% vulnerabilities
ted > 0─ 9% vulnerabilities─ Sub-ranges
● 0 < ted ≤ 7: exploit released within a week after disclosure
● 7 < ted ≤ 30: exploit released after a week but before a month
● ted > 30: exploit released more than a month after disclosure

15ICSE 2012, Zürich
Evolution of Aggregate Exploitation Behavior
'98 '99 '00 '01 '02 '03 '04 '05 '06 '07 '08 '09 '10 '110
20
40
60
80
100
5 4 3 4 6 3
91 94 93 8886
71
80 86 85 8698 97
89 91
43 156 243 291 619 483 1471 2215 3022 1982 2782 1400 612 443 4 4 7 2
4 8
15
9 6 9 8 4 245
.
> 30 days
+30 days
+7 days
0 day
Perc
enta
ge o
f Exp
loite
d vu
lner
abili
ties
Years

16ICSE 2012, Zürich
Evolution of Exploitation Behavior by Vendor
Microsoft
Apple Sun Oracle Linux Mozilla Redhat0
20
40
60
80
100
6 3 2 4 8 10 5
70 7670
5861
62
58
13 1111
1813
23
19
6 57
11 4 8
5 5 10 11 144
10
602 235 122 85 76 127 79
.
> 30 days
+30 days
+7 days
0 day
Perc
enta
ge o
f Exp
loite
d vu
lner
abili
ties
(Ven
dors
)

17ICSE 2012, Zürich
Evolution of Exploitation Behavior by Product
Win XP
Win 2000
OS X OS X Srvr
Sol- aris
Lnx Krnl
Entp Lnx
RH Lnx
Int Exp
Saf- ari
Fire- fox
0
20
40
60
80
100
9 8 2 3 6 8 3 5 8 513
48 48
7871 62 61
63 6573 76 57
21 21
1215
12 13 20 16
135 2412 13
2 6
4 43 5
37
10 10 5 616 14 10 8 3 7 5
127 116 121 72 50 76 30 37 192 41 76
.
> 30 days
+30 days
+7 days
0 day
Perc
enta
ge o
f Exp
loite
d vu
lner
abili
ties

Evolution of Patching Behavior

19ICSE 2012, Zürich
tpd = Patch Date – Disclosure Date tpd < 0
─ 10.1% vulnerabilities● Greater that the corresponding 2.8% of ted < 0
tpd = 0─ 62.2% vulnerabilities
● Lesser compared to 88.2% of ted = 0
tpd > 0─ 27.7% vulnerabilities─ Sub-ranges
● 0 < tpd ≤ 7: patch released within a week after disclosure
● 7 < tpd ≤ 30: patch released after a week but before a month
● tpd > 30: patch released more than a month after disclosure

20ICSE 2012, Zürich
'98 '99 '00 '01 '02 '03 '04 '05 '06 '07 '08 '09 '10 '110
20
40
60
80
100
47
61 50 4130
34 3131 36
54
66 8084 89
16
810
17
10 12 1213
22
14
64 3
3
5
1413
5
12 13 16 219
9
4
32
713
2131 30 29 28 27
163
19 71 212 240 399 336 507 762 854 867 883 1624 2429 463
10 14 16 1711 11 7 6 6
2112 7 7
.
> 30 days
+30 days
+7 days
0 day
Perc
enta
ge o
f pat
ched
vul
nera
biliti
es
Years
Evolution of Aggregate Patching Behavior

21ICSE 2012, Zürich
Microsoft
Apple Sun Oracle Linux Mozilla Redhat Google0
20
40
60
80
100
4 5 7 410 5
19
2
76 78 78
64
16
55 27
94
35 4
29
13
14
12
56 2
17
10
16
126 8
45
1627
1530 998 298 666 325 392 279 175
.
> 30 days
+30 days
+7 days
0 day
Perc
enta
ge o
f Pat
ched
vul
nera
biliti
es
Evolution of Patching Behavior by Vendor

22ICSE 2012, Zürich
Evolution of Patching Behavior by Product
Win XP
Win 2000
OS X OS X Srvr
Sol- aris
Lnx Krnl
Entp Lnx
RH Lnx
Int Exp
Saf- ari
Fire- fox
Chr- ome
0
20
40
60
80
100
82 80 74 8059
1631
22
64
86
58
96
4 5 8 710
13
8
144 11
3 3 7 65
17
19
8 5
3
11
10 9 6 5 8
4532
20 228
16
386 374 529 390 73 325 118 111 334 172 324 169
3 5 3
1810 8
36
4 5
.
> 30 days
+30 days
+7 days
0 day
Perc
enta
ge o
f Pat
ched
vul
nera
biliti
es

23ICSE 2012, Zürich
Conclusions Number of vulnerabilities being disclosed each year
has stopped increasing since 2006 Percentage of remotely exploitable vulnerabilities has
gradually increased to over 80% The access complexity of vulnerabilities has also
been increasing Closed source vendors are faster at patching the
vulnerabilities Since 2008, vendors have become very agile in
patching the vulnerabilities Still, average time for hackers to exploit a
vulnerability is shorter than the time for vendors to patch.

24ICSE 2012, Zürich
Questions?

25
BACKUP SLIDES

26ICSE 2012, Zürich
Evolution of Exploitation Behavior by Type
PHP EXE DoS BO SQL XSS0
20
40
60
80
100
94
5876
45
9785
4
17
8
19
8
67 298 418 346 106 62
10 7 9
73
14
8 713
.
> 30 days
+30 days
+7 days
0 day
Perc
enta
ge o
f Exp
loite
d vu
lner
abili
ties
Vulnerability Type

27ICSE 2012, Zürich
PHP EXE DoS BO SQL XSS0
20
40
60
80
100
186 10 11
29
12
9
7352
67 2668
45
7
9
63
427
723
8 156
11 1563 927 1025 34 171
6
6
8
26
9
.
> 30 days
+30 days
+7 days
0 day
Perc
enta
ge o
f Pat
ched
vul
nera
biliti
es
Vulnerability Type
Evolution of Patching Behavior by Type

28ICSE 2012, Zürich
Data Sources http://nvd.nist.gov/ www.osvdb.org/

29ICSE 2012, Zürich
Interesting Patterns Mined Using Association Rules
Attributes used for association rule mining─ Vendor name, product name, vulnerability type, Risk, ted,
tpd
For Microsoft, majority of high risk vulnerabilities are exploited on the disclosure date─ vnd=Microsft type=XSS risk=H → ted=0
For Sun’s Solaris, medium risk vulnerabilities are exploited within a week from disclosure─ vnd=Sun Prod=Solaris risk=M → 0<ted≤7
For Mozilla, we saw interesting rules stating that hackers are very quick in exploiting vulnerabilities that have not been patched while very slow for the patched vulnerabilities─ vnd=Mozilla Prod=Firefox typ=BO tpd=0 → ted>30
─ vnd=Mozilla Prod=Firefox typ=BO 7<tpd≤30 → ted=0
30ICSE 2012, Zürich
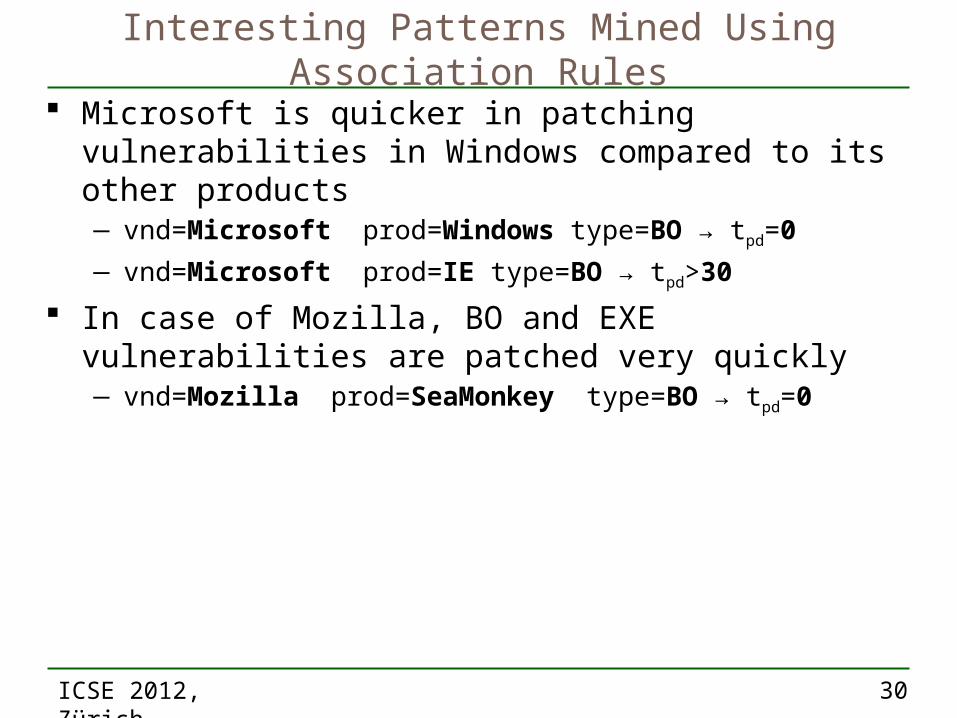
Interesting Patterns Mined Using Association Rules
Microsoft is quicker in patching vulnerabilities in Windows compared to its other products─ vnd=Microsoft prod=Windows type=BO → tpd=0
─ vnd=Microsoft prod=IE type=BO → tpd>30
In case of Mozilla, BO and EXE vulnerabilities are patched very quickly─ vnd=Mozilla prod=SeaMonkey type=BO → tpd=0

31ICSE 2012, Zürich
Implications Observations from this study have important
implications in ─ Software Design─ Code Development Practices─ Customer assessment of vendors and products

32ICSE 2012, Zürich
Software Design Analysis of access requirements, functionality, and
risk level─ can reveal inherent flaws in software design process─ For example, If a particular software series has abundant
BO vulnerabilities● shows lack of sanity check in socket and read processes
DoS vulnerabilities ─ In Solaris 38.85% of all exploited vulnerabilities─ In OS X only 11.7% of all exploited vulnerabilities─ Solaris is more susceptible to DoS attacks─ Solaris developers need to take additional steps to avoid
DoS attacks

33ICSE 2012, Zürich
Code Development Practices Analysis of life cycles of vulnerabilities can reveal
insights into code development and testing practices─ For example, we observed that percentage of
vulnerabilities with tpd>0 for open source vendors are significantly greater than for closed source
─ Shows that open source software have less resources dedicated to security compared to closed source

34ICSE 2012, Zürich
Customer Assessment of Vendors and Products
This analysis can be used in product assessment, certification, and security recommendations to customers
For example, ─ Sun should be preferred if patch response of vendor is of
prime importance─ MAC OS X should be used if a customer infrastructure has
less tolerance to DoS attacks─ Solaris should be used if customer wants to be robust
against BO attacks
35ICSE 2012, Zürich
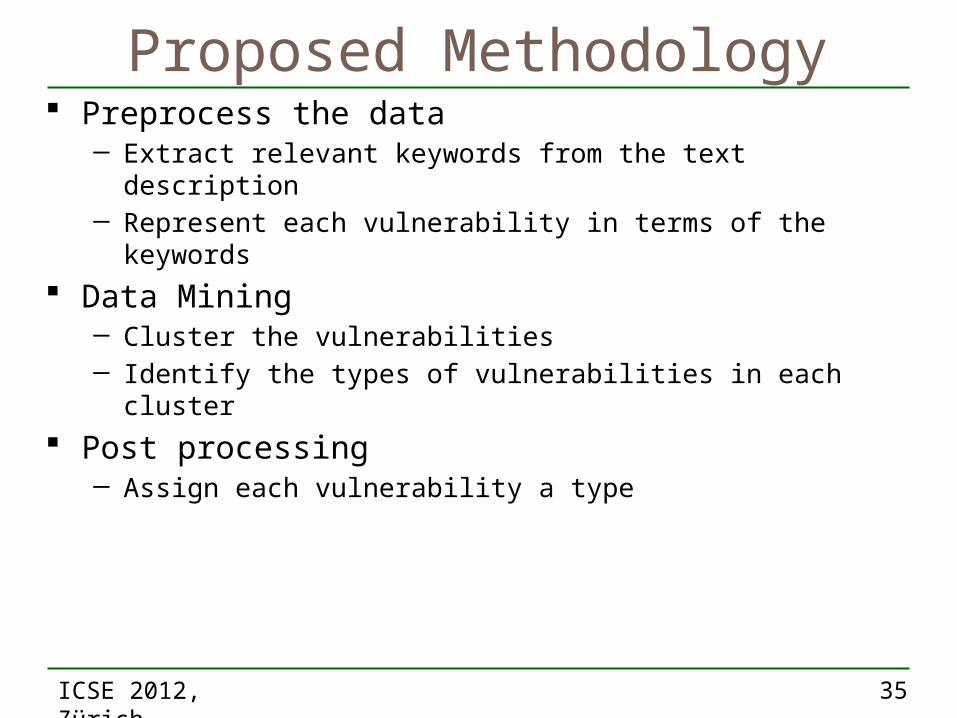
Proposed Methodology Preprocess the data
─ Extract relevant keywords from the text description─ Represent each vulnerability in terms of the keywords
Data Mining─ Cluster the vulnerabilities─ Identify the types of vulnerabilities in each cluster
Post processing─ Assign each vulnerability a type

36ICSE 2012, Zürich
Preprocessing Attributes are required to cluster Representative keywords in the text can act as
attributes─ Take all words in all text descriptions─ Compare the words with everyday news articles─ Remove the matching words─ Manually go through the remaining words─ Remove the words that are non technical─ Leaves us with 608 keywords

37ICSE 2012, Zürich
Preprocessing Each vulnerability is a data point
─ 608 binary attributes
Denial Service Buffer … Overflow
CVE-xxxx-yyyy
0 0 1 … 1
CVE-xxxx-yyyy
1 0 0 … 1
CVE-xxxx-yyyy
0 1 0 … 0

38ICSE 2012, Zürich
Clustering: Scheme Selection of clustering scheme
─ Same vulnerability type─ Different vendors─ E.g., Buffer Overflow vulnerabilities
● Can be subdivided into: Apple BO, Microsoft BO
Hierarchical more suitable compared to Partitional─ Ward
● Less susceptible to noise● Does not break large clusters● Ensures that SSE is small

39ICSE 2012, Zürich
Clustering: Distance Measure Desired: Jaccard
─ Not implemented in Weka, problems in Matlab Used: Hamming
─ Not implemented in Weka, available in Matlab Euclidean not used
─ Asymmetric data Cosine not used
─ Values in many cases become very small but non zero─ Matlab does not handle them and results in error

40ICSE 2012, Zürich
Clustering: Challenges Hierarchical clustering uses proximity matrix
─ 46261 by 46261─ Requires about 15.9GB RAM in Matlab
Solution─ Sampling─ 10 files randomly generated
● 5% sampling rate
If dataset has valid clusters, each random file should generate same centroids

41

42ICSE 2012, Zürich
Clustering: Centroids
608 attributes ─ Value of each attribute: 0 or 1─ Data points lie at the edges of the 608 dimensional unit
hypercube Take each cluster at a time and find the centroid
─ Values of each of the 608 attributes lies in [0,1]─ Value close to 1 means occurred in a large number of data
points of the cluster and vice versa─ Get the attributes which are greater than 0.8
● appeared in the description of over 80% of vulnerabilities in the cluster
─ e.g., in one cluster● Denial, Service
– Represent DoS attacks
We get the centroids─ Dominant keywords represent type cluster

43ICSE 2012, Zürich
Clustering: Number of clusters No universal way of determining exact number of
clusters Visualize the dendrogram
─ Decide appropriate number of clusters

44ICSE 2012, Zürich
Hierarchical Clustering
SQL Misc XSSEXE
DoSMisc
BOCEXEMisc P
HP
EXE C-EXE
Local MiscA- EXE
EXE
US-EXE
EXE BO A
-BO
1. 2.
3.
4. 5.
6.
7.
CEXE BO
SQL
Misc PHP
DoS
XSS

45ICSE 2012, Zürich
Clustering: Remaining Samples This analysis was on 1 sample Did the same analysis on remaining 9 samples Centroids obtained from all 10 samples are shown
next

46ICSE 2012, Zürich
Clustering: Intensity Plot of Proximity Matrix

47ICSE 2012, Zürich
Final Clustering We have all 7 centroids
─ Assign each of 46261 points to nearest centroid─ Sizes of each cluster after assigning points
PHP SQL BO XSS EXE DoS Misc
8.32% 11.2% 10.2% 12.3% 7.25% 14.2% 36.6%

48ICSE 2012, Zürich
Post Processing Evolution of different types of vulnerabilities Evolution for different types in vendors Evolution of exploitation behavior of hackers Evolution of patching behavior of vendors