a lamellar grating interferometer for the far …tanner/pdfs/henry79irphys.pdf · abstract-a...
TRANSCRIPT
A LAMELLAR FOR
GRATING INTERFEROMETER THE FAR-INFRARED
R. L. HENRY and D. B. TANNER
Department Of Physics, The Ohio State University. Columbus, Ohio 43210, U.S.A.
(Received 9 August 1978)
Abstract-A lamellar grating interferometer has been constructed for use in studies of the optical properties of solids in the frequency range 2-50cm -‘. The interferometer uses a 19 x 24cm lamellar grating with a 2.5 cm grating constant and 2.75 cm of travel giving a maximum unapo- dized resolution of 0.1 cm-‘. Two 50cm focal length f/1.8 collimating mirrors are used in a Czerny-Turner arrangement. Light-pipe optics feed the light to and from the focal points of the collimating mirrors. The entire assembly is mounted in a vacuum tank which is supported on nitrogen filled bellows for vibration isolation purposes.
1. INTRODUCTION
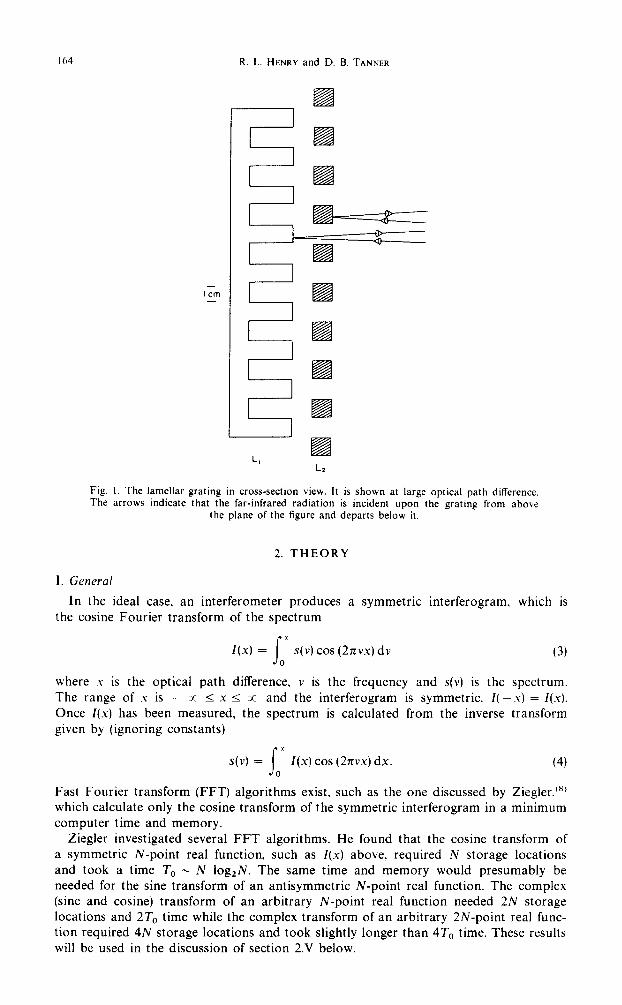
Due to the multiplex advantage and to superior throughput, interferometers have largely supplanted monochrometers in the far-infrared region of the spectrum.“’ By far the most common type of interferometer is the Michelson type.@) For low frequencies (2-50cm-I), however, poor beam-splitter efficiency and the need for rather thick beam- splitters limit the usefulness of the Michelson interferometer. In this frequency region, the lamellar grating interferometer of the Strong and Vanasse typec3’ is preferable since it eliminates the need for a separate beam-splitter. In a lamellar grating interferometer, both beam division and interferometric modulation are achieved with the same set of interleaved facets, shown in cross section in Fig. 1. The phase difference necessary for two-beam interference arises from the difference in the distance transversed by light striking one set of facets compared to that transversed by light striking the other set.
The lamellar grating interferometer has limitations at both high and low frequencies. As the depth of the groove is changed, the intensity in the zeroth order of the diffraction pattern produced by the grating is modulated in a cosinusoidal manner with period equal to the wavelength. The radiation diffracted into the higher orders is also modulated but is 180” out of phase with that in the zeroth order. At high frequencies the diffraction angle is not large enough to prevent some of the out-of-phase radiation from entering the exit light-pipe along with the zeroth order radiation and decreasing the interfero- metric modulation. The frequencies v (in cm -‘) for which this effect occurs are@)
v 2 Cf/sd) (1)
where d is the grating constant, s is the width of the limiting aperture, and f the focal length of the collimating mirror(s). A small grating constant is required for the interfer- ometer to operate at high frequencies. On the other hand, a large value of the grating constant is necessary to minimize error from the cavity effect.“’ This error occurs because the phase velocities of light passing between the facets of the forward portion of the grating differ for polarization parallel and perpendicular to the long dimension of the facets. The result of the different velocities is a decrease in the interferometric modulation at low frequencies, where
v I 2/d. (2)
Between the two frequencies discussed above, the lamellar grating is a nearly ideal interferometer. At zero path difference nearly all of the energy from a broad-band source goes into the exit beam, while at very large path differences almost exactly half of the energy goes into the exit beam. Lamellar grating interferometers have been con- structed and described by Strong and Vanasse, (3) Richards,‘4’ Hall, Vrabec and Dowl- ing, (s) Nolt, Kirby, Lytle and Sievers,@’ and Milward.“’
163
R. L. HENRY and D. B. TANNER
Fig. 1. The lamellar grating in cross-section view. It is shown at large optical path difference. The arrows indicate that the far-infrared radiation is incident upon the grating from above
the plane of the figure and departs below it.
2. THEORY
I. Genrral
In the ideal case, an interferometer produces a symmetric interferogram, which is the cosine Fourier transform of the spectrum
s
* I(x) = s(v) cos (2xvx) dv (3)
0
where x is the optical path difference, v is the frequency and s(v) is the spectrum. The range of .Y is - x I x I x and the interferogram is symmetric. I( -x) = I(x).
Once I(x) has been measured, the spectrum is calculated from the inverse transform given by (ignoring constants)
s
I s(v) = I(x) cos (27~~) dx. (4)
0
Fast Fourier transform (FFT) algorithms exist, such as the one discussed by Ziegler,“’ which calculate only the cosine transform of the symmetric interferogram in a minimum computer time and memory.
Ziegler investigated several FFT algorithms. He found that the cosine transform of a symmetric N-point real function, such as I(x) above, required N storage locations and took a time To c N log,N. The same time and memory would presumably be needed for the sine transform of an antisymmetric N-point real function. The complex (sine and cosine) transform of an arbitrary N-point real function needed 2N storage locations and 2To time while the complex transform of an arbitrary 2N-point real func- tion required 4N storage locations and took slightly longer than 4To time. These results will be used in the discussion of section 2.V below.

A lamellar grating interferometer for the far-infrared 16.5
The actual situation is not so simple as what is implied by Eqns 3 and 4. The compli- cations of Fourier transform spectroscopy have been discussed at length in the litera- ture.“’ Both the interferometric signal and the optical path difference must be measured and these me~urements are subject to error. These errors are most commonly random noise in the signal and systematic errors in the path difference. In addition, because of the mechanical design of the interferometer, the path difference cannot exceed some maximum value A. Finally, because the Fourier transform is calculated by a computer, the signal must be digitized at a finite number of equally spaced data points.
II. Truncation and upo~~zution
Truncation of the interferogram at x = A introduces distortions in sharp features of the computed spectrum. Spectral lines are broadened and closely adjacent lines are not resolved. The resolution is given by the usual”’ equation, Av = 1/2A, so that the resolution will be improved by increasing the maximum optical path difference.
In addition, sidelobes are introduced in the wings of ~nreso~~e~ lines by the sin(2~vA)/2~vA instrumental lineshape, This instrumental function, the Fourier transform of the truncating function, is convolved with the actual spectrum in the computed spec- trum. The large sidelobes, introduced by the convolution, can be suppressed by multiply- ing the interferogram by a function, &,A), called the apodization function, which goes to zero, or nearIy zero at x = A, and which is zero for x > A. The apodization function is chosen so that its Fourier tra~form, when convolved with the spectrum, gives an attractive instrumental lineshape. The cost of this procedure is a further line broadening and loss of resolution. The properties of several apodization functions are discussed in section 5 of this paper.
III. Sampling the interferogram
The sampling theorem”’ specifies the rate at which the interferogram points must be measured. The change of path difference 6 must satisfy
6 ?ZG (Anin12) (5)
where ~min is the shortest wavelength in s(v). If the maximum optical path difference is A, then the number of interferogram points which must be measured is N = 1 + (A/ii). The fast Fourier transform will calculate N different spectral points between v = 0 and v = l/26. Since, as discussed by Nolt et cd.,@)
where (S/~)~ is the signal-to-noise ratio in the spectrum and (S/~)~ is the signal-to-noise ratio in the interferogram, the sampling interval 6 should be as large as possible, consis- tent with the inequality in Eqn 5, to minimize the total number of points. This efficient sampling also reduces computation time.
IV. Phase error
Phase errors, due to systematic errors in path difference (missing the origin) or due to intrinsic asymmetry in the interferogram, are serious problems in Fourier transform spectroscopy. In the presence of phase errors, Eqn 3 becomes
I
5 Z(x’) = s(v) cos [Znvx + (b(v)] dv (7)
0
where x’ = x - E and E is the error in path difference. If the phase error arises solely from having missed the origin, #J(V) = 27~~. The interferogram is no longer symmetric: I( -x’) z Z(x’). The cosine transform of Z(Y) will have distorted lineshapes and a tilted baseline. Schemes for correction of phase error have been discussed by Forman, Steel and Vanasse,“” Mertz, (Ii) Sakai, Vanasse and Forman, Cannes’“’ and Sanderson and Bell.“4’.

166 R. L. HENRY and D. B. TANNER
The choice of technique depends both upon the experimental situation and desired result. We are interested in the case of a far-infrared lamellar grating interferometer. The signal-to-noise ratio is relatively small. The total number of data points is perhaps as small as 50 and rarely more than 500. It is generally desirable to minimise total run time, computer time and computer memory requirements.
V. Correction of phase errors
If the interferogram is measured for an equal path difference on either side of the central maximum, i.e. from -A to A, then both the amplitude and phase may be calcu- lated from the complex Fourier transform. This amplitude corresponds to the spectrum s(v), except that since the amplitude is a positive quantity noise enters the spectrum in a non-linear way, particularly in regions of low signal-to-noise ratio. Compared to the ideal case, such a two-sided interferogram requires twice as much time to measure, and the calculation of the spectrum takes four times as much computer time and memory, since both the sine and cosine transforms of the longer interferogram have to be calculated and stored. This method is not appropriate for a lamellar grating interferometer since the grooves in the back portion of the grating (L, in Fig. 1) are by necessity of limited depth.
Since the phase is usually a slowly varying function of frequency, high resolution phase measurements are not necessary. If the interferogram is measured from -A1 to AZ, with A2 ti A1 > 6, then a low resolution phase, 4(v), may be calculated from the complex Fourier transform of the interferogram between -A1 and +A,. The complex Fourier transform of the interferogram, between -A1 and A2 is calculated and rotated through -4(v) to obtain a phase-corrected spectrum. Essentially one calcu-
lates
X s(y) = Be eei@‘cV) i 1
I(x’)A(x’, A,, AZ) elnipx’ dx’ -X 1
where A(x’, A,, A*) is a truncation-apodization function finite over -A1 I x’ I A2
and zero elsewhere. It is crucially important, as has been discussed by Mertz”” and Sanderson and Be11,‘14’ that this function be properly chosen near the origin so that points which have been measured twice will have their proper weight in the final
sum. Otherwise, tilts and other distortions occur in the baseline of the spectrum. Com- pared to the ideal case, performing phase correction requires twice as much computer time and memory since both sine and cosine transforms have to be performed and stored. For high resolution experiments, the extra time required to measure the short interferogram from -A, to the center is negligible. In low resolution measurements where only about 100 points are measured, the time to take a sufficient number of points is not insignificant and the total run time will be lengthened by this phase correc- tion technique.
When the phase error comes entirely from missing the origin, it can be corrected by mechanically adjusting the starting point to be at the point of symmetry in the interferogram,‘6’ or by electronically detecting zero path difference.“” Only a single- sided transform is recorded and only the cosine Fourier transform computed. The com- puter time and memory requirements are the same as in the ideal case. The mechanical symmetrization requires additional operator attention at the start of each interferogram. For an experienced operator the time for this procedure is negligible. For the inexperi- enced operator, however, a considerable amount of time can be spent in achieving symmetry. An advantage of the symmetrization is that inasmuch as all interferograms are started at identical interferometer positions, runs can be averaged by averaging interferograms rather than by averaging spectra. This averaging can usefully be done among runs on the same specimen taken hours apart. When phase correction is employed, as opposed to mechanical symmetrization, long term stability in the interfer- ometer is usually not good enough (in the absence of a laser control/white light reference interferometer system) to permit such averaging. Instead, phase corrected spectra are
A lamellar grating interferometer for the far-infrared 167
averaged. The computer time and memory requirements are substantially greater in this latter case.
For middle- and near-infrared, rapid scanning, high resolution interferometers, soft- ware phase correction is clearly the best of the three schemes discussed above. Most commercial systems employ this technique. On the other hand, for a far-infrared, step- and-integrate, relatively low resolution instrument, mechanical symmetrization has several advantages. Such an instrument is described in this paper.
3. CONSTRUCTION
1. General
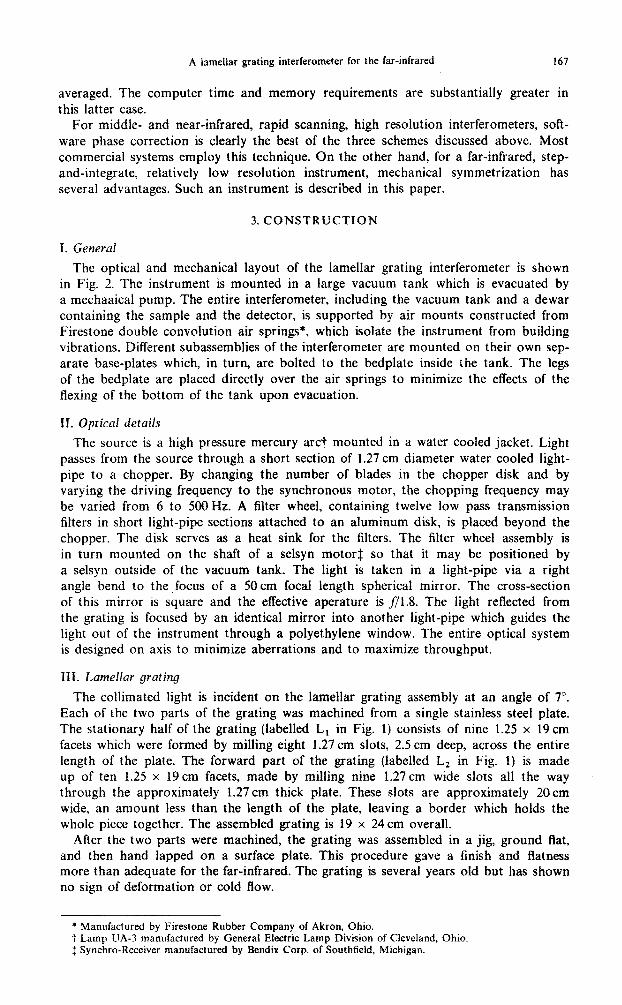
The optical and mechanical layout of the lamellar grating interferometer is shown in Fig. 2. The instrument is mounted in a large vacuum tank which is evacuated by a mechaaical pump. The entire interferometer, including the vacuum tank and a dewar containing the sample and the detector, is supported by air mounts constructed from Firestone double convolution air springs*, which isolate the instrument from building vibrations. Different subassemblies of the interferometer are mounted on their own sep- arate base-plates which, in turn, are bolted to the bedplate inside :he tank. The legs of the bedplate are placed directly over the air springs to minimize the effects of the flexing of the bottom of the tank upon evacuation.
II. Optical detaiis
The source is a high pressure mercury arc? mounted in a water cooled jacket. Light passes from the source through a short section of 1.27 cm diameter water cooled light- pipe to a chopper. By changing the number of blades in the chopper disk and by varying the driving frequency to the synchronous motor, the chopping frequency may be varied from 6 to 500 Hz. A filter wheel, containing twelve low pass transmission filters in short light-pipe sections attached to an aluminum disk, is placed beyond the chopper. The disk serves as a heat sink for the filters. The filter wheel assembly is in turn mounted on the shaft of a selsyn motor$ so that it may be positioned by a selsyn outside of the vacuum tank. The light is taken in a light-pipe via a right angle bend to the .focus of a 50 cm focal length spherical mirror. The cross-section of this mirror is square and the effective aperature is f/1.8. The light reflected from the grating is focused by an identical mirror into another light-pipe which guides the light out of the instrument through a polyethylene window. The entire optical system is designed on axis to minimize aberrations and to maximize throughput.
The collimated light is incident on the lamellar grating assembly at an angle of 7”. Each of the two parts of the grating was machined from a single stainless steel plate. The stationary half of the grating (labelled L1 in Fig. 1) consists of nine 1.25 x 19 cm facets which were formed by milling eight 1.27 cm slots, 2.5 cm deep, across the entire length of the plate. The forward part of the grating (labelled L, in Gig. 1) is made up of ten 1.25 x 19 cm facets, made by milling nine 1.27 cm wide slots all the way through the approximately 1.27 cm thick plate. These slots are approximately 20cm wide, an amount less than the length of the plate, leaving a border which holds the whole piece together. The assembled grating is 19 x 24cm overall.
After the two parts were machined, the grating was assembled in a jig, ground flat, and then hand lapped on a surface plate. This procedure gave a finish and flatness more than adequate for the far-infrared. The grating is several years old but has shown no sign of deformation or cold flow.
* Manufactured by Firestone Rubber Company of Akron, Ohio. t Lamp UA-3 manufactured by General Electric Lamp Division of Cleveland, Ohio. $ Synchro-Receiver manufactured by Bendix Corp. of Southfield, Michigan.
R. L. HENRY and D. B. TANNER
1
Fig. 2. Plan of the interferometer. The important parts are labeled thus: S: source, C: chopper. F: filter wheel with selsyn drive, R,: collimating mirror, L,: fixed and L2: moveable grating. R,: focusing mirror, T: slide, M: micrometer. SM. stepping motor, W worm gear, and Sy:
selsyn drive for symmetrizer. The entrance and exit light-pipes are shown.
To prevent the facets of the movable (forward) half of the grating from shadowing
the facets of the stationary (rearward) half, the grating is mounted horizontally, such that the facet long dimension is parallel to the plane of incidence. Such shadowing would cause a reduction in the signal (not just the interferometric modulation) at large path differences and would distort the low frequency end of the Fourier transform.
IV. Mechanical details
The movable portion of the grating is mounted on a ball bearing slide*. This slide is held against a micrometer? by a counterweight and pulley arrangement. The fixed grating may be tilted and translated for alignment purposes. The grating is positioned such that there is 2.75 cm travel in the forward direction and 0.1 cm travel in the reverse direction, measured with respect to zero path difference. The thimble of the micrometer is driven by a stepping motor’ which turns 1.8’ per impulse. The shortest step (change of optical path difference) is 4.9 pm. A sliding coupling is mounted on the thimble to compensate for the translation of the thimble as it rotates.
To adjust the starting point of each interferogram to within the body of the micrometer is mounted at the center of a worm can be turned from outside the vacuum tank with a leaf spring preloads the worm gear to eliminate backlash.
4. OPERATION
I. Data acquisition
a small fraction of 1 pm, worm driven gear. The selsyn motor system. A
The far-infrared data are taken as single sided interferograms, starting at zero path difference. The path length is changed in a stepwise fashion by a preset indexer-stepper motor combination. The step length is chosen to be compatible with the long wavelength pass filter used. Typical values are 6 = 98 pm for a 50 cm-’ cutoff and 6 = 240pm for a 20 cm-’ cutoff.
The detector is a germanium bolometer operating at 1.2 K. Its output is amplified and rectified by a lock-in, digitized by an integrating digital voltmeter, and punched onto data cards for computer processing. The digital voltmeter has two parts. The output of the lock-in, which for any interferogram point consists of a d.c. voltage plus random noise, is connected to a voltage-to-frequency converter. This produces a series of pulses whose rate is directly proportional to the (instantaneous) input voltage. The
* Manufactured by Automation Gages Inc. of Rochester. New York. ‘r Manufactured by Scherr-Tumico Inc. of St. James, Minnesota. ’ Slay-Syn SSSO-1008 manufactured by The Superior Electric Company of Bristol. Connecticut.

A lamellar grating interferometer for the far-infrared 169
pulses are counted by a counter for a preset time. The number which results is the average over the counting time of the lock-in voltage. This type of averaging has, as compared to RC smoothing, no memory of input voltage changes when the interfer- ometer steps from one point to the next.
The digital voltmeter also controls the data acquisition cycle. After the gate closes, the number is punched and a signal sent to the preset indexer to advance the interfer- ometer to the next path difference. The voltmeter waits a short time for the mechanical system to settle, and then integrates the next point. The integration time may be chosen to be 1, 2, 4, 8, or 16 sec. Typical values are 2 or 4 sec.
It is usual to record several interferograms for a given specimen. These data are then averaged before the Fourier transform is calculated. The effects of long term drifts in source intensity or detector sensitivity and of other slowly varying systematic errors are reduced. This averaging of interferograms can only be done if every scan is started at the same path difference.
The Fourier transforms are done on an IBM 370 computer. The Fortran language program computes interferogram averages, performs the Fourier transform of the apo- dized interferogram, calculates the ratio of sample spectrum to background spectrum, plots the results and does various auxillary functions.
II. Symmetrization
The interferogram starting point is adjusted (symmetrized) by comparing the signal one sampling increment or step before the nominal zero path difference location to that one step after. The nominal zero position is then adjusted first with the stepping motor and then with the worm gear until the two values are equal. As discussed above, the interferogram produced by a properly adjusted interferometer is symmetrical about zero path difference. Therefore, adjustment of the point before and the point after to be equal ensures that zero path difference has been found. These two points are very strong functions of the path difference, as they occur about halfway between the zero path difference maximum and the first minimum on each side of the zero path difference. Symmetrization is achieved when the two points are equal to within the noise level (generally 1 part in 103-lo4 for transparent samples). As an illustration of the necessity for the worm gear mechanism, two runs were made-one with the zero position located properly and one with the origin in error by 4.9pm in path difference in the forward direction. Since for these runs the step length was 98 pm, the error in the location of zero path difference was 5%. The change in intensity at the points before and after zero path difference was also about 5%. The ratio of the two spectra has been plotted in Fig. 3. The ratio is half of the correct value (unity) at 8 cm- ‘, rises slowly, and is somewhat above one at high frequencies. This distortion can be eliminated by careful symmetrization: the ratio of two runs will then be unity to within the noise. The starting position location can be improved over that illustrated here by more than an order of magnitude.
III. Filters
The low pass transmission filters are made of fused quartz,‘16) plexiglas,“” and Sty- cast* 2850 GT epoxy. (Is’ The cutoff, i.e. the frequency at which the signal drops into the noise, can be varied by changing the filter length. The length ranged between 0.1 cm (62 cm-’ cutoff) and 1.2 cm (21 cm-’ cutoff) for Plexiglas, between 0.45 cm (62 cm-’ cutoff) and 3.2 cm (30 cm- ’ cutoff) for fused quartz and between 0.15 cm (32 cm-’ cutoff) and 1.0 cm (14 cm-’ cutoff) for the epoxy.
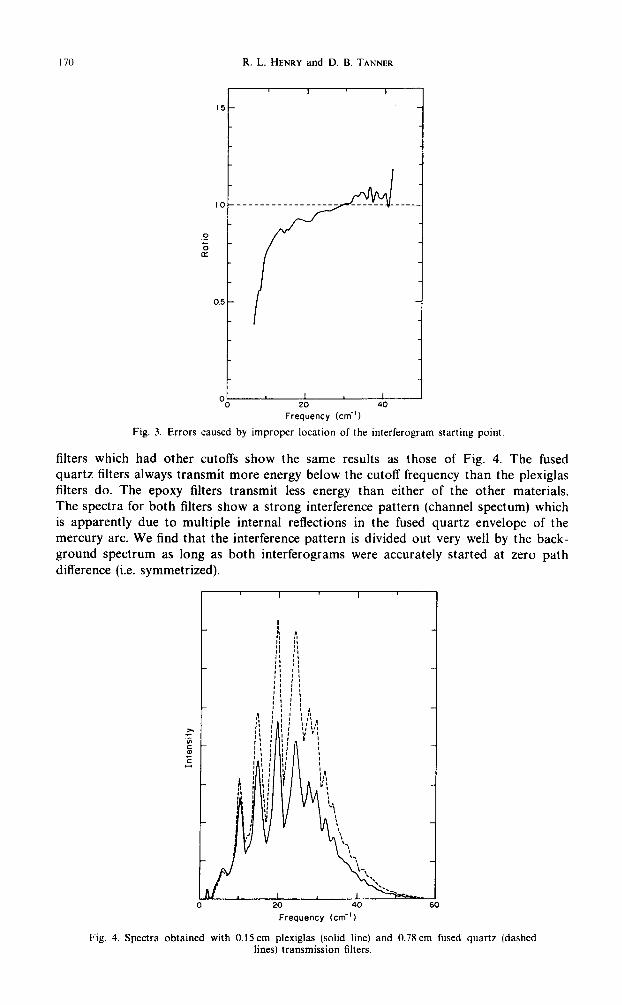
Our tests show that at room temperature fused quartz is the best of the three filter materials. Spectra taken with Plexiglas and fused quartz filters of approximately 55 cm- l cutoff are shown in Fig. 4. The fused quartz filter transmits considerably more energy than the Plexiglas filter does at all frequencies below the cutoff. Comparisons of other
* Stycast 2850 GT epoxy manufactured by Emerson & Cumings. Northbrook, Illinois.
I 70 R. L. HENRY and D. B. TANNER
I I I 20 40
Frequency (cm-‘)
Fig. 3. Errors caused by improper location of the interferogram starting point.
filters which had other cutoffs show the same results as those of Fig. 4. The fused quartz filters always transmit more energy below the cutoff frequency than the Plexiglas filters do. The epoxy filters transmit less energy than either of the other materials. The spectra for both filters show a strong interference pattern (channel spectum) which is apparently due to multiple internal reflections in the fused quartz envelope of the mercury arc. We find that the interference pattern is divided out very well by the back- ground spectrum as long as both interferograms were accurately started at zero path
difference (i.e. symmetrized).
0 20 40 60
Frequency (cm-‘)
Fig. 4. Spectra obtained with 0.15 cm Plexiglas (solid line) and 0.78 cm fused quartz (dashed lines) transmission filters.

A lamellar grating interferometer for the far-infrared 171
5. PERFORMANCE
I. Ejticiency
For the instrumental arrangement we have used, the frequency at which the cavity effect causes a 5% difference in phase between the two polarizations is 1.2 cm-’ while the overlap of the zero and first order diffraction patterns begins at 16cm-‘. Figure 5 shows two spectra recorded using the same detector and filter on two consecutive days. One was made with the lamellar grating interferometer and the other was taken with a Michelson interferometer”” with a 25pm beam-splitter. The Michelson uses the same mercury arc source and has approximately the same numerical aperture as the lamellar grating. The loss of high frequency efficiency for the lamellar grating is quite apparent. It is also easy to see the loss of the Michelson’s beam-splitter efficiency for low frequencies. The lamellar grating interferometer is increasingly superior to the Michelson interferometer as the frequency is reduced below 25 cm- ‘. At 15 cm- ’ the ratio between the two is 3 in favor of the lamellar grating. At lOcm_’ the Michelson has expired while the lamellar grating delivers half of its maximum intensity. The spectra of Fig. 5 were taken at considerably lower resolution than those of Figure 4; thus the interference pattern is not as strong. (We note that the theoretical efficiency of the two interferometer types is identical. Both send all of the source energy to the detector at zero path difference. As the path difference varies, energy is switched out of the beam for those frequencies in destructive interference. In the lamellar grating this energy is diffracted into the higher orders while in the Michelson the energy returns to the source.)
II. Resolution and apodization
The discussion in this section will be illustrated with water vapor transmission data. The water was obtained by admitting 80 torr of air at 100% relative humidity into the interferometer vacuum tank. The total path length was about 2m. The ratio of the spectrum of the water vapor to a spectrum obtained with the tank evacuated will be shown.
If the maximum optical path difference of the interferometer, A = 5.5 cm, is used, the unapodized resolution is Av = l/26 = 0.1 cm- ‘. The zero crossings of the instrument line shape, sine (2rrvA)/2~vA in the unapodized case, are spaced at multiples of 1/2A
0
Frequency hi')
6(
Fig. 5. Spectra produced by lamellar grating (solid line) and Michelson (dashed line) interfer- ometers. The same helium cooled filter and bolometer detector were used in both measurements.

172 R. L. HENRY and D. B. TANNER
06
16 19 24 25
Frequency (cm-‘I
A, 26
Fig. 6. Transmission of water vapor in the 18 and 25cm-’ regions. The points were calculated from the measured data; the solid lines were calculated by extending the interferogram with
zeroes to 8 times its original length.
from the central peak. The fast Fourier transform also spaces the calculated spectral points a distance 1/2A apart if no interpolating is done. (Interpolation is achieved by extending the interferogram beyond the last data point with zeroes and transforming
the extended interferogram.) If one is fortunate enough to have the central peak fall on one of the calculated points, no sidelobes will be visible. If, on the other hand, the central peak falls between two calculated points, the sidelobes are easily visible.
This effect is illustrated in Fig. 6 where the transmission of water vapor in the 18
and 25 cm-’ regions is shown. The dots represent the calculated points from 512 ( =29) point interferogram. The maximum path difference was 3.8 cm. The full line was obtained by interpolating to fill in the remainder of the line shape. The center of the line at 18.58 cm-’ falls between two of the calculated points and the data points in the wings exhibit strong oscillations. The peak of the 25.08 cm-’ line falls almost on a calculated point and the wings are quite smooth.
As discussed above, the conventional technique for suppressing sidelobes is to multiply the interferogram by a function (apodization function) which goes to zero or almost to zero at the point of maximum path difference. Many different functions have been proposed at one time or another. We have been using for some time the apodization functions of Norton and Beer. (“’ There are three such functions, all of the form
A(u) = co + C,( 1 - UZ) + C,(l - # + C‘$(l - u2)4
where u = x/A is the fractional distance between zero and maximum path difference. The values of the constants are given in Table 1. The effect of these functions as well as that of triangular apodization on the transmission of water vapor in the 35-45 cm-’ region is shown in Fig. 7. The maximum path difference was 3.8 cm. The data have
Table 1. Apodization functions
Full width at half max Sidelobe height/peak height Expected Measured’“’ Expected Measured’h’
Apodization Co C, C2 c4 (cm- ‘) (cm-‘) (““) (“0)
None 1 0 0 0 0.11 0.13-0.15 22.0 7.0 f 1.0 Weak 0.548 -0.0833 0.5353 0 0.13 0.1G0.18 5.8 5.0 + 1.0 Medium 0.26 - 0.154838 0.894938 0 0.15 0.17XI.19 1.4 2.0 * 1.0 Heavy 0.09 0 0.5875 0.3225 0.18 0.2CO.22 0.4 1.5 f 0.5 Triangular - 0.17 0.2CO.22 5.4 1.5 &- 0.5
p Lower value found for lower frequency (V < 30cm -’ lines) while higher value found for higher frequency (v > 30 cm- ’ lines).
b For heavy and triangular apodization the sidelobes are of the same order as the noise in the spectrum.

A lamellar grating interferometer for the far-infrared 173
w--k--+& 36
Frequency (cm-’ )
Fig. 7. Transmission of water vapor in the 3639cm-’ region illustrating the effects of various apodization functions: 0: unapodized. 1: weak, 2: medium, 3: heavy, and 4: triangular
apodization.
been interpolated to show the entire lineshape. With increasingly strong apodization there is a loss of resolution, which may be defined as either the width of a line or the separation between two lines. Table 1 shows data obtained from measurements on water vapor lines in the 440 cm-’ region with maximum path difference A = 5.4 cm. The full width at half maximum is shown and compared to the expected linewidth.‘20*” Also shown is the ratio of the sidelobe height to peak height along with expected va1ues.‘20*‘) As the appearance of the data improves, or as spurious structure disappears, the resolution worsens. The triangular apodization falls between the medium and the heavy apodization functions in its effect on sidelobes and noise.
6. SUMMARY AND CONCLUSIONS
In general, this instrument has met its design objectives. It has a higher efficiency than a Michelson interferometer below 25 cm-’ and sufficient resolution for the solid state experiments planned. Using a bolometer detector operating at 1.2 K, high quality spectra have been obtained between 4 and 60cm- ‘. The symmetrizer permits starting the interferogram very close to zero path difference. Symmetrization shortens the run time (by a factor of 2 compared with two-sided interferograms), reduces distortions in ratios caused by channel spectra, and permits the use of faster and more efficient Fourier transform routines.@’
I. 2.
BELL R. J. Introductory Fourier Transform Spectroscopy. Academic Press, New York (1972). GEBBIE, H. A., Advances in Quantum Electronics, Part II (edited by J. R. SINGER), p. 34. Columbia University Press (1961).
3. STRONG J. & G. A. VANASSE, J. opt. Sot. Am. 50, 113 (1960). 4. RICHARDS. P. L., J. opt. Sot. Am. 54, 1474 (1964). 5. 6.
HALL, R. T., D. VRABEC & J. M. D~WLING, J. opr. Sot. Am. 54, 1390 (1964); Appl. Opt. 5, 1474 (1966). NOLT, I. G., R. D. KIRBY, C. D. LYTLE & A. J. SIEVERS, Appl. Opt. 8, 309 (1969).
7. MILWARD, R. C., Infrared Phys. 9, 59 (1969). 8. ZIEGLER, H., Infrared Phys. 15, 19 (1975). 9. CONNES, J., Rev. Opt. 40, 45 (1961).
REFERENCES

174 R. L. HENRY and D. B. TANNER
10. FORMAN, M. L., W. H. STEEL 6t G. A. VANASSE. J. opr. Sot. Am. 56, 59 (1966). 11. MERTZ. L., Injiwed Phys. 7. 17 (1967). 12. SAKAI. H., G. A. VANASSE & M. L. FORMAN. J. opt. Sot. Am. 58, 84 (1968). 13. CONNES. J.. Aspen International Conftwnce on Fouriu Spectroscopy. 1970. (edited hy G. A. \‘ANASS~
A. T. STAIR & D. J. BAKER), AFCRL report 114. p. 83. 14. SANDEKSON, R. B. & E. E. BELL, Appl. dpf. 12, 266 (1973). 15. BACHET. G. & R. COULON. Infrared Phw. 17. 359 (1977). 16. WONG. P. T. T., P. D. KLUG”& E. W~ALLEY, J. obt. Sot. Am. 62, 533 (1972). 17. MON. K. K. & A. J. SIEVERS. Appl. Opr. 14, 1054 (1975). 18. TANNER. D. B.. G. G. IHAS & K. A. MUETHING. Rev. Sci. Instrum. 48, 610 (1977) 19. SANDERSON, R. B. & H. E. SCOTT. Appl. Opt. IO, 1097 (1971). 20. NORTON. R. H. & R. BEER. J. opr. Sot. Am. 66, 259 (1976).