a kinetic description of how interfaces accelerate
TRANSCRIPT

ChemicalScience
EDGE ARTICLE
Ope
n A
cces
s A
rtic
le. P
ublis
hed
on 2
7 Ju
ly 2
020.
Dow
nloa
ded
on 1
2/27
/202
1 9:
48:1
2 A
M.
Thi
s ar
ticle
is li
cens
ed u
nder
a C
reat
ive
Com
mon
s A
ttrib
utio
n-N
onC
omm
erci
al 3
.0 U
npor
ted
Lic
ence
.
View Article OnlineView Journal | View Issue
A kinetic descrip
aChemical Sciences Division, Lawrence Ber
94720, USA. E-mail: [email protected] of Chemistry, University of CalcBeckman Institute for Advanced Science a
Urbana-Champaign, Urbana, Illinois 61801
† Electronic supplementary informa10.1039/d0sc03189e
Cite this: Chem. Sci., 2020, 11, 8533
All publication charges for this articlehave been paid for by the Royal Societyof Chemistry
Received 8th June 2020Accepted 25th July 2020
DOI: 10.1039/d0sc03189e
rsc.li/chemical-science
This journal is © The Royal Society o
tion of how interfaces acceleratereactions in micro-compartments †
Kevin R. Wilson, *a Alexander M. Prophet,ab Grazia Rovelli,a Megan D. Willis,a
Rebecca J. Rapfa and Michael I. Jacobsc
A kinetic expression is derived to explain how interfaces alter bulk chemical equilibria and accelerate
reactions in micro-compartments. This description, aided by the development of a stochastic model,
quantitatively predicts previous experimental observations of accelerated imine synthesis in micron-sized
emulsions. The expression accounts for how reactant concentration and compartment size together
lead to accelerated reaction rates under micro-confinement. These rates do not depend solely on
concentration, but rather the fraction of total molecules in the compartment that are at the interface.
Although there are �107 to 1013 solute molecules in a typical micro-compartment, a kind of
“stochasticity” appears when compartment size and reagent concentration yield nearly equal numbers of
bulk and interfacial molecules. Although this is distinct from the stochasticity produced by nano-
confinement, these results show how interfaces can govern chemical transformations in larger
atmospheric, geologic and biological compartments.
I. Introduction
Complex reaction networks, important for the chemistry ofbiological (cells), environmental (mineral pores), and atmo-spheric (aerosols and cloud droplets) systems, oen occur inmicron-sized compartments. Measurements of reaction ratesand mechanisms required to understand the evolution of thesesystems are oen broken into elementary steps and measuredin the laboratory using macroscopic reaction vessels. However,as reviewed in a number of studies,1–7 there is emergingevidence that when chemical reactions are conned in micro-droplets, Leidenfrost droplets, thin lms and emulsions, theyare accelerated by many orders of magnitude (10 to 106) relativeto large reaction vessels. These results have potentially impor-tant ramications for understanding chemical reactivity inatmospheric and industrial aerosols, the biochemistry withinliquid–liquid phase-separated8 and other cellular compart-ments and the development of more efficient syntheticmethods.9
Despite extensive observations, the molecular origin of theseenhanced rates, in many cases, remains unclear. Factors thatlikely contribute to observed accelerated rates in droplets, suchas those formed in electrospray ionization (ESI) sources, include
keley National Laboratory, Berkeley, CA,
ifornia, Berkeley, CA, 94720, USA
nd Technology, University of Illinois at
, USA
tion (ESI) available. See DOI:
f Chemistry 2020
the concentration of reagents due to solvent evaporation,10
electrochemistry,11,12 interference from gas phase reactions,13,14
surface charge,15,16 enrichment17 and acidity2 as well as surfacereactions.1,18 that becomemore pronounced in small droplets orthin lms.17,19 These factors likely all contribute to varyingextents when ESI droplets are used for both compartmentali-zation and detection of reactants and products. The multiphaseprocesses inherent in ESI mass spectrometry make it extremelydifficult to design control experiments13 needed to isolate theexact mechanism(s) responsible for observed reaction acceler-ation in droplets.
Alternatively, emulsions have smaller surcial charge, lacksolvent evaporation and interferences from competing gas phasereactions. As a result, emulsions can be used to isolate the relativeimportance of interfacial reactions in the observed accelerationfactors. For example, Fallah-Araghi et al.1 studied a condensationreaction in monodisperse emulsions: the synthesis of an iminefrom the reaction of an amine with an aldehyde. Although unfa-vorable in bulk aqueous solutions due to the elimination of H2O,the apparent equilibrium constant for this reaction is observed tobe enhanced 29-fold in an 8.4 mm radius (R) emulsion. Both theequilibrium and the forward rate constant for imine synthesisincrease linearly with 1/R; a clear signature of surface effects. Toexplain their results, Fallah-Araghi et al.1 proposed a reaction-adsorption mechanism to show how surface adsorption, desorp-tion and reaction couple with bulk reactions to produce theobserved size-dependent kinetics. For a set of limiting cases, ananalytical expression was derived to describe how the effectiveequilibrium constant depends upon radius, adsorption length,surface reaction and desorption rates.
Chem. Sci., 2020, 11, 8533–8545 | 8533

Chemical Science Edge Article
Ope
n A
cces
s A
rtic
le. P
ublis
hed
on 2
7 Ju
ly 2
020.
Dow
nloa
ded
on 1
2/27
/202
1 9:
48:1
2 A
M.
Thi
s ar
ticle
is li
cens
ed u
nder
a C
reat
ive
Com
mon
s A
ttrib
utio
n-N
onC
omm
erci
al 3
.0 U
npor
ted
Lic
ence
.View Article Online
Motivated to further generalize the results reported in ref. 1,we have developed a new stochastic model of compartmental-ized chemistry. The simulations are parameterized using liter-ature rate coefficients, which makes them physically realistic.The simulation results are rst benchmarked against the sizedependent kinetic data reported by Fallah-Araghi et al.,1
providing additional molecular insights into the coupling ofsurface and bulk reactivity, interfacial propensity and bulkphase depletion. Next, the simulations are expanded to a largerrange of compartment sizes and concentrations than wereoriginally considered in ref. 1. Together, the simulation resultsand the prior experimental data are then used to develop andvalidate a theoretical description, beyond the limiting casesconsidered in ref. 1, which allows for more general predictionsof how surface reactions modify equilibria and lead to acceler-ated reaction kinetics in micro-compartments.
This work is organized as follows: Section II outlines somegeneral considerations for understanding chemistry in micro-compartments, which guide the development of the stochasticmodel detailed in Section III. In Section IV, the simulationresults are benchmarked against the data reported in ref. 1 andthen extended over a much larger range of compartment sizesand concentrations. Finally, in Section V a general kineticexpression is derived that correctly predicts the scaling of theapparent equilibrium constant in micro-compartmentsobserved both in the numerical simulations developed hereand in the previous dataset reported by Fallah-Araghi et al.1
II. Compartment dimensions,concentrations and characteristiclengths for reactions in micro-compartments
There are many examples where nano-connement20 of a smallnumber of molecules or atoms has a profound inuence onphysical and chemical properties; including the electronicstructure of quantum dots and the transport and reactivity incarbon nanotubes,21 zeolites, nanovessels,22 metal organicframeworks, cells, etc. For these cases, compartmentalizationproduces properties and behavior not observed in theirmacroscopic analogs or described by continuum theoriesbecause connement is on the order of molecular/atomicdimensions, solvent correlation lengths23,24 and/or is governedby stochastic uctuations of small numbers of molecules.25–29
In contrast, it is not immediately obvious why connementof many, many millions of solute molecules in a micron-sizeddroplet or emulsion would produce behavior substantiallydifferent from what is observed in a beaker. One differencebetween macro- and microscale environments is illustrated inFig. 1A where the ratio of surface to bulk molecules (fs) ina spherical aqueous compartment is shown as a function ofradius and solute concentration ([solute]). Here, the ratio fs is,
fs ¼ GmaxA
½solute�V (1)
8534 | Chem. Sci., 2020, 11, 8533–8545
where A and V are the surface area and volume of a sphere,respectively. Gmax is the maximum surface excess concentration.Fig. 1A is intended to only illustrate the differences betweencompartment sizes, since eqn (1) assumes an idealized case wherethe surface is saturated at all concentrations and there are nochemical reactions. Below, a more realistic and complex expres-sion for fs will, be considered explicitly. The lines in Fig. 1A arecomputed assuming Gmax ¼ 1.66 � 1014 molec. per cm2, corre-sponding to a molecular area of 60 A2 per molecule.
For large compartments (e.g. R ¼ 105 microns ¼ 10 cm), fs ismuch less than 1 for the concentrations shown. At mM concen-trations,�1 in every 10 000molecules is, on average, at the surfaceand it is only under the most dilute conditions (e.g. 10�7 M) thatthe number of molecules at the surface and in the bulk areequivalent (fs¼ 1, dashed line Fig. 1A). For reactions inmacroscalecompartments conducted under typical laboratory concentrations(10�4 to 1 M), processes that occur at the interface would involve,on average, only a small fraction of the total number of moleculesin the system and therefore remain invisible, except to the mostinterface sensitive analytical techniques.
This is in contrast to micro-compartments (R ¼ 1–100microns), where a substantial number (fs > 0.1) of molecules inthe concentration range of (0.1 to 10�4 M) reside at the interface(shaded region, Fig. 1A). Many of the reports of acceleratedreactions in ESI micro-droplets are in fact conducted within thisshaded region. At these sizes and concentrations (as will beshown below) there is strong coupling between surface and bulkkinetics, which cannot be neglected. Generally, these simpleobservations suggest that dividing a bulk mM solution intoa large number of micron-sized compartments (e.g. in sprays oremulsions) might be an effective way to study surface reactionkinetics that would otherwise be difficult to observe in a singlelarge reaction vessel.
There are a number of characteristic lengths relative tocompartment size that likely impact whether a reaction is“chemically conned” (Fig. 1B). The reacto-diffusive length(Lrxn) is the distance, on average, a reagent travels prior toa reaction. This length is related to the Kuramoto Length30 andthe Damkohler number, or reaction diffusion index.31 Lrxndepends upon the square root of diffusion coefficient (D) andthe chemical lifetime (srxn). For a bimolecular reaction, srxn, andtherefore Lrxn, can be changed via reactant concentration. Whenreactions are slow and diffusion is fast, Lrxn > Lcompartment (asshown in Fig. 1B), reagents can sample the surface region of thecompartment repeatedly before reacting. For this case, thechemical evolution of the compartment will be governed bothby reactions occurring in the compartment interior as well as atits surface. For the opposite case (i.e. fast reaction rates andslow diffusion) where Lrxn < Lcompartment, the surface will playa more minor role as reagents, on average, will be consumedprior to encountering the interface. For the imine synthesisreaction considered here Lrxn �400 mm.1
In the surfactant literature a critical radius (Rcritical) is used todescribe mass transfer to a curved interface (i.e. bubble ordroplet, Fig. 1B).32 For compartment sizes larger than Rcritical,diffusion limits transport timescales to the interface. Forcompartments smaller than Rcritical, energetic barriers for
This journal is © The Royal Society of Chemistry 2020

Fig. 1 (A) Number ratio (fs) of surface to bulk molecules as a function of radius and concentration (colored lines). fs ¼ 1 is indicated with a dashedline. (B) Compartment diameter (Lcompartment) relative to the reacto-diffusive length (Lrxn) and critical radius (Rcritical).
Edge Article Chemical Science
Ope
n A
cces
s A
rtic
le. P
ublis
hed
on 2
7 Ju
ly 2
020.
Dow
nloa
ded
on 1
2/27
/202
1 9:
48:1
2 A
M.
Thi
s ar
ticle
is li
cens
ed u
nder
a C
reat
ive
Com
mon
s A
ttrib
utio
n-N
onC
omm
erci
al 3
.0 U
npor
ted
Lic
ence
.View Article Online
surface adsorption are kinetically limiting. It is expected thatthe overall rate of a chemical transformation in a compartmentmight depend sensitively upon the mode of mass transfer (i.e.diffusion vs. adsorption). For the synthesis reaction consideredhere, Rcritical �200–300 cm, indicating that the ux of reactantsto the surface is kinetically limited.
III. Model formulation
Kinetiscope©33 is used to numerically simulate the chemistry asa function of compartment size. This open access sowarepackage uses a stochastic algorithm to propagate the chemicalevolution of a system by randomly selecting among probability-weighted elementary reaction and diffusion steps.34,35 The ratelaw is used to compute the probability for each elementary step.Stochastic methods differ from the more common approach ofconstructing and solving sets of deterministic coupled ordinarydifferential equations, which provide a reasonable descriptionof kinetics at the macroscale. As physical dimensions arereduced and the number of molecules become small, discrete-ness is likely to have a larger inuence on overall systembehavior. Models built in Kinetiscope© have been used exten-sively to predict multiphase transformations in submicronaerosols,31,36–41 where quantitative descriptions of surface andbulk reactions, diffusion, and evaporation are required.
Simulation geometry
To model the data reported in Fallah-Araghi et al.1 the emul-sions are assumed to be spherical. Houle and coworkers40,41
showed that to model a spherical aerosol, with radius ¼ R, thesimulation geometry could be simplied to a rectangular prismwith a height of R/3, as shown in Fig. 2. Here, the prism is
This journal is © The Royal Society of Chemistry 2020
divided into two sub-volumes: a surface (located at the top,Fig. 2) with a bulk region below. The rectangular prism withsurface and bulk sub-volumes preserves the correct scalingbetween surface and bulk processes and is computationallymore efficient than simulating an entire sphere. Moleculesmove between these volumes by Fickian diffusion.
The length and width of the prism are 1 � 1 nm (Fig. 2). Thesimulation results presented below are found to be insensitiveto these dimensions and were checked by using larger 10 � 10� R/3 nm and 100 � 100 � R/3 nm simulation volumes. Theseexpanded dimensions correspond to a 4 orders of magnitudechange in the total number of molecules in the simulation. Anadditional parameter is required to dene the surface volume—the interface thickness. A thickness of 1 nm is used and isconsistent with Molecular Dynamics simulations of the densityprole across an oil/water interface.42
Bulk and surface concentrations
For the imine synthesis reaction reported in ref. 1, stoichio-metric amounts of reactant amine and aldehyde (i.e. [amine] ¼[aldehyde] ¼ 15 mM) are used. Molecular structures of thereactants and products are shown in Fig. 2. In the simulation,the compartment volume and reactant concentration are spec-ied separately. This means that in order to maintain the sameconcentrations for different emulsion sizes, the total number ofmolecules in the simulation volume must naturally change as isshown in Table S1.†
A Langmuir43 framework (detailed below) is used to describethe kinetics of the adsorption and desorption of molecules atthe interface. This is implemented in the simulation by deningthe concentration of available adsorption sites in the surfacevolume.38 It is assumed that a site is occupied by a single species
Chem. Sci., 2020, 11, 8533–8545 | 8535
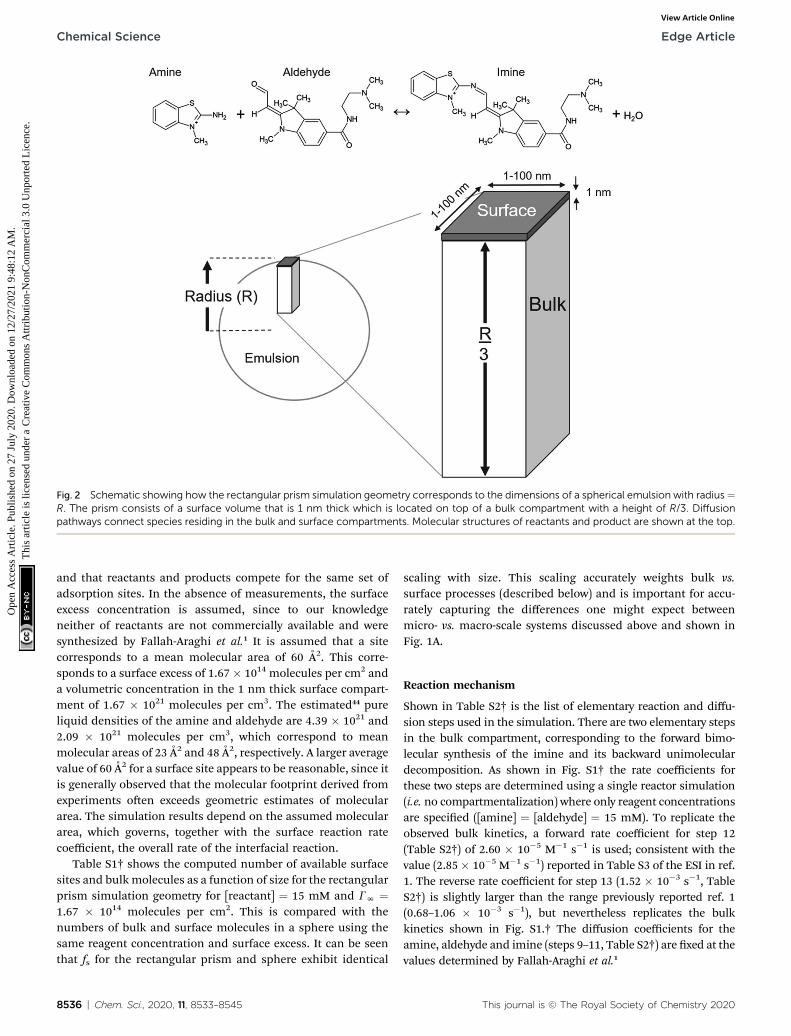
Fig. 2 Schematic showing how the rectangular prism simulation geometry corresponds to the dimensions of a spherical emulsion with radius¼R. The prism consists of a surface volume that is 1 nm thick which is located on top of a bulk compartment with a height of R/3. Diffusionpathways connect species residing in the bulk and surface compartments. Molecular structures of reactants and product are shown at the top.
Chemical Science Edge Article
Ope
n A
cces
s A
rtic
le. P
ublis
hed
on 2
7 Ju
ly 2
020.
Dow
nloa
ded
on 1
2/27
/202
1 9:
48:1
2 A
M.
Thi
s ar
ticle
is li
cens
ed u
nder
a C
reat
ive
Com
mon
s A
ttrib
utio
n-N
onC
omm
erci
al 3
.0 U
npor
ted
Lic
ence
.View Article Online
and that reactants and products compete for the same set ofadsorption sites. In the absence of measurements, the surfaceexcess concentration is assumed, since to our knowledgeneither of reactants are not commercially available and weresynthesized by Fallah-Araghi et al.1 It is assumed that a sitecorresponds to a mean molecular area of 60 A2. This corre-sponds to a surface excess of 1.67 � 1014 molecules per cm2 anda volumetric concentration in the 1 nm thick surface compart-ment of 1.67 � 1021 molecules per cm3. The estimated44 pureliquid densities of the amine and aldehyde are 4.39 � 1021 and2.09 � 1021 molecules per cm3, which correspond to meanmolecular areas of 23 A2 and 48 A2, respectively. A larger averagevalue of 60 A2 for a surface site appears to be reasonable, since itis generally observed that the molecular footprint derived fromexperiments oen exceeds geometric estimates of moleculararea. The simulation results depend on the assumed moleculararea, which governs, together with the surface reaction ratecoefficient, the overall rate of the interfacial reaction.
Table S1† shows the computed number of available surfacesites and bulkmolecules as a function of size for the rectangularprism simulation geometry for [reactant] ¼ 15 mM and GN ¼1.67 � 1014 molecules per cm2. This is compared with thenumbers of bulk and surface molecules in a sphere using thesame reagent concentration and surface excess. It can be seenthat fs for the rectangular prism and sphere exhibit identical
8536 | Chem. Sci., 2020, 11, 8533–8545
scaling with size. This scaling accurately weights bulk vs.surface processes (described below) and is important for accu-rately capturing the differences one might expect betweenmicro- vs. macro-scale systems discussed above and shown inFig. 1A.
Reaction mechanism
Shown in Table S2† is the list of elementary reaction and diffu-sion steps used in the simulation. There are two elementary stepsin the bulk compartment, corresponding to the forward bimo-lecular synthesis of the imine and its backward unimoleculardecomposition. As shown in Fig. S1† the rate coefficients forthese two steps are determined using a single reactor simulation(i.e. no compartmentalization) where only reagent concentrationsare specied ([amine] ¼ [aldehyde] ¼ 15 mM). To replicate theobserved bulk kinetics, a forward rate coefficient for step 12(Table S2†) of 2.60 � 10�5 M�1 s�1 is used; consistent with thevalue (2.85� 10�5 M�1 s�1) reported in Table S3 of the ESI in ref.1. The reverse rate coefficient for step 13 (1.52 � 10�3 s�1, TableS2†) is slightly larger than the range previously reported ref. 1(0.68–1.06 � 10�3 s�1), but nevertheless replicates the bulkkinetics shown in Fig. S1.† The diffusion coefficients for theamine, aldehyde and imine (steps 9–11, Table S2†) are xed at thevalues determined by Fallah-Araghi et al.1
This journal is © The Royal Society of Chemistry 2020
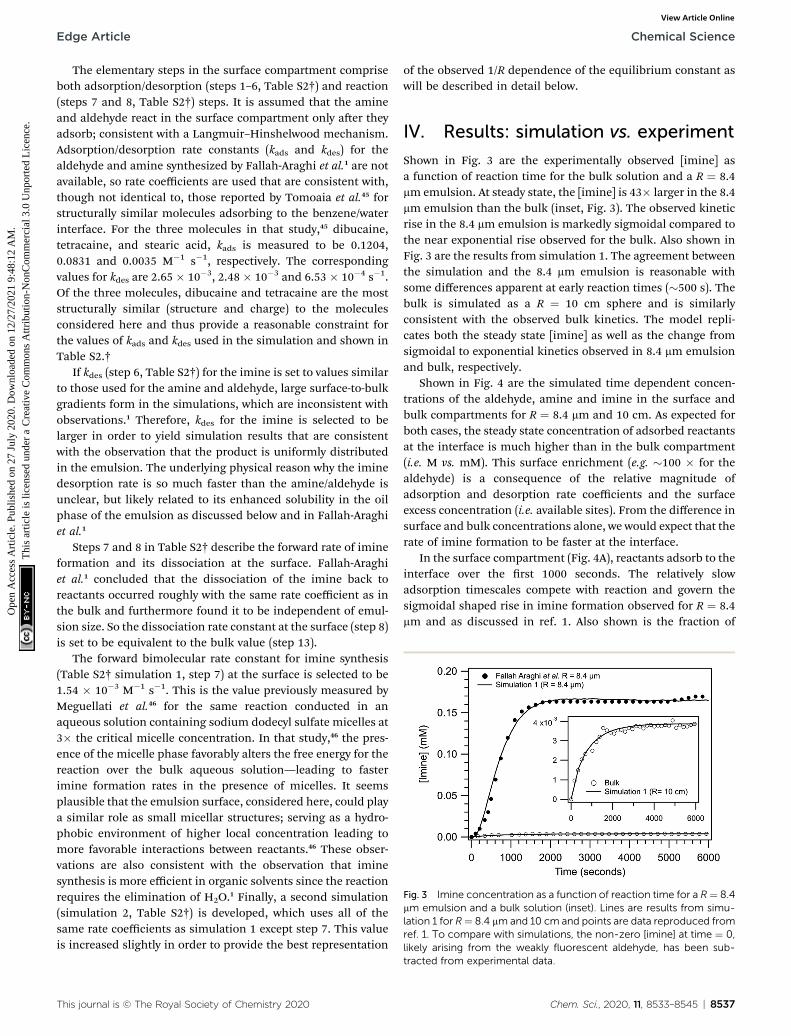
Fig. 3 Imine concentration as a function of reaction time for a R¼ 8.4mm emulsion and a bulk solution (inset). Lines are results from simu-lation 1 for R¼ 8.4 mm and 10 cm and points are data reproduced fromref. 1. To compare with simulations, the non-zero [imine] at time ¼ 0,likely arising from the weakly fluorescent aldehyde, has been sub-
Edge Article Chemical Science
Ope
n A
cces
s A
rtic
le. P
ublis
hed
on 2
7 Ju
ly 2
020.
Dow
nloa
ded
on 1
2/27
/202
1 9:
48:1
2 A
M.
Thi
s ar
ticle
is li
cens
ed u
nder
a C
reat
ive
Com
mon
s A
ttrib
utio
n-N
onC
omm
erci
al 3
.0 U
npor
ted
Lic
ence
.View Article Online
The elementary steps in the surface compartment compriseboth adsorption/desorption (steps 1–6, Table S2†) and reaction(steps 7 and 8, Table S2†) steps. It is assumed that the amineand aldehyde react in the surface compartment only aer theyadsorb; consistent with a Langmuir–Hinshelwood mechanism.Adsorption/desorption rate constants (kads and kdes) for thealdehyde and amine synthesized by Fallah-Araghi et al.1 are notavailable, so rate coefficients are used that are consistent with,though not identical to, those reported by Tomoaia et al.45 forstructurally similar molecules adsorbing to the benzene/waterinterface. For the three molecules in that study,45 dibucaine,tetracaine, and stearic acid, kads is measured to be 0.1204,0.0831 and 0.0035 M�1 s�1, respectively. The correspondingvalues for kdes are 2.65 � 10�3, 2.48 � 10�3 and 6.53 � 10�4 s�1.Of the three molecules, dibucaine and tetracaine are the moststructurally similar (structure and charge) to the moleculesconsidered here and thus provide a reasonable constraint forthe values of kads and kdes used in the simulation and shown inTable S2.†
If kdes (step 6, Table S2†) for the imine is set to values similarto those used for the amine and aldehyde, large surface-to-bulkgradients form in the simulations, which are inconsistent withobservations.1 Therefore, kdes for the imine is selected to belarger in order to yield simulation results that are consistentwith the observation that the product is uniformly distributedin the emulsion. The underlying physical reason why the iminedesorption rate is so much faster than the amine/aldehyde isunclear, but likely related to its enhanced solubility in the oilphase of the emulsion as discussed below and in Fallah-Araghiet al.1
Steps 7 and 8 in Table S2† describe the forward rate of imineformation and its dissociation at the surface. Fallah-Araghiet al.1 concluded that the dissociation of the imine back toreactants occurred roughly with the same rate coefficient as inthe bulk and furthermore found it to be independent of emul-sion size. So the dissociation rate constant at the surface (step 8)is set to be equivalent to the bulk value (step 13).
The forward bimolecular rate constant for imine synthesis(Table S2† simulation 1, step 7) at the surface is selected to be1.54 � 10�3 M�1 s�1. This is the value previously measured byMeguellati et al.46 for the same reaction conducted in anaqueous solution containing sodium dodecyl sulfate micelles at3� the critical micelle concentration. In that study,46 the pres-ence of the micelle phase favorably alters the free energy for thereaction over the bulk aqueous solution—leading to fasterimine formation rates in the presence of micelles. It seemsplausible that the emulsion surface, considered here, could playa similar role as small micellar structures; serving as a hydro-phobic environment of higher local concentration leading tomore favorable interactions between reactants.46 These obser-vations are also consistent with the observation that iminesynthesis is more efficient in organic solvents since the reactionrequires the elimination of H2O.1 Finally, a second simulation(simulation 2, Table S2†) is developed, which uses all of thesame rate coefficients as simulation 1 except step 7. This valueis increased slightly in order to provide the best representation
This journal is © The Royal Society of Chemistry 2020
of the observed 1/R dependence of the equilibrium constant aswill be described in detail below.
IV. Results: simulation vs. experiment
Shown in Fig. 3 are the experimentally observed [imine] asa function of reaction time for the bulk solution and a R ¼ 8.4mm emulsion. At steady state, the [imine] is 43� larger in the 8.4mm emulsion than the bulk (inset, Fig. 3). The observed kineticrise in the 8.4 mm emulsion is markedly sigmoidal compared tothe near exponential rise observed for the bulk. Also shown inFig. 3 are the results from simulation 1. The agreement betweenthe simulation and the 8.4 mm emulsion is reasonable withsome differences apparent at early reaction times (�500 s). Thebulk is simulated as a R ¼ 10 cm sphere and is similarlyconsistent with the observed bulk kinetics. The model repli-cates both the steady state [imine] as well as the change fromsigmoidal to exponential kinetics observed in 8.4 mm emulsionand bulk, respectively.
Shown in Fig. 4 are the simulated time dependent concen-trations of the aldehyde, amine and imine in the surface andbulk compartments for R ¼ 8.4 mm and 10 cm. As expected forboth cases, the steady state concentration of adsorbed reactantsat the interface is much higher than in the bulk compartment(i.e. M vs. mM). This surface enrichment (e.g. �100 � for thealdehyde) is a consequence of the relative magnitude ofadsorption and desorption rate coefficients and the surfaceexcess concentration (i.e. available sites). From the difference insurface and bulk concentrations alone, we would expect that therate of imine formation to be faster at the interface.
In the surface compartment (Fig. 4A), reactants adsorb to theinterface over the rst 1000 seconds. The relatively slowadsorption timescales compete with reaction and govern thesigmoidal shaped rise in imine formation observed for R ¼ 8.4mm and as discussed in ref. 1. Also shown is the fraction of
tracted from experimental data.
Chem. Sci., 2020, 11, 8533–8545 | 8537

Fig. 4 Concentration of amine and aldehyde reactants as a function ofreaction time in the (A) surface and (B) bulk compartments of simu-lation 1. Solid lines are for R ¼ 8.4 mm and dashed lines are for R ¼10 cm. In (A) the surface site occupancy is also shown.
Chemical Science Edge Article
Ope
n A
cces
s A
rtic
le. P
ublis
hed
on 2
7 Ju
ly 2
020.
Dow
nloa
ded
on 1
2/27
/202
1 9:
48:1
2 A
M.
Thi
s ar
ticle
is li
cens
ed u
nder
a C
reat
ive
Com
mon
s A
ttrib
utio
n-N
onC
omm
erci
al 3
.0 U
npor
ted
Lic
ence
.View Article Online
occupied sites, which reaches only 60% at steady state; indi-cating a sub-saturated surface in the linear region of theLangmuir isotherm. In the simulation, the aldehyde is moresurface active than the amine and its interfacial concentrationthroughout the reaction is �2� larger (cf. adsorption/desorption rate coefficients, Table S2†). Notably, the surfacekinetics and concentrations in the R ¼ 8.4 mm and 10 cm
Fig. 5 Imine concentration as a function of reaction time for R ¼ 8.4, 13simulations, the non-zero [imine] at time¼ 0, likely arising from an interfeexperimental data. (B) Simulation 1 results. The dotted line (denoted within the oil phase of the emulsion; see ref. 1 and text for details.
8538 | Chem. Sci., 2020, 11, 8533–8545
simulations are nearly indistinguishable. This suggests that theoverall enhancement in imine formation in small compart-ments is not due to substantial differences in surface chemistryas a function of size as will be discussed below.
The largest difference between the R ¼ 8.4 mm and 10 cmactually appears in the bulk compartment (Fig. 4B). For R ¼10 cm, the amine and aldehyde concentrations (on the scaleshown) remain nearly invariant over the course of the reaction,in contrast to the R ¼ 8.4 mm case where bulk depletion isobserved. Although the depletion is small (2% for the amineand 5% for the aldehyde), it nevertheless reects the 104
difference in the relative numbers of surface and bulk mole-cules in the micro-compartment. fs for R ¼ 10 cm is 5.5 � 10�6
compared with 0.07 for R ¼ 8.4 mm.Additional differences between R ¼ 8.4 mm and 10 cm are
observed by examining the event fraction vs. reaction stepnumber (Table S2†) as shown in Fig. S2.† Since the probabilityfor an event is computed using the rate law, the event fractionreects the relative importance of a particular step for theoverall chemical evolution of the system. For R ¼ 10 cm, 98% ofthe events occur in the bulk compartment, corresponding to theforward (step 12, Table S2†) synthesis and backward (step 13,Table S2†) decomposition of the imine.
This is in contrast to R¼ 8.4 mm, where reactions in the bulkcompartment account for only 12% of the total events, with thelargest event fractions corresponding to the surface (88%). It isclear from Fig. S2† that for the R ¼ 8.4 mm compartment iminesynthesis occurs at the interface (step 7) while its decomposi-tion happens in the bulk (step 13). This is consistent with thedifference in magnitude of imine dissociation vs. desorptionrate coefficients (steps 8 vs. 6) as well as the conclusions drawnby Fallah-Araghi et al.1 It is expected that the large differences inthe bulk and surface event fractions observed for these extremecases (R ¼ 8.4 mm and 10 cm) will evolve as a function of fs (i.e.emulsion size).
As reported previously,1 the steady state [imine] is observedto increase with decreasing droplet size, with the most dramatic
.4, 21.2 and 33.7 mm. (A) data reproduced from ref. 1. To compare withrence from the weakly fluorescent aldehyde, has been subtracted froma *) reflects the concentration of non-fluorescent product sequestered
This journal is © The Royal Society of Chemistry 2020

Edge Article Chemical Science
Ope
n A
cces
s A
rtic
le. P
ublis
hed
on 2
7 Ju
ly 2
020.
Dow
nloa
ded
on 1
2/27
/202
1 9:
48:1
2 A
M.
Thi
s ar
ticle
is li
cens
ed u
nder
a C
reat
ive
Com
mon
s A
ttrib
utio
n-N
onC
omm
erci
al 3
.0 U
npor
ted
Lic
ence
.View Article Online
change observed in going from R ¼ 8.4 to 13.4 mm. This isshown in Fig. 5A where the imine formation kinetics as a func-tion of emulsion size are reproduced from ref. 1. The kineticsobserved for the R ¼ 33.7 mm are nearly identical to the bulksolution (as is shown in Fig. 3, inset). For all sizes, the kineticrise in the [imine] is sigmoidal. Shown in Fig. 5B are the resultsfrom simulation 1. The shape of the simulated kinetics asa function of size are reasonably consistent with the data shownin Fig. 5A. The most notable difference between simulation andexperiment is the steady state [imine], which in the simulations,shows a more modest decrease in going from R ¼ 8.4 to 13.4mm. There is a �2� difference in simulated vs. observed [imine]for R ¼ 13.4, 21.2 and 33.7 mm.
Unfortunately, aer exploring a range of parameters insimulation 1 we were unable to replicate the exact size depen-dence observed in the experiment. This difference, however,likely originates from the partitioning of the imine product intothe oil fraction of the emulsion, which quenches its uores-cence as discussed by Fallah-Araghi et al.1 The solubility of theproduct in the oil phase is not explicitly included in the simu-lation. Fallah-Araghi et al.1 estimated the imine solubility in theoil phase to be �0.056 mM (shown as a dotted line in Fig. 5A),which likely explains the factor of �2 difference betweensimulation and experiment.
Shown in Fig. 6A is the observed equilibrium constant(Kobs
eq ) vs. 1/R reported in ref. 1 Kobseq is computed using the
[imine] at equilibrium and the concentrations of amine andaldehyde. In the experiment, Kobs
eq increases linearly with 1/R,with a 29� enhancement of Kobs
eq for R ¼ 8.4 mm relative to thebulk. A linear t to the data exhibits a negative y-intercept andreects the solubility of the imine product in the oil phase asdescribed above and discussed in Fallah-Araghi et al.1 Results
Fig. 6 Comparison of the simulated and observed1 equilibrium constant vsimulation 1 (solid line). (B) A constant offset (+0.25) applied to the exemulsion compared with simulation 2 (solid line). The dashed line in boththe value of the equilibrium constant measured in a bulk solution.
This journal is © The Royal Society of Chemistry 2020
from simulation 1 are shown for comparison. Although, simu-lation 1 (Fig. 6A) exhibits a linear 1/R dependence, the slope issmaller than what is observed experimentally (dashed lineFig. 6A). Simulation 1 over-predicts Kobs
eq for the intermediateemulsion sizes (R ¼ 13.4, 21.2, 33.7 mm), which is anticipatedgiven the comparison of simulation with experiment shown inFig. 5.
Without sufficient kinetic information to explicitly simulatethe solubility of the imine in the oil phase, a constant offset isapplied to the experimental data as shown in Fig. 6B. This offseteliminates the negative y-intercept shown in Fig. 6 and facili-tates a closer comparison of the experimental and simulatedKobseq . To best replicate the slope of Kobs
eq vs. 1/R in the correcteddata set, (see solid line in Fig. 6B), requires a surface forwardrate coefficient (step 7, Table S2†) that is 2� larger than the oneused in simulation 1. This larger rate coefficient, used insimulation 2 (3.22 � 10�3 M�1 s�1, step 7, Table S2†) producesa slope of 8.5 M�1 mm and is consistent with the experiment (8.3M�1 mm). Although this rate coefficient is 124� larger than thebulk value (see step 12, Table S2†) it appears consistent with theprevious micelle studies46 of the same reaction, in whicha similar order of magnitude increase over the bulk is observedwhen increasing the micelle concentration. For reference,Fig. S3† shows the sensitivity of the simulated results to themagnitude of this surface rate coefficient. This gure showsonly a minimal increase of Kobs
eq for the case where the forwardsurface rate coefficient for imine synthesis is equal to the bulkvalue (i.e. step 12, Table S2†).
To gain additional insights into the origin of the sizedependence of Kobs
eq , the total surface (steps 1–8, Table S2†) andbulk (steps 12–13) event fractions ([amine] ¼ [aldehyde] ¼ 15mM) from simulation 2 are computed and plotted as a function
s. 1/R. (A) Experimental results reproduced from ref. 1 and compared toperimental Kobseq to account of imine solubility in the oil phase of thepanels is a linear fit to the data. The dotted line in both panels indicates
Chem. Sci., 2020, 11, 8533–8545 | 8539

Fig. 7 Kobseq vs. concentration and radius for [amine] ¼ [aldehyde].Comparison of experimental data (5 and 15 mM) from ref. 1, resultsfrom simulation 2 and predictions from eqn (15). KB
eq ¼ 0.017 M�1 asindicated with a dashed line.
Chemical Science Edge Article
Ope
n A
cces
s A
rtic
le. P
ublis
hed
on 2
7 Ju
ly 2
020.
Dow
nloa
ded
on 1
2/27
/202
1 9:
48:1
2 A
M.
Thi
s ar
ticle
is li
cens
ed u
nder
a C
reat
ive
Com
mon
s A
ttrib
utio
n-N
onC
omm
erci
al 3
.0 U
npor
ted
Lic
ence
.View Article Online
of size in Fig. S4.† For values of R larger than �104 microns (i.e.1 cm) > 90% of the reactive events occur in the bulk compart-ment, consistent with only a modest increase in Kobs
eq above itsbulk macroscopic value. As size decreases, the relative fractionof surface events increase; accounting for �50% of the totalevents at R � 1500 microns (1.5 mm). Below 100 microns,surface events dominate (>80%).
Although the simulation results in Fig. S4† show theincreasing importance of the surface with decreasingcompartment size, large changes in the event fraction occuronly aer correspondingly large changes in compartment size(i.e. note log x-axis in Fig. S4†). For the narrow range of emul-sion sizes, R ¼ 8.4, 13.4, 21.2, 33.7 mm, the relative event frac-tions are nearly indistinguishable, suggesting that surface eventfraction alone is not sufficient to explain the scaling behavior ofKobseq with 1/R observed in Fig. 6.Since the simulations are constrained by physically realistic
rate coefficients and provide a reasonable description of theexperimental data, we have some condence that they can bereliably extended over a larger range of size and reactantconcentrations. This allows a more comprehensive view of thefactors that govern reactivity in micro-compartments. Althoughsimulations 1 and 2 both capture the key features of iminesynthesis in small emulsions, simulation 2 is used in thefollowing sections since it provides a slightly better represen-tation of the observed scaling of Kobs
eq with micro-compartmentsize (Fig. 6).
Shown in Fig. S5† are results from simulation 2 as a functionof concentration for a stoichiometric mixture of reactants. Foreach concentration, linear scaling of Kobs
eq with 1/R is observed,with the absolute value of the slope increasing with decreasingconcentration. A factor of �7 change from the concentrationsused in Fallah-Araghi et al.1 (15 mM to 100 mM) produces onlya modest difference in Kobs
eq from what is observed in the bulksolution. In contrast, for the R ¼ 8.4 micron compartment (1/R¼ 0.12 mm�1) a factor of 3 decrease in concentration (30 mM to10 mM) produces a factor of 5 increase in Kobs
eq . These resultspoint to additional scaling relationships that depend sensitivelyon concentration.
Shown in Fig. 7 are simulated Kobseq vs. reactant concentration
and size, again assuming a stoichiometric mixture of reactants.At large reactant concentrations (>0.1 M) all compartment sizesasymptotically approach Kobs
eq ¼ 0.017 M�1; the bulk macro-scopic value. As concentration decreases there is an overallincrease in Kobs
eq , the magnitude of which depends oncompartment size. As expected, in large compartments (R ¼ 10cm) there is only a modest increase in Kobs
eq with decreasingconcentration. This is in contrast to micro-compartments,where at low concentration (10�5 to 10�4 M), Kobs
eq approachesmuch larger asymptotic values. For example, for R ¼ 8.4microns (at 10�5 M) Kobs
eq � 50 M�1, which is �3000 times largerthan the bulk value.
Also included in Fig. 7 is a single measurement1 ofKobseq (1.24 M�1) for R ¼ 8.5 micron at [amine] ¼ [aldehyde] ¼
5 mM. Although, Kobseq is larger relative to the 15 mM case, which
is generally consistent with the simulated trends, the simulatedvalue is a factor of �3 larger. The reason for this difference is
8540 | Chem. Sci., 2020, 11, 8533–8545
unclear and difficult to evaluate in the absence of a complete setof size dependent measurements at 5 mM. As discussed above,this difference could originate from the unknown amounts ofthe imine product partitioning to the oil phase of the emulsion.Nevertheless, it would be highly desirable to compare thesesimulation results, and the derivation that follows, to largerexperimental data sets that systemically measure how observedrate or equilibrium constants depend both on compartmentsize and concentration.
Discussion
Together, the experimental data reported by Fallah-Araghi et al.1
and the results of simulation 2 provide a self-consistent set ofobservations that reveal how microdroplet reactivity dependsboth on concentration and compartment size. Below, we derivea set of governing kinetic equations and predictions that can bedirectly evaluated against these observations.
A. Kobseq in micro-compartments. Kobs
eq is related to theobserved product and reactant concentrations in the compart-ment at equilibrium,
Kobseq ¼ ½imine�total
½amine�B½aldehyde�B(2)
where the subscript B refers to the bulk concentration of thereactants. [Imine]total has two contributions that originate fromimine formation in the bulk and at the surface (denoted with Ssubscript). Eqn (3) explicitly accounts for these twocontributions,
½Imine�total ¼½imine�SVS þ ½Imine�BVB
Vtotal
; (3)
where VT is the total compartment volume and VB and VS arebulk and surface sub-volumes, respectively. For micro-compartments, VB [ VS so VT z VB. Here, [imine]S is a three-dimensional concentration, with the surface region havinga nite volume. This differs from other equivalent expressions
This journal is © The Royal Society of Chemistry 2020

Edge Article Chemical Science
Ope
n A
cces
s A
rtic
le. P
ublis
hed
on 2
7 Ju
ly 2
020.
Dow
nloa
ded
on 1
2/27
/202
1 9:
48:1
2 A
M.
Thi
s ar
ticle
is li
cens
ed u
nder
a C
reat
ive
Com
mon
s A
ttrib
utio
n-N
onC
omm
erci
al 3
.0 U
npor
ted
Lic
ence
.View Article Online
that could be written for surface area and coverage (i.e. mole-cules per cm2). Simplifying eqn (3) yields,
½Imine�total ¼½imine�SVS
VB
þ ½imine�B; (4)
where the [Imine] in the surface and bulk sub-volumes are,
[Imine]S ¼ KSeq[amine]S[aldehyde]S (5)
[Imine]B ¼ KBeq[amine]B[aldehyde]B. (6)
As noted above, both KSeq and KB
eq have units of inverseconcentration (i.e.M�1). Substituting eqn (5) and (6) into eqn (4)yields,
½Imine�total ¼KS
eq½amine�s½aldehyde�s VS
VB
þ KBeq½amine�B½aldehyde�B: (7)
Eqn (7) is then substituted into eqn (2) to yield,
Kobseq ¼ KS
eq½amine�s½aldehyde�s VS
VB½amine�B½aldehyde�Bþ KB
eq: (8)
The surface and bulk concentrations in eqn (8) are recast asnumbers of molecules (n),
½amine�s ¼namineS
VS
and ½aldehyde�s ¼naldehydeS
VS
(9)
½amine�B ¼ namineB
VB
and ½aldehyde�B ¼ naldehydeB
VB
; (10)
to yield Kobseq , expressed as ratios of volumes and numbers of
molecules.
Kobseq ¼ KS
eq
VB
VS
namineS n
aldehydeS
namineB n
aldehydeB
þ KBeq (11)
fs is the ratio of surface to bulk molecules,
f amines ¼ namine
S
namineB
and f aldehydes ¼ naldehydeS
naldehydeB
: (12)
Eqn (12) is an equivalent way of expressing fs as in eqn (1),which computes fs using compartment area and surface excess
in units of cm2 per molec.VB
VScan be computed for any
compartment geometry; for a sphere VS and VB are,
VS ¼ VB � 4
3pðr� dÞ3 and VB ¼ 4
3pr3 (13)
VB
VS
¼ r3
r3 � ðr� dÞ3 (14)
where d is surface thickness. This yields the followingexpression,
This journal is © The Royal Society of Chemistry 2020
Kobseq ¼ KS
eqfamines f aldehydes
r3hr3 � ðr� dÞ3
i0@
1Aþ KB
eq: (15)
Kobseq in eqn (15) depends upon KS
eq and three additional termsthat are together a function of compartment size and concen-tration. This expression has similarities to the kinetic formu-lation for gas-surface bimolecular reactions in thin lms
developed by Valsaraj.47 The
r3
½r3 � ðr � dÞ3�
!term is the ratio
of the total compartment volume to surface volume andincreases linearly with increasing compartment size. fs isa nonlinear function that increases with both decreasing radiusand decreasing concentration as shown in Fig. 1. Together
f amines f aldehydes
r3
½r3 � ðr � dÞ3�
!is a function that increases
linearly with 1/R, consistent with the scaling of Kobseq observed in
the experiments and simulations described above.For large compartment sizes and/or reactant concentrations,
the rst term on the RHS of eqn (15) approaches zero and thesystem exhibits the expected macroscopic behavior (i.e. Kobs
eq ¼KBeq). For small compartments under dilute conditions this term
becomes sizable leading to Kobseq [ KB
eq. It should be noted thateqn (15) is a different expression than was derived by Fallah-Araghi et al.1 Although their expression for Kobs
eq (eqn (8) in ref.1) exhibits linear 1/R scaling, it does not explicitly account forthe concentration dependence in eqn (15), which is needed toexplain what is observed in the experiments and simulationsshown above.
B. Derivation of fs. To use eqn (15) to make quantitative
predictions requires deriving an expression for fs ¼ nSnB
. Here, fs
depends upon adsorption/desorption and reaction rates as wellas bulk concentration. These factors were explicitly neglected,for discussion purposes, in the idealized expression in eqn (1).nB is straightforward to compute using compartment volumeand bulk concentration. However, for a system undergoingreaction, nS cannot be simply computed from the Langmuir
equation, the equilibrium constant for adsorption�kadskdes
�and
the bulk concentrations. This is because nS will depend uponboth the rates of reaction and the rates of adsorption/desorption to and from the interface. The following kineticexpressions are used to derive fs for this more complex case. Eqn(16) and (17) describe the time dependent concentrations ofspecies (denoted x and y) at the surface,
dx
dt¼ kads
xAq� kdesxX � ks
fXY (16)
dy
dt¼ kads
yBq� kdesyY � ks
fXY (17)
with the following substitutions and denitions,
[amine]s ¼ X and [aldehyde]s ¼ Y (18)
[amine]B ¼ A and [aldehyde]B ¼ B (19)
Chem. Sci., 2020, 11, 8533–8545 | 8541

Chemical Science Edge Article
Ope
n A
cces
s A
rtic
le. P
ublis
hed
on 2
7 Ju
ly 2
020.
Dow
nloa
ded
on 1
2/27
/202
1 9:
48:1
2 A
M.
Thi
s ar
ticle
is li
cens
ed u
nder
a C
reat
ive
Com
mon
s A
ttrib
utio
n-N
onC
omm
erci
al 3
.0 U
npor
ted
Lic
ence
.View Article Online
qtotal ¼ [total surface sites] (20)
q ¼ [unoccupied surface sites] (21)
q ¼ qtotal � X � Y (22)
ksf is the surface forward rate coefficient (e.g. step 7, Table S2†)and kads and kdes are reactant adsorption (e.g. steps 1 and 3,Table S2†) and desorption (e.g. steps 2 and 4, Table S2†) ratecoefficients, respectively. For simplicity, we neglect the disso-ciation step of the surface imine back to reactants (step 8, TableS2†) since the imine desorption rate (step 6, Table S2†) from the
interface is �1000 times faster. At equilibrium,dxdt
¼ dydt
¼ 0, so
eqn (16) and (17) become,
0 ¼ kadsxAq � kdes
xX � ksfXY (23)
0 ¼ kadsyBq � kdes
yY � ksfXY (24)
Substituting the expression for q in eqn (22) into eqn (23) andsolving for X and Y yields the following two expressions,
X ¼ kadsxAðqtotal � Y Þ
Akadsx þ kdes
x þ ksfY
(25)
Y ¼ kadsxAðqtotal � XÞ � kdes
xX
Akadsx þ ks
fX(26)
Similarly, substituting q in eqn (22) into eqn (24) and rear-ranging yields two additional expressions for X and Y:
X ¼ kadsyBðqtotal � YÞ � kdes
yY
Bkadsy þ ks
fY(28)
Y ¼ kadsyBðqtotal � XÞ
Bkadsy þ ks
fX þ kdesy (29)
Setting the two expressions for X in eqn (25) and (28) to beequal yields,
kadsxAðqtotal � Y Þ
Akadsx þ kdes
x þ ksfY
¼ kadsyBðqtotal � Y Þ � kdes
yY
Bkadsy þ ks
fY: (30)
Eqn (30) can be solved for Y (using Mathematica48) yielding,
Y ¼ � ffiffiffiffiffiffiffiffiffiffiffiffiffiffiffiffiffiN1 �N2
p þN3
2ksf
�Akads
x � Bkadsy � kdes
y� (31)
where,
N1 ¼ (�AqTkadsxksf � Akads
xkdesy + BqTkads
yksf� Bkdes
xkadsy � kdes
xkdesy)2 (31a)
N2 ¼ 4BqTkdesxkads
y(Akadsxksf � Bkads
yksf � kdesyksf) (31b)
N3 ¼ AqTkadsxksf + Akads
xkdesy
� BqTkadsyksf + Bkdes
xkadsy + kdes
xkdesy (31c)
8542 | Chem. Sci., 2020, 11, 8533–8545
X is computed by substituting the expression for Y in eqn (31)into eqn (25). It should be noted that the equations above area general solution for a bimolecular reaction occurring via theLangmuir–Hinshelwood mechanism. Both X and Y areconcentrations and can be converted to numbers of molecules(nXS and nYS) using eqn (9) (where X ¼ [amine]s and Y ¼[aldehyde]s). Eqn (31), although somewhat lengthy, is straight-forward to compute using the adsorption, desorption, andreaction rate coefficients and bulk concentrations of reactants,A and B. As an internal check of this derivation, eqn (31) and(25) are used to compute the concentration of [amine]s and[aldehyde]s as well as q (the fraction of occupied sites), whichare compared to the numerical results of simulation 2. As isshown in Fig. S6,† these equations quantitatively predict thesurface concentrations and sites as a function of bulk concen-tration that are observed in the simulation.
To make global predictions of how Kobseq depends upon
compartment size and reactant concentration, eqn (31) and (25)are used to compute famine
s and faldehydes in eqn (15). Rate coef-cients needed for eqn (31) and (25), for the specic systemconsidered here, are found in Table S2.† The predictions areshown as a function of size and concentration in Fig. S5 andS7.† Eqn (15) quantitatively predicts the linear scaling ofKobseq with 1/R observed by Fallah-Araghi et al.1 and in simulation
2 (Fig. S5†). Eqn (15) also correctly predicts the asymptoticapproach of Kobs
eq / KBeq with increasing concentration shown in
Fig. 7. Eqn (15) accounts for the increase in Kobseq with decreasing
concentration (and its dependence on size) as well as theeventual plateau of Kobs
eq at low concentrations (10�4 to 10�5 M).This plateau is a natural consequence of the small surfaceoccupancy at low bulk concentrations (cf. Langmuir Equation).We have further veried the predictions of eqn (15) againstsimulation results for the case of non-stoichiometric reactantconcentrations as is shown in Fig. S7.†
At low concentrations (10�4 to 10�5 M), eqn (15) over-predictsKobseq by �10–20% from what is observed in simulation 2.Although the number of interface molecules at 10�4 to 10�5 M issmall they are still factors of 10 larger (Fig. 1) than the number inthe bulk, suggesting that more complex phenomena may emergewhen the system is very dilute. Nevertheless, the near quantitativeagreement between eqn (15) and both the experimental andsimulated observations suggest that the majority of the underlyingkinetic behavior is correctly predicted by eqn (15).
V. Conclusions
Using a combination of new stochastic simulations and previousexperimental data, a general kinetic expression is derived thatconnects Kobseq with KSeq and KBeq. The relative contribution of KSeq tothe observed equilibrium is found to be governed by the ratio ofmolecules at the surface, which becomes more pronounced whencompartment sizes are small and concentrations are dilute. fs inturn depends upon the relative adsorption, desorption and surfacereaction rates—all features of the reaction-adsorption mechanismproposed by Fallah-Araghi et al.1 Unlike prior work,1 however, eqn(15) provides a more general prediction of how Kobseq scales withcompartment size and concentration. These results also highlight
This journal is © The Royal Society of Chemistry 2020

Edge Article Chemical Science
Ope
n A
cces
s A
rtic
le. P
ublis
hed
on 2
7 Ju
ly 2
020.
Dow
nloa
ded
on 1
2/27
/202
1 9:
48:1
2 A
M.
Thi
s ar
ticle
is li
cens
ed u
nder
a C
reat
ive
Com
mon
s A
ttrib
utio
n-N
onC
omm
erci
al 3
.0 U
npor
ted
Lic
ence
.View Article Online
the importance and experimental need to make measurements asa function of concentration and well-dened compartment size orlm thickness,19,49 which together are needed to assess the role thatsurface chemistry (e.g. rather than evaporative concentration ofreactants, etc.) plays in accelerating reactions in micro-droplets.
It is clear to fully understand the chemistry occurring inside ofmicro-compartments, detailed insights (and new measurements)into adsorption/desorption dynamics of reactants, intermediates,and products are needed, since these steps kinetically link thesurface with bulk reactivity and together ultimately determine themagnitude of the acceleration. Although, these linkages are presentin macroscale systems, since surface partitioning is governed bythermodynamics and not by compartment size at these scales, therole of the surface remains obscured due to the relatively smallnumber of surface molecules participating in the overall chemicaltransformation. For micro-compartments or thin lms,19 however,the nite system size enhances the overall importance of interfacialphenomena, where reaction rates and mechanisms can be modi-ed due to partial solvation, stabilization of unique transitionstates and by molecular alignment and enrichment. For gas-surface reactions, it has been observed that diffusive conne-ment at semi-solid and glassy interfaces can alter product distri-butions50 and enhance reaction pathways31,51 that would normallybe too slow in well-mixed liquids or at aqueous interfaces.
The magnitude of the observed rate acceleration in micron-sized spaces will depend on the enhancement of the surfacereaction rate constant (relative to the bulk) and the adsorption/desorption rate coefficients embedded in eqn (15). These ratecoefficients will be sensitive to the molecular structure of thereactants, intermediates and products as well as additionalcompartment features such as solvent, electric elds and pHgradients that can alter reaction energetics and transition statesat the interface.23,52,53 Rate coefficients for adsorption anddesorption, which also control surface reaction rates via inter-facial concentration, will be similarly sensitive to the exactnature of the interface (i.e. liquid/vapor vs. oil/aqueous) as wellas the solvent environment of the compartment. The kineticframework and simulation methods described here can beadapted to account for these different environments.
Liquid/vapor interfaces are regions in which hydrophobicreactants concentrate and orient, providing unique environ-ments for the acceleration of those reactions that are unfavor-able in water (e.g. condensation reactions, peptide bondformation,54 etc.). Thus, micro-compartment interfaces appearto behave somewhat analogously to micelles55 and aqueoussuspensions,56 and, perhaps, nanovessels for catalytic reactions,in that molecules can sample and react in two rather differentsolvent environments (bulk aqueous vs. surface hydrophobic).
Whether a reaction is accelerated in a micro-compartmentdepends not only on the interfacial reaction rate but also onthe surface concentration as well as the timescales foradsorption/desorption. For example, the adsorption kinetics atthe oil–aqueous interface45 examined here, are �103 to 104
times slower than the observed kinetics of surfactants and othersmall molecules to the air–water interface (e.g. ESI droplets).57
For these faster systems, the interface reaches its equilibriumenriched concentration on �10 to 100 ms timescales. Many of
This journal is © The Royal Society of Chemistry 2020
the previous reports of accelerated reactions in ESI dropletsoperate under conditions, (Lcompartment � Rcritical, Fig. 1), whereadsorption kinetics rather than diffusion is likely limiting masstransfer to the interface. In order for surface reactions tocontribute substantially to the observed rate acceleration, thedroplet interface would thus require millisecond timescales tofully relax. It appears likely that some other accelerationmechanism is operative for those experiments that reportproduct formation at microsecond timescales.
Yet there is no reason a priori to expect that all reactions areaccelerated at micro-compartment interfaces since this willdepend upon the ne details of how surface solvation structure,molecular orientation, acidity, and electric elds alter reactionenergetics58,59 and transition states; topics that can beaddressed theoretically by quantum chemistry and/or statisticalmechanics. Rather, the kinetic framework presented hereprovides a way of using these theoretical determinations topredict the overall chemical kinetics in a micro-compartment orthin lm.19 Eqn (15) also provides a way of extrapolating beakerscale kinetic measurements in the laboratory to trans-formations for example in atmospheric compartments such ascloud droplets60 and aerosols, provided that adsorption anddesorption kinetics are known.
The expression for Kobseq shown in eqn (15) is not simply relatedto concentration, but instead depends upon the ratio of moleculesat the micro-compartment interface. This suggests a kind of “sto-chasticity” in micro-compartments despite the total number ofmolecules being rather large. In a 10 mM, R ¼ 5 mm droplet thereare�109 solutemolecules, but unlike its macroscale analog,�17%of these molecules, on average, reside at the interface. This isdistinct from the stochasticity that governs reaction rates undernano-connement28,29 or in subcellular biological structures61,62
where the average concentrations of proteins or other smallmolecules corresponds to less than 1 molecule/compartment.25
Nevertheless, given the widespread occurrence of micro-connement in environmental, atmospheric and biologicalsettings, these results suggest that surfaces likely play a central rolein governing the overall reaction rates and mechanisms observedin these systems.
Conflicts of interest
There are no conicts to declare.
Acknowledgements
This work was supported by the Condensed Phase and Inter-facial Molecular Science Program (CPIMS), in the ChemicalSciences Geosciences and Biosciences Division of the Office ofBasic Energy Sciences of the U.S. Department of Energy underContract No. DE-AC02-05CH11231. MDW acknowledgessupport from a Natural Sciences and Engineering ResearchCouncil of Canada (NSERC) postdoctoral fellowship. We thankDr Frances Houle (LBNL) and Dr Meirong Zeng (LBNL) forhelpful insights and Dr William D. Hinsberg (Columbia HillTechnical Consulting) for technical assistance with Kinetiscope.
Chem. Sci., 2020, 11, 8533–8545 | 8543
Chemical Science Edge Article
Ope
n A
cces
s A
rtic
le. P
ublis
hed
on 2
7 Ju
ly 2
020.
Dow
nloa
ded
on 1
2/27
/202
1 9:
48:1
2 A
M.
Thi
s ar
ticle
is li
cens
ed u
nder
a C
reat
ive
Com
mon
s A
ttrib
utio
n-N
onC
omm
erci
al 3
.0 U
npor
ted
Lic
ence
.View Article Online
References
1 A. Fallah-Araghi, K. Meguellati, J.-C. Baret, A. E. Harrak,T. Mangeat, M. Karplus, S. Ladame, C. M. Marques andA. D. Griffiths, Enhanced Chemical Synthesis at SoInterfaces: A Universal Reaction-Adsorption Mechanism inMicrocompartments, Phys. Rev. Lett., 2014, 112(2), 028301.
2 S. Banerjee, E. Gnanamani, X. Yan and R. N. Zare, Can allbulk-phase reactions be accelerated in microdroplets?,Analyst, 2017, 142(9), 1399–1402.
3 M. Girod, E. Moyano, D. I. Campbell and R. G. Cooks,Accelerated bimolecular reactions in microdroplets studiedby desorption electrospray ionization mass spectrometry,Chem. Sci., 2011, 2(3), 501–510.
4 J. K. Lee, S. Banerjee, H. G. Nam and R. N. Zare, Accelerationof reaction in charged microdroplets, Q. Rev. Biophys., 2015,48(4), 437–444.
5 Z. Wei, Y. Li, R. G. Cooks and X. Yan, Accelerated ReactionKinetics in Microdroplets: Overview and RecentDevelopments, Annu. Rev. Phys. Chem., 2020, 71(1), 31–51.
6 X. Yan, R. M. Bain and R. G. Cooks, Organic Reactions inMicrodroplets: Reaction Acceleration Revealed by MassSpectrometry, Angew. Chem., Int. Ed., 2016, 55(42), 12960–12972.
7 S. Kwak, J. Yeo, S. Jung and I. Nam, Microdroplet Chemistry:Difference of Organic Reactions between Bulk Solution andAqueous Microdroplets, Academic Journal of Polymer science,2018, 1(1), 555551.
8 K. K. Nakashima, M. A. Vibhute and E. Spruijt, BiomolecularChemistry in Liquid Phase Separated Compartments, Front.Mol. Biosci., 2019, 6, 21.
9 R. J. R. W. Peters, M. Marguet, S. Marais, M. W. Fraaije,J. C. M. van Hest and S. Lecommandoux, CascadeReactions in Multicompartmentalized Polymersomes,Angew. Chem., Int. Ed., 2014, 53(1), 146–150.
10 A. K. Badu-Tawiah, D. I. Campbell and R. G. Cooks,Accelerated C–N Bond Formation in Dropcast Thin Filmson Ambient Surfaces, J. Am. Soc. Mass Spectrom., 2012,23(9), 1461–1468.
11 P. Liu, M. Lu, Q. Zheng, Y. Zhang, H. D. Dewald and H. Chen,Recent advances of electrochemical mass spectrometry,Analyst, 2013, 138(19), 5519–5539.
12 G. J. Van Berkel and V. Kertesz, Using the Electrochemistryof the Electrospray Ion Source, Anal. Chem., 2007, 79(15),5510–5520.
13 M. I. Jacobs, R. D. Davis, R. J. Rapf and K. R. Wilson,Studying Chemistry in Micro-compartments by SeparatingDroplet Generation from Ionization, J. Am. Soc. MassSpectrom., 2019, 30(2), 339–343.
14 A. Gallo, A. S. F. Farinha, M. Dinis, A.-H. Emwas, A. Santana,R. J. Nielsen, W. A. Goddard and H. Mishra, The chemicalreactions in electrosprays of water do not alwayscorrespond to those at the pristine air–water interface,Chem. Sci., 2019, 10(9), 2566–2577.
15 J. K. Lee, K. L. Walker, H. S. Han, J. Kang, F. B. Prinz,R. M. Waymouth, H. G. Nam and R. N. Zare, Spontaneous
8544 | Chem. Sci., 2020, 11, 8533–8545
generation of hydrogen peroxide from aqueousmicrodroplets, Proc. Natl. Acad. Sci. U. S. A., 2019, 116(39),19294–19298.
16 H. J. Sterling, M. P. Daly, G. K. Feld, K. L. Thoren,A. F. Kintzer, B. A. Krantz and E. R. Williams, Effects ofsupercharging reagents on noncovalent complex structurein electrospray ionization from aqueous solutions, J. Am.Soc. Mass Spectrom., 2010, 21(10), 1762–1774.
17 Z. Zhou, X. Yan, Y.-H. Lai and R. N. Zare, FluorescencePolarization Anisotropy in Microdroplets, J. Phys. Chem.Lett., 2018, 9(11), 2928–2932.
18 Y. Li, X. Yan and R. G. Cooks, The Role of the Interface inThin Film and Droplet Accelerated Reactions Studied byCompetitive Substituent Effects, Angew. Chem., Int. Ed.,2016, 55(10), 3433–3437.
19 A. A. Heath and K. T. Valsaraj, Effects of Temperature,Oxygen Level, Ionic Strength, and pH on the Reaction ofBenzene with Hydroxyl Radicals at the Air–Water Interfacein Comparison to the Bulk Aqueous Phase, J. Phys. Chem.A, 2015, 119(31), 8527–8536.
20 A. B. Grommet, M. Feller and R. Klajn, Chemical reactivityunder nanoconnement, Nat. Nanotechnol., 2020, 15(4),256–271.
21 H. G. Park and Y. Jung, Carbon nanouidics of rapid watertransport for energy applications, Chem. Soc. Rev., 2014,43(2), 565–576.
22 M. Mastalerz, Porous Shape-Persistent Organic CageCompounds of Different Size, Geometry, and Function,Acc. Chem. Res., 2018, 51(10), 2411–2422.
23 L. R. Pestana, H. Hao and T. Head-Gordon, Diels–AlderReactions in Water Are Determined by Microsolvation,Nano Lett., 2020, 20(1), 606–611.
24 D. Munoz-Santiburcio and D. Marx, Chemistry innanoconned water, Chem. Sci., 2017, 8(5), 3444–3452.
25 W. Goch and W. Bal, Stochastic or Not? Method To Predictand Quantify the Stochastic Effects on the AssociationReaction Equilibria in Nanoscopic Systems, J. Phys. Chem.A, 2020, 124(7), 1421–1428.
26 M. J. Shon and A. E. Cohen, Mass Action at the Single-Molecule Level, J. Am. Chem. Soc., 2012, 134(35), 14618–14623.
27 M. Maioli, G. Varadi, R. Kurdi, L. Caglioti and G. Palyi,Limits of the Classical Concept of Concentration, J. Phys.Chem. B, 2016, 120(30), 7438–7445.
28 R. Szymanski, S. Sosnowski and Ł. Maslanka, Statisticaleffects related to low numbers of reacting moleculesanalyzed for a reversible association reaction A + B ¼ C inideally dispersed systems: An apparent violation of the lawof mass action, J. Chem. Phys., 2016, 144(12), 124112.
29 Y. Khodorkovsky, L. Rubinovich and M. Polak, StochasticKinetics and Equilibrium of Nanoconned Reactions, J.Phys. Chem. C, 2019, 123(40), 24949–24956.
30 Y. Kuramoto, Effects of Diffusion on the Fluctuations inOpen Chemical Systems, Prog. Theor. Phys., 1974, 52(2),711–713.
31 F. A. Houle, A. A. Wiegel and K. R. Wilson, Changes inReactivity as Chemistry Becomes Conned to an Interface.
This journal is © The Royal Society of Chemistry 2020
Edge Article Chemical Science
Ope
n A
cces
s A
rtic
le. P
ublis
hed
on 2
7 Ju
ly 2
020.
Dow
nloa
ded
on 1
2/27
/202
1 9:
48:1
2 A
M.
Thi
s ar
ticle
is li
cens
ed u
nder
a C
reat
ive
Com
mon
s A
ttrib
utio
n-N
onC
omm
erci
al 3
.0 U
npor
ted
Lic
ence
.View Article Online
The Case of Free Radical Oxidation of C30H62 Alkane by OH,J. Phys. Chem. Lett., 2018, 9(5), 1053–1057.
32 F. Jin, R. Balasubramaniam and K. J. Stebe, Surfactantadsorption to spherical particles: the intrinsic length scalegoverning the shi from diffusion to kinetic-controlledmass transfer, J. Adhes., 2004, 80(9), 773–796.
33 W. D. Hinsberg, F. A. Houle, Kinetiscope©, http://hinsberg.net/kinetiscope/, 2020.
34 D. L. Bunker, B. Garrett, T. Kleindienst and G. S. Long,Discrete simulation methods in combustion kinetics,Combust. Flame, 1974, 23(3), 373–379.
35 D. T. Gillespie, General method for numerically simulatingstochastic time evolution of coupled chemical reactions, J.Comput. Phys., 1976, 22(4), 403–434.
36 N. Heine, C. Arata, A. H. Goldstein, F. A. Houle andK. R. Wilson, Multiphase Mechanism for the Production ofSulfuric Acid from SO2 by Criegee Intermediates FormedDuring the Heterogeneous Reaction of Ozone withSqualene, J. Phys. Chem. Lett., 2018, 9(12), 3504–3510.
37 N. Heine, F. A. Houle and K. R. Wilson, Connecting theElementary Reaction Pathways of Criegee Intermediates tothe Chemical Erosion of Squalene Interfaces duringOzonolysis, Environ. Sci. Technol., 2017, 51(23), 13740–13748.
38 F. A. Houle, W. D. Hinsberg and K. R. Wilson, Oxidation ofa model alkane aerosol by OH radical: the emergent natureof reactive uptake, Phys. Chem. Chem. Phys., 2015, 17(6),4412–4423.
39 F. A. Houle, A. A. Wiegel and K. R. Wilson, Predicting AerosolReactivity Across Scales: from the Laboratory to theAtmosphere, Environ. Sci. Technol., 2018, 52(23), 13774–13781.
40 M. J. Liu, A. A. Wiegel, K. R. Wilson and F. A. Houle, AerosolFragmentation Driven by Coupling of Acid–Base and Free-Radical Chemistry in the Heterogeneous Oxidation ofAqueous Citric Acid by OH Radicals, J. Phys. Chem. A, 2017,121(31), 5856–5870.
41 A. A. Wiegel, K. R. Wilson, W. D. Hinsberg and F. A. Houle,Stochastic methods for aerosol chemistry: a compactmolecular description of functionalization andfragmentation in the heterogeneous oxidation of squalaneaerosol by OH radicals, Phys. Chem. Chem. Phys., 2015,17(6), 4398–4411.
42 C. Herdes, A. Ervik, A. Mejıa and E. A. Muller, Prediction ofthe water/oil interfacial tension from molecular simulationsusing the coarse-grained SAFT-g Mie force eld, Fluid PhaseEquilibria, 2018, 476, 9–15.
43 I. Langmuir, The adsorption of gases on plane surfaces ofglass, mica and platinum, J. Am. Chem. Soc., 1918, 40(9),1361–1403.
44 G. S. Girolami, A Simple "Back of the Envelope" Method forEstimating the Densities and Molecular Volumes of Liquidsand Solids, J. Chem. Educ., 1994, 71(11), 962.
45 G. Tomoaia, A. Tomoaia-Cotisel, M. Tomoaia-Cotisel andA. Mocanu, Kinetic study of adsorption of somebiocompounds at the oil/water interface, Cent. Eur. J.Chem., 2005, 3(2), 347–360.
46 K. Meguellati, A. Fallah-Araghi, J.-C. Baret, A. El Harrak,T. Mangeat, C. M. Marques, A. D. Griffiths and S. Ladame,
This journal is © The Royal Society of Chemistry 2020
Enhanced imine synthesis in water: from surfactant-mediated catalysis to host–guest mechanisms, Chem.Commun., 2013, 49(96), 11332–11334.
47 K. T. Valsaraj, Trace gas adsorption thermodynamics at theair�water interface: Implications in atmosphericchemistry, Pure Appl. Chem., 2009, 81(10), 1889.
48 Wolfram Research, Inc., Mathematica, Version 12.1,Champaign, Illinois, 2020.
49 J. Chen, F. S. Ehrenhauser, K. T. Valsaraj and M. J. Wornat,Uptake and UV-Photooxidation of Gas-Phase PAHs on theSurface of Atmospheric Water Films. 1. Naphthalene, J.Phys. Chem. A, 2006, 110(29), 9161–9168.
50 J. F. Davies and K. R. Wilson, Nanoscale interfacial gradientsformed by the reactive uptake of OH radicals onto viscousaerosol surfaces, Chem. Sci., 2015, 6(12), 7020–7027.
51 A. A. Wiegel, M. J. Liu, W. D. Hinsberg, K. R. Wilson andF. A. Houle, Diffusive connement of free radicalintermediates in the OH radical oxidation of semisolidaerosols, Phys. Chem. Chem. Phys., 2017, 19(9), 6814–6830.
52 A. C. Aragones, N. L. Haworth, N. Darwish, S. Ciampi,N. J. Bloomeld, G. G. Wallace, I. Diez-Perez andM. L. Coote, Electrostatic catalysis of a Diels–Alderreaction, Nature, 2016, 531(7592), 88–91.
53 N. Narendra, X. Chen, J. Wang, J. Charles, R. G. Cooks andT. Kubis, Quantum Mechanical Modeling of Reaction RateAcceleration in Microdroplets, J. Phys. Chem. A, 2020,124(24), 4984–4989.
54 E. C. Griffith and V. Vaida, In situ observation of peptidebond formation at the water–air interface, Proc. Natl. Acad.Sci. U. S. A., 2012, 109(39), 15697–15701.
55 G. La Sorella, G. Strukul and A. Scarso, Recent advances incatalysis in micellar media, Green Chem., 2015, 17(2), 644–683.
56 S. Narayan, J. Muldoon, M. G. Finn, V. V. Fokin, H. C. Kolband K. B. Sharpless, “On Water”: Unique Reactivity ofOrganic Compounds in Aqueous Suspension, Angew.Chem., Int. Ed., 2005, 44(21), 3275–3279.
57 G. Bleys and P. Joos, Adsorption kinetics of bolaformsurfactants at the air/water interface, J. Phys. Chem., 1985,89(6), 1027–1032.
58 A. F. Tuck, Gibbs Free Energy and Reaction Rate Accelerationin and on Microdroplets, Entropy, 2019, 21(11), 1044.
59 A. Sanfeld and A. Steinchen, Chemical reactions inmicrodroplets and microbubbles. Thermodynamicapproach, C. R. Chim., 1999, 2(14), 697–700.
60 D. J. Donaldson and K. T. Valsaraj, Adsorption and Reactionof Trace Gas-Phase Organic Compounds on AtmosphericWater Film Surfaces: A Critical Review, Environ. Sci.Technol., 2010, 44(3), 865–873.
61 D. J. Wilkinson, Stochastic modelling for quantitativedescription of heterogeneous biological systems, Nat. Rev.Genet., 2009, 10(2), 122–133.
62 H. H. McAdams and A. Arkin, It's a noisy business! Geneticregulation at the nanomolar scale, Trends Genet., 1999,15(2), 65–69.
Chem. Sci., 2020, 11, 8533–8545 | 8545