“a isheries perspective on the impacts of lobal...
TRANSCRIPT

“A Fisheries Perspective on the Impacts of Global Sourcing”
Presenter: Sylvester B. Pokajam
Managing Director, National Fisheries Authority
1

1. BACKGROUND INFORMATION
a. RoO Comparative
b. Global sourcing (GS)
2. IMPACTS OF GLOBAL SOURCING
a. Macroeconomic Benefits
b. Impact on Fisheries Sector
c. Management of Tuna Resources
3. CONCLUSIONS
2

Originating fish requirement: Cotonou
Agreement
Originating fish requirement: Interim EPA
Vessel Registration:
- fishing vessels must be registered in ACP or of EU
State or OCT.
Global Sourcing – to source fish from any vessel
regardless of flag or where it was caught, , the fish
is deem originating, as long as it is landed and
processed in the PACP/PNG
Vessel Ownership:
-the boat must be 50% owned by Nationals of State
Party.
The fish is substantially transformed/processed
from its natural state (0305/0305) – a change in
tariff classification, into semi-processed or
processed products (1604/1605)
Vessel Flag:
- fishing vessels must be flagged in ACP States or
EU State or OCT
EU Requirements
Mandatory SPS and IUU requirements must be met,
therefore products enter the EU market DFQF
Crewing:
- boat must be crewed with 50% by Nationals of
State Party to the agreement.
Location of Catch
– fish caught within the territorial (12 miles frm the
coast) or in the archipelagic waters
3

Global sourcing implies regardless of
- where the fish is caught, or
- the status of the vessel’s flag, registration or ownership,
the fish is deemed originating….. as long as it is being sufficiently worked
or processed from its natural state (fresh or frozen) into precooked, packaged
or canned product.
Conditions:
1.Fish & Fish products globally sourced MUST meet mandatory EU SPS
requirements
2.That these fish & fish products are not sourced thru. IUU means
Products globally sourced that meet the above conditions enjoys " duty and
quota free” market access status into the EU market.
4
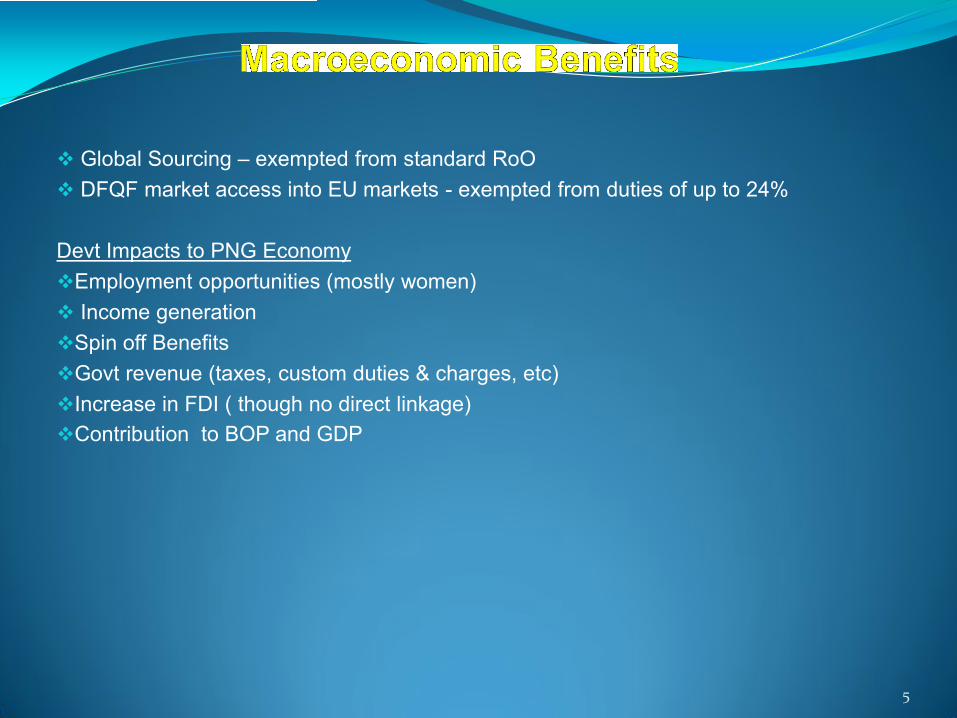
Global Sourcing – exempted from standard RoO
DFQF market access into EU markets - exempted from duties of up to 24%
Devt Impacts to PNG Economy
Employment opportunities (mostly women)
Income generation
Spin off Benefits
Govt revenue (taxes, custom duties & charges, etc)
Increase in FDI ( though no direct linkage)
Contribution to BOP and GDP
5

Income Generation by Existing Tuna Processing Plants to PNG Economy,
2007-2010
Source: GS Study 6

Category Flag
Vessel numbers
Fishing area permitted as condition of licence 2008 2011
Domestic PNG 9 12 All waters outside 12nm of land, island, reef
(archipelagic and EEZ)
Locally- based
foreign
(chartered)
Philippines (20), China (2),
Taiwan (4), Vanuatu (13)
33 39 Small-medium vessels <600 MT capacity -
archipelagic and EEZ waters but outside 12nm
Large vessels (>1,000 GT) - EEZ waters only (i.e.
outside 12nm and archipelagic waters )
Foreign China, FSMA+, Japan,
Korea, Philippines, Taiwan,
USMLT+, Vanuatu, other
128 176 EEZ waters (outside 12nm and outside
archipelagic waters)
Source: NFA Licensing database as reflected in GS Study
7
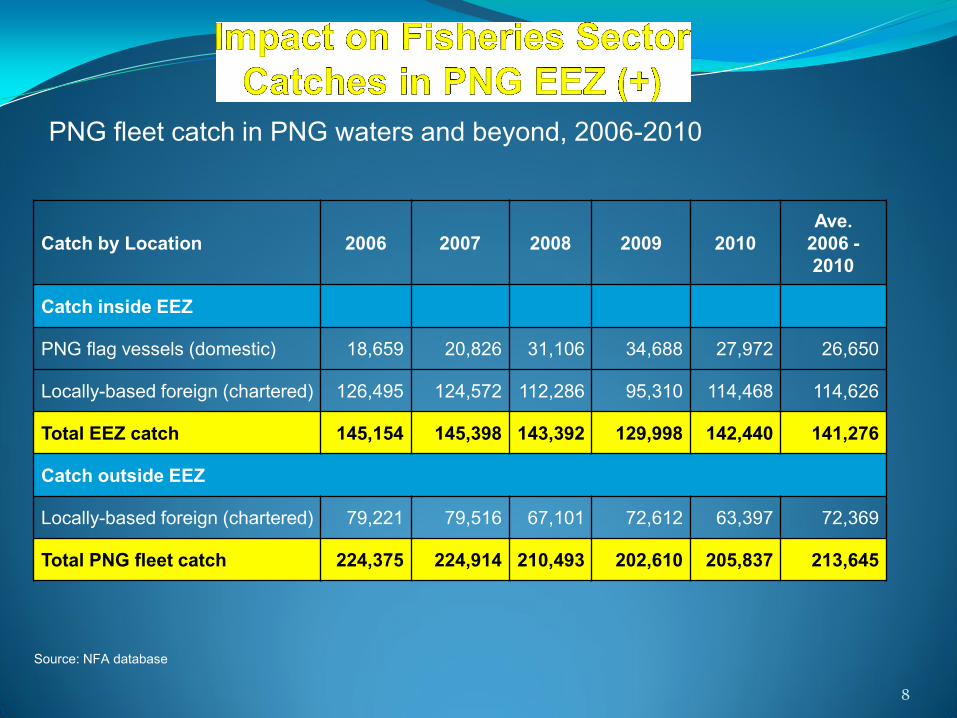
PNG fleet catch in PNG waters and beyond, 2006-2010
Catch by Location 2006 2007 2008 2009 2010
Ave.
2006 -
2010
Catch inside EEZ
PNG flag vessels (domestic) 18,659 20,826 31,106 34,688 27,972 26,650
Locally-based foreign (chartered) 126,495 124,572 112,286 95,310 114,468 114,626
Total EEZ catch 145,154 145,398 143,392 129,998 142,440 141,276
Catch outside EEZ
Locally-based foreign (chartered) 79,221 79,516 67,101 72,612 63,397 72,369
Total PNG fleet catch 224,375 224,914 210,493 202,610 205,837 213,645
Source: NFA database
8

Catch in PNG archipelagic waters (mt), 2006-2010
Fishing Fleet 2006 2007 2008 2009 2010
Ave.
2006-
2010
PNG-flag (domestic) in AW 18,659 20,826 31,106 34,688 27,972 26,650
Locally-based foreign (chartered) catch in
AW 32,125 49,204 53,711 64,947 53,549 51,644
Total archipelagic waters catch
(mt) 50,784 70,030 84,817 99,635 81,521 77,357
PNG domestic fleet catch as % AW catch 37% 30% 37% 35% 34% 34%
AW catch as % of total EEZ catch 11% 15% 17% 23% 12% 16%
Source: NFA & SPC database
9

General Trend
Steady increase in vessel number licensed to fish in PNG waters
Specific Trend
PNG Flagged Vessel
- increase by 3 vessels since 2008, catches have not increased
significantly as well (total = 12)
Locally based Foreign Vessels
- increase in 6 vessels since 2008, total catch remain stable since
2008, but likely to increase due to new onshore devt (total = 39)
Foreign/Bilateral Access
- sharp increase by 48 vessels (total = 176), thus catch increased
substantially in PNG EEZ (largely due to relocation of effort from the
HSP closure)
US Fleet – increase in vessels (frm 12 in 2004 – 40 current) and catch 10

Existing Onshore Processing Facilities
Investment
Project
Product type Max. Prod’n
Capacity
(mt/day)
Current
Prod’n
(mt/day)
Estimated
Investment
Value
(USD’m)
Employment (est.)
Direct Indirect
RD Tuna
Canners
Canned tuna 200 120 3280 7500
Frabelle (PNG)
Ltd
Canned tuna 120 80 2061 5625
South Seas
Tuna
Corporation
Cooked loins,
canned tuna
200 80 1370 4875
Through put
(raw materials/
annum)
130,000 70,000
Total Existing
Production
520
280
7,200
18,000
Source: NFA data
From 2008-2011, global sourcing has had little influence on growth of PNG’s existing tuna
processing facilities, given production levels have generally remained constant and well below
capacity 11
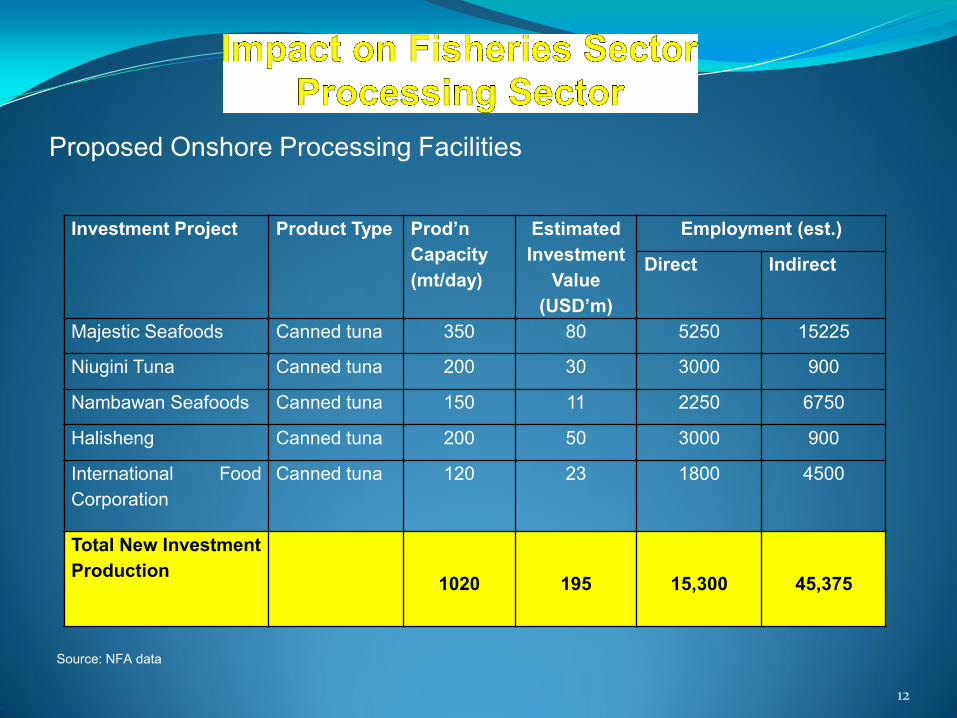
Proposed Onshore Processing Facilities
Investment Project Product Type Prod’n
Capacity
(mt/day)
Estimated
Investment
Value
(USD’m)
Employment (est.)
Direct Indirect
Majestic Seafoods Canned tuna 350 80 5250 15225
Niugini Tuna Canned tuna 200 30 3000 900
Nambawan Seafoods Canned tuna 150 11 2250 6750
Halisheng Canned tuna 200 50 3000 900
International Food
Corporation
Canned tuna 120 23 1800 4500
Total New Investment
Production
1020
195
15,300
45,375
Source: NFA data
12

Advantages & Disadvantages
Advantages Disadvantages
Highly productive waters
abundant canning-grade tuna resources;
accounting for 50 % of total PNA catch, 20 % of
total WCPO catch, and 11 % of global catch in
2009.
Labour
relatively high minimum wage rate (K2.29/h), low
efficiency levels, high absenteeism (20-30%) and
high turnover rates (50-60%)
Close proximity to fishing grounds
savings in freight costs are enjoyed for raw material
delivery (i.e. the cost of transshipping raw material
from vessels operating in WCPO waters to
Thailand-based processors is around US $150-
200/mt).
Freight
very expensive sea freight costs due to relatively
low freight volumes and a limited number of freight
service providers in PNG.
•PNG - EU: US $2,800/20ft. container (dry)
•Philippines - EU: US $1,200/20ft. container (dry)
•Thailand - EU: US $ 1,300/20ft. container (dry)
•Ecuador - EU: US $1,700-2,000/20 ft. container
(dry)
Fishing licenses
Discounted in association with onshore processing
facilities.
Potential to qualify for licenses under the FSM
Arrangement
Utilities
water & power high costs, inconsistent supplies
Infrastructure – poor roads, wharfs
Lack of Economies of Scale
13
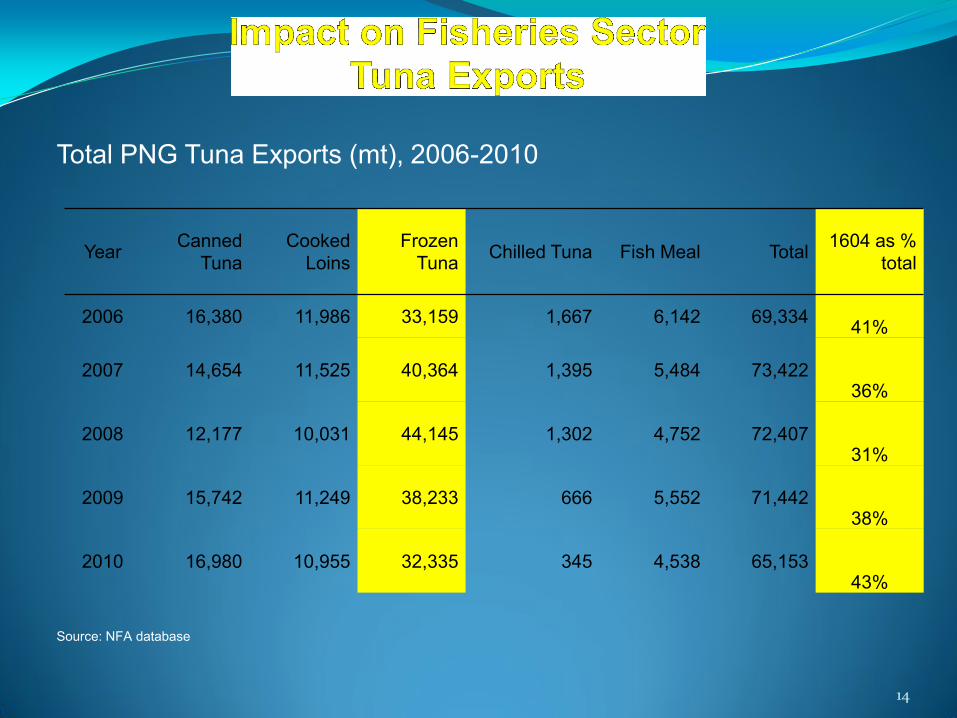
Total PNG Tuna Exports (mt), 2006-2010
Year Canned
Tuna
Cooked
Loins
Frozen
Tuna Chilled Tuna Fish Meal Total
1604 as %
total
2006 16,380 11,986 33,159 1,667 6,142 69,334 41%
2007 14,654 11,525 40,364 1,395 5,484 73,422 36%
2008 12,177 10,031 44,145 1,302 4,752 72,407 31%
2009 15,742 11,249 38,233 666 5,552 71,442 38%
2010 16,980 10,955 32,335 345 4,538 65,153 43%
Source: NFA database
14

PNG Exports of Canned Tuna and Cooked Loins (HS 1604) to EU,
2005-2010
Source: NFA database 15
Year
Canned Tuna Cooked Loins Total
Volume (mt) Value (USD) Volume (mt) Value (USD) Volume (mt) Value (USD)
2005 15,384 40,627,292 551 1,781,798 15,935 42,409,090
2006 15,476 40,747,005 1,387 4,276,414 16,862 45,023,419
2007 12,502 35,205,000 1,075 4,338,848 13,577 39,543,849
2008 10,266 43,164,868 616 3,809,687 10,882 46,974,555
2009 15,530 49,247,135 1,222 5,004,346 16,752 54,251,481
2010 16,743 52,220,902 1,684 7,996,178 18,427 60,217,080
2011 11,353 45,531,556 5,178 11,076,565 16,532 56,608,121

Stock Status in WCPO
Source: SPC, 2010 16
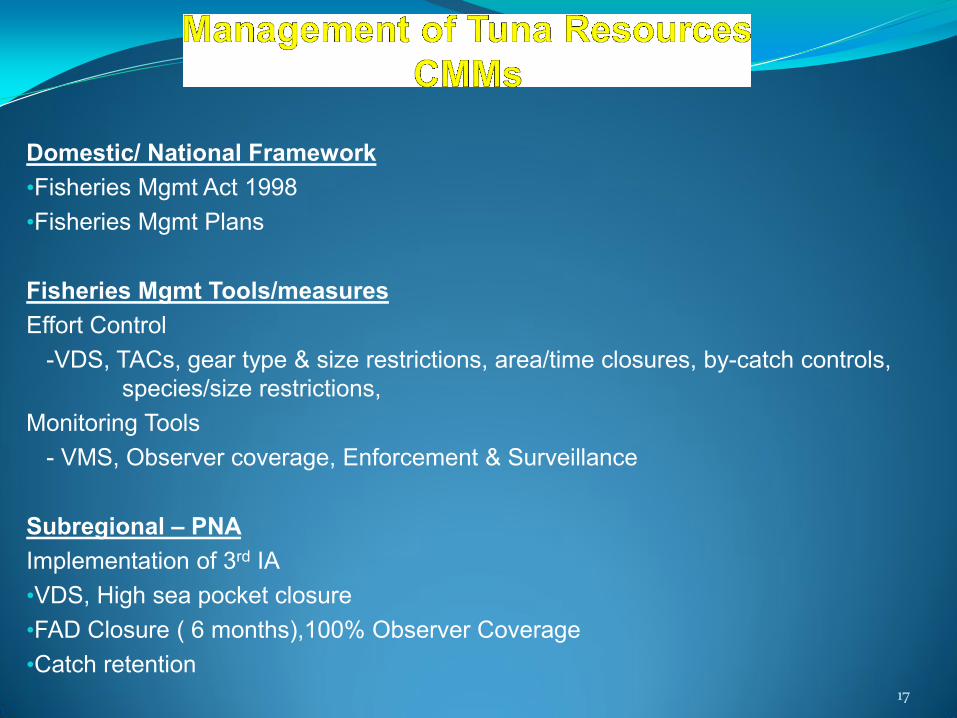
Domestic/ National Framework
•Fisheries Mgmt Act 1998
•Fisheries Mgmt Plans
Fisheries Mgmt Tools/measures
Effort Control
-VDS, TACs, gear type & size restrictions, area/time closures, by-catch controls,
species/size restrictions,
Monitoring Tools
- VMS, Observer coverage, Enforcement & Surveillance
Subregional – PNA
Implementation of 3rd IA
•VDS, High sea pocket closure
•FAD Closure ( 6 months),100% Observer Coverage
•Catch retention
17

Subregional
FFA – minimum terms & conditions
SPC – scientific service provider
Regional – WCPFC
CMM 2008/01 – main thrust in the reduction of bigeye fishing effort, includes
2-3 month prohibition on purse seine sets on FADs
Closure of two high seas pockets (HSP) to purse seine fishing. + EHS Areas
Restricting purse seine effort to 2001-2004 levels (VDS)
Reduction of longline bigeye catch by 30% by the end of 2011.
Some restrictions on other bigeye catches to 2001-2004 levels. (intro. LL VDS)
Changes in stock status since RoO derogation
The status of the three major stocks of interest to the purse seine fishery has
shown little change post-derogation, with one stock (bigeye) continuing to be
subject to overfishing, as it has been for a decade, despite the intent of the
primary management measure (CMM 2008-01) (GS Study) 18

Source: SPC database, 2010
0
400,000
800,000
1,200,000
1,600,000
2,000,000
2,400,000
2,800,000
1960
1962
1964
1966
1968
1970
1972
1974
1976
1978
1980
1982
1984
1986
1988
1990
1992
1994
1996
1998
2000
2002
2004
2006
2008
Ca
tch
(m
t)
PURSE SEINE
OTHER
POLE-AND-LINE
LONGLINE
19

IUU fishing is a global phenomena with substantial & growing negative social, economic &
environmental impacts. Available evidence suggest extent of IUU fishing in WCPFC is
limited (no vessels of IUU on list).
National MSC Capabilities
Observers (over 200 well trained observers, achieving 100% purse seine coverage).
VMS (sophisticated system with full coverage of licensed vessels; system to become
web-based; also used to validate fishing days under the VDS).
Logsheets and licensing (high compliance by licensed fishing vessels).
Port state controls (FVFODF, landing verification of domestic vessels).
Port inspection/sampling (tuna vessels sampled in main ports for size, species
composition).
Steps/measures in response to EU IUU Reg. EU IUU 1005/2008 and EU 1010/2009
Freezer Vessel Fish Origin Declaration Form (FVFODF) (complements Catch
Certification Scheme)
Catch Certification Checklist ( verification & validation of information)
Training & Awareness
Port Offices (Lae, Madang, Wewak, Rabaul, POM)
There is little evidence of IUU tuna fishing in PNG waters.
20
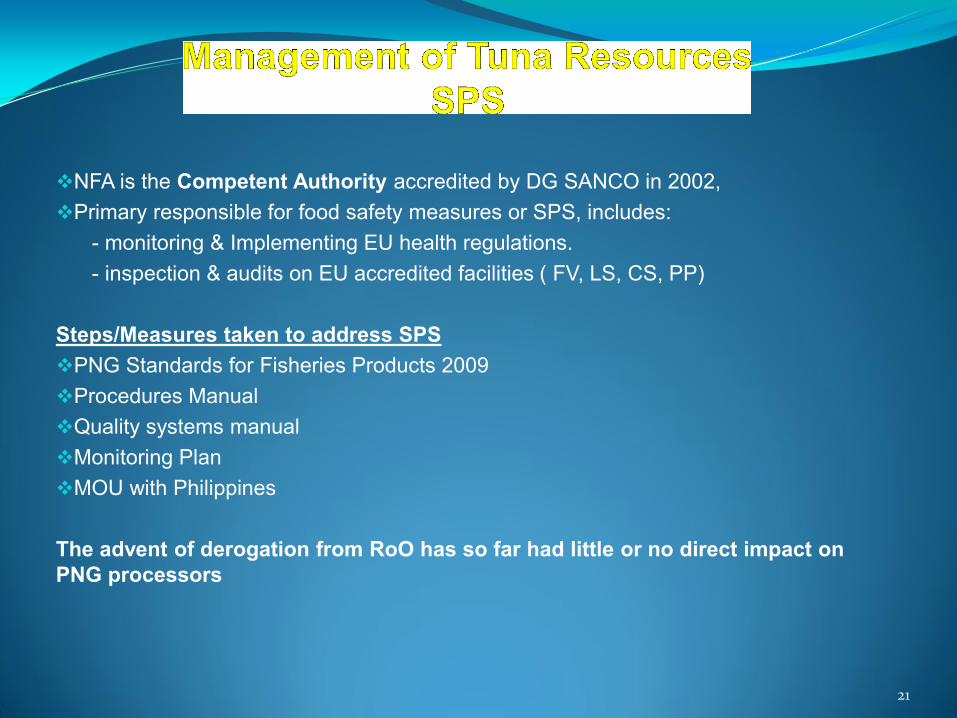
NFA is the Competent Authority accredited by DG SANCO in 2002,
Primary responsible for food safety measures or SPS, includes:
- monitoring & Implementing EU health regulations.
- inspection & audits on EU accredited facilities ( FV, LS, CS, PP)
Steps/Measures taken to address SPS
PNG Standards for Fisheries Products 2009
Procedures Manual
Quality systems manual
Monitoring Plan
MOU with Philippines
The advent of derogation from RoO has so far had little or no direct impact on
PNG processors
21

Can be demonstrated that existing processing facilities are generally compliant with international
standards
Are making improvements through third-party accreditation under private social standard systems
Increasing competition for labour as processing capacity expands will likely lead to additional benefits ad
more favorable pay conditions being offered
A range of environmental risks associated with processing plants especially waste management
Government environmental regulatory structure and statutory requirements in place;
no processing facility prosecuted as yet
Facilities generally have stringent WMPs in place
Some complaints lodged, almost all in Madang, but most remain unproven; State of the Lagoon report
awaited
Management of broader social and environmental issues requires coordinated effort amongst
processing facilities, national and provincial governments, local communities and concerned
22
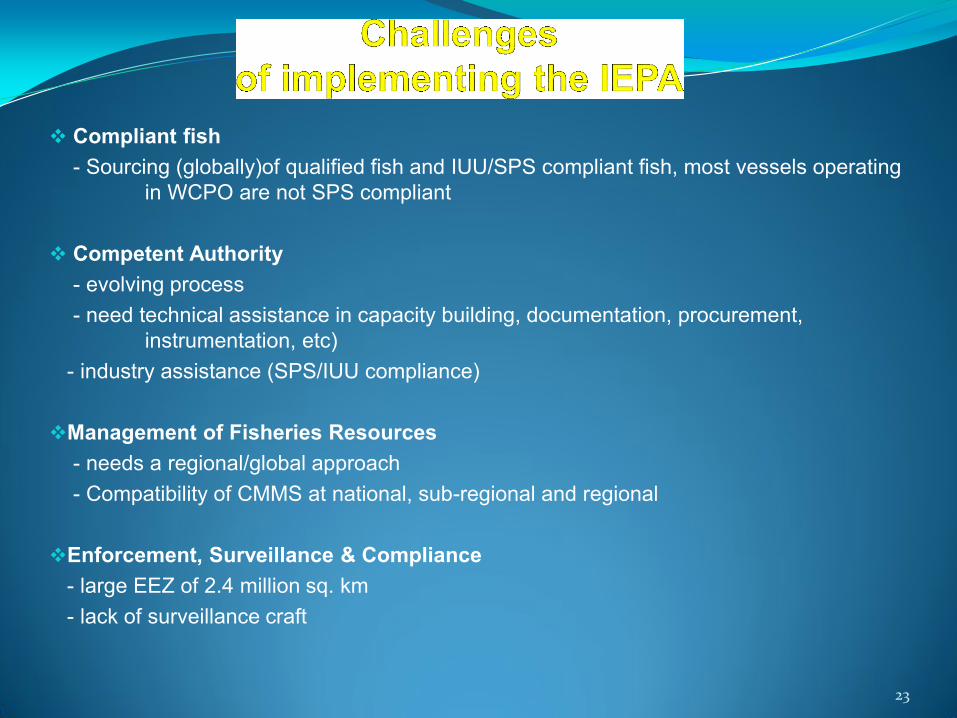
Compliant fish
- Sourcing (globally)of qualified fish and IUU/SPS compliant fish, most vessels operating
in WCPO are not SPS compliant
Competent Authority
- evolving process
- need technical assistance in capacity building, documentation, procurement,
instrumentation, etc)
- industry assistance (SPS/IUU compliance)
Management of Fisheries Resources
- needs a regional/global approach
- Compatibility of CMMS at national, sub-regional and regional
Enforcement, Surveillance & Compliance
- large EEZ of 2.4 million sq. km
- lack of surveillance craft
23
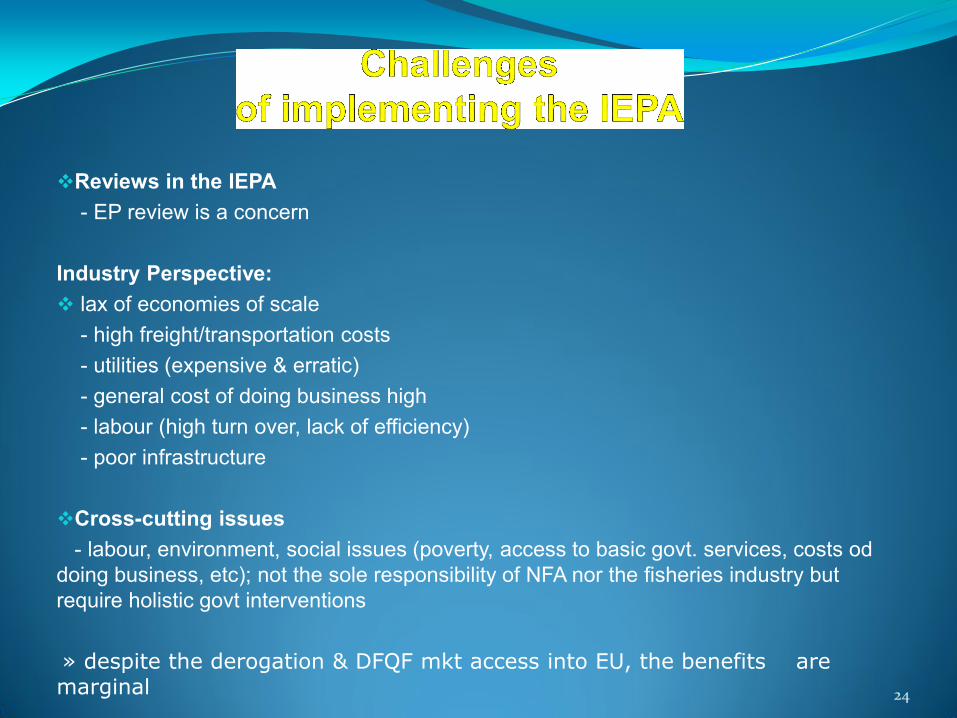
Reviews in the IEPA
- EP review is a concern
Industry Perspective:
lax of economies of scale
- high freight/transportation costs
- utilities (expensive & erratic)
- general cost of doing business high
- labour (high turn over, lack of efficiency)
- poor infrastructure
Cross-cutting issues
- labour, environment, social issues (poverty, access to basic govt. services, costs od
doing business, etc); not the sole responsibility of NFA nor the fisheries industry but
require holistic govt interventions
» despite the derogation & DFQF mkt access into EU, the benefits are marginal 24

Little impact of global sourcing so far, in the 3 yrs since 2008 but expected to
increase as planned processing plants come on stream
Impacts on the economy ; labour and environmental – no evidence of negative
impact or contravention of international standards
Global Sourcing derogation is ONE of the many factors contributing to this
anticipated growth ( highly productive waters, close proximity, etc)
25

Question & Answers
Thank you!
26