a ijpss volume 2, issue 8 issn: 2249-5894 2012 doc/ijpss_august2012/ijmra-pss1546.pdfijpss volume 2,...
TRANSCRIPT

IJPSS Volume 2, Issue 8 ISSN: 2249-5894 _________________________________________________________
A Monthly Double-Blind Peer Reviewed Refereed Open Access International e-Journal - Included in the International Serial Directories Indexed & Listed at: Ulrich's Periodicals Directory ©, U.S.A., Open J-Gage, India as well as in Cabell’s Directories of Publishing Opportunities, U.S.A.
International Journal of Physical and Social Sciences http://www.ijmra.us
227
August 2012
Status of Food Insecurity at Household
Level in Rural India: A Case Study of
Uttar Pradesh
Mushir Ali*
Hifzur Rehman**
S. Murshid Husain***
__________________________________________________________
Abstract:
Food insecurity exists when people are undernourished as a result of the physical unavailability of
food, their lack of social or economic access to adequate food, and inadequate food utilization. It
may be happened at, individual, household, and regional levels Present study was conducted in
rural masses of Shahjahanpur district to ascertain the situation of calorie intake and to identify
number of food insecure people at household level, and to analyze the factors responsible for food
insecurity at household level. The data were collected through field surveys of 480 households
from four villages. Food insecure households account 6.67 per cent and 25 per cent households
have access of food less than 1890 and 2400 calories per person a day, 10 per cent of households
have the access to safe drinking, and more than 26 per cent households were identified without
proper toilets. In spite of having BPL and APL cards, above 20 per cent card holders do not get
any food commodity from PDS. Majority of households have the monthly income of less than Rs.
3000. At least 32 per cent households were without holding, and more than 22 per cent
* Assistant Professor, Department of Geography and Environmental Studies, Mekelle University,
Mekelle, Ethiopia
** Professor, Department of Geography, Aligarh Muslim University, Aligarh, India.
*** Head Department of Geography, GF (PG) College Shahjahanpur, India.

IJPSS Volume 2, Issue 8 ISSN: 2249-5894 _________________________________________________________
A Monthly Double-Blind Peer Reviewed Refereed Open Access International e-Journal - Included in the International Serial Directories Indexed & Listed at: Ulrich's Periodicals Directory ©, U.S.A., Open J-Gage, India as well as in Cabell’s Directories of Publishing Opportunities, U.S.A.
International Journal of Physical and Social Sciences http://www.ijmra.us
228
August 2012
households live without keeping livestock. Majority of households belong to backward and
scheduled castes and landless or marginal category of farmers and have low income with poor
purchasing that leads to improper accessibility, stability and absorption of food.
Key words: Calorie intake, drinking water, households, landless and marginal farmers
Introduction
The food insecurity is a gigantic problem in front of the world population. In spite of
the reaching horizon of economic development, people are struggling for the survival of their
daily life (Ali, 2009) as at least 25,000 die people every day due lack of proper diets. Nearly 852
million people in the world are victims of vicious cycle of maturation and chronic hunger. It was
a period of last 30 years when 70 per cent enhance was in the world population, world agriculture
produced 17 per cent more calories per person today. (FAO, 2002, 2006). At the global level 33
countries have been recognized most vulnerable where the undernourishment prevalence rate is
over 35 per cent. Over 60 per cent of the world's undernourished people live in Asia, and a quarter
in Africa. The South Asian region is home to more chronically food insecure people than any
other region in the world. Poverty is the main cause of food insecurity and hunger. Poor people in
the world do not have sufficient land to grow, or to purchase enough food (FAO, 2006, Roa,
2005).
India ranks 94th in the Global Hunger Index of 119 countries and there is paradoxical
situation in endemic mass-hunger coexisting with the mounting foodgrain stocks. The stocks
available with the Food Corporation of India (FCI) stand at an all time high of 62 million tonnes
against an annual requirement of around 20 million tonnes for ensuring food security. Still, about
200 million people are underfed and 50 million on the brink of starvation, resulting in starvation
deaths. The paradox lies in the inherent flaws in the existing policy and implementation
bottlenecks (Goyal, 2002).
The proportion the rural population consuming less than 2,400 calories per day has fallen
in many states where poor are especially more vulnerable because they expanses their income
mainly for foods. Most states have witnessed a declining poverty ratio but increased calorie
deprivation. Swaminathan (2000) argues that on average 44 per cent of households are deficient
IJPSS Volume 2, Issue 8 ISSN: 2249-5894 _________________________________________________________
A Monthly Double-Blind Peer Reviewed Refereed Open Access International e-Journal - Included in the International Serial Directories Indexed & Listed at: Ulrich's Periodicals Directory ©, U.S.A., Open J-Gage, India as well as in Cabell’s Directories of Publishing Opportunities, U.S.A.
International Journal of Physical and Social Sciences http://www.ijmra.us
229
August 2012
in calorie intake while malnutrition among women and children is higher. Bhandari and Dubey
(2001) arrived at a similar conclusion and argued that the poverty line be recalculated on the basis
of calorie requirements. Rising food prices may have caused poorer households to adopt less
nutritious diets (Chakraborty, 2005). According to World Food Programme that rise of prices 87
per cent for foodgrains, 58 per cent for diary products, and 46 per cent for rice created a crisis
situation which threatens to plunge more than 100 million people on every continent into hunger
is called silent tsunami (WFP, 2008). A number of countries have been facing riots for food. Even
farmers are the producers of foodgrains but are selling their wives into flesh trade to survive a few
more days of living with that two-meal a day life (CNN-IBN, 2009).
Hunger, and the malnourishment that accompanies it prevents poor people from escaping
poverty because it diminishes their ability to learn, work, and care for themselves and their family
members. Food insecurity exists when people are undernourished as a result of the physical
unavailability of food, their lack of social or economic access to adequate food, and inadequate
food utilization. It may be happened at, individual, household, and regional levels (Masud, 2009,
MSSRF, 2003, Roa and Deshpande, 2002; Swaminathan, 1988). However According to FAO
food insecurity exists when all people, at all times, do not have physical and economic access to
sufficient, safe and nutritious food to meet their dietary needs and nutritious and preferences for
an active and healthy life (FAO, 1996). In other words food insecurity has limited or uncertain
availability of nutritionally adequate and safe foods or limited or uncertain ability to acquire
acceptable foods in socially acceptable ways. Hunger is potential consequences of food security
and, is defined as an uneasy or painful sensation caused by lack of food (Drezee and Sen, 2008).
The food insecurity is may occurs of two types, transitory and chronic. The transitory food
insecurity may occur due to natural clematises and anthropogenic factors such as flood, drought,
earthquake, war, riots, erosion of income sources, price rise and so on. The chronic (hidden) food
insecurity refers to a situation in which people consistently consume diets inadequate in calories
generally by women, children (particularly scheduled tribes, and scheduled castes) in rural masses
(MSSRF, 2003), and referred to Chronic Energy Deficiency (CED). If an adult man takes caloric
intake less than 1890 calories in a day for longtime, he may be a victim of chronic food insecurity
(Chakravarity and Dand, 2006). Food insecurity is responsible for poor health. Ayres and
McCalla (1996) have concluded in their study, that nearly 75 per cent of poor and undernourished
people live in rural areas where food itself is produced.
IJPSS Volume 2, Issue 8 ISSN: 2249-5894 _________________________________________________________
A Monthly Double-Blind Peer Reviewed Refereed Open Access International e-Journal - Included in the International Serial Directories Indexed & Listed at: Ulrich's Periodicals Directory ©, U.S.A., Open J-Gage, India as well as in Cabell’s Directories of Publishing Opportunities, U.S.A.
International Journal of Physical and Social Sciences http://www.ijmra.us
230
August 2012
Objectives
Keeping in view the importance of food insecurity as a problem, the study was
conducted, which has following objectives:
i) To ascertain the situation of calorie intake and to identify number of food insecure people at
household level, and
ii) To analyze the factors responsible for food insecurity at household level.
Data and Methodology
The study is based on the primary source of data which were collected through field
surveys during the period of 2006-07. Eight villages from the district of Shahjahanpur were
selected at least two from each tahsil, a subdivision of the district. Considering on stratified
random sampling basis a number 480 households were approached, 60 households from each
village were selected with help of a direct questionnaire-respondent method.
To be food secure, four dimensions are needed as food availability, food accessibility,
food stability and food utilization/absorption. Food availability refers to supply of food that is
fulfilled with production/market/PDS, accessibility is related to income and purchasing power,
and utilization (absorption) requires good health and sanitation facilities. These dimensions are
affected with size of landholdings, PDS, income, drinking water, housing and sanitation
conditions and castes. Therefore, the samples of households were stratified based on castes, size
of landholdings, income, drinking water, housing and sanitation conditions.
The Study Area
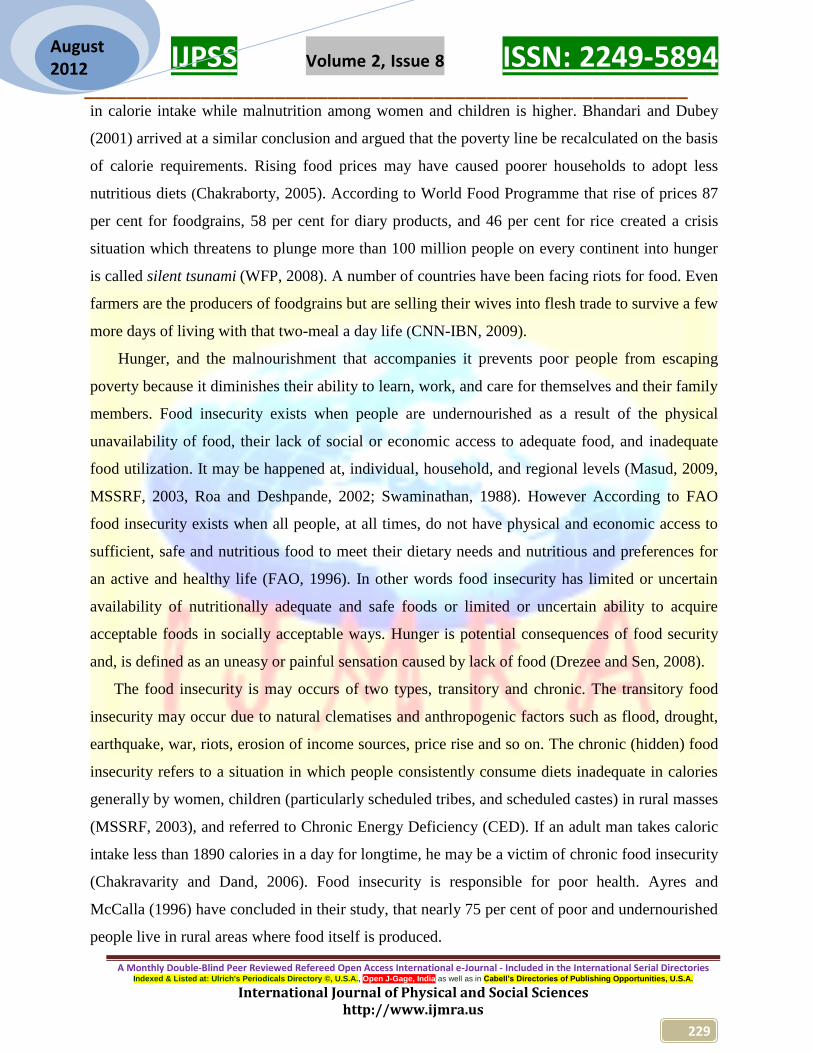
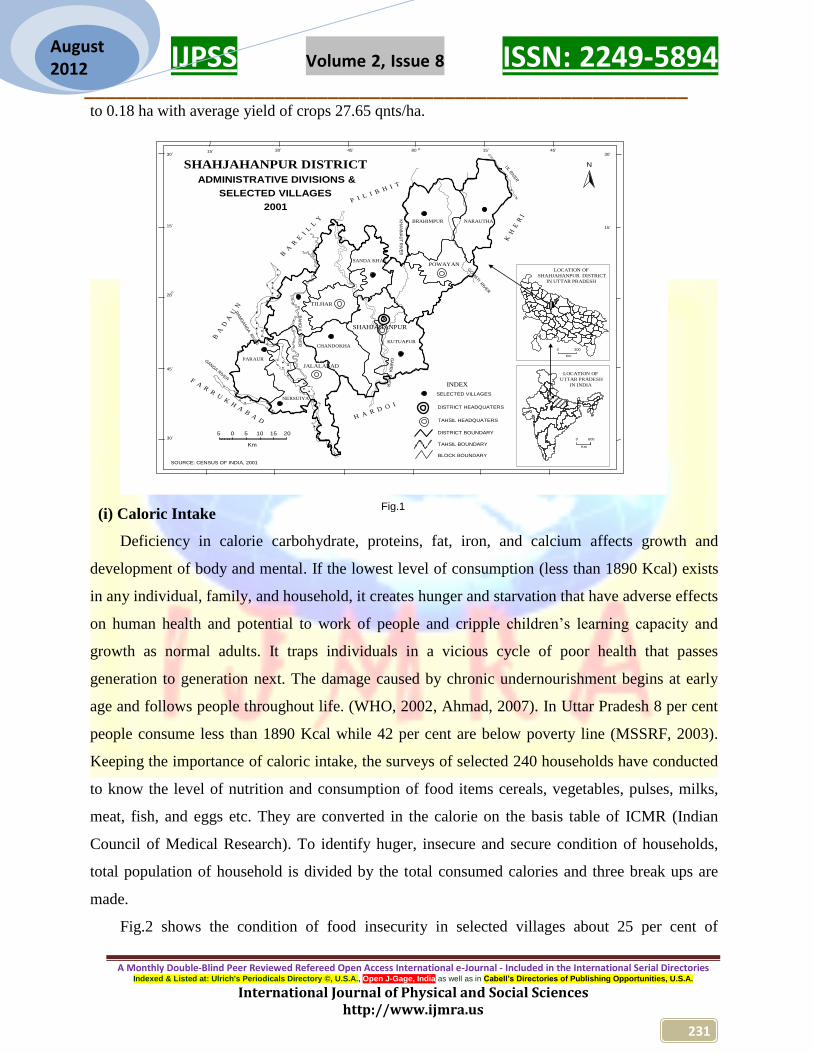
The Shahjahanpur district is situated in a tract which lies between the Ganga and
foothills of the Himalayas and forms a part of Uttar Pradesh. The district has divided into 5
natural divisions, of the order of the tarai forest belt, the Gomti basin, the central bangar lands,
the Ramganga khaddar lands. It covers an area of 4575 sq km with a total population of 2.54
million. For administrative purposes it is divided into 4 tahsils, 14 development blocks, 11 urban
centres, and 2,080 villages. There are 1378 PDS shops and per capita availability of land amounts
IJPSS Volume 2, Issue 8 ISSN: 2249-5894 _________________________________________________________
A Monthly Double-Blind Peer Reviewed Refereed Open Access International e-Journal - Included in the International Serial Directories Indexed & Listed at: Ulrich's Periodicals Directory ©, U.S.A., Open J-Gage, India as well as in Cabell’s Directories of Publishing Opportunities, U.S.A.
International Journal of Physical and Social Sciences http://www.ijmra.us
231
August 2012
to 0.18 ha with average yield of crops 27.65 qnts/ha.
N
SOURCE: CENSUS OF INDIA, 2001
15’
15’ 15’
15’
30’
30’30’
45’45’ 80 O
O28
45’
30’
LOCATION OF
UTTAR PRADESH
IN INDIA
Km
6000
LOCATION OF
SHAHJAHANPUR DISTRICT
IN UTTAR PRADESH
3000
Km
UL R
IVER
5 0 5 10 15 20
SHAHJAHANPUR DISTRICT
ADMINISTRATIVE DIVISIONS &
SELECTED VILLAGES
2001
DISTRICT HEADQUATERS
TAHSIL HEADQUATERS
SELECTED VILLAGES
DISTRICT BOUNDARY
TAHSIL BOUNDARY
BLOCK BOUNDARY
INDEX
POWAYAN
NARAUTHABRAHIMPUR
SANDA KHAS
TILHAR
SHAHJAHANPUR
CHANDOKHAKUTUAPUR
JALALABAD
NERSUIYA
PARAUR
RA
MG
AN
GA
RIV
ER
GAN
GA R
IVER
GO
MATI R
IVER
BA
HG
UL
RIV
ER
KH
AN
NA
UT
RIV
ER
GA
RR
A R
IVE
R
B A
R E
I L
L Y
P I L I
B H I T
K H
E R
I
H A R D O I
F A R R U K H A B A D
Km
B A
D A
U N
(i) Caloric Intake
Deficiency in calorie carbohydrate, proteins, fat, iron, and calcium affects growth and
development of body and mental. If the lowest level of consumption (less than 1890 Kcal) exists
in any individual, family, and household, it creates hunger and starvation that have adverse effects
on human health and potential to work of people and cripple children‟s learning capacity and
growth as normal adults. It traps individuals in a vicious cycle of poor health that passes
generation to generation next. The damage caused by chronic undernourishment begins at early
age and follows people throughout life. (WHO, 2002, Ahmad, 2007). In Uttar Pradesh 8 per cent
people consume less than 1890 Kcal while 42 per cent are below poverty line (MSSRF, 2003).
Keeping the importance of caloric intake, the surveys of selected 240 households have conducted
to know the level of nutrition and consumption of food items cereals, vegetables, pulses, milks,
meat, fish, and eggs etc. They are converted in the calorie on the basis table of ICMR (Indian
Council of Medical Research). To identify huger, insecure and secure condition of households,
total population of household is divided by the total consumed calories and three break ups are
made.
Fig.2 shows the condition of food insecurity in selected villages about 25 per cent of
Fig.1

IJPSS Volume 2, Issue 8 ISSN: 2249-5894 _________________________________________________________
A Monthly Double-Blind Peer Reviewed Refereed Open Access International e-Journal - Included in the International Serial Directories Indexed & Listed at: Ulrich's Periodicals Directory ©, U.S.A., Open J-Gage, India as well as in Cabell’s Directories of Publishing Opportunities, U.S.A.
International Journal of Physical and Social Sciences http://www.ijmra.us
232
August 2012
households were food insecure as the people do not get proper diet which is far below to 2400
Kcal. An average of 6.67 per cent households by the category nutritional intake amounts to less
than 1890 Kcal/day. Due to low income and non-availability work, unemployment and limited
sources of income are the main causes of food insecurity in spite of availability and accessibility
to foodgrains. Villages located in less fertile soil tract (Pasricha and Singh, 2005) and in interior
locations have food insecurity which ranges in order of 13.33 per cent (as hungry) and 26.67 per
cent (as insecure) for example, the village of Nersuiya.
#
#
#
#
#
#
#
#
#
80
60
40
20
0
Per
cent
80
60
40
20
0
Per
cent
80
60
40
20
0
Per
cent80
60
40
20
0
Per
cent
80
60
40
20
0
Per
cent
80
60
40
20
0
Per
cent
80
60
40
20
0
Per
cent
80
60
40
20
0
Per
cent
80
60
40
20
0
Per
cent
Brahimpur
Narautha
Sanda Khas
Kutuapur
INDEXNersuiya
Chandokha
Jaitipur
Paraur
Average Caloric Intake per person/Day at household level in total selected Villages
Below 1890
1890-2400
Above 2400
Hungry
Insecure
Secure
Source: Field Surveys, 2006-07
5 0 5 10 15 20
SHAHJAHANPUR DISTRICTFood Insecurity at Household Level
in Selected Villages2006-07
Fig. 2
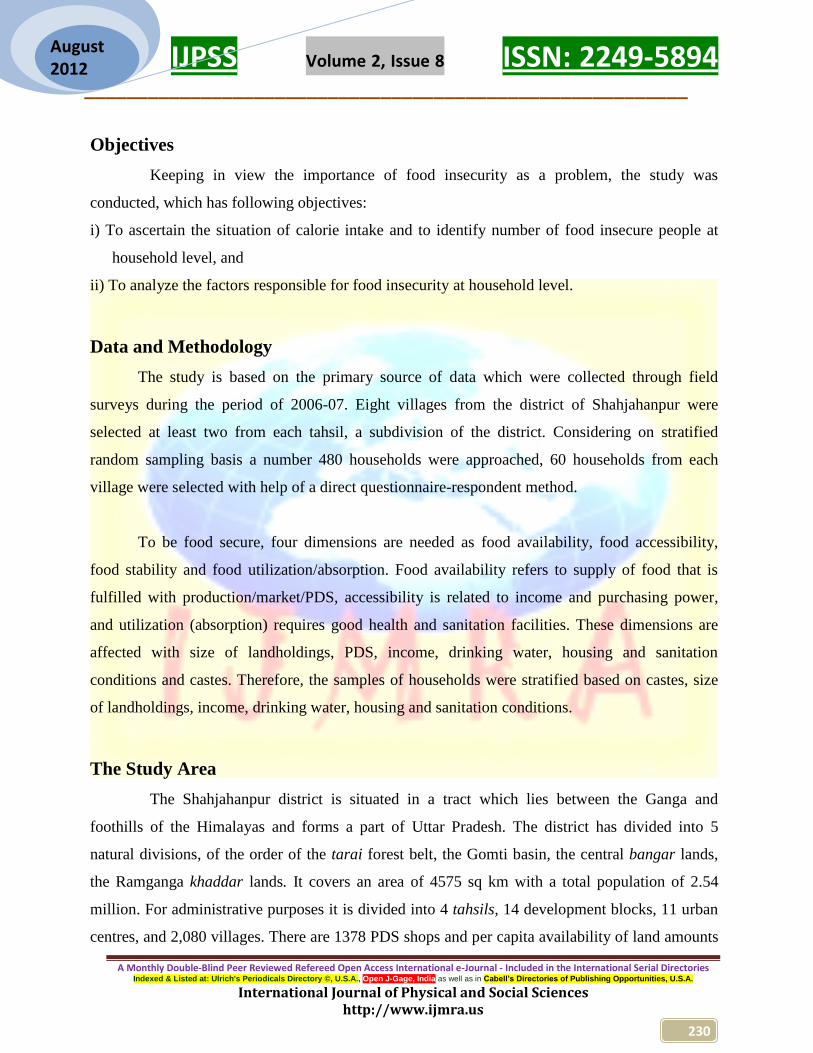
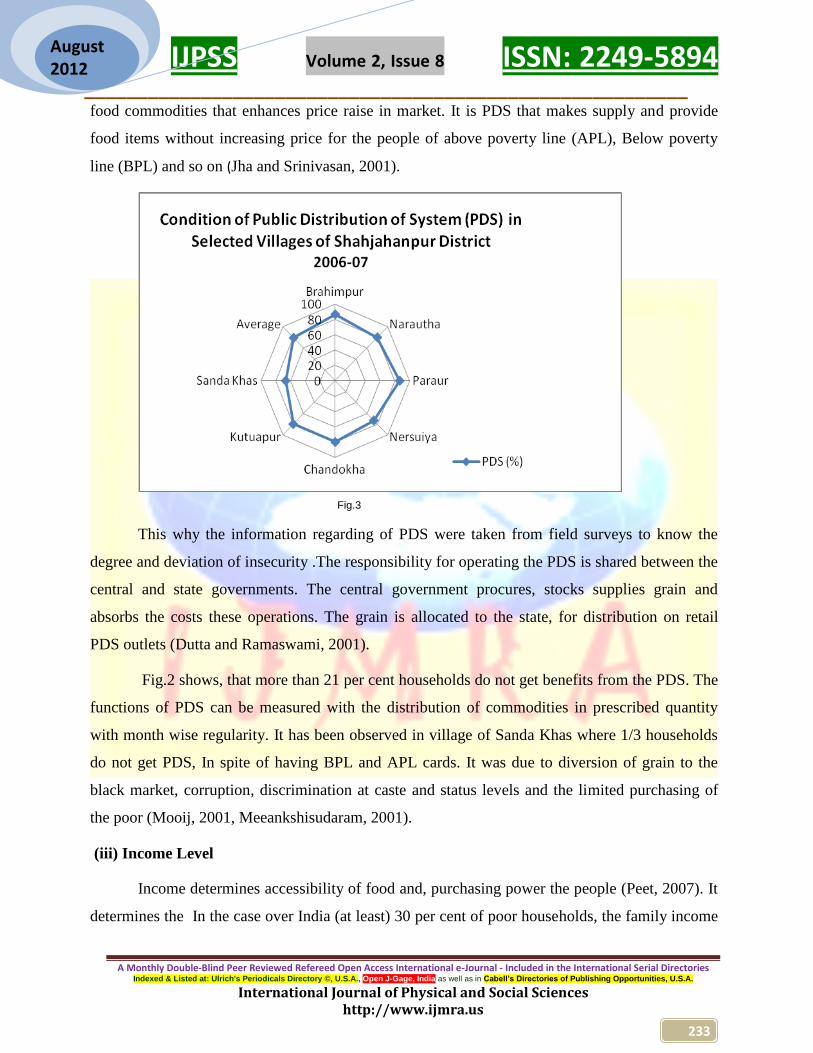
(ii)Public Distribution System (PDS)
PDS is one of the basic essential components of food security as it makes an easy
availability, and accessibility of food at grass root level. It handles 15 per cent total availability of
rice and wheat for reasonable safety of poor. Since a large portion of the population continues to
be poor food security concerns are great importance. Increasing population spreads demand for
IJPSS Volume 2, Issue 8 ISSN: 2249-5894 _________________________________________________________
A Monthly Double-Blind Peer Reviewed Refereed Open Access International e-Journal - Included in the International Serial Directories Indexed & Listed at: Ulrich's Periodicals Directory ©, U.S.A., Open J-Gage, India as well as in Cabell’s Directories of Publishing Opportunities, U.S.A.
International Journal of Physical and Social Sciences http://www.ijmra.us
233
August 2012
food commodities that enhances price raise in market. It is PDS that makes supply and provide
food items without increasing price for the people of above poverty line (APL), Below poverty
line (BPL) and so on (Jha and Srinivasan, 2001).
This why the information regarding of PDS were taken from field surveys to know the
degree and deviation of insecurity .The responsibility for operating the PDS is shared between the
central and state governments. The central government procures, stocks supplies grain and
absorbs the costs these operations. The grain is allocated to the state, for distribution on retail
PDS outlets (Dutta and Ramaswami, 2001).
Fig.2 shows, that more than 21 per cent households do not get benefits from the PDS. The
functions of PDS can be measured with the distribution of commodities in prescribed quantity
with month wise regularity. It has been observed in village of Sanda Khas where 1/3 households
do not get PDS, In spite of having BPL and APL cards. It was due to diversion of grain to the
black market, corruption, discrimination at caste and status levels and the limited purchasing of
the poor (Mooij, 2001, Meeankshisudaram, 2001).
(iii) Income Level
Income determines accessibility of food and, purchasing power the people (Peet, 2007). It
determines the In the case over India (at least) 30 per cent of poor households, the family income
Fig.3
IJPSS Volume 2, Issue 8 ISSN: 2249-5894 _________________________________________________________
A Monthly Double-Blind Peer Reviewed Refereed Open Access International e-Journal - Included in the International Serial Directories Indexed & Listed at: Ulrich's Periodicals Directory ©, U.S.A., Open J-Gage, India as well as in Cabell’s Directories of Publishing Opportunities, U.S.A.
International Journal of Physical and Social Sciences http://www.ijmra.us
234
August 2012
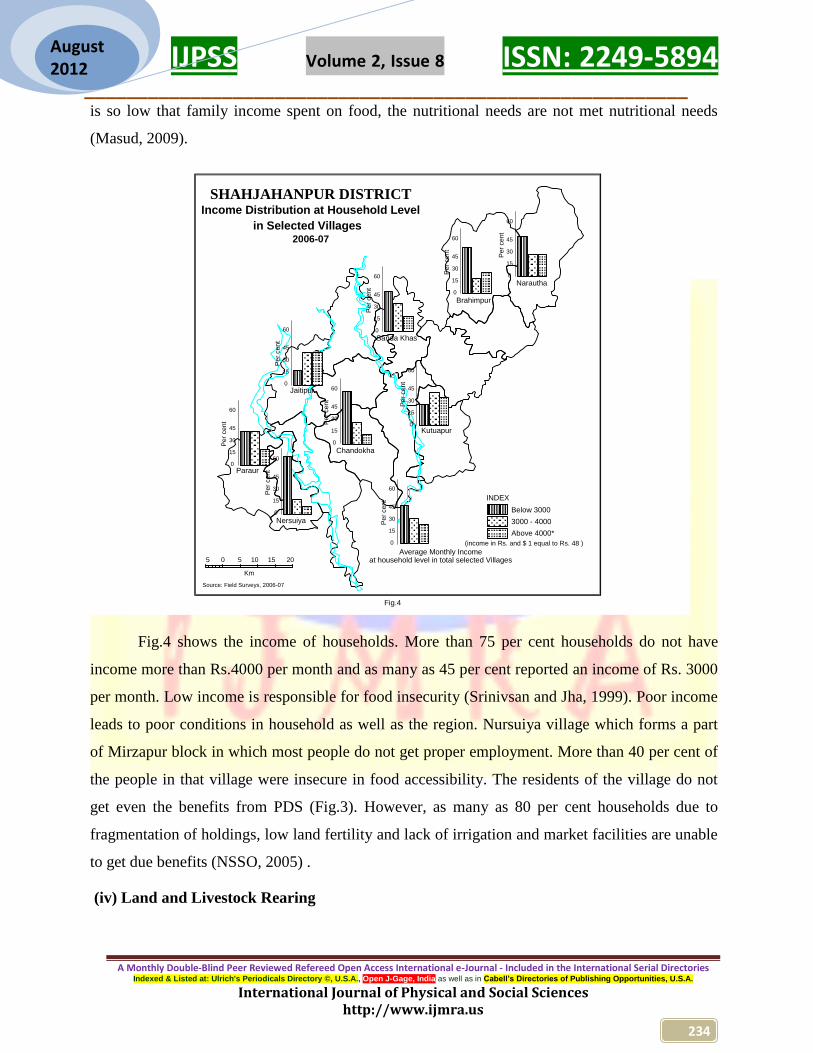
is so low that family income spent on food, the nutritional needs are not met nutritional needs
(Masud, 2009).
#
#
#
#
#
#
#
#
#
Chandokha
Jaitipur
Paraur
Nersuiya
Kutuapur
Narautha
Brahimpur
Sanda Khas
Source: Field Surveys, 2006-07
5 0 5 10 15 20
Km
SHAHJAHANPUR DISTRICTIncome Distribution at Household Level
in Selected Villages2006-07
Average Monthly Income at household level in total selected Villages
Below 3000
3000 - 4000
Above 4000*
(income in Rs. and $ 1 equal to Rs. 48 )
INDEX
Fig.4
60
45
30
15
0
Per
cent
60
45
30
15
0
Per
cent
60
45
30
15
0
Per
cent
60
45
30
15
0
Per
cent
60
45
30
15
0
Per
cent
60
45
30
15
0
Per
cent
60
45
30
15
0
Per
cent
60
45
30
15
0
Per
cent
60
45
30
15
0
Per
cent
Fig.4 shows the income of households. More than 75 per cent households do not have
income more than Rs.4000 per month and as many as 45 per cent reported an income of Rs. 3000
per month. Low income is responsible for food insecurity (Srinivsan and Jha, 1999). Poor income
leads to poor conditions in household as well as the region. Nursuiya village which forms a part
of Mirzapur block in which most people do not get proper employment. More than 40 per cent of
the people in that village were insecure in food accessibility. The residents of the village do not
get even the benefits from PDS (Fig.3). However, as many as 80 per cent households due to
fragmentation of holdings, low land fertility and lack of irrigation and market facilities are unable
to get due benefits (NSSO, 2005) .
(iv) Land and Livestock Rearing
IJPSS Volume 2, Issue 8 ISSN: 2249-5894 _________________________________________________________
A Monthly Double-Blind Peer Reviewed Refereed Open Access International e-Journal - Included in the International Serial Directories Indexed & Listed at: Ulrich's Periodicals Directory ©, U.S.A., Open J-Gage, India as well as in Cabell’s Directories of Publishing Opportunities, U.S.A.
International Journal of Physical and Social Sciences http://www.ijmra.us
235
August 2012
Agriculture and livestock rearing are main occupation of more than 80 per cent cultivators
and livestock rearers (Birthal and Ali, 2005). Rural population has a strong symbiosis for their
income with agriculture and livestock that support the availability and accessibility of foods at
household level. Being effective measurements for food insecurity data of livestock and
agriculture have been collected from the villages
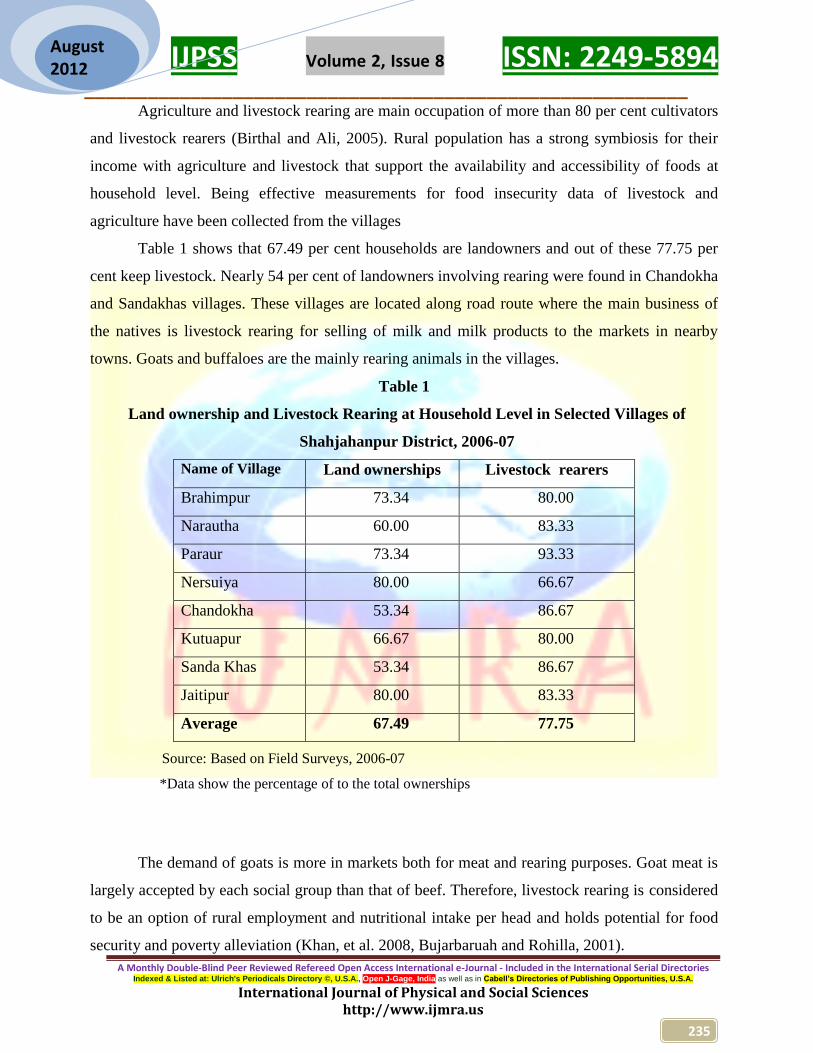
Table 1 shows that 67.49 per cent households are landowners and out of these 77.75 per
cent keep livestock. Nearly 54 per cent of landowners involving rearing were found in Chandokha
and Sandakhas villages. These villages are located along road route where the main business of
the natives is livestock rearing for selling of milk and milk products to the markets in nearby
towns. Goats and buffaloes are the mainly rearing animals in the villages.
Table 1
Land ownership and Livestock Rearing at Household Level in Selected Villages of
Shahjahanpur District, 2006-07
Name of Village Land ownerships Livestock rearers
Brahimpur 73.34 80.00
Narautha 60.00 83.33
Paraur 73.34 93.33
Nersuiya 80.00 66.67
Chandokha 53.34 86.67
Kutuapur 66.67 80.00
Sanda Khas 53.34 86.67
Jaitipur 80.00 83.33
Average 67.49 77.75
Source: Based on Field Surveys, 2006-07
*Data show the percentage of to the total ownerships
The demand of goats is more in markets both for meat and rearing purposes. Goat meat is
largely accepted by each social group than that of beef. Therefore, livestock rearing is considered
to be an option of rural employment and nutritional intake per head and holds potential for food
security and poverty alleviation (Khan, et al. 2008, Bujarbaruah and Rohilla, 2001).
IJPSS Volume 2, Issue 8 ISSN: 2249-5894 _________________________________________________________
A Monthly Double-Blind Peer Reviewed Refereed Open Access International e-Journal - Included in the International Serial Directories Indexed & Listed at: Ulrich's Periodicals Directory ©, U.S.A., Open J-Gage, India as well as in Cabell’s Directories of Publishing Opportunities, U.S.A.
International Journal of Physical and Social Sciences http://www.ijmra.us
236
August 2012
It is depicted from the table that 77.75 per cent households keep livestock for sustenance
and livelihood. The highest proportion of livestock rerears has been noted in Paraur village where
a good numbers of the rearers belong to the social groups (OBC) like Gujjar, Aaheer castes who
are traditional rearer of cattle, buffalo are predominant in the region. A respondent of the village
Paraur told that “Zamina achchi nahin hai, na aur koi rozi roti ke sadhan tahe pashu palat unke
doodh, khad milt, bechan per paisa mil jat hai aur unhe jugle main chugai lewat hai, aur ghar
mai bali-bacca rakh rakhao aasani se kar late hain.” (Land is less fertile surrounding the village
and other sources for employment and livelihood are absent that is why we prefer to rear
livestock. They provide us milk, manure and cash when sold. These livestock are grazed in the
forested areas and can easily be handled by women and children).
(v) Size of Holdings
Agriculture provides 52.1 per cent employment to total employment in the sector per
Current Daily Status (Economic Survey, 2008-09). It is main source for availability of food as
well as generates income and wealth for household food security and to bring about equity in
distribution of, resulting in rapid reduction in poverty levels (Ali, 2009). The total area operated
under all operational holdings in the current census is found that Among the 5 major size classes
of holdings, the marginal holdings (less than 1 ha) account for a maximum share of 48.2 per cent
of the total number of holdings, followed by small holdings (1 to 2 ha) 26.60 per cent, semi-
medium holdings (2 to 4 ha) 16.9 per cent, medium holdings (4 to 10 ha) 7.30 per cent and large
holdings (10 ha and above) 1.0 per cent (Agricultural Census, 2005-06).

IJPSS Volume 2, Issue 8 ISSN: 2249-5894 _________________________________________________________
A Monthly Double-Blind Peer Reviewed Refereed Open Access International e-Journal - Included in the International Serial Directories Indexed & Listed at: Ulrich's Periodicals Directory ©, U.S.A., Open J-Gage, India as well as in Cabell’s Directories of Publishing Opportunities, U.S.A.
International Journal of Physical and Social Sciences http://www.ijmra.us
237
August 2012
#
#
#
#
#
#
#
#
#
Chandokha
Jaitipur
Paraur
Nersuiya
Kutuapur
Narautha
Brahimpur
Sanda Khas
Source: Field Surveys, 2006-07
5 0 5 10 15 20
Km
SHAHJAHANPUR DISTRICTSize of Land Holdings at Household Level
in Selected Villages2006-07
Below 1ha
1 - 2 ha
2 - 4 ha
Above 4ha
Marginal
Small
Semi-Medium
Medium & large
Average size of land holdings at household level in total selected Villages
INDEX
Fig.5
80
60
40
20
0
Per
cent
80
60
40
20
0
Per
cent
80
60
40
20
0
Per
cent
80
60
40
20
0
Per
cent
80
60
40
20
0
Per
cent
80
60
40
20
0
Per
cent
80
60
40
20
0
Per
cent
80
60
40
20
0
Per
cent
80
60
40
20
0
Per
cent
Fig.5 shows that the share of marginal landholders (with less than 1ha. of land) to be 78.33
per cent in total households. It is followed by the category of small farmers (10.83 per cent),
semi-medium farmers (7.5 per cent), and Medium and large farmers (3.33 per cent) respectively.
Marginal farmers have an advantage to get work more than 100 work days on their own fields.
Lean period compel to work them as agricultural labourers to arrange food for their families at all
times. As a result food insecurity is a common phenomenon among them.
(vi) Caste System
The caste system, with its societal stratification and social restrictions continues major
impact on food insecurity of the Indian social set. The system generally identified with Hinduism,
is also prevalent among Christian, Sikhs, and Muslims. While some barriers are broken in urban
settings, many continue to persist in rural India. It is caste that inextricably linked to a proxy for
social-economic status (Jacob, 2009). Working castes now known as backward class (BC) and

IJPSS Volume 2, Issue 8 ISSN: 2249-5894 _________________________________________________________
A Monthly Double-Blind Peer Reviewed Refereed Open Access International e-Journal - Included in the International Serial Directories Indexed & Listed at: Ulrich's Periodicals Directory ©, U.S.A., Open J-Gage, India as well as in Cabell’s Directories of Publishing Opportunities, U.S.A.
International Journal of Physical and Social Sciences http://www.ijmra.us
238
August 2012
scheduled castes (SC) were always poor and considered at bottom in the Verna system1 and were
kept away from opportunities to require food and nutrition. That is why the households belonging
to these castes are more food insecure than that of upper castes (Sarap and Mahamallik, 2001).
#
#
#
#
#
#
#
#
#
Narautha
Brahimpur
Sanda Khas
KutuapurChandokha
Nersuiya
Paraur
Jaitipur
5 0 5 10 15 20
Km
Average Caste distribution at household level in total selected Villages
SHAHJAHANPUR DISTRICTCaste Composition at Household Level
in Selected Villages 2006-07
Source: Field Surveys, 2006-07
Gen
OBC
SC
INDEX
33.33%
33.33%
33.33%
33.33%
33.33%
33.33%
46.67%
46.67%
46.67%
20 %
20 %
20 %
20 %
20 %
46.67%
20 %
26.67 %
26.67 %
26.67 %26.66 %
40 %
13.33 %
60 %
53.33 %
53.33 %
43.34%
23.33%
Fig. 6
Fig. 6 shows that the households belonging to general, OBC and SC categories in the order
of 23.33, 43.33 and 33.33 per cent respectively. Evidently, a high proportion of food insecurity
exists in SC and OBC. The National Family Health Survey-III (2005-06) clearly highlight that the
stunting, wasting, Underweight and anemia in children and anemia in adults are higher among the
lower castes. Moreover, income, education, basic amenities and facilities are poor in households
belonging to general in all households and particularly SC and OBC categories that affect the
access and absorption of food among the people of lower castes (Srinivas, 1994, Jacob, 2009).
(ii) Basic Amenities
1 In Verna system was source of present caste hierarchy in India which divided population into four classes,
Brahmins, Kshatriayas, Vaishays, and, Shudras. It was based on the occupation of the people and the complexion of the skin. In this hierarchical order Brahmans were on the top ranking followed by Kshatriayas, Vaishays, and, Shudras. In due to course of time, it become extremely rigid and high caste people exploit to low caste people.
IJPSS Volume 2, Issue 8 ISSN: 2249-5894 _________________________________________________________
A Monthly Double-Blind Peer Reviewed Refereed Open Access International e-Journal - Included in the International Serial Directories Indexed & Listed at: Ulrich's Periodicals Directory ©, U.S.A., Open J-Gage, India as well as in Cabell’s Directories of Publishing Opportunities, U.S.A.
International Journal of Physical and Social Sciences http://www.ijmra.us
239
August 2012
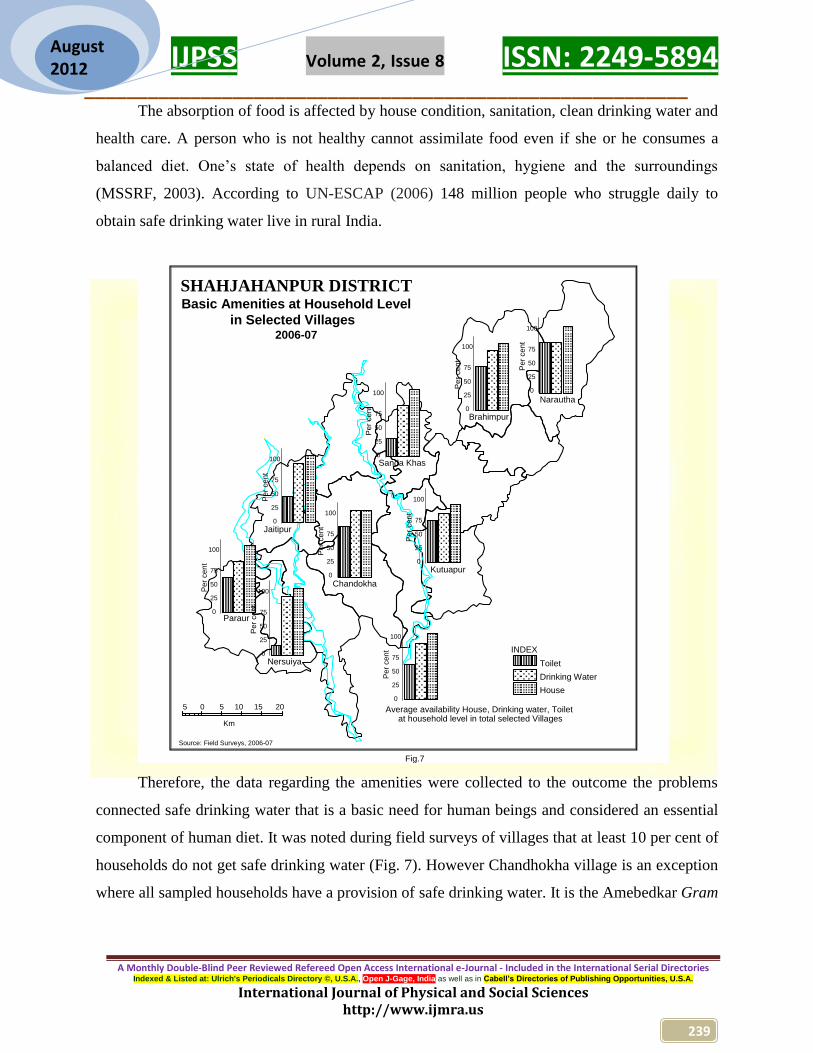
The absorption of food is affected by house condition, sanitation, clean drinking water and
health care. A person who is not healthy cannot assimilate food even if she or he consumes a
balanced diet. One‟s state of health depends on sanitation, hygiene and the surroundings
(MSSRF, 2003). According to UN-ESCAP (2006) 148 million people who struggle daily to
obtain safe drinking water live in rural India.
#
#
#
#
#
#
#
#
#
100
75
50
25
0
Per
cent
Toilet
Drinking Water
House
Average availability House, Drinking water, Toilet at household level in total selected Villages
Chandokha
Jaitipur
Paraur
Nersuiya
Kutuapur
Narautha
Brahimpur
Sanda Khas
Source: Field Surveys, 2006-07
5 0 5 10 15 20
Km
SHAHJAHANPUR DISTRICTBasic Amenities at Household Level
in Selected Villages 2006-07
INDEX
Fig.7
100
75
50
25
0
Per
cent
100
75
50
25
0
Per
cent
100
75
50
25
0
Per
cent
100
75
50
25
0
Per
cent
100
75
50
25
0
Per
cent
100
75
50
25
0
Per
cent
100
75
50
25
0
Per
cent
100
75
50
25
0
Per
cent
Therefore, the data regarding the amenities were collected to the outcome the problems
connected safe drinking water that is a basic need for human beings and considered an essential
component of human diet. It was noted during field surveys of villages that at least 10 per cent of
households do not get safe drinking water (Fig. 7). However Chandhokha village is an exception
where all sampled households have a provision of safe drinking water. It is the Amebedkar Gram
IJPSS Volume 2, Issue 8 ISSN: 2249-5894 _________________________________________________________
A Monthly Double-Blind Peer Reviewed Refereed Open Access International e-Journal - Included in the International Serial Directories Indexed & Listed at: Ulrich's Periodicals Directory ©, U.S.A., Open J-Gage, India as well as in Cabell’s Directories of Publishing Opportunities, U.S.A.
International Journal of Physical and Social Sciences http://www.ijmra.us
240
August 2012
that gets an extra financial assistance from the State Government to develop basic amenities and
facilities to build it as a model village.
Toilet facility in a house is important for the biological cycle that is considered a need for
a civic society (Vyas, 2000). The toilet facilities generally are not satisfactory in the study area,
where more than 26 per cent of households do not have any toilet (Fig.7). The village of
Nersuiya shows that 46.67 per cent of households do not have toilet facilities. It is due to high
concentration of SC and BC population (Census, 2001) and the village located in a backward
block of Mirzapur
The absorption of food is affected by house condition, health care, access of clean water
sanitation, nutrition, education, health care and employment (Sen, 1981, MSSF, 2003). It was
observed that 99.17 per cent of the households owned homes, which are mainly in the form of
huts, kutcha, and semi-pucca dwellings. Kutuapur is the only village along the road near
Sehramau south where all households reported no personal dwellings (Fig. 7).
Conclusion
Food insecure households account 25 per cent among the households in selected villages
with less than 2400 calories per person a day, but for more than 1890 calories the proportion of
hunger comes 6.67 per cent. At least 10 per cent of households have the access to safe drinking,
and more than 26 per cent households were identified without proper toilets. In spite of having
BPL and APL cards, above 20 per cent card holders do not get any food commodity from PDS.
Majority of households reported the monthly income of less than Rs. 3000. At least 32 per cent
households were without holding, and more than 22 per cent households live without keeping
livestock. Proportion of marginal farmers in the total is highest among the landholders, and
majority of households belong to backward and scheduled castes. Many of the holders belong to
lower caste and are either landless or marginal category of farmers and have low income with
poor purchasing that leads to improper accessibility, stability and absorption of food. Resulting in
poor health, and this vicious cycle continue from one generation to another.
IJPSS Volume 2, Issue 8 ISSN: 2249-5894 _________________________________________________________
A Monthly Double-Blind Peer Reviewed Refereed Open Access International e-Journal - Included in the International Serial Directories Indexed & Listed at: Ulrich's Periodicals Directory ©, U.S.A., Open J-Gage, India as well as in Cabell’s Directories of Publishing Opportunities, U.S.A.
International Journal of Physical and Social Sciences http://www.ijmra.us
241
August 2012
There is an urgent need to provide opportunities for work so that, people belonging to low
income can enhance their nutritional intake. However, NREGA is a good step to provide for
employment Rs. 100 per day (to a member a family) for 100 days in a year. A check is needed on
Public Distribution System (PDS) for an effective distribution of essential commodities for poor
and needy persons. However, drinking water, sanitation and health facilities for households are
needed. As the marginal and small farmers constitute the largest chunk in the society so the
livestock rearing should be enhanced to improve employment, nutrition, health, and socio-
economic conditions to minimize food insecurity. Besides, to make food secure farmers, pension
facilities must be provided for them as they are given to workers in organized sectors.
There is need of investments in vital agriculture infrastructure, credit linkages and
encouraging the use of latest techniques, motivate each district/ block to achieve local self-
sufficiency in foodgrain production. However, instead of concentrating only on rice or wheat, the
food crop with a potential in the area must be encouraged. Creation of necessary infrastructure
like irrigation facilities will also simulate private investments for foodgrains production on a
sustainable basis to create massive employment and reduce the incidence of poverty (Goyal,
2002) and purchasing power to the people in rural areas.

IJPSS Volume 2, Issue 8 ISSN: 2249-5894 _________________________________________________________
A Monthly Double-Blind Peer Reviewed Refereed Open Access International e-Journal - Included in the International Serial Directories Indexed & Listed at: Ulrich's Periodicals Directory ©, U.S.A., Open J-Gage, India as well as in Cabell’s Directories of Publishing Opportunities, U.S.A.
International Journal of Physical and Social Sciences http://www.ijmra.us
242
August 2012
References
Agricultural Census (2005-06) http://des.kar.nic.in/arc/highlights1.pdf
Ahmad, S.N. (2007). „Status of Food Security in Koil Tehsil of Aligarh District‟, Indian Journal of
Landscape Systems and Ecological Studies, 30 (1): 67-76.
Ali, M. (2009). Geography of Agricultural Marketing-At Grass Roots Levels, Pacific Publication, Delhi.
Ayres, W.S. and McCalla A.F. (1996). „Rural Development, Agriculture, and Food Security‟, Finance &
Development, December: 8-11.
Bhandari, L. and Dubey, A. (2001). „Calorie Deficiency, Poverty and the Public Distribution System- A
Household Level Analysis for 1993-94‟, RGICS Working Paper (24).
Birthal, P. S. and Ali, J. (2005). Potential of Livestock Sector in Rural Transformation, In: „Rural
Transformation in India: The Role of Non-farm Sector’, R Nayyar and A. N Sharma (eds).,
Manohar Publishers, New Delhi.
Bujarbaruah, K.M. and Rohilla, P.P. (2001). „Role of Livestock in Farming System of NEH Region‟,
Indian Farming, 51 (9): 39-40.
Census, (2001). Primary Census Abstract-State/District-Village Level.
Chakraborty, D. (2005). „Food Security in India Policy challenges and responses‟, RGICS Brief paper Feb
2005.
Chakravarity, S. and Dand, S.A. (2006). „Food Insecurity in Gujrat: A Study of Two Rural Populations‟,
Economic Political Weekly, 41 (22):2248-58.
CNN-IBN (2009). Drought-hit Farmers selling Wives to survive in Bundelkhand
http://johnnydbombay.mid-day.com/note/8329/cnnibn‟s-“face-the-nation”-covers-trivial.html
Drezee, J. and Sen, A. (2008). „Hunger and Public Action‟, Oxford University Press, New Delhi.
Dutta, B.and Ramaswami, B. (2001). „Targeting and Efficiency in the Public Distribution System: Case of
Andhara Pradesh and Maharastra‟, Economic Political Weekly, 36(18):1524-32.
Economic Survey (2008-09) http://indiabudget.nic.in
FAO (2002). „The State of Food insecurity in the World-2001’, Food and Agricultural Organization,
Rome, http://www.fao.org.

IJPSS Volume 2, Issue 8 ISSN: 2249-5894 _________________________________________________________
A Monthly Double-Blind Peer Reviewed Refereed Open Access International e-Journal - Included in the International Serial Directories Indexed & Listed at: Ulrich's Periodicals Directory ©, U.S.A., Open J-Gage, India as well as in Cabell’s Directories of Publishing Opportunities, U.S.A.
International Journal of Physical and Social Sciences http://www.ijmra.us
243
August 2012
FAO, (1996). Food for All, Report by Food and Agricultural Organization on the occasion of the World
Food Summit, 13-17, November.
FAO (2006). „The State of Food Insecurity in the World 2006 Eradicating World Hunger -taking stock ten
years after the World Food Summit, http://www.fao.org
Goyal, P. (2002). Food Security in India, The Hindu, January 10.
Jacob, K.S. (2009). Caste and Inequalities in Health, The Hindu, 132 (200): 10.
Jha, S. and Srinivasan, P.V. (2001). „Taking the PDS to the Poor: Directions for Further Reform‟,
Economic & Political Weekly, 36 (39): 3779-86.
Khan, et al. (2008). „Livestock Revolution in Monsoon Asia during the Post Economic Reform Period‟,
Asian Profile, 36 (5), pp.529-44.
Khullar, D.R. (2006). India: A Comprehensive Geography, Kalyani Publishers, New Delhi.
Masud, K.A. (2009). Adapting to Global Economic Melt down- the case of South Asia, South Asian
Analysis Group, paper No.3352, Aug 12.
Meeankshisudaram, S.S. (2001). Public Distribution System: Safety Net for the Poor, in „Towards Hunger
Free India: Agenda and Imperatives’, M.D. Ashthana, and R. Pedro, (eds), Manohar Publishers,
New Delhi.
Mooij, J.(2001). „Targeted Food Distribution in Karnataka and Bihar‟, ibid Manohar Publishers, New
Delhi.
MSSRF, (2003). Food Insecurity Atlas of Rural India, M S Swaminathan Foundation, Chennai.
National Family Health Survey-III (2005-06). www.nnfhsindia.org.
NSSO (2005). „Situation Assessment Survey of Farmers Households, NSS 59th round (January-December
2003, Report No 498). Government of India.
Pasricha, N.S. and Singh, R. (2005). „Land Degradation and Household Food Security in India‟,
Agricultural Situation in India, Vol. 62 (3):173.
Peet, R. (2007). Geography of Power: Making Global Economic Policy, Zed Books, New York.
Roa, V.M. and Deshpande, R.S. (2002). Food Security in Drought -Prone Areas-A Study in Karnataka.
Economic & Political Weekly (August 31):3677-81.
Roa, C.H.H. (2005). Agriculture Food Security, Poverty and Environment, Oxford University Press, New
Delhi.
IJPSS Volume 2, Issue 8 ISSN: 2249-5894 _________________________________________________________
A Monthly Double-Blind Peer Reviewed Refereed Open Access International e-Journal - Included in the International Serial Directories Indexed & Listed at: Ulrich's Periodicals Directory ©, U.S.A., Open J-Gage, India as well as in Cabell’s Directories of Publishing Opportunities, U.S.A.
International Journal of Physical and Social Sciences http://www.ijmra.us
244
August 2012
Sarap, K. and Mahamallik, M. (2001). Food security, Coping Strategy and Livelihood Pattern among
Households in Tribal Areas of Orissa, in Towards Hunger Free India-Agenda and Imperatives,
M.D. Asthana, and P Medrano (eds.) Manohar Publishers, New Delhi,: 233-267.
Sen, A.K. (1981). Poverty and Famine: An Essay on Entitlement and Deprivation. Oxford University
Press, New Delhi.
Srinivas, M. N. (1994). The Indian village: Myth and reality. In: The Dominant Caste and Other Essays.
Oxford University Press, Oxford
Srinivsan, P.V. and Jha, S. (1999), „Food Security through Price Stabilization‟, Economic & Political
Weekly, 34 (46 & 47):3299-04.
Swaminathan, M. (2000). „Weakening Welfare: The Public Distribution of Food in India‟, Leftword.
Swaminathan, M.S. (1988). Sustainable Food Nutrition Security for the 1990‟s, Agricultural Situation in
India, 42 (5):363-67.
UN-ESCAP (2006). The Millennium Development Goals Report http://www.mdgasiapacific.org.
Vyas, V.S. (2000). „Ensuring Food Security-The State, Market and Civil Society‟, Economic & Political
Weekly, 35 (50).
WEP (2008). WFP’s Response to Global Food Crisis Rome, 10 May 2008 http://www.un.org/
WHO (2002).The World Health Report-Reducing Risks, Promoting Healthy Life.
www.who.int/whr/2002/en/