a-hydroxylationpathway in vitro n-nitrosodimethylamine
TRANSCRIPT
Proc. Natl Acad. Sci. USAVol. 78, No. 10, pp. 6489-6493, October 1981Medical Sciences
a-Hydroxylation pathway in the in vitro metabolism of carcinogenicnitrosamines: N-Nitrosodimethylamine and N-nitroso-N-methylaniline
(activation/mechanism/nitrogen-15 labeling/mass spectrometry/carcinogenesis)
MARILYN B. KROEGER-KOEPKE*, STEVEN R. KOEPKE*, GARY A. MCCLUSKY*, PETER N. MAGEEt, ANDCHRISTOPHER J. MICHEJDA**Chemical Carcinogenesis Program, Frederick Cancer Research Center, Frederick, Maryland 21701; and tFels Research Institute,Temple School of Medicine,Philadelphia, Pennsylvania 19140
Communicated by James A. Miller, July 6, 1981
ABSTRACT Evolution of 5N2-labeled molecular nitrogen wasused to gauge the extent of a-hydroxylation during rat liver ho-mogenate metabolism of doubly '5N-labeled N-nitrosodimethyl-amine (DMN) and N-nitrosomethylaniline (NMA). These mea-surements were correlated with the extent of total metabolism asmeasured by the disappearance of the nitrosamines and by theformation of formaldehyde. The results indicate that approxi-mately 34% of DMN and 19% of NMA were metabolized by thea-hydroxylation pathway. Positive controls utilizing doubly 15N-labeled N-nitroso-N-methylurea yielded 96% of labeled nitrogen.These results are in variance with previously published data whichclaimed that either less than 5% or about 100% of DMN is me-tabolized by that route in vitro. Formaldehyde formation wasshown to be a poor measure of the extent of metabolism. Semi-carbazide gave rise to both formaldehyde and nitrogen, whichmakes it an undesirable component of the in vitro metabolismmixtures, particularly when those two substances are beingmeasured.
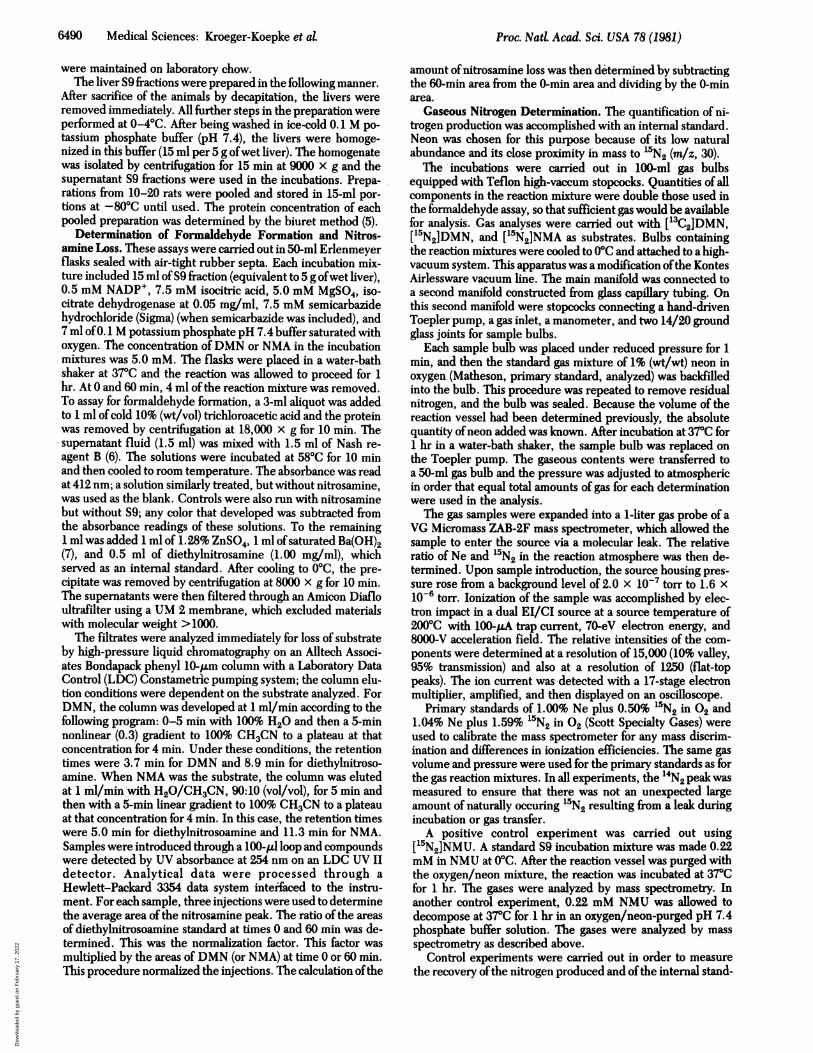
Except for certain special cases, N-nitrosamines must be acti-vated metabolically before their carcinogenic or mutagenic po-tential can be expressed. In the most widely held hypothesis,the metabolic activation involves the hydroxylation of the a-carbon (1) (Fig. 1). The initially formed a-hydroxymethyl (oralkyl, in the general case) nitrosamine is unstable and undergoesa fragmentation reaction to the diazonium ion and formalde-hyde. The former reacts with any adventitious nucleophiles togive alkylation products and 1 equivalent ofmolecular nitrogen.The formation ofmolecular nitrogen in principle should providea convenient probe of the extent of a-hydroxylation.The determination of nitrogen as a measure of a-hydroxyl-
ation has been investigated previously. The published reports,however, are dramatically contradictory. Cottrell et aL (2) re-ported that less than 5% of the metabolism of N-nitrosodime-thylamine (DMN) by postmitochondrial rat liver homogenates(S9 fraction) led to the formation of molecular nitrogen. Theseworkers used doubly '5N-labeled DMN. On the other hand,Milstein and Guttenplan (3) used unlabeled DMN and micro-somes and found that essentially all ofthe nitrosamine was me-tabolized by the a-hydroxylation pathway.The extent of a-hydroxylation in the metabolism of two ni-
trosamines, DMN and N-nitroso-N-methylaniline (NMA), byrat S9 fraction is reported here.
R-N-CH3
NO
I enzymesR-N-CH20H
NO
I nonenzymaticRN2+ + HCHO + OH-
/ Nu: f oxid. \ red.RNu + N2 CO2 CH30H
FIG. 1. Proposed pathway of nitrosamine biodegradation.
MATERIALS AND METHODSPreparation of Labeled Nitrosamines. Dimethyl['5N2]ni-
trosamine was prepared in an 80% yield by the reaction of0.7 g (8.5 mmol) of 99% enriched dimethyl['5N]amine hydro-chloride (Stohler) with 0.65 g (9.4 mmol) of 99% enriched so-dium ['5N]nitrite. The final product was purified by columnchromatography. The mass spectrum indicated 99% enrich-ment. [I3C2]Dimethylnitrosamine was prepared in an analogousmanner starting with 0.5 g of99% enriched ['3C2]dimethylaminehydrochloride (Prochem, Summit, NJ).The preparation of['5N]NMA was carried out by formylation
of 1 g (10.6 mmol) of 99% enriched [15N]aniline (Stohler) with50 ml ofethyl formate. The crude formanilide (1.3 g; 10.6 mmol;100%) was reduced with lithium tetrahydridoaluminate in te-trahydrofuran solution. The reduction mixture was treated withwater and base to destroy excess reducing agent and then wasmade acidic with hydrochloric acid. It was treated with 0.81 g(11.6 mmol) of99% sodium [15N]nitrite. The crude product waspurified by chromatography on silica gel and recrystallized frompentane at -80'C. The yield was 1.3 g (88%); the productshowed 99% enrichment in each nitrogen.
Doubly labeled N-['5N]nitroso-N-methylurea (NMU), wasprepared from methyl['5N]amine according to an adaptation ofthe procedure described by Murray and Williams (4), with 99%enrichment.
Preparation of Liver Fractions. Ten-week-old uninducedmale Fisher 344 rats were used in these studies. The animals
Abbreviations: DMN, N-nitrosodimethylamine; NMA, N-nitroso-N-methylaniline; NMU, N-nitroso-N-methylurea.
The publication costs ofthis article were defrayed in part by page chargepayment. This article must therefore be hereby marked "advertise-ment" in accordance with 18 U. S. C. §1734 solely to indicate this fact.
6489
Dow
nloa
ded
by g
uest
on
Feb
ruar
y 17
, 202
2
6490 Medical Sciences: Kroeger-Koepke et aL
were maintained on laboratory chow.The liver S9 fractions were prepared in the following manner.
After sacrifice of the animals by decapitation, the livers wereremoved immediately. All further steps in the preparation wereperformed at 0-40C. After being washed in ice-cold 0.1 M po-tassium phosphate buffer (pH 7.4), the livers were homoge-nized in this buffer (15 ml per 5 g ofwet liver). The homogenatewas isolated by centrifugation for 15 min at 9000 X g and thesupernatant S9 fractions were used in the incubations. Prepa-rations from 10-20 rats were pooled and stored in 15-ml por-tions at -800C until used. The protein concentration of eachpooled preparation was determined by the biuret method (5).
Determination of Formaldehyde Formation and Nitros-amine Loss. These assays were carried out in 50-ml Erlenmeyerflasks sealed with air-tight rubber septa. Each incubation mix-ture included 15 ml of S9 fraction (equivalent to 5 g ofwet liver),0.5 mM NADP+, 7.5 mM isocitric acid, 5.0 mM MgSO4, iso-citrate dehydrogenase at 0.05 mg/ml, 7.5 mM semicarbazidehydrochloride (Sigma) (when semicarbazide was included), and7 ml of0.1 M potassium phosphate pH 7.4 buffer saturated withoxygen. The concentration of DMN or NMA in the incubationmixtures was 5.0 mM. The flasks were placed in a water-bathshaker at 370C and the reaction was allowed to proceed for 1hr. At 0 and 60 min, 4 ml of the reaction mixture was removed.To assay for formaldehyde formation, a 3-ml aliquot was addedto 1 ml of cold 10% (wt/vol) trichloroacetic acid and the proteinwas removed by centrifugation at 18,000 X g for 10 min. Thesupernatant fluid (1.5 ml) was mixed with 1.5 ml of Nash re-agent B (6). The solutions were incubated at 58°C for 10 minand then cooled to room temperature. The absorbance was readat 412 nm; a solution similarly treated, but without nitrosamine,was used as the blank. Controls were also run with nitrosaminebut without S9; any color that developed was subtracted fromthe absorbance readings of these solutions. To the remaining1 ml was added 1 ml of 1.28% ZnSO4, 1 ml of saturated Ba(OH)2(7), and 0.5 ml of diethylnitrosamine (1.00 mg/ml), whichserved as an internal standard. After cooling to 0°C, the pre-cipitate was removed by centrifugation at 8000 X g for 10 min.The supernatants were then filtered through an Amicon Diafloultrafilter using a UM 2 membrane, which excluded materialswith molecular weight >1000.
The filtrates were analyzed immediately for loss of substrateby high-pressure liquid chromatography on an Alltech Associ-ates Bondapack phenyl 10-,um column with a Laboratory DataControl (LDC) Constametric pumping system; the column elu-tion conditions were dependent on the substrate analyzed. ForDMN, the column was developed at 1 ml/min according to thefollowing program: 0-5 min with 100% H20 and then a 5-minnonlinear (0.3) gradient to 100% CH3CN to a plateau at thatconcentration for 4 min. Under these conditions, the retentiontimes were 3.7 min for DMN and 8.9 min for diethylnitroso-amine. When NMA was the substrate, the column was elutedat 1 mi/Mn with H20/CH3CN, 90:10 (vol/vol), for 5 min andthen with a 5-min linear gradient to 100% CH3CN to a plateauat that concentration for 4 min. In this case, the retention timeswere 5.0 min for diethylnitrosoamine and 11.3 min for NMA.Samples were introduced through a 100-1,u loop and compoundswere detected by UV absorbance at 254 nm on an LDC UV IIdetector. Analytical data were processed through aHewlett-Packard 3354 data system interfaced to the instru-ment. For each sample, three injections were used to determinethe average area of the nitrosamine peak. The ratio of the areasof diethylnitrosoamine standard at times 0 and 60 min was de-termined. This was the normalization factor. This factor wasmultiplied by the areas of DMN (or NMA) at time 0 or 60 min.This procedure normalized the injections. The calculation ofthe
amount ofnitrosamine loss was then determined by subtractingthe 60-min area from the 0-min area and dividing by the 0-minarea.
Gaseous Nitrogen Determination. The quantification of ni-trogen production was accomplished with an internal standard.Neon was chosen for this purpose because of its low naturalabundance and its close proximity in mass to '5N2 (m/z, 30).The incubations were carried out in 100-ml gas bulbs
equipped with Teflon high-vaccum stopcocks. Quantities of allcomponents in the reaction mixture were double those used inthe formaldehyde assay, so that sufficient gas would be availablefor analysis. Gas analyses were carried out with [13C2]DMN,['5N2]DMN, and t15N2]NMA as substrates. Bulbs containingthe reaction mixtures were cooled to 0C and attached to a high-vacuum system. This apparatus was a modification ofthe KontesAirlessware vacuum line. The main manifold was connected toa second manifold constructed from glass capillary tubing. Onthis second manifold were stopcocks connecting a hand-drivenToepler pump, a gas inlet, a manometer, and two 14/20 groundglass joints for sample bulbs.
Each sample bulb was placed under reduced pressure for 1min, and then the standard gas mixture of 1% (wt/wt) neon inoxygen (Matheson, primary standard, analyzed) was backfilledinto the bulb. This procedure was repeated to remove residualnitrogen, and the bulb was sealed. Because the volume of thereaction vessel had been determined previously, the absolutequantity of neon added was known. After incubation at 37C for1 hr in a water-bath shaker, the sample bulb was replaced onthe Toepler pump. The gaseous contents were transferred toa 50-ml gas bulb and the pressure was adjusted to atmosphericin order that equal total amounts of gas for each determinationwere used in the analysis.
The gas samples were expanded into a 1-liter gas probe of aVG Micromass ZAB-2F mass spectrometer, which allowed thesample to enter the source via a molecular leak. The relativeratio of Ne and `5N2 in the reaction atmosphere was then de-termined. Upon sample introduction, the source housing pres-sure rose from a background level of 2.0 x 10⁻⁷ torr to 1.6 x10⁻⁶ torr. Ionization of the sample was accomplished by elec-tron impact in a dual El/CI source at a source temperature of2000C with 100-pA trap current, 70-eV electron energy, and8000-V acceleration field. The relative intensities of the com-ponents were determined at a resolution of 15,000(10% valley,95% transmission) and also at a resolution of 1250 (flat-toppeaks). The ion current was detected with a 17-stage electronmultiplier, amplified, and then displayed on an oscilloscope.
Primary standards of 1.00% Ne plus 0.50% 15N2 in 02 and1.04% Ne plus 1.59% '5N2 in°2 (Scott Specialty Gases) wereused to calibrate the mass spectrometer for any mass discrim-ination and differences in ionization efficiencies. The same gasvolume and pressure were used for the primary standards as forthe gas reaction mixtures. In all experiments, the 14N2 peak wasmeasured to ensure that there was not an unexpected largeamount of naturally occuring '5N2 resulting from a leak duringincubation or gas transfer.A positive control experiment was carried out using
['5N2]NMU. A standard S9 incubation mixture was made 0.22mM in NMU at 0°C. After the reaction vessel was purged withthe oxygen/neon mixture, the reaction was incubated at 37PCfor 1 hr. The gases were analyzed by mass spectrometry. Inanother control experiment, 0.22 mM NMU was allowed todecompose at 37°C for 1 hr in an oxygen/neon-purged pH 7.4phosphate buffer solution. The gases were analyzed by massspectrometry as described above.
Control experiments were carried out in order to measurethe recovery of the nitrogen produced and of the internal stand-
Proc. Nad Acad. Sci. USA 78 (1981)D
ownl
oade
d by
gue
st o
n F
ebru
ary
17, 2
022
Proc. Natd Acad. Sci. USA 78 (1981) 6491
ard introduced. The primary standards were used- as- the' re-action atmospheres with S9 in the enclosed reaction vessel andthen recovered precisely as in the nitrosamine metabolismexperiments.
In the experiments in which semicarbazide was included inthe reaction mixture, total N2 was measured on a Perkin-ElmerSigma 2 gas chromatograph with a 5-A molecular sieve column[10 feet (3.05 m) x 1/8-inch (3.2 mm) outside diameter, stain-less steel]. Injector and detector temperatures were held at2200C, and the carrier helium flow was 20 ml/min. When theoven temperature was held at 250C, the retention time for N2was 6.5 min.
RESULTSDetermination of the Extent of Metabolism of DMN and
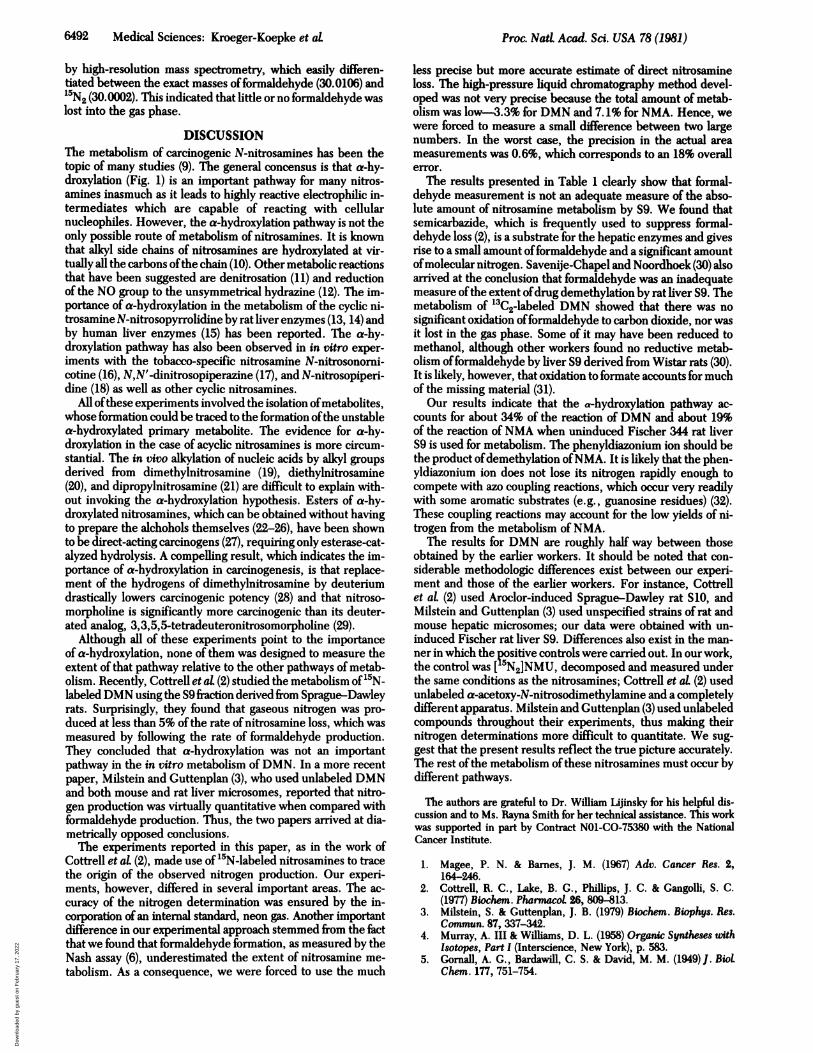
NMA. The S9 fractions used in these experiments were pre-pared from the livers of 10-week-old, uninduced Fisher rats.Formation offormaldehyde was monitored by the Nash method(6). The recovery efficiency offormaldehyde, determined withknown concentrations of added formaldehyde, was 77 ± 5%.Shown in Table 1 are the detected yields of formaldehyde forboth DMN and NMA, as well as the data for nitrosamine loss.This latter quantity was monitored by high-pressure liquidchromatography on a standard reverse-phase column. The larg-est error due to precision involved in this measurement wasfound to be 18%. Because semicarbazide is often added to re-action mixtures in order to trap formaldehyde, experimentswere also carried out using semicarbazide alone as a substrateas well as part ofa mixture that included DMN. Because it wasascertained that semicarbazide alone produced formaldehydeat a rate of0.028 ,smol/g ofliver per hr (16% ofthat found whenDMN was incubated without semicarbazide) as well as N2 at arate of 2.5 Amol/g of liver per hr, this trapping agent wasomitted from all reactions reported in this paper.
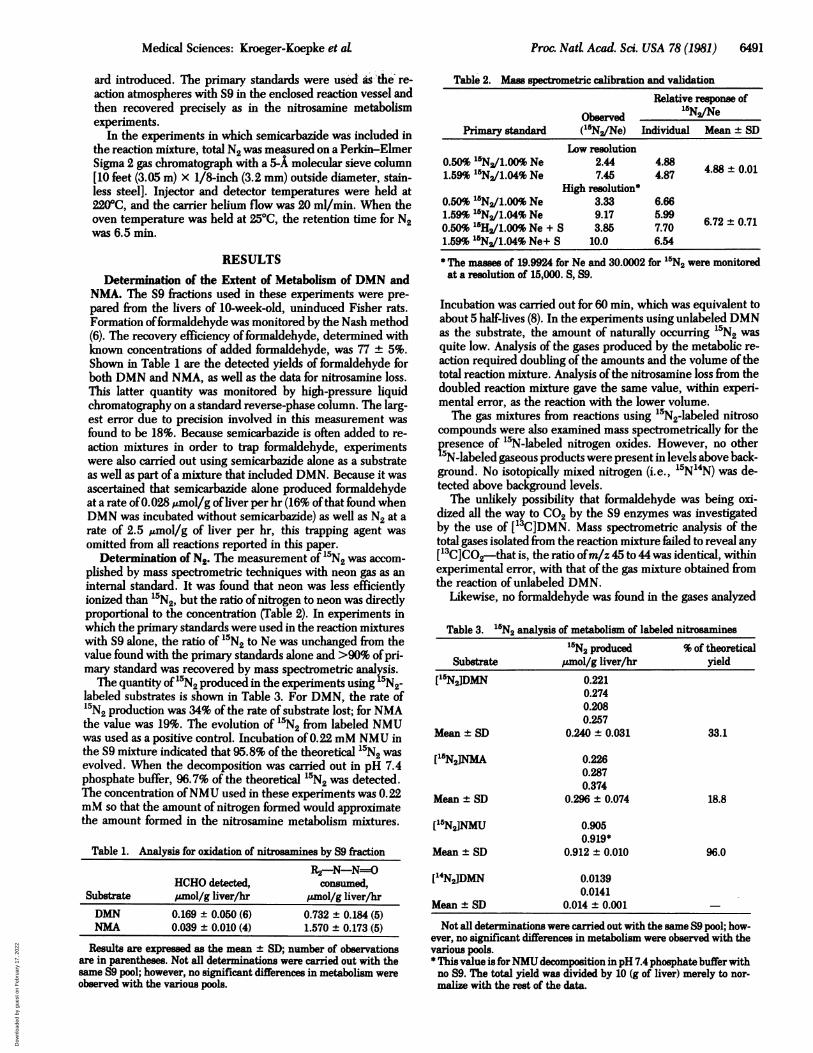
Determination of N2. The measurement of '5N2 was accom-plished by mass spectrometric techniques with neon gas as aninternal standard. It was found that neon was less efficientlyionized than '5N2, but the ratio ofnitrogen to neon was directlyproportional to the concentration (Table 2). In experiments inwhich the primary standards were used in the reaction mixtureswith S9 alone, the ratio of '5N2 to Ne was unchanged from thevalue found with the primary standards alone and >90% ofpri-mary standard was recovered by mass spectrometric analysis.The quantity of 5N2 produced in the experiments using '5N2-
labeled substrates is shown in Table 3. For DMN, the rate of'5N2 production was 34% of the rate of substrate lost; for NMAthe value was 19%. The evolution of "5N2 from labeled NMUwas used as a positive control. Incubation of 0.22 mM NMU inthe S9 mixture indicated that 95.8% of the theoretical '5N2 wasevolved. When the decomposition was carried out in pH 7.4phosphate buffer, 96.7% of the theoretical "5N2 was detected.The concentration ofNMU used in these experiments was 0.22mM so that the amount of nitrogen formed would approximatethe amount formed in the nitrosamine metabolism mixtures.
Table 1. Analysis for oxidation of nitrosamines by S9 fraction
R2-N-N=OHCHO detected, consumed,
Substrate pmol/g liver/hr ,umol/g liver/hrDMN 0.169 ± 0.050 (6) 0.732 ± 0.184 (5)NMA 0.039 ± 0.010 (4) 1.570 ± 0.173 (5)
Results are expressed as the mean ± SD; number of observationsare in parentheses. Not all determinations were carried out with thesame S9 pool; however, no significant differences in metabolism wereobserved with the various pools.
Table 2. Mass spectrometric calibration and validationRelative response of
Observed l'N1/NePrimarystandard (15N2/Ne) Individual Mean + SD
Low resolution0.50% 15N2/1.00% Ne 2.44 4.88 488±0.011.59% '5N2/1.04% Ne 7.45 4.87
High resolution*0.50% '5N2/1.00% Ne 3.33 6.661.59% 15N2/1.04% Ne 9.17 5.990.50% 15H2/1.00% Ne + S 3.85 7.70 6.72 ± 0.711.59% '5N2/1.04% Ne+ S 10.0 6.54
* The masses of 19.9924 for Ne and 30.0002 for 15N2 were monitoredat a resolution of 15,000. S, S9.
Incubation was carried out for 60 min, which was equivalent toabout 5 half-lives (8). In the experiments using unlabeled DMNas the substrate, the amount of naturally occurring '5N2 wasquite low. Analysis of the gases produced by the metabolic re-action required doubling of the amounts and the volume of thetotal reaction mixture. Analysis ofthe nitrosamine loss from thedoubled reaction mixture gave the same value, within experi-mental error, as the reaction with the lower volume.The gas mixtures from reactions using '5N2-labeled nitroso
compounds were also examined mass spectrometrically for thepresence of '5N-labeled nitrogen oxides. However, no other"N-labeled gaseous products were present in levels above back-ground. No isotopically mixed nitrogen (i.e., 15N'4N) was de-tected above background levels.The unlikely possibility that formaldehyde was being oxi-
dized all the way to CO2 by the S9 enzymes was investigatedby the use of [13C]DMN. Mass spectrometric analysis of thetotal gases isolated from the reaction mixture failed to reveal any[I3C]CO2-that is, the ratio ofm/z 45 to 44 was identical, withinexperimental error, with that of the gas mixture obtained fromthe reaction of unlabeled DMN.
Likewise, no formaldehyde was found in the gases analyzed
Table 3. 15N2 analysis of metabolism of labeled nitrosamines15N2 produced % of theoretical
Substrate pumol/g liver/hr yield[15N2]DMN 0.221
0.2740.2080.257
Mean ± SD 0.240 ± 0.031 33.1
[15N2]NA
Mean ± SD
[15N2]NMU
Mean ± SD
[14N2]DMN
Mean ± SD
0.2260.2870.374
0.296 ± 0.074
0.9050.919*
0.912 ± 0.010
18.8
96.0
0.01390.0141
0.014 ± 0.001
Not all determinations were carried out with the same S9 pool; how-ever, no significant differences in metabolism were observed with thevarious pools.* This value is forNMU decomposition inpH 7.4 phosphate buffer withno S9. The total yield was divided by 10 (g of liver) merely to nor-malize with the rest of the data.
Medical Sciences: Kroeger-Koepke et aL
Dow
nloa
ded
by g
uest
on
Feb
ruar
y 17
, 202
2
6492 Medical Sciences: Kroeger-Koepke et at
by high-resolution mass spectrometry, which easily differen-tiated between the exact masses offormaldehyde (30.0106) and15N2 (30.0002). This indicated that little or no formaldehyde waslost into the gas phase.
DISCUSSIONThe metabolism of carcinogenic N-nitrosamines has been thetopic of many studies (9). The general concensus is that a-hy-droxylation (Fig. 1) is an important pathway for many nitros-amines inasmuch as it leads to highly reactive electrophilic in-termediates which are capable of reacting with cellularnucleophiles. However, the a-hydroxylation pathway is not theonly possible route of metabolism of nitrosamines. It is knownthat alkyl side chains of nitrosamines are hydroxylated at vir-tually all the carbons ofthe chain (10). Other metabolic reactionsthat have been suggested are denitrosation (11) and reductionof the NO group to the unsymmetrical hydrazine (12). The im-portance of a-hydroxylation in the metabolism of the cyclic ni-trosamine N-nitrosopyrrolidine by rat liver enzymes (13, 14) andby human liver enzymes (15) has been reported. The a-hy-droxylation pathway has also been observed in in vitro exper-iments with the tobacco-specific nitrosamine N-nitrosonorni-cotine (16), N,N'-dinitrosopiperazine (17), and N-nitrosopiperi-dine (18) as well as other cyclic nitrosamines.
All ofthese experiments involved the isolation ofmetabolites,whose formation could be traced to the formation ofthe unstablea-hydroxylated primary metabolite. The evidence for a-hy-droxylation in the case of acyclic nitrosamines is more circum-stantial. The in vivo alkylation of nucleic acids by alkyl groupsderived from dimethylnitrosamine (19), diethylnitrosamine(20), and dipropylnitrosamine (21) are difficult to explain with-out invoking the a-hydroxylation hypothesis. Esters of a-hy-droxylated nitrosamines, which can be obtained without havingto prepare the alchohols themselves (22-26), have been shownto be direct-acting carcinogens (27), requiring only esterase-cat-alyzed hydrolysis. A compelling result, which indicates the im-portance of a-hydroxylation in carcinogenesis, is that replace-ment of the hydrogens of dimethylnitrosamine by deuteriumdrastically lowers carcinogenic potency (28) and that nitroso-morpholine is significantly more carcinogenic than its deuter-ated analog, 3,3,5,5-tetradeuteronitrosomorpholine (29).
Although all of these experiments point to the importanceof a-hydroxylation, none of them was designed to measure theextent of that pathway relative to the other pathways of metab-olism. Recently, Cottrell et al (2) studied the metabolism of 5N-labeled DMN using the S9fraction derived from Sprague-Dawleyrats. Surprisingly, they found that gaseous nitrogen was pro-duced at less than 5% of the rate of nitrosamine loss, which wasmeasured by following the rate of formaldehyde production.They concluded that a-hydroxylation was not an importantpathway in the in vitro metabolism of DMN. In a more recentpaper, Milstein and Guttenplan (3), who used unlabeled DMNand both mouse and rat liver microsomes, reported that nitro-gen production was virtually quantitative when compared withformaldehyde production. Thus, the two papers arrived at dia-metrically opposed conclusions.The experiments reported in this paper, as in the work of
Cottrell et at (2), made use of5N-labeled nitrosamines to tracethe origin of the observed nitrogen production. Our experi-ments, however, differed in several important areas. The ac-curacy of the nitrogen determination was ensured by the in-corporation of an internal standard, neon gas. Another importantdifference in our experimental approach stemmed from the factthat we found that formaldehyde formation, as measured by theNash assay (6), underestimated the extent of nitrosamine me-tabolism. As a consequence, we were forced to use the much
less precise but more accurate estimate of direct nitrosamineloss. The high-pressure liquid chromatography method devel-oped was not very precise because the total amount of metab-olism was low-3.3% for DMN and 7.1% for NMA. Hence, wewere forced to measure a small difference between two largenumbers. In the worst case, the precision in the actual areameasurements was 0.6%, which corresponds to an 18% overallerror.
The results presented in Table 1 clearly show that formal-dehyde measurement is not an adequate measure of the abso-lute amount of nitrosamine metabolism by S9. We found thatsemicarbazide, which is frequently used to suppress formal-dehyde loss (2), is a substrate for the hepatic enzymes and givesrise to a small amount offormaldehyde and a significant amountofmolecular nitrogen. Savenije-Chapel and Noordhoek (30) alsoarrived at the conclusion that formaldehyde was an inadequatemeasure ofthe extent ofdrug demethylation by rat liver S9. Themetabolism of 13C2-labeled DMN showed that there was nosignificant oxidation offormaldehyde to carbon dioxide, nor wasit lost in the gas phase. Some of it may have been reduced tomethanol, although other workers found no reductive metab-olism offormaldehyde by liver S9 derived from Wistar rats (30).It is likely, however, that oxidation to formate accounts for muchof the missing material (31).
Our results indicate that the a-hydroxylation pathway ac-counts for about 34% of the reaction of DMN and about 19%of the reaction of NMA when uninduced Fischer 344 rat liverS9 is used for metabolism. The phenyldiazonium ion should bethe product of demethylation ofNMA. It is likely that the phen-yldiazonium ion does not lose its nitrogen rapidly enough tocompete with azo coupling reactions, which occur very readilywith some aromatic substrates (e.g., guanosine residues) (32).These coupling reactions may account for the low yields of ni-trogen from the metabolism of NMA.The results for DMN are roughly half way between those
obtained by the earlier workers. It should be noted that con-siderable methodologic differences exist between our experi-ment and those of the earlier workers. For instance, Cottrellet at (2) used Aroclor-induced Sprague-Dawley rat SLO, andMilstein and Guttenplan (3) used unspecified strains of rat andmouse hepatic microsomes; our data were obtained with un-induced Fischer rat liver S9. Differences also exist in the man-ner in which the positive controls were carried out. In our work,the control was [ 5N2]NMU, decomposed and measured underthe same conditions as the nitrosamines; Cottrell et al (2) usedunlabeled a-acetoxy-N-nitrosodimethylamine and a completelydifferent apparatus. Milstein and Guttenplan (3) used unlabeledcompounds throughout their experiments, thus making theirnitrogen determinations more difficult to quantitate. We sug-gest that the present results reflect the true picture accurately.The rest of the metabolism of these nitrosamines must occur bydifferent pathways.
The authors are grateful to Dr. William Lijinsky for his helpful dis-cussion and to Ms. Rayna Smith for her technical assistance. This workwas supported in part by Contract N01-CO-75380 with the NationalCancer Institute.
1. Magee, P. N. & Barnes, J. M. (1967) Adv. Cancer Res. 2,164-246.
2. Cottrell, R. C., Lake, B. G., Phillips, J. C. & Gangolli, S. C.(1977) Biochem. Pharmacot 26, 809-813.
3. Milstein, S. & Guttenplan, J. B. (1979) Biochem. Biophys. Res.Commun. 87, 337-342.
4. Murray, A. III & Williams, D. L. (1958) Organic SyntheseswithIsotopes, Part I (Interscience, New York), p. 583.
5. Gornall, A. G., Bardawill, C. S. & David, M. M. (1949)J. BiotChem. 177, 751-754.
Proc. Nad Acad. Sci. USA 78 (1981)D
ownl
oade
d by
gue
st o
n F
ebru
ary
17, 2
022

Proc. Natd Acad. Sci. USA 78 (1981) 6493
6. Nash, T. (1953) Biochern.J. 55, 416-421.7. Somogyi, M. (1945)J. Biol Che/n. 160, 69-73.8. Garrett, E. R., Goto, S. & Stubbins, J. F. (1965)J. Pharm. Sci.
54, 119-123.9. O'Connor, P. J., Saffhill, R. & Margison, G. P. (1979) in Envi-
ronmental Carcinogenesis, eds. Emmelot, P. & Kriek, E.(North-Holland, Amsterdam), pp. 73-96.
10. Park, K. K. & Archer, M. C. (1978) Chem.-BioL Interact. 22,83-90.
11. Appel, K. E., Schrenk, D., Schwartz, M., Mahr, B. & Kunz, W.(1980) Cancer Lett. 9, 13-20.
12. Grilli, S. & Prodi, G. (1975) Gann 66, 473-480.13. Hecht, S. S., Chen, C. B. & Hoffinann, D. (1978) Cancer Res.
38, 215-218.14. Hecker, L. I., Farrelly, J. G., Smith, J. H., Saavedra, J. E. &
Lyon, P. A. (1979) Cancer Res. 39, 2679-2688.15. Hecht, S. S., Chen, C. B., McCoy, G. D. & Hoffinann, D. (1979)
Cancer Lett. 8, 35-41.16. Chen, C. B., McCoy, G. D., Hecht, S. S., Hoffmann, D. &
Wynder, E. L. (1978) Cancer Res. 38, 3812-3816.17. Kruiger, F. W., Bertram, B. & Eisenbrand, G. (1976) Z. Krebs-
forsch. 85, 125-134.18. Leung, K. H., Park, K. K. & Archer, M. C. (1978) Res. Commun.
Chem. Pathol Pharmacol 19, 201-211.19. Swann, P. F. & Magee, P. N. (1968) Biochem. J. 110, 39-47.
20. Ross, A. E., Keefer, L. & Lijinsky, W. (1971)J. Natl, Cancer Inst.47, 789-795.
21. Park, K. K., Archer, M. C. & Wishnok, J. S. (1980) Chem.-BiootInteract. 29, 139-144.
22. Roller, P. P., Shimp, D. & Keefer, L. K. (1975) TetrahedronLeft. 25, 2065-2068.
23. Wiessler, M. (1975) Tetrahedron Lett. 30, 2575-2578.24. Baldwin, J. F., Branz, S. E., Gomez, R. F., Kraft, P. L., Sin-
skey, A. J. & Tannenbaum, S. R. (1976) Tetrahedron Left. 5,333-336.
25. Saavedra, J. E. (1979)J. Org. Chemn. 44, 4511-4515.26. Kupper, R. & Michejda, C. J. (1980) J. Org. Chem. 45,
2919-2921.27. Berman, J. J., Rice, J. M., Wenk, M. L. & Roller, P. P. (1979)
J. Natl Cancer Inst. 63, 93-100.28. Keefer, L. K., Lijinsky, W. & Garcia, H. (1973)J. Natl Cancer
Inst. 51, 299-302.29. Lijinsky, W., Taylor, H. W. & Keefer, L. K. (1976)J. Nati Can-
cer Inst. 57, 1311-1313.30. Savenije-Chapel, E. M. & Noordhoek, J. (1980) Biochem. Phar-
macot 29, 2023-2029.31. Den Engelse, L., Gebbink, M. & Emmelot, P. (1975) Chemn.-
Biol. Interact. 11, 535-544.32. Kochetkov, N. K. & Budovskii, E. I., eds. (1972) Organic Chem-
istry ofNucleic Acids (Plenum, New York).
Medical Sciences: Kroeger-Koepke et al
Dow
nloa
ded
by g
uest
on
Feb
ruar
y 17
, 202
2