a hybrid swarm optimization approach for feature set ... hybrid swarm optimization approach for...
TRANSCRIPT
A Hybrid Swarm Optimization approach for Feature set reduction in
Digital Mammograms
J. B. JONA
Department of Computer Technology and Applications
Coimbatore Institute of Technology, Coimbatore, Tamil Nadu
INDIA
Email: [email protected]
N. NAGAVENI
Department of Mathematics
Coimbatore Institute of Technology, Coimbatore, Tamil Nadu
INDIA
Email: [email protected]
Abstract: In this paper a CAD (Computer Aided Diagnosis) system is proposed to optimize the feature set using
hybrid of Particle Swarm Optimization (PSO) and Genetic Algorithm (GA) technique called Genetical Swarm
Optimization (GSO) in Digital Mammogram. Even though PSO is a good optimization technique, it may be
trapped in local minima and may prematurely converge. So, the genetic operators are used in PSO to overcome the
difficulties. Feature selection plays a major role in diagnosis of mammogram. Gray Level Co-occurance Matrix
(GLCM) texture features are extracted from the mammogram. All the extracted features do not help in detection of
abnormality in a mammogram, so it is intended to reduce the feature set to improve classification accuracy. In this
work, experiments are conducted on MiniMIAS database and Support Vector Machine (SVM) classifies the
mammograms into normal and abnormal mammograms. Performance of GSO is compared with GA and PSO by
means of Receiver Operating Characteristic (ROC) curve. Results show that, the GSO convergence is better than
both PSO and GA; GSO based SVM (GSO-SVM) classifier exhibits superior performance with an accuracy of 94%
which is approximately 1% higher than GA based SVM (GA-SVM) and PSO based SVM (PSO-SVM)
classification.
Keywords: Genetic Algorithm, Genetical Swarm Optimization, Particle Swarm Optimization, Support Vector Machine.
1 Introduction
Mammography is the only effective screening
method for detection of breast cancer in early stage.
Due to wrong interpretation of the radiologist or
because of the limitation of human visualization
system certain errors like false negative errors may
arise. To overcome such limitations of
mammography, the researchers developed Computer
Aided Diagnosis (CAD) systems to automatically
detect and diagnose the abnormalities in digital
mammograms.
Genetic Algorithm (GA) is a common optimization
technique, introduced by John Holland [1]. It belongs
to the family of evolutionary algorithm and
originated from Darwin’s theory of natural selection
and evolution. Particle Swarm Optimization (PSO) is
introduced by Kennedy and Eberhart, is also an
optimization technique originated from the idea of
swarm intelligence and evolutionary computation.
PSO is inspired by the ability of flocks of birds to
find rich sources of food, and avoid predators by
implementing an “information sharing” mechanism
[2].
Both PSO and GA are population based optimization
techniques to find a solution to a given objective
function but have their own strength and weakness.
PSO is a global optimization technique which is
known for its speed of convergence, easy to
implement and only few parameters to adjust but it
WSEAS TRANSACTIONS on INFORMATION SCIENCE and APPLICATIONS J. B. Jona, N. Nagaveni
E-ISSN: 2224-3402 340 Issue 11, Volume 9, November 2012
has the drawback that it may quickly cause a particle
to stagnate and also prematurely converge on
suboptimal solution. In PSO only the best particle
share the information with others. In the classical
PSO, all parents are directly replaced by their
offspring without analyzing whether they can lead a
better performance than their parents or not. So, most
of the particles move to the worse positions in most
of the cases which may lead to early convergence on
local minima. In GA, chromosomes of close
similarity can converge quickly in fewer generations
than PSO.
Some researchers have compared GA and PSO [3]–
[6] for various applications. Alessandro Gandelli et
al. [7] proposed a hybrid technique that combines
PSO and GA called Genetical Swarm Optimization
(GSO), to design a planar reflect array antenna, in
order to optimize the geometrical features of its
elements. It is proved that GSO is reliable and
effective technique for wider application in
electromagnetic. Alfassio Grimaldi et al. [8]
proposed a hybrid evolutionary algorithm called
GSO, for the optimization of large-domain
electromagnetic problems. The research shows that,
GSO performs a quick global search without getting
trapped in local minima and performs a quick global
search in the synthesis of linear and planar arrays.
Davide Caputo et al. [9] presents GSO to optimize
the communication energy consumption in a wireless
network by selecting the optimal multihop routing
schemes. Karnan et al. used hybrid of GA and PSO to
detect the nipple position in digital mammogram
[10].
In this paper, a hybrid technique that combines the
selection strategy of GA and information sharing of
PSO to reduce the mammogram feature set is
proposed. The roulette wheel selection strategy of
GA helps PSO to select the particles for the next
generation. This approach helps the PSO to reduce
the probability of trapping into local minima. The
mutation operator of GA helps to avoid the premature
convergence of a particle.
The rest of the paper is organized as follows: Section
2 describes the methodology of the proposed system
which includes the Expectation Maximization (EM)
segmentation, feature extraction, feature selection by
GA, PSO and the proposed hybrid technique and the
Support Vector Machine (SVM) classification..
Section 3 describes the experimental results in detail.
Section 4 describes the conclusion and the future
enhancements.
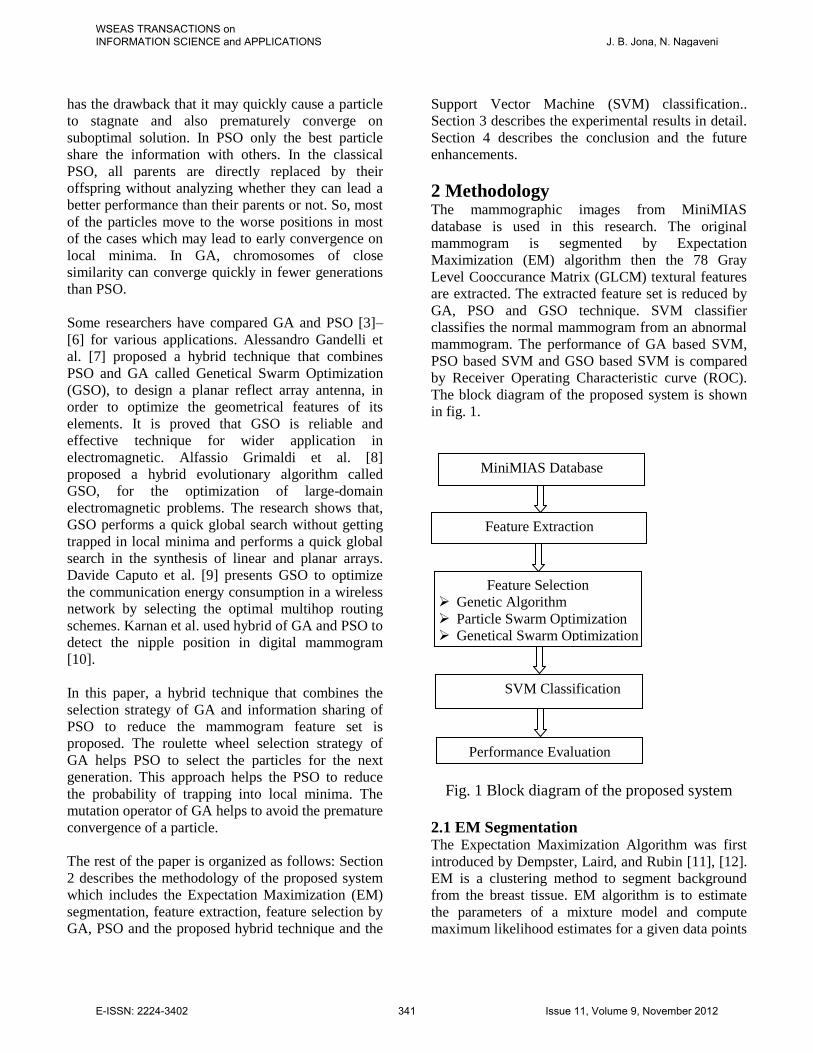
2 Methodology The mammographic images from MiniMIAS
database is used in this research. The original
mammogram is segmented by Expectation
Maximization (EM) algorithm then the 78 Gray
Level Cooccurance Matrix (GLCM) textural features
are extracted. The extracted feature set is reduced by
GA, PSO and GSO technique. SVM classifier
classifies the normal mammogram from an abnormal
mammogram. The performance of GA based SVM,
PSO based SVM and GSO based SVM is compared
by Receiver Operating Characteristic curve (ROC).
The block diagram of the proposed system is shown
in fig. 1.
Fig. 1 Block diagram of the proposed system
2.1 EM Segmentation The Expectation Maximization Algorithm was first
introduced by Dempster, Laird, and Rubin [11], [12].
EM is a clustering method to segment background
from the breast tissue. EM algorithm is to estimate
the parameters of a mixture model and compute
maximum likelihood estimates for a given data points
MiniMIAS Database
Feature Extraction
Feature Selection
Genetic Algorithm
Particle Swarm Optimization
Genetical Swarm Optimization
SVM Classification
Performance Evaluation
WSEAS TRANSACTIONS on INFORMATION SCIENCE and APPLICATIONS J. B. Jona, N. Nagaveni
E-ISSN: 2224-3402 341 Issue 11, Volume 9, November 2012
that are generated by a mixture of Gaussian. The
algorithm alternates between E step and M step. E
step finds the expectation of log likelihood for the
given mean vector and variance vector based on the
current expected values of mixed weights. M step
computes new log likelihood for the μk (mean) and
σk (variance) based on the current expected log-
likelihood value.
EM algorithm estimate missing values which is the
centers of the clusters. The algorithm optimize the
log likelihood of the parameters from a given data
set. EM algorithm estimates the probability of
elements to be in certain clusters.
Assume a mixture model formed by the image space
to be the combination of k Gaussians or k clusters,
{1, 2...k}, with some prior probabilities w1, w2 …. wk
of a random point belonging to the associated class.
And since each class represents a Gaussian
distribution, the probability of each point in image
data is given as
𝑓 𝑥 Θ = 𝑓𝑖𝑘𝑖=1 𝑥 Θ𝑖 (1)
where x is a input image, αi represents m wk for kth
cluster ( αi = 1ki=1 ). Θ represents collection of
parameters (μ1 ,μ2 ,… , μk ,σ1 ,σ2 ,… ,σk ) means and
covarience matrix in this case and fi is a multivariate
Gaussian Density function given as,
𝑓𝑖 𝑥 Θ𝑖 = 𝑓𝑖(𝑥|𝜇𝑖 𝜎𝑖) (2)
𝑓ℎ 𝑥 𝜇𝑖 ,𝜎𝑖) = 1
2𝜋 𝜎𝑖 𝑒𝑥𝑝
− (𝑥−𝜇 𝑖)2
2𝜎 (3)
where 𝜇𝑖 stands for mean and 𝜎𝑖 for variance
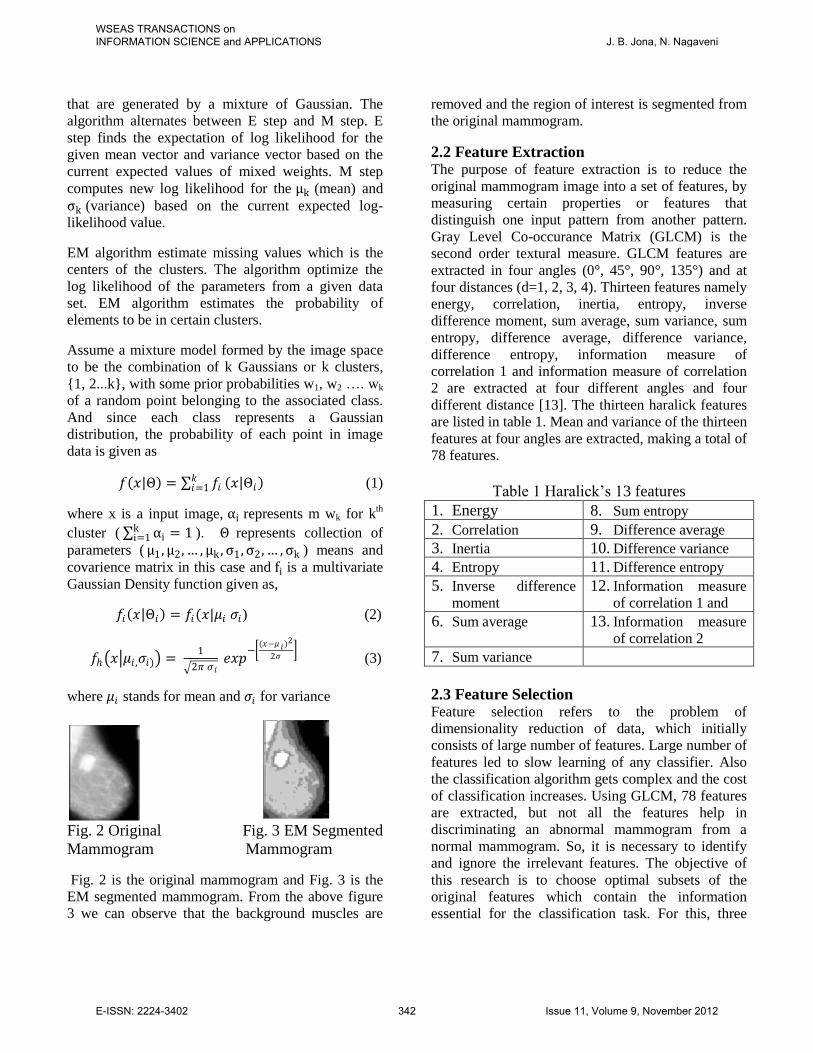
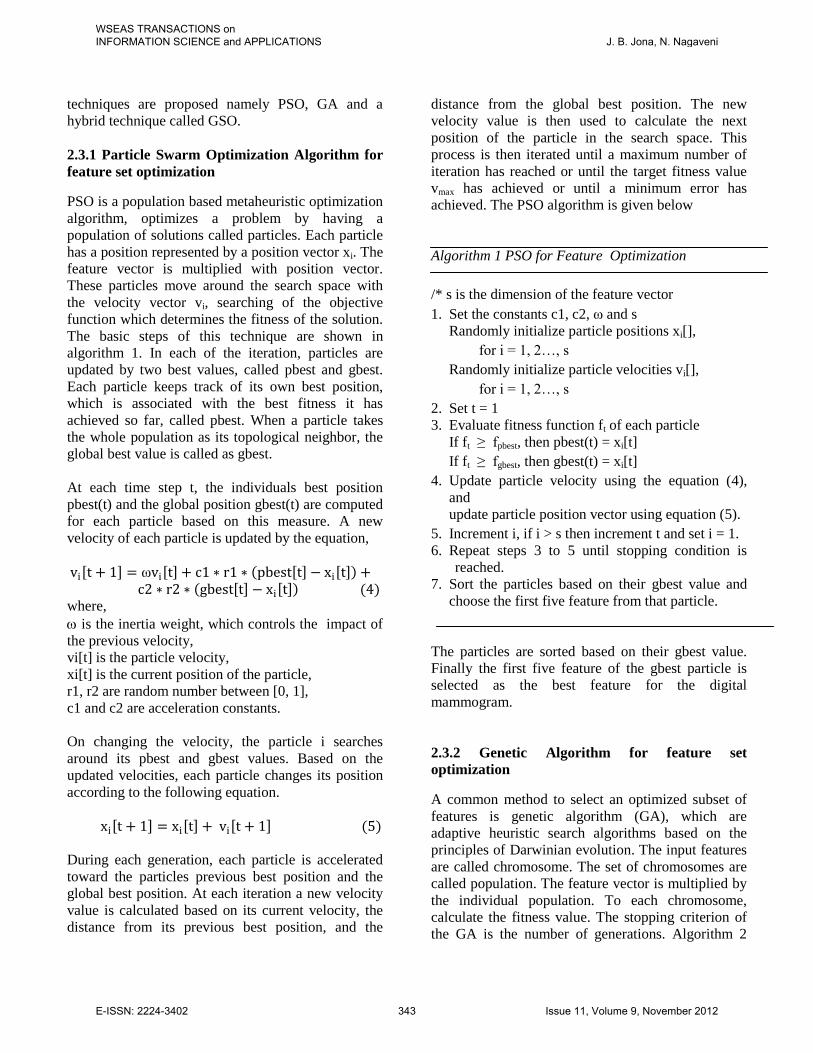
Fig. 2 Original Fig. 3 EM Segmented
Mammogram Mammogram
Fig. 2 is the original mammogram and Fig. 3 is the
EM segmented mammogram. From the above figure
3 we can observe that the background muscles are
removed and the region of interest is segmented from
the original mammogram.
2.2 Feature Extraction The purpose of feature extraction is to reduce the
original mammogram image into a set of features, by
measuring certain properties or features that
distinguish one input pattern from another pattern.
Gray Level Co-occurance Matrix (GLCM) is the
second order textural measure. GLCM features are
extracted in four angles (0°, 45°, 90°, 135°) and at
four distances (d=1, 2, 3, 4). Thirteen features namely
energy, correlation, inertia, entropy, inverse
difference moment, sum average, sum variance, sum
entropy, difference average, difference variance,
difference entropy, information measure of
correlation 1 and information measure of correlation
2 are extracted at four different angles and four
different distance [13]. The thirteen haralick features
are listed in table 1. Mean and variance of the thirteen
features at four angles are extracted, making a total of
78 features.
Table 1 Haralick’s 13 features
1. Energy 8. Sum entropy
2. Correlation 9. Difference average
3. Inertia 10. Difference variance
4. Entropy 11. Difference entropy
5. Inverse difference
moment 12. Information measure
of correlation 1 and
6. Sum average 13. Information measure
of correlation 2
7. Sum variance
2.3 Feature Selection Feature selection refers to the problem of
dimensionality reduction of data, which initially
consists of large number of features. Large number of
features led to slow learning of any classifier. Also
the classification algorithm gets complex and the cost
of classification increases. Using GLCM, 78 features
are extracted, but not all the features help in
discriminating an abnormal mammogram from a
normal mammogram. So, it is necessary to identify
and ignore the irrelevant features. The objective of
this research is to choose optimal subsets of the
original features which contain the information
essential for the classification task. For this, three
WSEAS TRANSACTIONS on INFORMATION SCIENCE and APPLICATIONS J. B. Jona, N. Nagaveni
E-ISSN: 2224-3402 342 Issue 11, Volume 9, November 2012
techniques are proposed namely PSO, GA and a
hybrid technique called GSO.
2.3.1 Particle Swarm Optimization Algorithm for
feature set optimization
PSO is a population based metaheuristic optimization
algorithm, optimizes a problem by having a
population of solutions called particles. Each particle
has a position represented by a position vector xi. The
feature vector is multiplied with position vector.
These particles move around the search space with
the velocity vector vi, searching of the objective
function which determines the fitness of the solution.
The basic steps of this technique are shown in
algorithm 1. In each of the iteration, particles are
updated by two best values, called pbest and gbest.
Each particle keeps track of its own best position,
which is associated with the best fitness it has
achieved so far, called pbest. When a particle takes
the whole population as its topological neighbor, the
global best value is called as gbest.
At each time step t, the individuals best position
pbest(t) and the global position gbest(t) are computed
for each particle based on this measure. A new
velocity of each particle is updated by the equation,
vi t + 1 = ωvi t + c1 ∗ r1 ∗ pbest t − xi t + c2 ∗ r2 ∗ gbest t − xi t (4) where,
is the inertia weight, which controls the impact of
the previous velocity,
vi[t] is the particle velocity,
xi[t] is the current position of the particle,
r1, r2 are random number between [0, 1],
c1 and c2 are acceleration constants.
On changing the velocity, the particle i searches
around its pbest and gbest values. Based on the
updated velocities, each particle changes its position
according to the following equation.
xi t + 1 = xi t + vi t + 1 (5)
During each generation, each particle is accelerated
toward the particles previous best position and the
global best position. At each iteration a new velocity
value is calculated based on its current velocity, the
distance from its previous best position, and the
distance from the global best position. The new
velocity value is then used to calculate the next
position of the particle in the search space. This
process is then iterated until a maximum number of
iteration has reached or until the target fitness value
vmax has achieved or until a minimum error has
achieved. The PSO algorithm is given below
Algorithm 1 PSO for Feature Optimization
/* s is the dimension of the feature vector
1. Set the constants c1, c2, ω and s
Randomly initialize particle positions xi[],
for i = 1, 2…, s
Randomly initialize particle velocities vi[],
for i = 1, 2…, s
2. Set t = 1
3. Evaluate fitness function ft of each particle
If ft ≥ fpbest, then pbest(t) = xi[t]
If ft ≥ fgbest, then gbest(t) = xi[t]
4. Update particle velocity using the equation (4),
and
update particle position vector using equation (5).
5. Increment i, if i > s then increment t and set i = 1.
6. Repeat steps 3 to 5 until stopping condition is
reached.
7. Sort the particles based on their gbest value and
choose the first five feature from that particle.
The particles are sorted based on their gbest value.
Finally the first five feature of the gbest particle is
selected as the best feature for the digital
mammogram.
2.3.2 Genetic Algorithm for feature set
optimization
A common method to select an optimized subset of
features is genetic algorithm (GA), which are
adaptive heuristic search algorithms based on the
principles of Darwinian evolution. The input features
are called chromosome. The set of chromosomes are
called population. The feature vector is multiplied by
the individual population. To each chromosome,
calculate the fitness value. The stopping criterion of
the GA is the number of generations. Algorithm 2
WSEAS TRANSACTIONS on INFORMATION SCIENCE and APPLICATIONS J. B. Jona, N. Nagaveni
E-ISSN: 2224-3402 343 Issue 11, Volume 9, November 2012

explains the feature selection mechanism of the
mammogram using GA. The GA uses three operators
namely: reproduction, crossover and mutation.
Reproduction copies the parent chromosomes to
generate new population. Crossover mixes genes of
two chromosomes to create new generation. Mutation
is the random alteration to the position value which
simply means changing 0 to 1 and vice versa.
The population is initialized randomly and a new
dataset is created. The fitness value is computed for
all the chromosomes. Not all the chromosomes are
taken to the next generation; the roulette wheel
selection strategy is applied to select the parents for
the next iteration. A single point cross over followed
by mutation is performed to produce new
chromosome. Again the fitness is calculated for the
chromosomes. This sequence of selection, crossover
and mutation processes are repeatedly applied until a
best combination of features obtained.
Algorithm 2 GA for Feature Optimization
1. Generate random population with 78 genes in each
chromosomes
2. Evaluate the fitness f(x) of each chromosome x in
the population
3. Create new population by repeating the following
steps until optimized feature set is obtained
3.1 Select two chromosomes from the population
using the Roulette wheel selection strategy based on
their fitness
3.2 Perform crossover of the two parent to form new
offspring.
3.3 Do mutation on the newly obtained offspring.
3.4 Replace offspring in the new population
4. Go to Step 2 and repeat the process until maximum
iteration has reached.
5. Select the first five feature of the highest fit
chromosomes.
Here the 78 features are represented by a
chromosome with 78 genes (bits) corresponding to
the number of features. Initial population sizes of 100
chromosomes are randomly generated. Repeatedly
apply the genetic operators selection, cross over and
mutation in order, until maximum iteration has
reached.
2.3.3 Genetical Swarm Optimization for feature
set optimization
In the classical PSO, all parents are directly replaced
by their offspring without analyzing whether they can
lead a better performance than their parents or not.
So, most of the particles move to the worse positions
in most of the cases. This may lead to early converge
on local minima. In this paper, roulette wheel
selection in PSO to select the particles for the next
generation is introduced. Therefore, the particle's
position for the next generation is not only due to the
position update but also to the roulette selection
strategy. This approach helps the PSO to reduce the
probability of trapping into local minima. Select the
pbest position and gbest position based on the fitness
using the genetic operator, as shown in algorithm 3.
Roulette wheel selection strategy selects the best
parent, perform the crossover of the selected parent
and mutate the offspring. From the new population
compute the pbest value and gbest value. Update the
position and velocity vector using equation 1 and 2
respectively. Repeat the process until a maximum
number of iteration is reached.
Algorithm 3 GSO for Feature Optimization
/*s is the dimension of the feature vector.
1. Set the constants c1, c2, ω and s.
Randomly initialize particle positions xi[],
for i = 1, 2…, s.
Randomly initialize particle velocities vi[],
for i = 1, 2…, s.
2. Set t=1.
3. Evaluate fitness function ft of each particle
If ft ≥ fpbest then pbest(t) = xi[t]
If ft ≥ fgbest then gbest(t) = xi[t]
4. Use roulette wheel strategy to select the parent
particle, do crossover and perform mutation on the
offspring particle.
5. Update particle velocity using equation (4), Update
particle position vector using equation (5).
6. Repeat steps 3 to 5 until maximum iteration has
reached.
7. Sort the particle based on their gbest value and
choose the first five feature.
The genetic operators likely selection, cross over and
mutation helps the PSO to overcome the difficulty to
fall in to local optima and helps the particle to fasten
WSEAS TRANSACTIONS on INFORMATION SCIENCE and APPLICATIONS J. B. Jona, N. Nagaveni
E-ISSN: 2224-3402 344 Issue 11, Volume 9, November 2012
the convergence of particle. The hybrid technique
reduced the 78 featured particle into best five
features.
2.4 Support Vector Machine (SVM)
Classification
SVM is a classification techniques based on
statistical learning theory developed by Vapnik et al.,
[14], [15]. The major advantage of SVM is that it
classifies the samples well in small training samples
in high dimensional space. SVM approach is also
known as Structural Risk Minimization (SRM) as it
produces the largest separation margin. SVM
learning algorithm takes two sets of feature vectors,
one for normal mammograms and other for abnormal
mammograms in a 78-dimensional feature space. It
constructs a separating hyperplane in the feature
space, which maximizes the margin between the two
data sets and find the support vectors that lies on this
hyperplane. During testing the sample can be
classified as normal class or abnormal class based on
the distance of the image to the separating
hyperplane.
Hyper planes are defines as w ∙ x = b where w and b
are weight and bias parameters respectively. For
training data (xi , yi), i = 1, 2,… , n are separated by
the hyperplanes:
𝑤 ∙ 𝑥 + 𝑏 = +1 𝑓𝑜𝑟 𝑦 = +1 (6)
𝑤 ∙ 𝑥 + 𝑏 = −1 𝑓𝑜𝑟 𝑦 = −1 (7)
where xi is the feature vector, yi is the output and can
be combined into one set of inequalities:
𝑦𝑖 𝑤 ∙ 𝑥𝑖 + 𝑏 ≥ 0 ∀𝑖 (8)
For a given training set, even though many
hyperplanes exist, SVM classifier maximizes the
separating margin between the two classes, the SVM
classifier is based on the hyperplane that maximizes
the separating margin between the two classes. This
hyperplane can be found by minimizing the margin
given by
𝑚𝑖𝑛𝑖𝑚𝑖𝑧𝑒 1
2 𝑤 2 (10)
𝑠𝑢𝑏𝑗𝑒𝑐𝑡 𝑡𝑜 𝑐𝑜𝑛𝑠𝑡𝑟𝑎𝑖𝑛𝑡𝑠 𝑦𝑖 𝑤 ∙ 𝑥𝑖 + 𝑏 (11)
All the problems are not linearly seperable, in case of
non linear-seperable problems the input vector is
mapped to a higher dimension feature space by the
non-linear function ϕ(xi) The kernel plays the role
of mapping the feature space to higher dimension.
The kernel function is defined as
𝑘 𝑥,𝑦 = 𝜙(𝑥)𝑖𝜙(𝑦)𝑖 (12)
The discriminant function of SVM using the Kernel
function is
f x = αiyiK xi , yi + b
n
i=1
(13)
where xi is the support vector, yi is the classification
output ( +1 for benign and -1 for malignant), αi and b
are quadratic programmimg coefficients. Radial
Basis Function Kernel (RBF) is used and it is defined
as:
K xi , xj = exp −γ xi − xj 2 , γ > 0 (14)
where , is kernel parameter.
3 Experimental Results and Discussion
3.1 Image Database
In this research, mammograms from the
Mammographic Image Analysis Society (MIAS), a
Mini Mammographic Database [16] is used. Each
mammogram image has a spatial resolution of
1024x1024 pixels. This database is chosen since it
contains various types of abnormalities such as
calcification, well-defined, circumscribed masses,
spiculated masses, ill-defined masses, architectural
distortion, asymmetry and normal. Each of these
abnormalities has been diagnosed and confirmed by a
biopsy.
3.2 Experimental Setup
The experiments implemented in MATLAB. These
techniques are experimented on 100 mammogram
images with various abnormalities, 50 abnormal
images with microcalcification, spiculation,
circumscribed and 50 normal mammogram images.
The following table (Table 2) shows the parameters
used in PSO and GA.
WSEAS TRANSACTIONS on INFORMATION SCIENCE and APPLICATIONS J. B. Jona, N. Nagaveni
E-ISSN: 2224-3402 345 Issue 11, Volume 9, November 2012
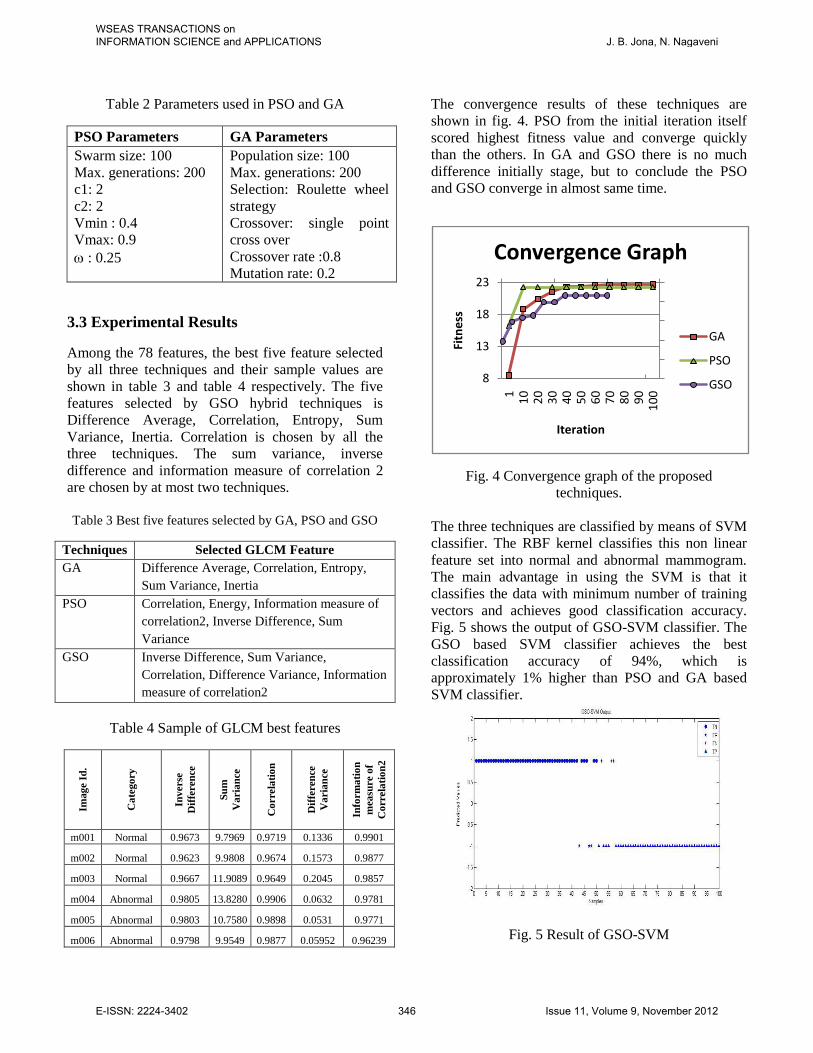
Table 2 Parameters used in PSO and GA
PSO Parameters GA Parameters
Swarm size: 100
Max. generations: 200
c1: 2
c2: 2
Vmin : 0.4
Vmax: 0.9
: 0.25
Population size: 100
Max. generations: 200
Selection: Roulette wheel
strategy
Crossover: single point
cross over
Crossover rate :0.8
Mutation rate: 0.2
3.3 Experimental Results
Among the 78 features, the best five feature selected
by all three techniques and their sample values are
shown in table 3 and table 4 respectively. The five
features selected by GSO hybrid techniques is
Difference Average, Correlation, Entropy, Sum
Variance, Inertia. Correlation is chosen by all the
three techniques. The sum variance, inverse
difference and information measure of correlation 2
are chosen by at most two techniques.
Table 3 Best five features selected by GA, PSO and GSO
Techniques Selected GLCM Feature
GA Difference Average, Correlation, Entropy,
Sum Variance, Inertia
PSO Correlation, Energy, Information measure of
correlation2, Inverse Difference, Sum
Variance
GSO Inverse Difference, Sum Variance,
Correlation, Difference Variance, Information
measure of correlation2
Table 4 Sample of GLCM best features
Imag
e Id
.
Ca
tego
ry
Inv
ers
e
Dif
feren
ce
Su
m
Va
ria
nce
Co
rre
lati
on
Dif
feren
ce
Va
ria
nce
Info
rm
ati
on
mea
sure
of
Co
rre
lati
on
2
m001 Normal 0.9673 9.7969 0.9719 0.1336 0.9901
m002 Normal 0.9623 9.9808 0.9674 0.1573 0.9877
m003 Normal 0.9667 11.9089 0.9649 0.2045 0.9857
m004 Abnormal 0.9805 13.8280 0.9906 0.0632 0.9781
m005 Abnormal 0.9803 10.7580 0.9898 0.0531 0.9771
m006 Abnormal 0.9798 9.9549 0.9877 0.05952 0.96239
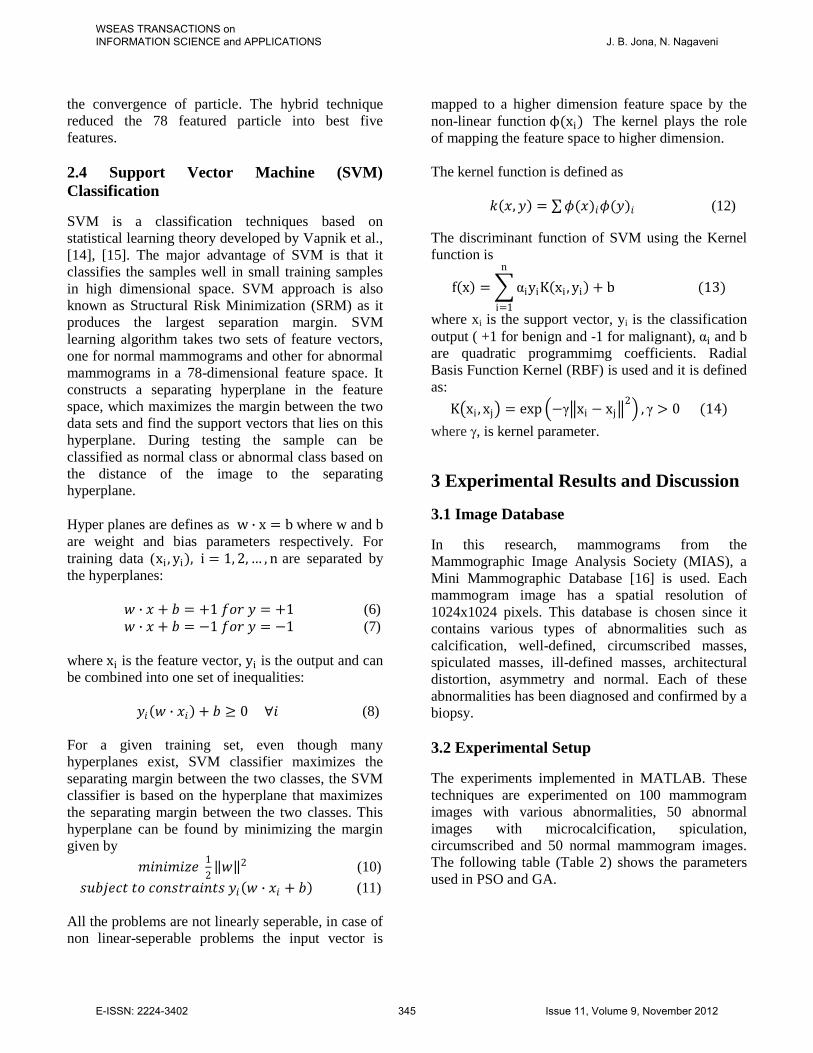
The convergence results of these techniques are
shown in fig. 4. PSO from the initial iteration itself
scored highest fitness value and converge quickly
than the others. In GA and GSO there is no much
difference initially stage, but to conclude the PSO
and GSO converge in almost same time.
Fig. 4 Convergence graph of the proposed
techniques.
The three techniques are classified by means of SVM
classifier. The RBF kernel classifies this non linear
feature set into normal and abnormal mammogram.
The main advantage in using the SVM is that it
classifies the data with minimum number of training
vectors and achieves good classification accuracy.
Fig. 5 shows the output of GSO-SVM classifier. The
GSO based SVM classifier achieves the best
classification accuracy of 94%, which is
approximately 1% higher than PSO and GA based
SVM classifier.
Fig. 5 Result of GSO-SVM
8
13
18
23
11
02
03
04
05
06
07
08
09
01
00
Fitn
ess
Iteration
Convergence Graph
GA
PSO
GSO
WSEAS TRANSACTIONS on INFORMATION SCIENCE and APPLICATIONS J. B. Jona, N. Nagaveni
E-ISSN: 2224-3402 346 Issue 11, Volume 9, November 2012
Three mammograms which really contains
abnormality is wrongly predicted as normal (FP) and
three mammograms which is normal is misclassifies
ad abnormal (FN). The confusion matrices are build
form the results of classification and are shown in
table 5c. Based on this confusion matrix the
sensitivity, specificity and accuracy are calculated.
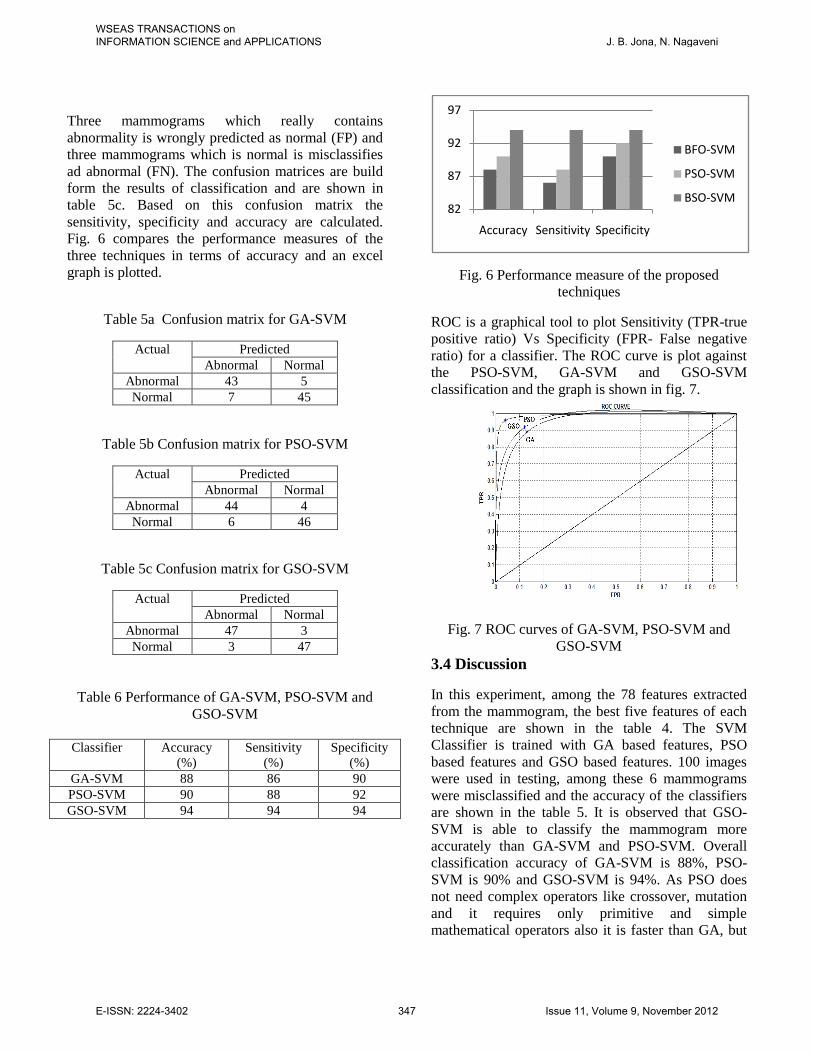
Fig. 6 compares the performance measures of the
three techniques in terms of accuracy and an excel
graph is plotted.
Table 5a Confusion matrix for GA-SVM
Actual Predicted
Abnormal Normal
Abnormal 43 5
Normal 7 45
Table 5b Confusion matrix for PSO-SVM
Actual Predicted
Abnormal Normal
Abnormal 44 4
Normal 6 46
Table 5c Confusion matrix for GSO-SVM
Actual Predicted
Abnormal Normal
Abnormal 47 3
Normal 3 47
Table 6 Performance of GA-SVM, PSO-SVM and
GSO-SVM
Classifier Accuracy
(%)
Sensitivity
(%)
Specificity
(%)
GA-SVM 88 86 90
PSO-SVM 90 88 92
GSO-SVM 94 94 94
Fig. 6 Performance measure of the proposed
techniques
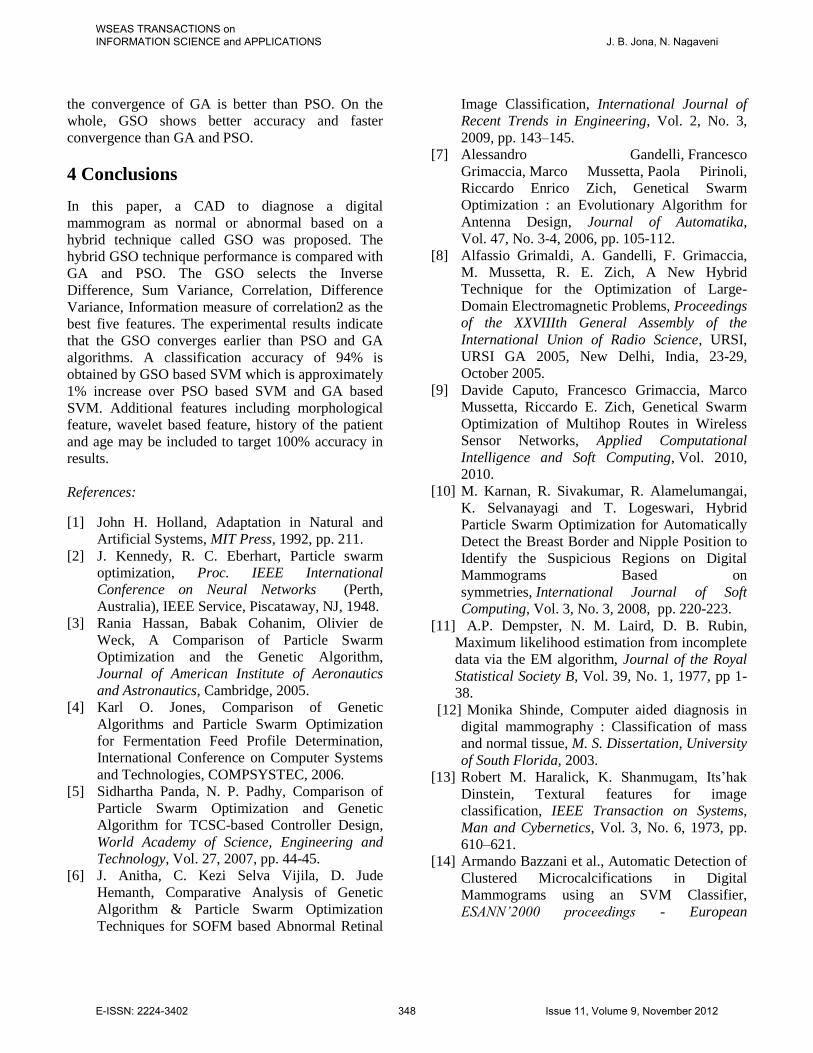
ROC is a graphical tool to plot Sensitivity (TPR-true
positive ratio) Vs Specificity (FPR- False negative
ratio) for a classifier. The ROC curve is plot against
the PSO-SVM, GA-SVM and GSO-SVM
classification and the graph is shown in fig. 7.
Fig. 7 ROC curves of GA-SVM, PSO-SVM and
GSO-SVM
3.4 Discussion
In this experiment, among the 78 features extracted
from the mammogram, the best five features of each
technique are shown in the table 4. The SVM
Classifier is trained with GA based features, PSO
based features and GSO based features. 100 images
were used in testing, among these 6 mammograms
were misclassified and the accuracy of the classifiers
are shown in the table 5. It is observed that GSO-
SVM is able to classify the mammogram more
accurately than GA-SVM and PSO-SVM. Overall
classification accuracy of GA-SVM is 88%, PSO-
SVM is 90% and GSO-SVM is 94%. As PSO does
not need complex operators like crossover, mutation
and it requires only primitive and simple
mathematical operators also it is faster than GA, but
82
87
92
97
Accuracy Sensitivity Specificity
BFO-SVM
PSO-SVM
BSO-SVM
WSEAS TRANSACTIONS on INFORMATION SCIENCE and APPLICATIONS J. B. Jona, N. Nagaveni
E-ISSN: 2224-3402 347 Issue 11, Volume 9, November 2012
the convergence of GA is better than PSO. On the
whole, GSO shows better accuracy and faster
convergence than GA and PSO.
4 Conclusions
In this paper, a CAD to diagnose a digital
mammogram as normal or abnormal based on a
hybrid technique called GSO was proposed. The
hybrid GSO technique performance is compared with
GA and PSO. The GSO selects the Inverse
Difference, Sum Variance, Correlation, Difference
Variance, Information measure of correlation2 as the
best five features. The experimental results indicate
that the GSO converges earlier than PSO and GA
algorithms. A classification accuracy of 94% is
obtained by GSO based SVM which is approximately
1% increase over PSO based SVM and GA based
SVM. Additional features including morphological
feature, wavelet based feature, history of the patient
and age may be included to target 100% accuracy in
results.
References:
[1] John H. Holland, Adaptation in Natural and
Artificial Systems, MIT Press, 1992, pp. 211.
[2] J. Kennedy, R. C. Eberhart, Particle swarm
optimization, Proc. IEEE International
Conference on Neural Networks (Perth,
Australia), IEEE Service, Piscataway, NJ, 1948.
[3] Rania Hassan, Babak Cohanim, Olivier de
Weck, A Comparison of Particle Swarm
Optimization and the Genetic Algorithm,
Journal of American Institute of Aeronautics
and Astronautics, Cambridge, 2005.
[4] Karl O. Jones, Comparison of Genetic
Algorithms and Particle Swarm Optimization
for Fermentation Feed Profile Determination,
International Conference on Computer Systems
and Technologies, COMPSYSTEC, 2006.
[5] Sidhartha Panda, N. P. Padhy, Comparison of
Particle Swarm Optimization and Genetic
Algorithm for TCSC-based Controller Design,
World Academy of Science, Engineering and
Technology, Vol. 27, 2007, pp. 44-45.
[6] J. Anitha, C. Kezi Selva Vijila, D. Jude
Hemanth, Comparative Analysis of Genetic
Algorithm & Particle Swarm Optimization
Techniques for SOFM based Abnormal Retinal
Image Classification, International Journal of
Recent Trends in Engineering, Vol. 2, No. 3,
2009, pp. 143–145.
[7] Alessandro Gandelli, Francesco
Grimaccia, Marco Mussetta, Paola Pirinoli,
Riccardo Enrico Zich, Genetical Swarm
Optimization : an Evolutionary Algorithm for
Antenna Design, Journal of Automatika,
Vol. 47, No. 3-4, 2006, pp. 105-112.
[8] Alfassio Grimaldi, A. Gandelli, F. Grimaccia,
M. Mussetta, R. E. Zich, A New Hybrid
Technique for the Optimization of Large-
Domain Electromagnetic Problems, Proceedings
of the XXVIIIth General Assembly of the
International Union of Radio Science, URSI,
URSI GA 2005, New Delhi, India, 23-29,
October 2005.
[9] Davide Caputo, Francesco Grimaccia, Marco
Mussetta, Riccardo E. Zich, Genetical Swarm
Optimization of Multihop Routes in Wireless
Sensor Networks, Applied Computational
Intelligence and Soft Computing, Vol. 2010,
2010.
[10] M. Karnan, R. Sivakumar, R. Alamelumangai,
K. Selvanayagi and T. Logeswari, Hybrid
Particle Swarm Optimization for Automatically
Detect the Breast Border and Nipple Position to
Identify the Suspicious Regions on Digital
Mammograms Based on
symmetries, International Journal of Soft
Computing, Vol. 3, No. 3, 2008, pp. 220-223.
[11] A.P. Dempster, N. M. Laird, D. B. Rubin,
Maximum likelihood estimation from incomplete
data via the EM algorithm, Journal of the Royal
Statistical Society B, Vol. 39, No. 1, 1977, pp 1-
38.
[12] Monika Shinde, Computer aided diagnosis in
digital mammography : Classification of mass
and normal tissue, M. S. Dissertation, University
of South Florida, 2003.
[13] Robert M. Haralick, K. Shanmugam, Its’hak
Dinstein, Textural features for image
classification, IEEE Transaction on Systems,
Man and Cybernetics, Vol. 3, No. 6, 1973, pp.
610–621.
[14] Armando Bazzani et al., Automatic Detection of
Clustered Microcalcifications in Digital
Mammograms using an SVM Classifier,
ESANN’2000 proceedings - European
WSEAS TRANSACTIONS on INFORMATION SCIENCE and APPLICATIONS J. B. Jona, N. Nagaveni
E-ISSN: 2224-3402 348 Issue 11, Volume 9, November 2012
Symposium on Artificial Neural Networks,
Bruges (Belgium), 2000, pp. 195-200.
[15] Issam El-Naqa, Yongyi Yang, Miles N.
Wernick, Nikolas, P. Galatsanos, Robert M.
Nishikawa, A Support Vector Machine
Approach for Detection of Microcalcifications,
IEEE Trans. Med. Imaging, Vol. 21, No. 12,
2002, pp. 1552-1563.
[16] The mini-MIAS database of mammograms,
Organizer: J. Suckling, Available:
http://peipa.essex.ac.uk
WSEAS TRANSACTIONS on INFORMATION SCIENCE and APPLICATIONS J. B. Jona, N. Nagaveni
E-ISSN: 2224-3402 349 Issue 11, Volume 9, November 2012