a human capital framework for inclusion in company …
TRANSCRIPT
A HUMAN CAPITAL FRAMEWORK FOR INCLUSION IN COMPANY ANNUAL REPORTS
A South African Perspective
Reuphillan Kasselman
Submitted in partial fulfilment of the requirements
for the degree PhD: Organisational Behaviour
in the Faculty of Economic and Business Sciences,
University of Pretoria, Pretoria
Study leader: Prof. C. Hoole
21/03/2006
UUnniivveerrssiittyy ooff PPrreettoorriiaa eettdd –– KKaasssseellmmaann,, RR ((22000066))

University of Pretoria Kasselman, R
(2006)
ii
DECLARATION
I hereby declare that “A HUMAN CAPITAL FRAMEWORK FOR INCLUSION IN COMPANY
ANNUAL REPORTS - A South African Perspective” is my own work and that all the sources used by
be and referred to in this regard has been duly acknowledged and listed.
I also declare that the content of this thesis has not been, nor will be, handed in for any other
qualification at any other tertiary institution.
The language in this dissertation was edited by Melody Edwards.
__________________ _________________
Reuphillan Kasselman April 2006_
UUnniivveerrssiittyy ooff PPrreettoorriiaa eettdd –– KKaasssseellmmaann,, RR ((22000066))

University of Pretoria Kasselman, R
(2006)
iii
ACKNOWLEDGEMENTS
I would like to express my sincere thanks, appreciation and gratitude to:
My study leader, Professor Crystal Hoole, for her advice, encouragement, many reviews and belief
in my abilities.
Dr Denise Du Toit for her encouragement and willingness to listen patiently to my ideas.
The respondents and consultants for their time and input, especially Frik Reynecke for keeping me in
mind and passing on relevant information continuously and Deloitte for the access to knowledge and
insights as well as the original framework (Enterprise Value Map) which helped form the study and
structure.
My husband, Hennie, for the help with the database, his patience with the long hours and mostly for
his support and encouragement.
My children, Allan and Keith for understanding, but mostly for being my source of strength driving me
to complete such a demanding task.
Thank you.
To God all the glory for blessing me with the talent to add value in this and in so many other ways.
UUnniivveerrssiittyy ooff PPrreettoorriiaa eettdd –– KKaasssseellmmaann,, RR ((22000066))

University of Pretoria Kasselman, R
(2006)
iv
ABSTRACT
A company’s ability to support its business strategy with it’s Human Capital is an important indication
of the company’s future business performance. No standard or framework to enable the inclusion of
Human Capital information in company reporting to demonstrate the effect on performance currently
exists.
Traditional HR metrics fail to report on the level of performance, knowledgebase or value of Human
Capital, making it virtually impossible for stakeholders or valuators of companies to take this most
important asset into account in valuing the company against it’s competitors.
This exploratory study has been commissioned to add new theory which would span further research
with the objective of improving the reporting systems and/or methodologies to value Human Capital
for South African industry.
The study poses the following questions:
1. What insight should investors and other external stakeholders have into the Human Capital
employed by a specific organisation?
2. How best to ensure that Human Capital is reported and the information is trusted by investors and
other stakeholders as seen as relevant, reliable and consistent, adding value to shareholders?
3. Which Human Resource Management components can form a basis for comparative external
reporting on Human Capital (if any)?
The study created an innovative framework for reporting which, is viewed as an improved, practical
and theoretical approach and method relating to Human Capital and value creation for Human
Assets.
Triangulation was used to include a number of different metrics used by HR, linked to a framework
that allows those who uses it to link quantitative calculations to Human Capital dimensions. Further
UUnniivveerrssiittyy ooff PPrreettoorriiaa eettdd –– KKaasssseellmmaann,, RR ((22000066))

University of Pretoria Kasselman, R
(2006)
v
testing may be required due to the limited insight and knowledge of current practitioners which may
have skewed some of the results.
This framework also links to a number of business questions and metrics which in turn, link to
broader HR strategic themes and recommendations for reporting as part of company annual reports
and which Human Capital aspects should be included as standard in such a report.
The study provides Human Resource practitioners with the ability to counter the one-sidedness of
viewing people as purely costs, demonstrating the value of Human Assets in quantitative terms.
UUnniivveerrssiittyy ooff PPrreettoorriiaa eettdd –– KKaasssseellmmaann,, RR ((22000066))
University of Pretoria Kasselman, R
(2006)
vi
TABLE OF CONTENTS
DECLARATION II
ACKNOWLEDGEMENTS III
ABSTRACT IV
LIST OF TABLES XI
LIST OF FIGURES XII
LIST OF EQUATIONS XIII
CHAPTER 1 - THE PROBLEM AND ITS CONTEXT 1
1.1 Introduction 1 1.2 Need for research in this field 2 1.3 Problem Statement and Objectives 3
1.3.1 Problem Statement 5 1.3.2 Objectives of this research 5
1.4 Conclusion 6
CHAPTER 2 - LITERATURE REVIEW 7
2.1 Introduction 7 2.2 Studies focused on HR Practices linked to business success 8 2.3 Key Theoretical Concepts 13
2.3.1 Invisible (Intangible) Assets 15 2.3.2 Intellectual Capital (IC) 17 2.3.3 Human Capital (HC) 18 2.3.4 Human Assets 19 2.3.5 Value Based Management 22 2.3.6 Employee Relations Management Solutions 24
2.4 Company Reporting 26 2.4.1 Elements of Financial Statements 29 2.4.2 Reporting Non-Financial Measures 32
2.5 Measuring Shareholder Value 33 2.5.1 Enterprise Value Map (EVM) 34
UUnniivveerrssiittyy ooff PPrreettoorriiaa eettdd –– KKaasssseellmmaann,, RR ((22000066))
University of Pretoria Kasselman, R
(2006)
vii
2.6 Reporting (Accounting) for Human Capital 36 2.6.1 Universal (Best Practices) Approach 37 2.6.2 Reporting Human Capital Measures 38
2.7 Measuring Human Capital 39 2.7.1 Human Capital ROI 40 2.7.2 Human Capital Index (HCI) 42
2.7.2.1 Simple HC Index 42 2.7.2.2 Complex HC Index 42
2.7.3 Best Investment in Human Capital (BIHC) 43 2.7.4 Balanced Scorecard (BSC) 43 2.7.5 HR Scorecard 45
2.8 Measuring Intellectual Capital 51 2.8.1 Intellectual Capital (IC) Index 52 2.8.2 EFQM Excellence Model (EFQM) 52 2.8.3 People Value Add (PVA) 53
2.8.3.1 Economic Value Add (EVA) 53 2.9 Measuring Intangibles 54
2.9.1 Skandia Navigator / Intangible Assets Monitor 57 2.10 Valuing Assets 61
2.10.1 Calculated Intangible Value Method (CIV) 62 2.11 Measuring Human Assets 63
2.11.1 Individual Human Asset Worth 63 2.11.2 Collective Human Asset Worth 67
2.12 Selected International Case Studies 69 2.13 Arguments against Accounting for Human Capital 75 2.14 Conclusion 77
CHAPTER 3 - RESEARCH METHODOLOGY 80
3.1 Introduction 80 3.2 Theory 82 3.3 Detail of the chosen procedure 83 3.4 Reasoning 86 3.5 Participants and Sampling 87 3.6 Target Groups 87
3.6.1 Executives and Senior HR Managers 88 3.6.2 HR Consultants and Students 89 3.6.3 Auditors 89 3.6.4 Human Capital Specialists 90
UUnniivveerrssiittyy ooff PPrreettoorriiaa eettdd –– KKaasssseellmmaann,, RR ((22000066))

University of Pretoria Kasselman, R
(2006)
viii
3.7 Data Collection 91 3.7.1 Case Studies 91 3.7.2 Semi-structured Interviews with Executives and Senior HR Managers 91 3.7.3 Interviews 92 3.7.4 Surveys (Questionnaires) 93
3.7.4.1 Survey methodology 94 3.7.5 Delphi Technique 94
3.8 Data Analyses 96 3.9 Conclusion 97
CHAPTER 4 - RESULTS AND DISCUSSIONS 98
4.1 Introduction 98 4.2 Current situation - Human Capital Value Add 99
4.2.1 Findings 99 4.2.1.1 Category 1: Human Resource Management Today 99 4.2.1.2 Category 2: Reporting key indicators - Internally and Externally 100 4.2.1.3 Category 3: Technology Systems utilised for Human Capital Management (HCM) 103
4.2.2 Lessons learned and considerations 105 4.3 Reporting on Human Capital 105
4.3.1 Findings 106 4.3.1.1 Category 1: Most important indicators 106 4.3.1.2 Category 2: HR reports that support and/or enable business decisions 110
4.3.2 Lessons learned and considerations 112 4.4 Using Metrics and Benchmarking 112
4.4.1 Findings 113 4.4.2 Lessons learned and considerations 117
4.5 Comparative External Reporting on Human Capital 117 4.5.1 Findings 118
4.5.1.1 Category 1: Is it essential to share strategic information with all stakeholders? 118 4.5.2 Lessons learned and considerations 122
4.6 Further results of semi-structured interviews 123 4.6.1 Preferred Employer / Employer of Choice Status 123
4.7 Conclusion 124
CHAPTER 5 PROPOSED FRAMEWORK 127
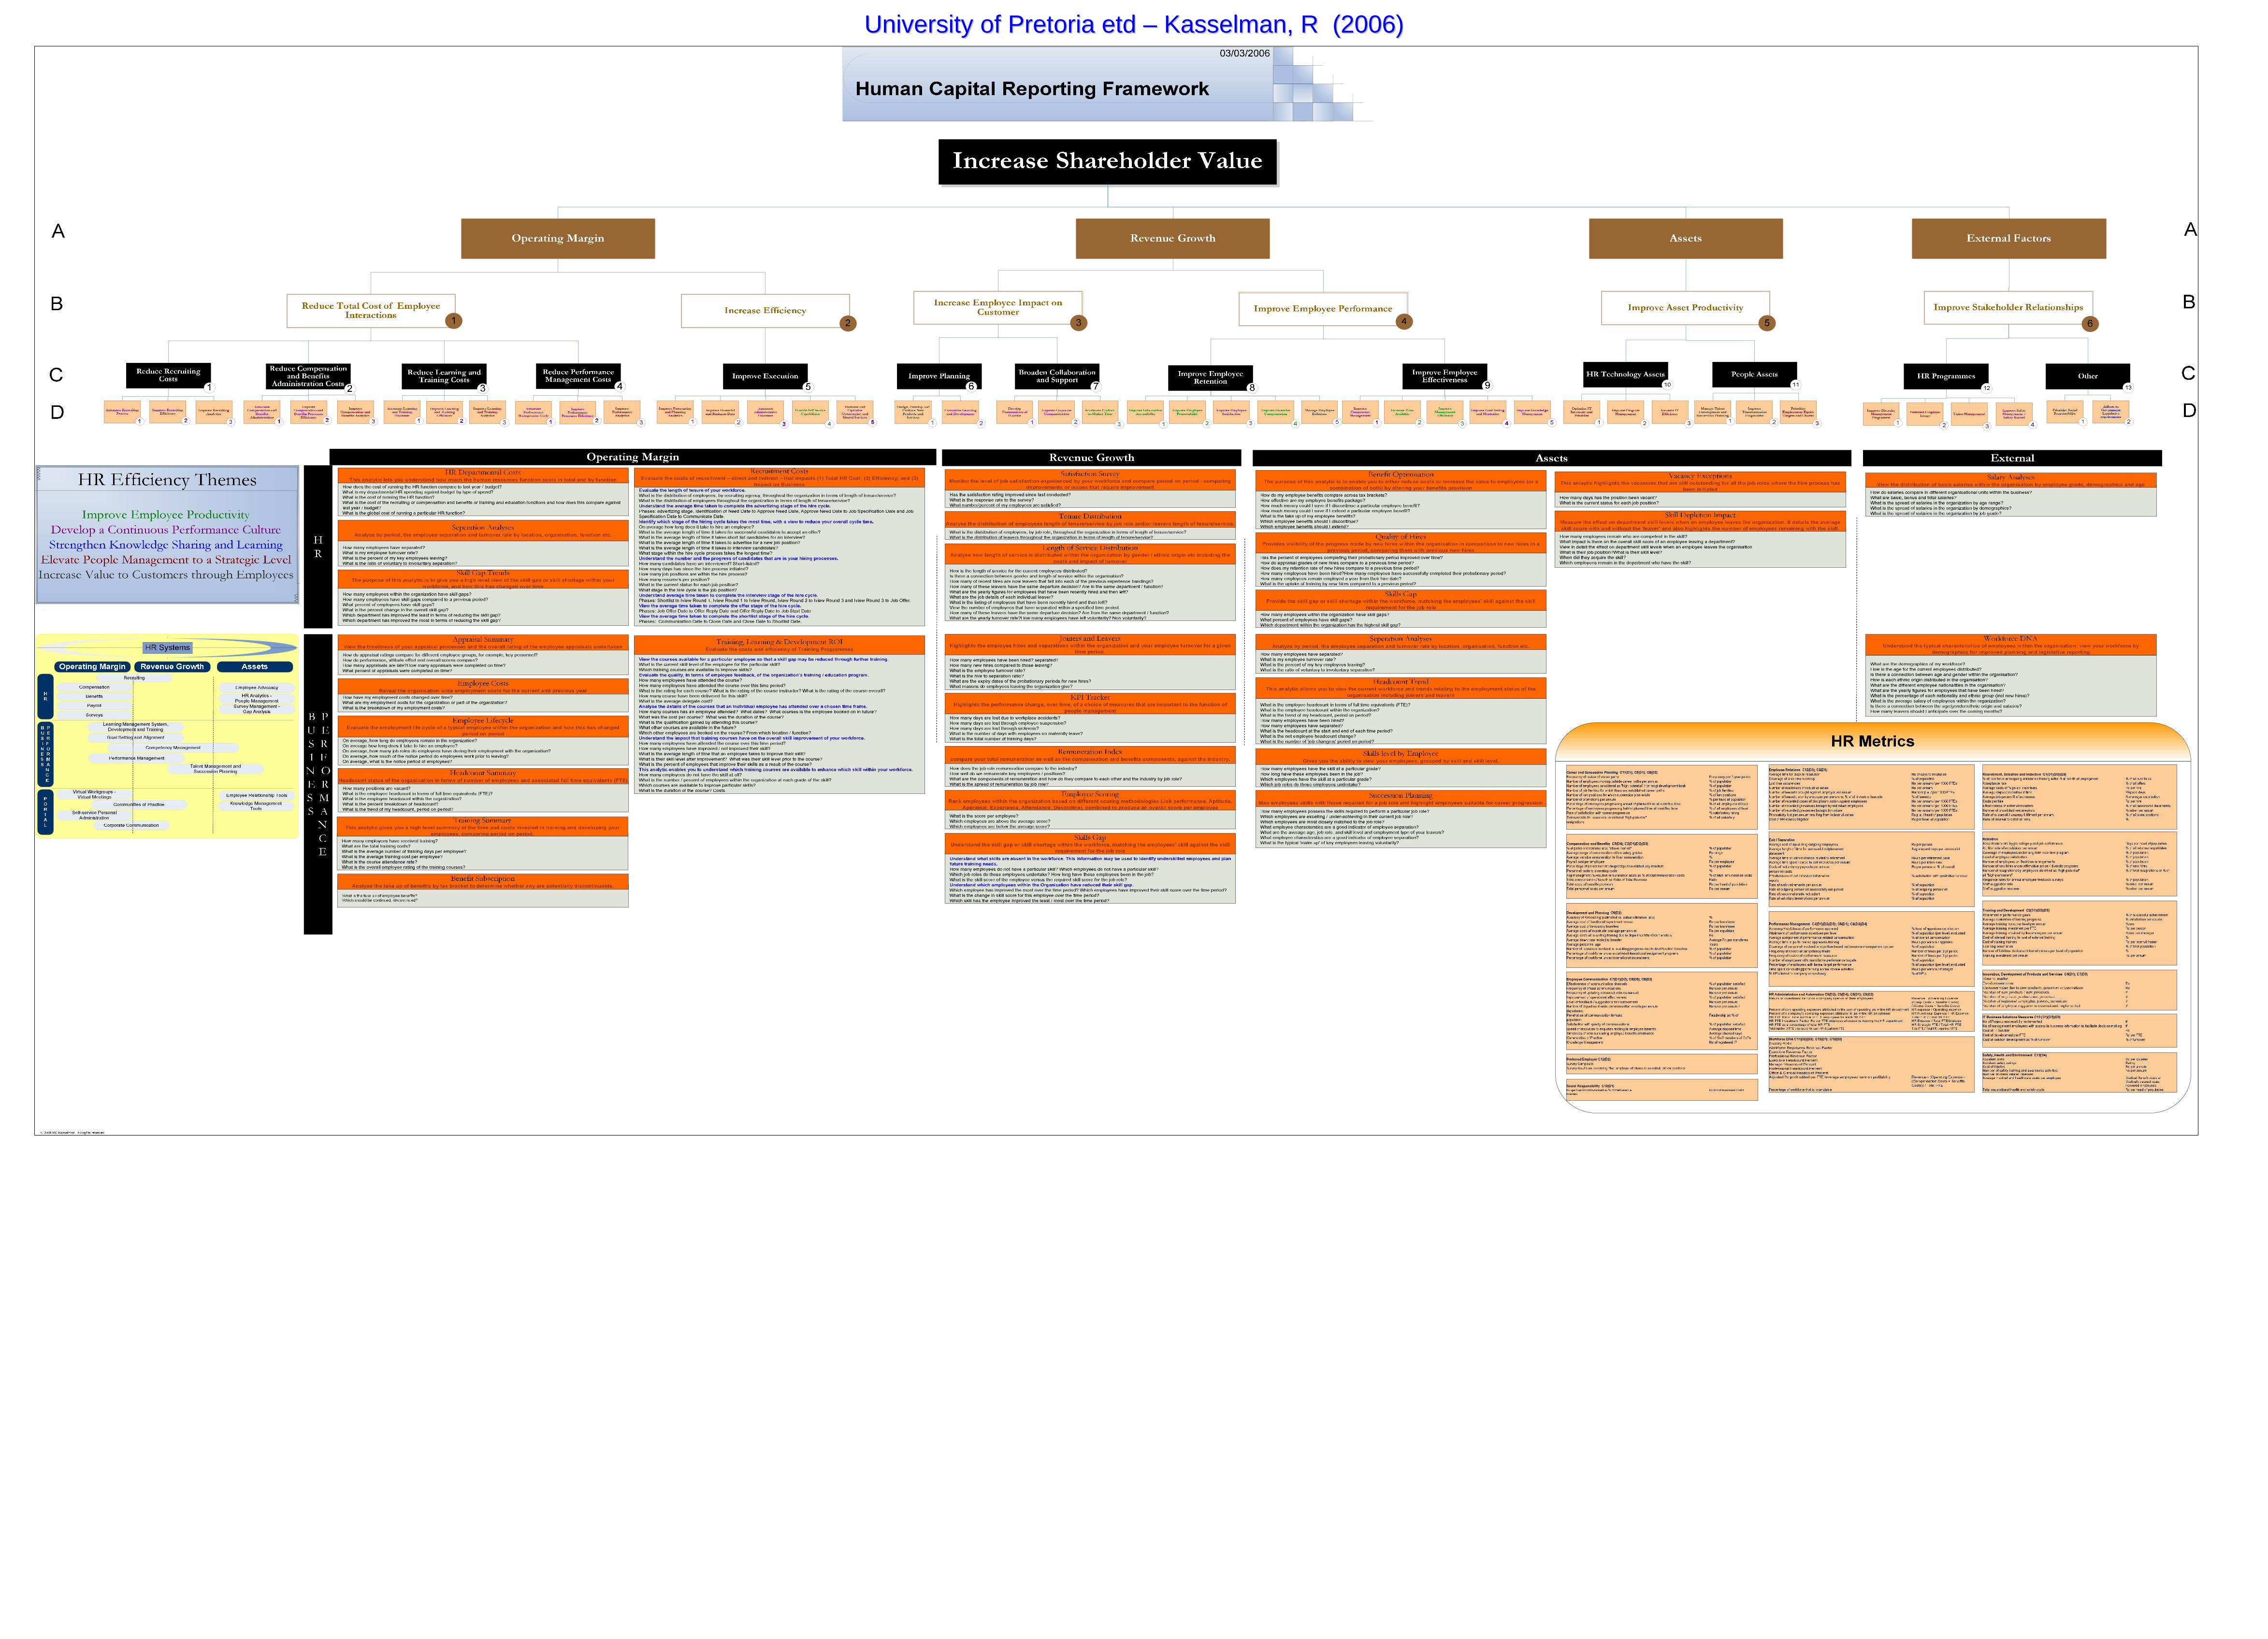
5.1 Introduction 127 5.2 Methodology for the Framework 128 5.3 Framework for HR 128 5.4 Proposed Framework 130
UUnniivveerrssiittyy ooff PPrreettoorriiaa eettdd –– KKaasssseellmmaann,, RR ((22000066))

University of Pretoria Kasselman, R
(2006)
ix
5.4.1 Operating Margin (A1) 133 5.4.1.1 Reduce total cost of employee interactions (B1) 133 5.4.1.2 Increase efficiency (B2) 134
5.4.2 Revenue Growth (A2) 135 5.4.2.1 Increase employee’s impact on customer 135 5.4.2.2 Improve employee performance (B4) 137 5.4.2.3 Improve asset productivity (B5) 138 5.4.2.4 Technology Assets (C10) 138
5.4.3 External Factors 139 5.5 Using the Framework 140
CHAPTER 6 - PROPOSED HUMAN CAPITAL REPORTING (BUSINESS QUESTIONS) 141
6.1 Introduction 141 6.2 Human Capital / Human Resources Business Questions 143
6.2.1 Internal reports linked to bottom line 143 6.3 External Reports 174 6.4 Performance Metrics 175 6.5 Conclusion 181
CHAPTER 7 – REPORTING HUMAN CAPITAL IN COMPANY ANNUAL REPORTS 182
7.1 Introduction 182 7.2 Principles for Reporting 183
7.2.1 Principles 183 7.2.2 Features of the report 184
7.3 Company Annual Report 185 7.4 Conclusion 187
CHAPTER 8 - CONCLUSIONS AND RECOMMENDATIONS 188
8.1 Introduction 188 8.2 Expected impact of results 192 8.3 Contributions of the present study 194 8.4 Recommendations for future work 195 8.5 Limitations of the present study 196
ADDENDUM A - TERMS AND DEFINITIONS 197
ADDENDUM B - DELPHI WORKSHOP RESULTS 203
UUnniivveerrssiittyy ooff PPrreettoorriiaa eettdd –– KKaasssseellmmaann,, RR ((22000066))

University of Pretoria Kasselman, R
(2006)
x
LIST OF REFERENCES 210
APPENDICES 221
UUnniivveerrssiittyy ooff PPrreettoorriiaa eettdd –– KKaasssseellmmaann,, RR ((22000066))

University of Pretoria Kasselman, R
(2006)
xi
List of Tables
Table 1: Key Methods / Models for measurement 15 Table 2: Key Indicators 103 Table 3 HR Reporting 113 Table 4: Top Most Important Indicators (Metrics) 116 Table 5: Information readily available and shared with stakeholders 119 Table 6: Additional Information considered essential by auditors 120 Table 7: Information to be shared externally 121 Table 8: Effectiveness of HR Contributions - Boudreau (1998) 143 Table 9: Business Questions - adapted from SAP (2003) 173 Table 10: Key Indicators Reported Externally 174 Table 11: HR Reporting Principles 184
UUnniivveerrssiittyy ooff PPrreettoorriiaa eettdd –– KKaasssseellmmaann,, RR ((22000066))

University of Pretoria Kasselman, R
(2006)
xii
List of Figures
Figure 1: The European Business Excellence Model – EFQM Website: http://www.efqm.org (2005)
10 Figure 2: Fit–Cost–Value™ framework – Arthur Anderson (1998) 12 Figure 3: WM-data Intangible Assets per share - WM-data Annual Report (1995) 16 Figure 4: Shareholder Value Map, adapted from Deloitte (2003) 36 Figure 5: Gratton’s Causal Model - Gratton (2000) 39 Figure 6: A Human Capital Income Statement Fitz-End (2002) 41 Figure 7: Transforming the HR Architecture into a Strategic Asset - Becker et al. (2001) 46 Figure 9: HR and Strategy Implementation - Becker et al. (2001) 47 Figure 11: Intersection of HR with Strategy Map - Becker et al. (2001) 49 Figure 12: The Creation of Employee Strategic Focus through Increasing Measurement
Sophistication - Becker et al. (2001) 50 Figure 13: Invisible Assets Measuring Models - adapted from Sveiby (1997) 57 Figure 14: Skandia Framework – Edvidsson (in Anon, 1992) 57 Figure 15: Intangible Assets Monitor - Mayo (2001) 58 Figure 16: Human Capital Monitor – Mayo (2001) 59 Figure 17: Intangible assets as a percentage of tangible assets – Value Line Publishing (1998) 63 Figure 18: Research Process (author’s own) 82 Figure 19: Research Methods (author’s own) 83 Figure 20: Steps followed in Research Methodology 86 Figure 21: Executives and Senior Managers Respondents by Industry 88 Figure 22: Auditors - Group Age Distribution 89 Figure 23: Auditors – Number of years in position 90 Figure 24: Specialists Education and Experience 91 Figure 25: Usage of Technology Systems 104 Figure 26: Top Most Important Indicators (Reports) 106 Figure 27: Balance Scorecard Example 108 Figure 28: Median responses for all metrics evaluated 116 Figure 29: Proposed Framework 130 Figure 30: Operating Margin 133 Figure 31: Revenue Growth 135 Figure 32: Service Profit Chain – adapted from Heskett et al., (1994) 136
UUnniivveerrssiittyy ooff PPrreettoorriiaa eettdd –– KKaasssseellmmaann,, RR ((22000066))

University of Pretoria Kasselman, R
(2006)
xiii
Figure 33: Assets 137 Figure 34: External Factors 139 Figure 35: Example HC Corporate Report 186
List of Equations
Equation 1: Sveiby’s leverage effect formula – Sveiby (1997) 60
UUnniivveerrssiittyy ooff PPrreettoorriiaa eettdd –– KKaasssseellmmaann,, RR ((22000066))
UUnniivveerrssiittyy ooff PPrreettoorriiaa eettdd –– KKaasssseellmmaann,, RR ((22000066))

University of Pretoria Kasselman, R
(2006)
1
CHAPTER 1 - THE PROBLEM AND ITS CONTEXT
Cliché: Our people are our greatest asset
Fact: People costs constitute up to 65% of company costs Reality: Very little strategic reporting on people - Human Assets- in private or public sectors
1.1 Introduction
Very few of the important aspects of an organisation in the 21st century can be measured objectively.
Industry information around products, services, distribution channels and even strategies are widely
available and no longer considered a competitive advantage, leaving the “fuzzy” items such as
culture and people. Traditional HR metrics, however fail to report on the level of performance,
knowledgebase or value of their Human Capital, making it virtually impossible for stakeholders or
valuators of companies to take this most important asset - Human Resources - into account in
valuing the company against its competitors. In today’s economy, an organisation’s success is the
product the competence of the people within the organisation. It is this value added by the people of
the organisation which should be visible and available to all stakeholders.
Peter Drucker (1993:8) wrote “The basic economic resource - ‘the means of production’ to use the
economist’s term - is no longer capital, nor natural resources (the economist’s ‘land’), nor ‘labour.’ It
is and will be knowledge”. He also stated in another publication a few years later “The most valuable
asset of a 21st century institution, whether business or non-business, will be its knowledge workers
and their productivity” (Drucker, 1999:135).
A company’s ability to support its business strategies with Human Capital is an important indication
of the company’s future business performance. It cannot be denied that human issues and their
effect on the organisation provide useful information for stakeholders; however, no standard or
framework to enable the inclusion of this information in company reporting currently exists in South
Africa, or even globally.
UUnniivveerrssiittyy ooff PPrreettoorriiaa eettdd –– KKaasssseellmmaann,, RR ((22000066))

University of Pretoria Kasselman, R
(2006)
2
Human Capital metrics as a construct not only embraces Human Capital performance-capacity
factors that are immediately apparent to the short-term success of the organisation, but also the
long-term strategic imperative issues critical to transcendental accomplishments of the enterprise
(Gilley, Callahan & Bierema, 2003) The objective of company reports is “a method to communicate
economic measurements and information about the performance of the organisation to the
stakeholders of the organisation” (Le Clerc, Moynagh & Boisclair, 1996), yet this very important
component - especially in today’s knowledge economy - is not included in such reports.
Most executives would agree with the statement that Human Resource Management has an impact
on the company’s’ bottom line and that Human Resources are the most valuable resource a
company has. Many will even admit that measuring and reporting Human Capital can lead to the
improvement of competitiveness of the organisation and add to the bottom line; however, when
asked how or what needs to be measured or reported on, even HR Executives seem to be unclear.
A view by Dr Greg Wang of Performtech LLC, confirms that investment in Human Capital will occur at
two levels: “People cannot be treated as assets because assets will depreciate over time. But the
value of people will appreciate with accumulated experience and organisation development
strategies. Employees are the organisation’s investors. Employees as investors are expecting an
increased return from their investment. This is not only in the form of salary and benefits, but also in
individual competency, development, and career growth” (Wang, 2002).
In their book, The HR Scorecard, (Becker, Huselid & Ulrich, 2001) states that, according to Lawrence
R. Whitman, deputy CFO at GTE, “Once we are able to measure intangible assets more accurately,
I think investors and finance professionals will begin to look at Human Capital metrics as another
indicator of a company’s value” (Becker et al., 2001). Accounting systems used today were
developed for financial and physical assets, and considered the main source of company’s value,
thus access to money and equipment provides companies with the greatest competitive advantage
whilst intangible assets are treated as expenses rather than investments, which in today’s economy
shouts out at inaccuracy.
1.2 Need for research in this field
There is increasing evidence from both consultants and academics that Human Capital practices are
linked to competitiveness and performance, measured through shareholder value with a noticeable
increase in international scientific research on this type of study (Becker et al., 2001; Fitz-end, 2000;
UUnniivveerrssiittyy ooff PPrreettoorriiaa eettdd –– KKaasssseellmmaann,, RR ((22000066))

University of Pretoria Kasselman, R
(2006)
3
Drucker, 1999; and Becker, 1994). This study has been commissioned as an attempt to add new
theory which would span further research with the objective to improve the reporting systems and/or
methodologies to value Human Capital for South African industry.
The study touches on the broader topic of intangible assets, however, it focuses on the most
important asset in the company of the 21st century: Human Assets. The study provides a framework
that allows for the quantification and extraction of the value of Human Assets in an organisation. It
should initiate further research in this field as many of the intangible assets which have an effect on
the bottom line of companies are not accurately being reported.
The focus of this study is thus to create an innovative framework for reporting which, as it’s outcome,
should be viewed as an attempt to establish an improved, practical and theoretical approach and
method relating to Human Capital and value creation for Human Assets in organisations.
1.3 Problem Statement and Objectives
Investors, partners and shareholders as well as the public require information regarding the
long-term sustainability of a company’s performance. Employees need to understand the
company’s sustainability to increase motivation and commitment to assist in developing their own
careers. This requires that the value of Human Capital and the related value of Human Assets is
reported accurately and fairly. More importantly, the information needs to be trusted to be relevant,
reliable, consistent and complete.
The King II Report (2004) on Corporate Governance in South Africa recommends that management
accounting should, as a matter of best management practice, reflect requirements of Human Capital
development. This implies that companies should lay out, in publicly reported accounts, the
principles, standards and goals adopted for the development of their Human Capital, making
appropriate reference to the accounting policies adopted to support adherence to them.
Furthermore, King II recognises that the development of Human Capital does not only serve the
economic interests of the company, but also serves the requirements of the society within which the
company operates.
The reporting of intangibles such as Human Capital is certainly no easy task. According to Huselid
(1995), this is because of two major issues:
UUnniivveerrssiittyy ooff PPrreettoorriiaa eettdd –– KKaasssseellmmaann,, RR ((22000066))

University of Pretoria Kasselman, R
(2006)
4
1. No common framework that goes beyond historical measures to provide more detailed
information on workforce quality and;
2. Many companies lack the infrastructure and information that can give strong, relevant and audited
information to stakeholders.
Reporting systems are limited in several ways (Walker, 1996), including:
• GAAP (Generally Accepted Accounting Principles ) rules;
• Measurements expressed in monetary values;
• Categories included in the COA (chart of accounts);
• Lack of predictive power;
• Rewarding of the wrong behaviour; and
• High levels of aggregation of information.
Since the introduction of the first internal reporting model for Intellectual Capital, a number of
methodologies have been developed to help organisations assess and monitor their Human Capital
as part of a broader evaluation of Intellectual Capital or on their own. Examples of the more
well-known approaches include HR Scorecard, Skandia Navigator/IC index, EFQM Excellence
Model, and the Economic Value Added/Saratoga Institute approaches.
A study by Deloitte & Touche Human Capital ROI (Brown, 2002) answers this question by measuring
Human Capital practices and linking them to corporate financial performance. The results suggest
that Human Capital practices may account for as much as 43% of the difference between a
company’s market-to-book value and that of its competitors’. The survey showed that HR
Benchmarking & HR metrics (used by 50% of respondents) and Balanced Scorecard methodologies
(used by 32% of respondents) are the two main approaches used for measuring Human Capital.
UUnniivveerrssiittyy ooff PPrreettoorriiaa eettdd –– KKaasssseellmmaann,, RR ((22000066))

University of Pretoria Kasselman, R
(2006)
5
Here 48% of respondents used more than one approach. Deloitte further showed that each type of
approach was associated with a different profile of benefits, but that data accessibility/collection
problems, doubts about the ability to locate Human Capital value in the organisation, and the level of
resources required, were seen as key limitations across the approaches (Brown, 2002).
The results of the survey clearly show that, while the evaluation models can help organisations to
identify key Human Capital issues, none is widely regarded as providing a complete answer. Each of
the approaches is subject to continuing development, with some signs of convergence between
those approaches whose original aim was to account for Human Capital as intangible assets and
those developed originally to provide a strategic tool for management. Companies, however, do not
report externally - the focus remains on internal reporting.
1.3.1 Problem Statement
No standard or framework to enable the inclusion of Human Capital information in company
reporting to demonstrate the effect on performance currently exists. A company’s ability to support
its business strategy with Human Capital is an important indication of the company’s future business
performance. This means that a company’s most significant asset (Human Capital) cannot be
included in the valuation of the business.
1.3.2 Objectives of this research
The objective of this study is to provide an exploratory framework which can be used by Human
Resource practitioners to identify and leverage activities, interventions and/or actions which will
provide qualifiable results that demonstrate shareholder value for the organisation. This reporting
framework with categories provides a holistic, future-orientated account of the Human Assets in a
company.
The study includes an investigation into, and an attempt to answer, the following questions:
4. What insight should investors and other external stakeholders have into the Human Capital
employed by a specific organisation?
UUnniivveerrssiittyy ooff PPrreettoorriiaa eettdd –– KKaasssseellmmaann,, RR ((22000066))
University of Pretoria Kasselman, R
(2006)
6
5. How best to ensure that Human Capital is reported and the information is trusted by investors and
other stakeholders as seen as relevant, reliable and consistent, adding value to shareholders?
6. Which Human Resource Management components can form a basis for comparative external
reporting on Human Capital (if any)?
The impact of the report on companies has the potential to constitute further consequences
(benefits) such as:
1 Strategic alignment of Human Capital development related initiatives.
2 Enhanced ability for companies to attract and retain talent.
3 Related value propositions for key stakeholder groups with a framework against which
measurements can take place, and against which HR development policies, procedures,
guidelines and/or initiatives can ultimately be aligned.
The study reviews various topics relating to Human Capital, measurement, value and Corporate
Reporting.
1.4 Conclusion
Human Capital (people) comprise up to 65% of operating costs for most organisations.
Nevertheless, many companies don’t measure or manage this (their people) effectively. Unless they
begin to treat employees as an investment - in a way that enables continual improvement - they will
be unable to attain their optimum value. Shareholders need to have access to information regarding
the methods deployed by companies to extract value from their Human Resources to enable them to
make an informed decision that includes an understanding of the Human Assets of the organisation.
External reporting of Human Capital costs and benefits must be included in company reports.
UUnniivveerrssiittyy ooff PPrreettoorriiaa eettdd –– KKaasssseellmmaann,, RR ((22000066))

University of Pretoria Kasselman, R
(2006)
7
CHAPTER 2 - LITERATURE REVIEW
Though your balance-sheet’s a model of what a balance-sheet should be,
Typed and ruled with great precision in a type that all can see;
Though the grouping of the assets is commendable and clear,
And the details which are given more than usually appear;
Though investments have been valued at the sale price of the day,
And the auditor’s certificate shows everything O.K.;
One asset is omitted-and its worth I want to know,
The asset is the value of the men who run the show.
- Archibald Bowman, 1938
2.1 Introduction
This study is conducted in the field of Organisational Behaviour and relevant literature has been
reviewed which pertains to the issues related to the research problem, objectives and questions.
The focus of the literature review is to:
1 Provide background information regarding the principles of valuing Human Capital and how this
relates to organisational behaviour in order to have a clear understanding of the concepts and
techniques currently applied (if any);
2 Provide information and define what is meant by the “value” of Human Capital within growth
organisations, within South Africa.
3 Provide information regarding the application of employee relations and employee value in
growth-focused companies to identify the key levers for ensuring a return on investment in Human
Capital in the knowledge-based 21st century.
UUnniivveerrssiittyy ooff PPrreettoorriiaa eettdd –– KKaasssseellmmaann,, RR ((22000066))

University of Pretoria Kasselman, R
(2006)
8
4 Propose a framework to calculate the value of Human Capital for the organisation which can be
included in Corporate Reporting.
The literature review also included investigating the field of Management Accounting and Corporate
Reporting to ensure an understanding of the requirements for Generally Accepted Accounting
Principles and Corporate Reporting.
2.2 Studies focused on HR Practices linked to business success
According to Mayo (2001), there is substantial research that has set out to study whether good
people management practices are directly linked to parameters of business success.
A study in the UK sponsored by the Institute of Personnel and Development at Sheffield Business
School and the London School of Economics looked at 110 manufacturing companies, and related a
variety of supporting processes to profitability (Mayo, 2001). The researchers calculated that
“employee commitment” accounted for 12% of the variation between companies in their profitability,
and 17% in their productivity. Those firms with a strong human relations ethos showed more
consistently good results than the others.
Mark Huselid (1995) of Rutgers University in the US, studied the relationship between a company’s
personnel policies and its business performance. He collected data from 968 firms related HR
practices to attrition, productivity, and financial results. His analysis showed that one standard
deviation in the “index of work practices” accounted for a 16% increase in productivity.
Organisations that make development of their people a fully strategic goal performed much better
than others (Mayo, 2001).
Jeffrey Pfeiffer of Stanford University, in his book The Human Equation (1998), argues for the “seven
practices for successful organisations”. These are listed as
1. Employment security,
2. Selective hiring,
3. Self-managed teams and decentralised decision making,
UUnniivveerrssiittyy ooff PPrreettoorriiaa eettdd –– KKaasssseellmmaann,, RR ((22000066))

University of Pretoria Kasselman, R
(2006)
9
4. Comparatively high compensation linked to organisational performance,
5. Extensive training,
6. Minimal status differences, and
7. Extensive openness in sharing financial and performance information.
The Corporate Leadership Council, in conjunction with Coopers and Lybrand surveyed 1,500
companies on “high performance work practices,” i.e. a range of HR systems and approaches. The
findings were matched against criteria of business alignment and financial results. The researchers
computed that each standard deviation improvement in their index of good HR systems led to an
increase of $40,000 per employee in market value and $27,000 in sales.
Watson Wyatt, a firm of consultants, developed a Human Capital Index (HCI). They surveyed over
400 US and Canadian companies in 1999 and linked human resource practices with market value by
tracking shareholder returns over a five-year period (Pfau & Kay, 2001). They found a strong
correlation between their index, a consolidation of 30 key HR practices, and increases in shareholder
value - acknowledging that correlations are not the same as direct causal links. Over five years the
third of the sample showing the lowest index had risen 53% in market value, as compared with 103%
for the upper third. The 30 practices were split into five groups. The figures shown in brackets below
are the increases in shareholder value creation over the years associated with one standard
deviation of improvement in that part of the Human Capital Index:
• Recruiting excellence (10.1%).
• Clear rewards and accountability (10.2%).
• A collegial and flexible workplace (3.8%).
• Communications integrity (5.0%).
UUnniivveerrssiittyy ooff PPrreettoorriiaa eettdd –– KKaasssseellmmaann,, RR ((22000066))

University of Pretoria Kasselman, R
(2006)
10
• Prudent use of resources (–10.0%).
Note: Not all HR initiatives were found to be effective. The last category covered some popular HR
initiatives, such as 360º assessment. Watson Wyatt (1999) concluded that undue investment was
put into practices that in fact yielded very little benefit and could even be counter-productive.
Importantly, the research found that there is a negative impact where the activity does not directly
support the objectives of the organisation.
The European Foundation for Quality Management (EFQM) developed the EFQM Model in 1992,
originally a model for quality management which is now often used as a monitor of organisational
excellence. It balances “enablers” against “results,” and comprises audit questions resulting in a set
of scores placed against an ideal. The relevant areas for Human Capital are Leadership, People,
and People Results. The latter is assessed through opinion surveys of people satisfaction.
Figure 1: The European Business Excellence Model – EFQM Website: http://www.efqm.org (2005)
This model is closely related to the Malcolm Baldrige National Quality Awards in the USA. This has
a series of criteria for performance excellence, in Business, Education and Health Care, aimed at:
• Ever-improving value to customers.
• Improved organisational effectiveness.
UUnniivveerrssiittyy ooff PPrreettoorriiaa eettdd –– KKaasssseellmmaann,, RR ((22000066))

University of Pretoria Kasselman, R
(2006)
11
• Organisational and personal learning.
Seven categories are used and 1,000 points are distributed between them: 550 points are shared
between Leadership, Strategic Planning, Information and Analysis, Customer and Market Focus,
Human Resources Focus, and Business Results; the remaining 450 cover Business Results, with 80
allocated to Human Resource Results.
The Human Resource Focus covers:
• Works systems, aimed at high performance.
• Employee education, training, and development.
• Employee wellbeing and satisfaction (focusing on the work environment).
William Mercer, another leading specialist HR consultancy, has developed a “wheel” divided into six
segments entitled “people” (capability and experience), “structure” (hierarchy and organisation),
“processes” (how work is organised), “decision making,” “information flow,” and “reward.” Concrete
measures exist for each (Mayo, 2001). Changes that have happened in each sector over the
previous three to five years are plotted on the wheel. These are then related to measures of
performance and quality, such as added-value per employee, or another measure of productivity. In
a large organisation, separate business units can be compared on the relationship between their
success and their positioning on the sectors of the wheel.
A system which is known as Human Capital Appraisal™ was developed by three partners in Arthur
Andersen (Friedman, Hatch & Walker, 1998), and consists of a matrix of systematic intervention
steps vs. five HR areas of activity. The steps are: clarify, assess, design, implement, and monitor;
and the areas of activity covered are:
• Recruitment, retention and retirement.
• Performance management and rewards.
UUnniivveerrssiittyy ooff PPrreettoorriiaa eettdd –– KKaasssseellmmaann,, RR ((22000066))

University of Pretoria Kasselman, R
(2006)
12
Improve cost value balance
Maintain and improve
Replace or cut Align with strategy
Low Strategic Fit
Cost exceeds value
Value exceeds cost
High Strategic Fit
• Career development, succession planning, and training.
• Organisation design.
• Human capital “enablers”—compliance, employee relations, communications, IT.
These two dimensions of steps and activities result in a 5 × 5 matrix that acts as an audit checklist for
good Human Capital management practices. They also developed the Arthur Andersen’s
Fit-Cost-Value™ framework (see Figure 2 Fit-Cost-Value framework below).
Figure 2: Fit–Cost–Value™ framework – Arthur Anderson (1998)
Each program or initiative is plotted on two dimensions of high/low strategic fit and cost > value/value
> cost. “Strategic fit” rates each HR approach against business strategy, best practice, and (where
relevant) the market. Value is determined by the consolidated impressions of employees in each of
the five areas, very similar to employee satisfaction surveys. This model measures only the value to
one stakeholder.
All the above approaches start with the structural capital of HR processes and initiatives and with the
existing culture which makes them useful in benchmarking HR practices. This seems to prove that
treating your Human Capital well yields good results and adding value effectively to employees as
stakeholders add to the bottom line. These models, however, lack a focus on measurable outcomes
UUnniivveerrssiittyy ooff PPrreettoorriiaa eettdd –– KKaasssseellmmaann,, RR ((22000066))

University of Pretoria Kasselman, R
(2006)
13
and focus rather on the existence of systems and processes which makes it virtually impossible to
calculate a monetary value for including a line item on the company’s balance sheet - one called
Human Assets.
2.3 Key Theoretical Concepts
There are a number of different concepts which need to be understood to be able to define the scope
of this research and the definition of what is known as Human Capital or Human Assets.
Key concepts are defined at the outset to ensure a common understanding. Some important
concepts related to the study and/or similar to the concept of Human Capital have been identified in
existing literature. As the study investigates a very complicated topic, or range of topics, in order to
establish the framework, it is important to understand a number of theoretical concepts. In order to
measure both the value of Human Capital and Human Assets, an understanding of the methods
employed in measuring intangibles and the model for Intellectual Capital is required. Understanding
reporting and financial statements, as well as methods to value assets is of key importance. The
following is a list of the key methods for measurement (discussed later in this Chapter). The
concepts are depicted in Table 1.
UUnniivveerrssiittyy ooff PPrreettoorriiaa eettdd –– KKaasssseellmmaann,, RR ((22000066))

University of Pretoria Kasselman, R
(2006)
14
Elements of Financial Statements
Reporting Non-Financial Measures
Company Reporting
Reporting (Accounting) for Human Capital
Human Capital ROI
Human Capital Index
Best Investment in Human Capital
Balanced Scorecard
Measuring Human Capital
HR Scorecard
Intellectual Capital (IC) Index
EFQM Excellence Model
Economic Value Add (EVA)
Measuring Intellectual Capital
Scorecard Methods (SC)
Direct Intellectual Capital Methods (DIC) Measuring Intangibles
Market Capitalisation Methods (MCM)
UUnniivveerrssiittyy ooff PPrreettoorriiaa eettdd –– KKaasssseellmmaann,, RR ((22000066))

University of Pretoria Kasselman, R
(2006)
15
Return on Assets (ROA)
Skandia Navigator / Intangible Assets Monitor
Cost Based Methods
Market Based Methods
Income Based Methods
Valuing Assets
Calculated Intangible Value Method
Individual Human Asset Worth Measuring Human Assets
Collective Human Asset Worth
Table 1: Key Methods / Models for measurement
2.3.1 Invisible (Intangible) Assets
Invisible assets have been defined as the flow of information between the company and the
environment, or inside the company that creates invisible assets (Roos, Roos, Edvinsson &
Dragonetti, 1997). These assets are semi-fixed; i.e. they need to be built over a long period of time,
can be employed for more than one use at a time and are enhanced by increased use. As such, they
provide a source for competitive advantage.
Because of the reluctance of banks to lend for investment in intangible assets, the development of
intangible assets is mostly self-financed (Morey, Maybury & Thuraisingham, 2000). In other words,
the invisible assets are matched on the financing side of the balance sheet by equally invisible
finance, most of which in the form of invisible equity.
Knowledge organisations like Deloitte and Touche, Microsoft, Morgan & Banks or WM-data have
little typical assets (machinery) other than their employees, thus they are both the minders of the
UUnniivveerrssiittyy ooff PPrreettoorriiaa eettdd –– KKaasssseellmmaann,, RR ((22000066))
University of Pretoria Kasselman, R
(2006)
16
machines and the “machines” (revenue creators) themselves. For the most part, their competence is
directed outwards, to the task of generating revenue, by solving customers´ problems.
These employees create the relationships, networks, and image that comprise the organisation’s
external structure. Similarly, it is the smaller amount of human competence that is directed inwards
that creates, maintains, develops (or erodes) the organisation’s internal structure and processes. As
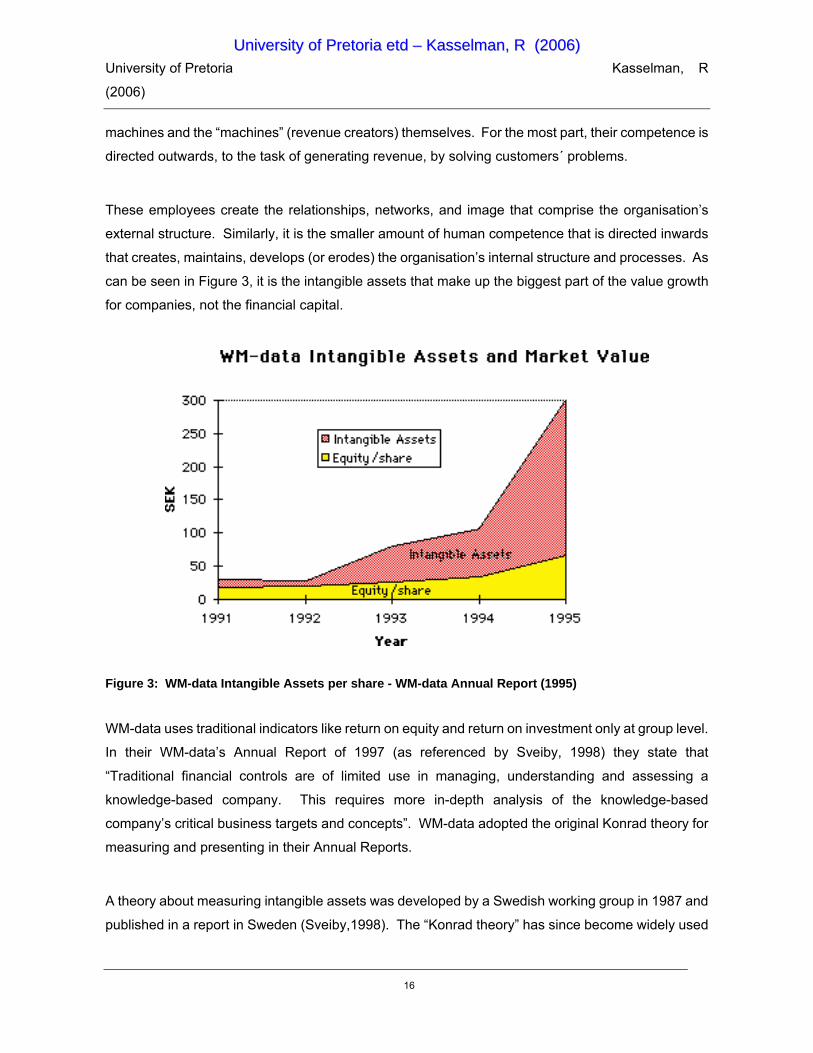
can be seen in Figure 3, it is the intangible assets that make up the biggest part of the value growth
for companies, not the financial capital.
Figure 3: WM-data Intangible Assets per share - WM-data Annual Report (1995)
WM-data uses traditional indicators like return on equity and return on investment only at group level.
In their WM-data’s Annual Report of 1997 (as referenced by Sveiby, 1998) they state that
“Traditional financial controls are of limited use in managing, understanding and assessing a
knowledge-based company. This requires more in-depth analysis of the knowledge-based
company’s critical business targets and concepts”. WM-data adopted the original Konrad theory for
measuring and presenting in their Annual Reports.
A theory about measuring intangible assets was developed by a Swedish working group in 1987 and
published in a report in Sweden (Sveiby,1998). The “Konrad theory” has since become widely used
UUnniivveerrssiittyy ooff PPrreettoorriiaa eettdd –– KKaasssseellmmaann,, RR ((22000066))

University of Pretoria Kasselman, R
(2006)
17
in Scandinavia. More than 40 Swedish companies measured and reported their intangible assets
according to these principles according to Öhman (Sveiby, 1998).
2.3.2 Intellectual Capital (IC)
Consensus on the definition and measurement of Intellectual Capital (IC) seems lacking in the
academic literature. The definitions include not just human brainpower, but also brand names,
trademarks. Assets booked at historic costs and transformed into greater value over time are also
defined as Intellectual Capital. Further definitions include factors such as technology leadership,
on-going employee training, and even customer relationships. This all implies that Intellectual
Capital is a large field; however the difference between perceived value and accounting value is still
open to debate.
The OECD (Organisation for Economic Co-operation and Development) defines Intellectual Capital
as the economic value of two categories of intangible assets of a company - organisational and
Human Capital (OECD, 1996). Nahapiet and Ghoshal (1998:245) state that Intellectual Capital
refers to the “knowledge and knowing capability of a social collectivity, such as an organisation,
intellectual community, or professional practice”. Black, Wright, and Bachman (1998) argue that
Intellectual Capital is a factor that includes Human Capital, social capital and organisational capital.
Gratton and Ghoshal (2003) argue that Intellectual Capital is part of Human Capital; that is, Human
Capital subsumes Intellectual Capital, and also includes within it social capital and emotional capital.
For most commentators however, such as Kaplan and Norton (1993), Harvey and Lusch (1999), and
Sveiby (1997), Intellectual Capital is very broad and includes Human Capital as one of its key
dimensions.
It is important to understand that Intellectual Capital should not be equated to Employee Value Add
or Human Capital Value, although some of the measures and calculations may have a relevancy in
quantifying Human Capital assets. In the publication, Intellectual Capital, IC is defined as a
knowledge-based; i.e. a personal, subjective process, emerging from previous experiences and
current events (Roos et al., 1997a).
For the purposes of this study, Intellectual Capital is defined to include all the processes and the
intangible assets of an organisation which are not normally shown on the balance sheet including
trademarks, patents and brands.
UUnniivveerrssiittyy ooff PPrreettoorriiaa eettdd –– KKaasssseellmmaann,, RR ((22000066))
University of Pretoria Kasselman, R
(2006)
18
2.3.3 Human Capital (HC)
The term ‘Human Capital’ was first used by Nobel Laureate, Theodore W. Schultz, (Schultz, 1961).
The term is today most frequently used to refer to a combination of skills, experience and knowledge
in the Human Resources within an organisation. Human Capital makes an individual potentially
productive and thus equips him or her to earn income in exchange for labour.
Human Capital is thus an all-encompassing term for the knowledge, skills, competencies and other
attributes embodied in individuals or groups of individuals acquired during their life and used to
produce goods, services or ideas in market circumstances.
Roos & Roos (1997b) categorise and define Human Capital as follows:
• Competence. Essentially about knowledge and skills. Knowledge meaning specifically the
“technical or academic knowledge of things,” related to education, i.e. something that “has to be
taught.”
• A skill is the practical counterpart of competence.
• Attitude. Depends mostly on personality traits and cannot be changed much. It is influenced by
“motivation, behaviour and conduct.”
• Intellectual agility. Covers innovation, flexibility, and adaptability-traits seen at a group or
organisational level as much as in individuals.
Note: This approach is reflected in many of the measures used by the pioneering Scandinavian
companies.
Sveiby (1997) uses the term “professional competence” for Human Capital. This he defines as a
combination of educational attainment levels and years of experience. He then breaks it down, as
for the other components of Intellectual Capital, into aspects of growth/renewal, efficiency, and
stability; defining his overall framework for measuring Intellectual Capital components.
UUnniivveerrssiittyy ooff PPrreettoorriiaa eettdd –– KKaasssseellmmaann,, RR ((22000066))

University of Pretoria Kasselman, R
(2006)
19
Gary Becker, a Nobel Prize-winning economist includes personality, appearance, reputation and
credentials to the mix. This work, based on detailed empirical analysis, redressed the prevailing
assumption that the growth of physical capital is paramount in economic success (Becker, 1994). In
reality, physical capital explains only a relatively small part of the growth of income in most countries’
GDP.
Rastogi (2000:196) stated “The concept and perspective of Human Capital stems from the fact that
there is no substitute for knowledge and learning, creativity and innovation, competencies and
capabilities; and that they need to be relentlessly pursued and focused on the firm’s environmental
context and competitive logic”.
For the purposes of this study, Human Capital is defined as the sum of knowledge, skills and abilities
possessed by a company’s employees, working as a network of knowledge resources; i.e. it is the
value inherent in an organisation’s people. It includes employees’ collective skills, experience,
talent, knowledge, intellectual agility and behaviour.
2.3.4 Human Assets
Assets may be classified in many ways. Assets can be defined as the right kind and quality of
“equipment” to carry out the production process as efficiently as possible (Lovemore and Brummer,
1993). In a company’s balance sheet certain divisions are required by generally accepted
accounting principles (GAAP), which vary from country to country.
In business and accounting, an asset is anything owned (or rented/leased i.e. under it’s control)
which can produce future economic benefit, whether in possession or by right to take possession, by
a person or a group acting together (e.g. a company), the measurement of which can be expressed
in monetary terms. Assets are listed on the balance sheet. It has a normal balance of debit.
Similarly, in economics an asset is any form in which wealth can be held.
The various types of assets defined in accounting and economics includes (Anon, 2006):
UUnniivveerrssiittyy ooff PPrreettoorriiaa eettdd –– KKaasssseellmmaann,, RR ((22000066))
University of Pretoria Kasselman, R
(2006)
20
Current Assets - cash and other assets expected to be converted to cash, sold, or consumed either
in a year or in the operating cycle. These assets are continually turned over in the course of a
business during normal business activity.
There are 5 major items included into current assets:
1. Cash - it is the most liquid asset, which includes currency, bank deposit, and negotiable
instruments (e.g., money orders, checks, bank drafts).
2. Short-term investments - include securities bought and held for sale in the near future to
generate income on short-term price differences (trading securities).
3. Receivables - usually reported as net of allowance for uncollectible accounts.
4. Inventory - trading these assets is a normal business of a company. The inventory value
reported on the balance sheet is usually the historical cost or fair market value, whichever is
lower. This is known as the “lower of cost or market” rule.
5. Prepaid expenses - these are expenses paid in cash and recorded as assets before they are
used or consumed (e.g. insurance).
The phrase net current assets (also called working capital) is often used and refers to the total of
current assets less the total of current liabilities.
Fixed assets - Also referred to as PPE (property, plant, and equipment). These are assets which
are purchased for continued and long-term use in earning profit in a business. This group includes
land, buildings, machinery, furniture, tools, wasting resources (timberland, minerals), etc. They are
written off against profits over their anticipated life by charging depreciation expenses (with
exception of land which increases in value). Accumulated depreciation is shown in the face of the
balance sheet or in the notes. These are also called capital assets, especially when intangibles are
taken into account.
UUnniivveerrssiittyy ooff PPrreettoorriiaa eettdd –– KKaasssseellmmaann,, RR ((22000066))

University of Pretoria Kasselman, R
(2006)
21
Intangible assets – These lack physical substance and usually are very hard to evaluate. They
include patents, copyrights, franchises, goodwill, trademarks, trade names, etc. These assets are
(according to US GAAP) amortised to expenses over 5 to 40 years, with the exception of goodwill.
Other assets - a high variety of assets, most commonly:
• Long-term prepaid expenses.
• Long-term receivables.
• Intangible assets (if they represent just a very small fraction of total assets).
• Property held for sale.
In a lot of cases this section is too general and broad, because assets could be classified into any of
the four above categories. In conclusion, an asset can be defined as having potential to earn
revenue, its value is managed over life cycle, and its failure leads to irrecoverable commercial loss.
Human Asset is a new term for the knowledge economy where professionals are not in a
problem-solving mode but in an opportunity-creation state. For the knowledge economy,
achievement is not the term; and contribution is the key to success. Human Assets can assure that.
The use of the term in the modern neoclassical economic literature dates back to Mincer (1958), an
economist, who pioneered the way in an article “Investment in Human Capital and Personal Income
Distribution”.
Becker’s (1994) view is that Human Capital is similar to the “physical” means of production, e.g.,
factories and machines, one can invest in Human Capital (via education, training, medical treatment)
and the income depends partly on the rate of return on the Human Capital you own. Thus Human
Capital is a stock of assets a company owns, which allows one to receive a flow of income, similar to
interest earned.
UUnniivveerrssiittyy ooff PPrreettoorriiaa eettdd –– KKaasssseellmmaann,, RR ((22000066))

University of Pretoria Kasselman, R
(2006)
22
The concept of Human Capital can be infinitely elastic, including immeasurable variables such as the
personal character or connections with insiders (via family or fraternity). This allows the theory to be
true without explaining anything (Anon, 2006). Often it is not the education or training that one has
which determines the value of one’s education, but the prestige of the qualification or degree
received. Someone who gets a qualification from a university will likely get a higher income than one
from a technikon or technical college, even if they have exactly the same knowledge and the ability to
apply the knowledge in the same or similar manner. Similarly, discrimination against certain cultures
or female employees implies different rates of return.
According to Becker (1994), the Human Capital literature often distinguishes between “specific” and
“general” Human Capital. Specific Human Capital refers to skills or knowledge that is useful only to
a single employer (and who will likely be willing to pay for it), whereas general Human Capital (such
as literacy) is useful to all employers. Likewise, the value placed on specific Human Capital due to
their skills possessed may be worth more in one organisation than in another; e.g. an IT technician’s
value may be higher within an IT organisation than in an organisation where IT is purely a back office
support function.
2.3.5 Value Based Management
Value Based Management (VBM) is used by many companies as a strategy method for
organisations wanting to create value for all stakeholders. This integrated approach aligns the
objectives, strategy, management processes and people of an enterprise to continually enhance
value. In organisations where Value Based Management has been adopted, mention is made of the
employee value elements, but measurement is represented in intangible aspects. Integration of the
performance measurements and alignment of compensation and systems are explored although
very little specific literature on these topics is available.
Clear shareholder value approaches from an accounting as well as economical models have been
explored and measurements evaluated and clearly defined. Likewise, methods for calculating
customer value from retention, growth (with existing customers) and acquisition (new customers)
has been explored, proven and implemented with success.
Black et al. (1998) explain why shareholder value is so important when the market looks at a firm’s
performance, and why mastering valuation has become an essential skill for managers whenever
UUnniivveerrssiittyy ooff PPrreettoorriiaa eettdd –– KKaasssseellmmaann,, RR ((22000066))
University of Pretoria Kasselman, R
(2006)
23
they make strategic decisions. They go on to explain how a framework of shareholder value can
integrate the core business process of creating, preserving and realising value with techniques that
can be customised across markets and sectors.
The term Value Based Management describes a management orientation explicitly toward value.
It’s about aligning the people, processes and systems of an organisation to continuously increase
shareholder value. Because value, as represented by the share price, is set by the market, and
because the market is more concerned with the future than the past, value-based management has
to deal with perceptions as well as reality. It has two distinct tasks; to actually improve performance
by being more effective and efficient, and to convince the market of the promise of this activity in
terms the market will understand and believe.
Market prices are tied to expectations rather than to past accomplishments. This is the difference
between performance (historical) and valuation, which is about the market’s expectation of future
performance
Many papers have been written relating to the topic of Value Based Management, mostly focusing
on risk, financial performance, economic value add (EVA), metrics, scoreboard, financial incentives,
creating and even destroying asset value. Value profiling assesses the value creation in business
units or value centres against an economic profit measure such as Cash Flow Return on Investment
(CFROI).
For the purposes of this study, the broad practices of Value Based Management (VBM) are
considered as follows:
• Committing to value creation goals.
• Re-examining the role played by the corporate centre.
• Developing value maximising business strategies.
• Driving operational value.
UUnniivveerrssiittyy ooff PPrreettoorriiaa eettdd –– KKaasssseellmmaann,, RR ((22000066))

University of Pretoria Kasselman, R
(2006)
24
• Broad-based rewards aligned with value creation.
• Building a value culture.
• The changed behaviour is more important than the metric.
• Changing the mindset will change operational and strategic thinking.
• Definite need to challenge entrenched thinking.
• Creates the burning platform for moving from incremental improvement / thinking.
To create value for their shareholders, companies must earn returns on invested capital that exceed
the cost of capital. Each metric may have its own distinctive advantages and disadvantages, and
each is expressed in its own distinctive way. Yet at their most basic level, they are all designed to
measure management’s success in achieving this aim.
The business imperative of VBM is to create value for all stakeholders in an organisation.
Customers offer loyalty, patronage, and money for products and services that provide good value
based on the combination of price and quality relative to competitive offerings. An organisation
earns profit and market share if it keeps customers satisfied and loyal and generates customer
value.
Equally important is the value that employees offer an organisation. As stakeholders, they give their
time, commitment, and creativity. In return, they expect fair compensation, a challenging work
environment, and the opportunity to learn, develop, and advance. As a result, the organisation
enjoys loyal, productive, innovative employees who help build a competitive advantage.
2.3.6 Employee Relations Management Solutions
The development of an Employee Relationship Management (ERM) concept by software and
consulting houses was driven by the imperative to maximise employee performance and manage
UUnniivveerrssiittyy ooff PPrreettoorriiaa eettdd –– KKaasssseellmmaann,, RR ((22000066))
University of Pretoria Kasselman, R
(2006)
25
Human Capital more effectively. As companies faced many people management challenges, there
was a need to develop an approach to address people management challenges and maximise
returns on employee investment.
The value to shareholders is not the only measure of success for an organisation. Employee
satisfaction has been measured and shown to have a direct influence on the growth of organisations.
In a study by Doorley and Donovan (1999), it was found that when measuring a client’s overall
employee satisfaction index in a company which had slipped well below it’s growth potential (2%),
the employee satisfaction index was very low. After committing to growth, their employee
satisfaction index grew from 100 to 160 and their growth to 13%. By 1997, they were growing at 18%
with employee satisfaction in the 170 range (Doorley and Donovan, 1999).
The e-Human Resources landscape includes a range of solutions, from e- enablement of critical HR
functions to development of enterprise portals (Anon, 2003). All solutions can be carried out as a
standalone initiative or in combination with other ERP solutions. As companies look to maximise
return on their people management initiative investments and tackle more than one issue
simultaneously, delivery of an integrated set of solutions is often the choice. One of the reasons
provided for the fact that integrated solutions yield higher returns is because they affect more than
one lever (i.e. Operating Margin, Revenue and Asset Management) of shareholder value.
Often it is the absence of a strategic approach to people initiatives that leads to process dispersion
and misalignment, which prevent companies from maximising the effectiveness of their people
management initiatives. One of the key advantages of an integrated solution vs. an isolated people
management initiative is that an integrated solution can streamline and integrate uncoordinated
efforts to improve efficiency and reduce costs across several processes simultaneously.
The limitation of this model is the quantification of the value back to bottom line tangible benefits.
The focus is on logical activities or processes and methods of ensuring that these are done and the
data of such activities recorded - the limitation being the fact that these systems are transactional
and not interpretive.
UUnniivveerrssiittyy ooff PPrreettoorriiaa eettdd –– KKaasssseellmmaann,, RR ((22000066))

University of Pretoria Kasselman, R
(2006)
26
For purposes of this study, an integrated solution is a system that enables the maximisation of return
on Human Capital, using integration to improve efficiency and reduce costs across several
processes simultaneously.
2.4 Company Reporting
Le Clerc et al. (1996) describe the objective of company corporate reports as “a method to
communicate economic measurements and information about the performance of the organisation
to the stakeholders of the organisation”
• Financial reporting includes the basic financial statements and accompanying notes.
• Business reporting encompasses the broader information provided by companies, including
management’s discussion and analysis, information provided in the annual report, presentations
to analysts, fact books, and business information provided on the company’s website.
The aim of all accounting information is to provide the particular user with relevant and timely data to
make decisions (Mott, 2005).
1 Shareholders of limited companies will be influenced in their decision to remain investors or to
increase/decrease their holding by receiving information about the financial performance and
financial position of their company. This usually occurs twice a year in the form of a profit and
loss account and a balance sheet relating to the first half-year and, later on, the full year.
2 Owner-managers of non-incorporated businesses will require the above information but they will
also be privy to more detailed and more frequent information about the business’s financial
affairs.
3 Management in companies range from director level down to supervisor level. Each person
requires accounting information to help them in their roles.
4 Suppliers need to assess the creditworthiness of potential and existing customers when setting
the amount and period of credit allowed.
UUnniivveerrssiittyy ooff PPrreettoorriiaa eettdd –– KKaasssseellmmaann,, RR ((22000066))

University of Pretoria Kasselman, R
(2006)
27
5 Customers also need to be reassured, in this case to minimise the risk of their supplies drying up
and disrupting their own output. Firms entering into a joint venture will also need mutual
reassurance. Similar checks to those outlined above for suppliers will need to be carried out.
6 Employees and their representatives have a vested interest in the financial health and future
prospects of their employer. They rely on an assessment of the published accounts by experts
for this.
7 Government levies tax on the profits earned by businesses and value added tax on the sales
value of most industries. Tax authorities rely on the information provided by companies for these
purposes.
8 Competitors can make some comparisons; for example, sales per employee, from published
accounting data in a process known as benchmarking.
9 Lenders/Investors need to be assured that their capital is safe and that the borrowing company
can service the loan or overdraft adequately, so again the financial statements of profit and loss
account and balance sheet will be examined from this viewpoint.
It can be concluded from the above that most users of accounting information are drawing from what
is provided in the published accounts. Only management has access to more detailed,
non-published financial information within a company.
The content of the annual report and accounts for a listed company, i.e. one that is quoted on a stock
exchange, is more comprehensive than the requirements of unlisted companies which reduce in line
with their size. Disclosure requirements of listed companies derive from three sources:
1. Statutory law embodied in Companies Acts;
2. Accounting standards as laid down in FRSS and SSAPS (Statements of Standard Accounting
Practice); and
3. Listing regulations specified by the Stock Exchange.
UUnniivveerrssiittyy ooff PPrreettoorriiaa eettdd –– KKaasssseellmmaann,, RR ((22000066))

University of Pretoria Kasselman, R
(2006)
28
The following main items are disclosed in the annual report and accounts:
• Chairman’s statement –a broad review of progress, changes in strategy and management and a
guide to future prospects. This may be supplemented by a chief executive’s review of each
individual business’s performance.
• Operating and financial review – a detailed commentary on the financial results and influential
factors.
• List of directors – details of service, responsibilities and other directorships.
• Directors’ report – a formal report on specific required items; e.g. dividend declaration, principal
activities, share capital and substantial shareholdings, political and charitable contributions,
directors’ shareholdings, employment policy, creditor payment policy, close company status and
appointment of auditors.
• Report of the remuneration committee – policy statement on how the total remuneration
package of executive and non-executive directors is set.
• Auditors’ report – a statement of auditors’ responsibility and their report on whether or not the
financial statements give a true and fair view of the state of affairs.
• Financial statements – comprising consolidated profit and loss account, balance sheet, cash
flow statement, statement of total recognised gains and losses and parent company balance
sheet only.
• Notes to the financial statements – additional breakdown and analysis of figures appearing in
the main financial statements.
• Historic record of financial performance – a 10-year summary of the main financial figures and
ratios reflecting profitability, dividends and shareholders’ funds.
UUnniivveerrssiittyy ooff PPrreettoorriiaa eettdd –– KKaasssseellmmaann,, RR ((22000066))

University of Pretoria Kasselman, R
(2006)
29
• Notice of meeting – notice of the time and venue of the annual general meeting and the business
to be conducted
According to Standard 38 (1998) of the International Accounting Standards Committee (IAS) for the
measurement and amortisation of intangible assets and purchased goodwill, an intangible asset is
defined as “an identifiable non-monetary asset without substance held for use in the production or
supply of goods and services, for rental to others, or for administrative purposes.” The fair value of
an asset is the amount for which that asset could be exchanged between knowledgeable willing
parties in an arm’s-length transaction.
IAS 38 was published in 1998 to be applied from 1 July 1999. The areas covered are advertising,
training, start-up, and R&D. The “asset” has to be identifiable and controlled; its cost has to be
measured reliably, and it has to be one that is expected to generate future economic benefits to the
organisation, otherwise it must be treated as an expense. This standard prohibits internally
generated goodwill, brands, publishing titles, customer lists, and similar items. The standard insists
that the asset should normally be amortised over the best estimate of the useful life, with a maximum
of 20 years. This is not possible for human assets and as such, the latter cannot be considered as an
intangible asset according to the definition by the IASC.
2.4.1 Elements of Financial Statements
Financial statements (or financial reports) are a record of a business' financial flows and levels.
Typically they will include:
• A balance sheet (statement of Financial Position) setting out the net asset position of a business.
• An income statement, income and expenditure statement or profit and loss statement.
• A cash flow statement.
• A statement of other recognised gains and losses or other comprehensive income statement
setting out movements in equity that do not go through the income statement or profit and loss
account (e.g. a revaluation of the value of head office of a manufacturing company).
UUnniivveerrssiittyy ooff PPrreettoorriiaa eettdd –– KKaasssseellmmaann,, RR ((22000066))

University of Pretoria Kasselman, R
(2006)
30
• Statement of retained earnings.
• Supplementary notes and management discussion.
According to the World Bank (1995), the Financial Accounting Reporting and Auditing Handbook
(FARAH) states that a good financial information system is vital for a strong management
information system. It further states that an independent audit of financial statements provides faith
and credibility to stockholders, members and third parties.
The elements of financial statements from IASC (International Accounting Standards Committee)
that provide a framework for the preparation of financial statements include transactions and other
events by grouping into broad categories the elements of the financial statement of companies.
According to this body “elements may be classified by their nature or function in the business of the
enterprise in order to display information in the manner most useful for the purposes of making
economic decisions” (The World Bank, 1995).
Generally Accepted Accounting Practice Statements AC000 defines three elements which measure
the wealth of an entity (Everingham and Kleynhans, 1995):
• Assets;
• Liabilities; and
• Equity.
Assets definition: A resource controlled by the enterprise as a result of past events and from which
future economic benefits are expected to flow to the enterprise. Future economic benefits include
cash from goods sold, or cost savings from using more efficient machinery. Legal ownership is not a
requirement for recognition as an asset; i.e. permitting certain “leased” resources to be shown as
assets by the lessees.
UUnniivveerrssiittyy ooff PPrreettoorriiaa eettdd –– KKaasssseellmmaann,, RR ((22000066))

University of Pretoria Kasselman, R
(2006)
31
Some assets are not disclosed in a balance sheet. Internally generated goodwill, including the value
of brands, never appears in a balance sheet. The value of the Human Capital (workforce), probably
any firm’s most valuable asset, does not appear at all in a balance sheet.
Liability definition: A present obligation of the enterprise arising from past events, the settlement
of which is expected to result in an outflow from the enterprise of resources embodying economic
benefits.
Equity definition: The residual interest in the assets of the enterprise after deducting all its
liabilities.
When talking about a set of accounts, one refers to the profit and loss account statement and the
balance sheet statement. A balance sheet is a snapshot picture at a moment in time. On the one
hand it shows the value of assets (possessions) owned by the business and on the other, it shows
who provided the funds with which to finance those assets and to whom the business is ultimately
liable. An income statement is a profit and loss account, which compares income with expenses
consumed in the same period.
The Financial Reporting Standard (FRS No 3) issued in 1992, and entitled Reporting Financial
Performance, requires companies:
• To separate turnover and operating profit between continuing operations, acquisitions, and
discontinued operations;
• To disclose profits and losses resulting from restructuring/reorganisation or from the disposal of
fixed assets or parts of the business;
• To disclose extraordinary items (which should now be a rare event) as opposed to exceptional
items (which could be quite commonplace);
• And to calculate earnings per share after taking them into account.
UUnniivveerrssiittyy ooff PPrreettoorriiaa eettdd –– KKaasssseellmmaann,, RR ((22000066))
University of Pretoria Kasselman, R
(2006)
32
Although the rules differ in different countries, usually larger companies and all publicly-quoted
companies must have their financial statements independently audited. Note that the auditors do not
certify financial statements, that is done by the company's directors. All an auditor does is examine
the financial statements and records of a company and assess whether they do indeed show a "true
and fair" view (or meet other particular requirements that the auditor is engaged to opine on).
2.4.2 Reporting Non-Financial Measures
Individual investors take reliability of information sources into account when using information.
Investors adjust their reliance on information for the incentives and prior accuracy (Maines, 1996;
Williams, 1996; and Hirst, Koonce & Miller, 1999) and as such, the investors’ use of non-financial
performance measures will depend on their own perception of the reliability of the source of that
information.
The literature provides both support for and caution against mandating disclosure of non-financial
performance measures. Non- financial performance measures considered relevant measures are
predictive (leading indicators) of future financial performance and appear to be reflected in share
prices and stock returns. Additionally, there is evidence that non-financial performance measures
can enhance the value of financial measures due to interactive effects between the two.
Various researchers and students of Human Capital have called for more disclosure of non-financial
information by corporations (Norton, 2000; Eccles, Herz, Keegan & Phillips, 2001; and Lev, 2001).
These individuals argue that traditional financial measures have diminished in relevance due to
changes in business models and are backward looking, rather than providing insights into a
company’s future performance. However, questions regarding the reliability, comparability and
consistency of the information - factors which are of utmost importance when valuing an
organisation.
While non-financial measures are industry-specific, the value of non-financial performance
measures can depend on both environmental (e.g. regulatory) factors and firm-specific factors, such
as firm strategy and product development and life cycles. These findings suggest that investors
likely need firm- and time-specific models to make full use of non-financial measures. However,
evidence indicates that managers tend to have difficulty specifying the relation between
non-financial measures and future financial performance; thus, corporations may be unable (and
UUnniivveerrssiittyy ooff PPrreettoorriiaa eettdd –– KKaasssseellmmaann,, RR ((22000066))

University of Pretoria Kasselman, R
(2006)
33
perhaps unwilling for competitive reasons) to provide such models to investors or the general public
which may include competitors.
If non-financial measures are subject to significant measurement error, regression analysis would
probably fail to find a significant relation between non-financial measures and future financial
performance. Survey evidence from Wm. Schiemann and Associates (as reported by Ittner and
Larcker, 1998) suggests that corporate executives have concerns about the quality of non-financial
information; particularly measures related to human assets, which are viewed as intangible. These
executives also perceive the quality of financial information to be higher than that of non-financial
information.
A related issue is the effect of an external audit of non-financial performance on investors’ perceived
reliability of this information. Investors and the general public generally consider audited information
to be more credible than unaudited information (Libby, 1979; Pany and Smith, 1982; Johnson, Pany
& White, 1983). The conclusion which can be drawn from this is if non-financial performance
measure disclosures are audited, investors’ perceived reliability of and reliance on this information
likely would increase.
Research indicates that different formats for reporting financial performance measures can influence
professional and non-professional investors’ use of that information by affecting the transparency of
information and particularly, of the links between performance measures influences analysts’ use of
this information.
2.5 Measuring Shareholder Value
For publicly traded companies, investors tend to look at total shareholder return as the ultimate
measure of success. This is the change in share price from the date of purchase, plus any dividends
received, divided by the original cost of the shares. For other types of companies, such as the public
sector, the notion of value comes down to the overall governing objective of the organisation and
how that organisation defines success.
In financial terms, shareholder value can be thought of as market capitalisation (current share price x
the number of shares outstanding), an important measure for categorising companies at a single
point in time.
UUnniivveerrssiittyy ooff PPrreettoorriiaa eettdd –– KKaasssseellmmaann,, RR ((22000066))

University of Pretoria Kasselman, R
(2006)
34
Buy-side investors (who actually drive share prices) typically value companies the same way one
would value a bond—on the basis of expected future cash flows. Unlike bonds, the expected cash
flows from a business are much more difficult to predict. Estimates have to start with the value of
existing assets and current, actual financial results. Then one has to forecast the level of future
investments and make assumptions about the company’s ability to maintain or increase the return on
those investments. Investors are interested in short-term results because they inform the forecast
and, along with other criteria, they are quantified benchmarks for measuring a company’s progress
toward stated goals.
Investors continually hone their forecasts. To do this they want to hear details about what the
company is actually doing to grow returns and the capabilities that they are building to allow them to
sustain their business models. Positive guidance, based on the clear alignment of business strategy
and specific actions, points the way forward. If one does not give investors a reason to believe, they
won’t. Transparency is about providing enough information so investors can decide if they want to
invest and, if so, at what price. A lack of transparency — in historical results or in what the company
is saying about the future — raises a red flag, and investors are likely to respond by lowering their
forecasts (and, therefore, what they’re willing to pay for the stock today).
This means, the better the available information, the lower the “transparency discount” i.e.
transparency is less a burden imposed by regulators and more an opportunity to increase share
price.
2.5.1 Enterprise Value Map (EVM)
The Enterprise Value Map (EVM) is a method developed by Deloitte as a graphical representation of
the connections between key drivers of value (such as revenue growth, margins and asset turns)
and the processes and tactics that affect those value drivers. This unified display allows the analysis
of what the company can do, which initiatives may be most important, and how value is created
allowing organisations to perform the following (Wortman, 2005):
• Structure and prioritise improvement initiatives, showing the relationship between tactics,
strategies, objectives and value.
UUnniivveerrssiittyy ooff PPrreettoorriiaa eettdd –– KKaasssseellmmaann,, RR ((22000066))

University of Pretoria Kasselman, R
(2006)
35
• Communicate strategy and how it is to be implemented, as well as the interconnections between
various initiatives.
• Render insight for all stakeholders, internal and external, about what is being done, and why.
Business leaders today are continuously faced with increased scrutiny and pressure to enhance
shareholder value. Investors are becoming more and more demanding, forcing companies to focus
their attention on strategies and processes that add value to the shareholders.
From an executive perspective, the Enterprise Value Map is a framework depicting the relationship
between the measures by which companies are evaluated and the means by which companies can
improve those measures. Starting with the drivers of enterprise value, the methodology addresses
those aspects companies can address to influence those drivers, depicting not only what companies
can do categorically, but also how they can drive improvement at tactical levels. “Value Drivers” are
the metrics by which shareholders, analysts and potential investors assess company performance -
in absolute terms and relative to that of competitors (Wortman, 2005).
The EVM is at the top most level, made up of those components of the Income Statement and
Balance Sheet. Revenue Growth and Operating Margin sections are the Income Statement portion
of the map (these sections combine to describe a company’s current operational performance) and
the Asset Efficiency section is a subset of the Balance Sheet, showing how efficiently a company
uses its assets in delivering its operational performance.
The expectations section addresses factors that influence future Income Statement and Balance
Sheet performance.
UUnniivveerrssiittyy ooff PPrreettoorriiaa eettdd –– KKaasssseellmmaann,, RR ((22000066))

University of Pretoria Kasselman, R
(2006)
36
Revenue Growth(after taxes)Operating Margin External Environment
ExpectationsAsset Efficiency
Shareholder Value
The key measure of operating effectiveness
The key measure of operating efficiency
The key measure of investment
efficiency
Ability to perform well in future
Figure 4: Shareholder Value Map, adapted from Deloitte (2003)
Revenue Growth and Operating Margin represent the Income Statement and combine to describe
current operational performance. The Asset Efficiency section is a subset of the Balance Sheet,
showing how efficiently assets are utilised in delivering operational performance. External Factors
address factors that may influence future Income Statement and Balance Sheet performance, i.e.
factors that influence shareholder confidence in the organisation and its leadership.
2.6 Reporting (Accounting) for Human Capital
The accounting standards setting authority has included in their standards those relating to the
operating and financial review of a company. In other words, information that stakeholders can use
to project the historical figures into the future, including the company’s vision and strategy as well as
information on the intangible assets such as Human Capital.
The chief issue within Human Capital accounting (HCA) is that human assets, unlike capital assets,
have a largely uncertain future service life. Measuring the value of Human Resources has therefore
been concerned with the nature of the uncertainty and providing estimates of this, with a number of
measures used, including the discounted future compensation model (Lev and Schwartz, 1974) -
where the value of an employee is the present worth of their remaining earnings from employment,
and the replacement cost method, where “costs incurred by recruiting, selecting, compensating, and
UUnniivveerrssiittyy ooff PPrreettoorriiaa eettdd –– KKaasssseellmmaann,, RR ((22000066))
University of Pretoria Kasselman, R
(2006)
37
training employees reflect the expected value of successful job performance” (Steffy and Maurer,
1998: 273).
Flamholtz (1985) stated that measuring an individual’s value to the firm is founded on the notion that
it is not the individual per se who is valuable, but the individual in relation to the roles he/she plays
that is crucial.
2.6.1 Universal (Best Practices) Approach
“Best practices” or “high performance work practices” emphasise the need for strong consistency
among HR practices (internal fit) in order to achieve effective performance. This view has a high
degree of empirical support (Huselid, 1995; Delaney and Huselid, 1996; Arthur, 1994; and
MacDuffie, 1995) and has been championed by Pfeffer (1998) who listed 15 HR practices in 1994
which became seven in 1998:
1. Employment security;
2. Selective hiring;
3. Self-managed teams;
4. High compensation contingent on performance;
5. Training;
6. Reduction of status differentials; and
7. Sharing information.
Arthur (1992 and 1994) found that HR practices focused on enhancing employee commitment (e.g.
decentralised decision-making, comprehensive training, salaried compensation, and employee
participation) were related to higher performance. Conversely, he found that HR practices that
UUnniivveerrssiittyy ooff PPrreettoorriiaa eettdd –– KKaasssseellmmaann,, RR ((22000066))

University of Pretoria Kasselman, R
(2006)
38
focused on control, efficiency and the reduction of employee skills and discretion were associated
with increased staff turnover and poorer manufacturing performance. Similarly, in a study of high
performance work practices, Huselid (1995) found that investments in HR activities such as incentive
compensation, selective staffing techniques and employee participation resulted in lower turnover,
greater productivity, and increased organisational performance through their impact on employee
skills development and motivation.
What the view shows is that where more of the high performance HRM practices is used, the better
the performance as indicated by productivity, turnover or financial indicators. Although support for
this view seems to exist, there are notable differences as to what constitutes a “best” practice. The
requirement is to look past the talk and terminology being used to be able to see the value creation in
Human Capital.
2.6.2 Reporting Human Capital Measures
According to Huselid (1995), there are two major issues with Human Capital measures:
1. There is no common framework for reporting that goes beyond historical measures (e.g. cost of
selection, or training) to “more detailed information on workforce quality”.
2. Many firms lack databases and audited information that can give strong and relevant information
to investors.
Developing a consistent and coherent internal HR architecture on Human Capital measurement is a
necessary condition for effective external reporting. The three factors that explain why companies
do not report more on Human Capital (Stiles and Kulvisaechana, 2002) are:
• The fear of competitors - anxiety over whether Human Capital information is competitively
sensitive;
• The fear of unions or employees; that is, concern that providing too much information may restrict
the organisation’s flexibility (and worries over legal issues arising); and
UUnniivveerrssiittyy ooff PPrreettoorriiaa eettdd –– KKaasssseellmmaann,, RR ((22000066))
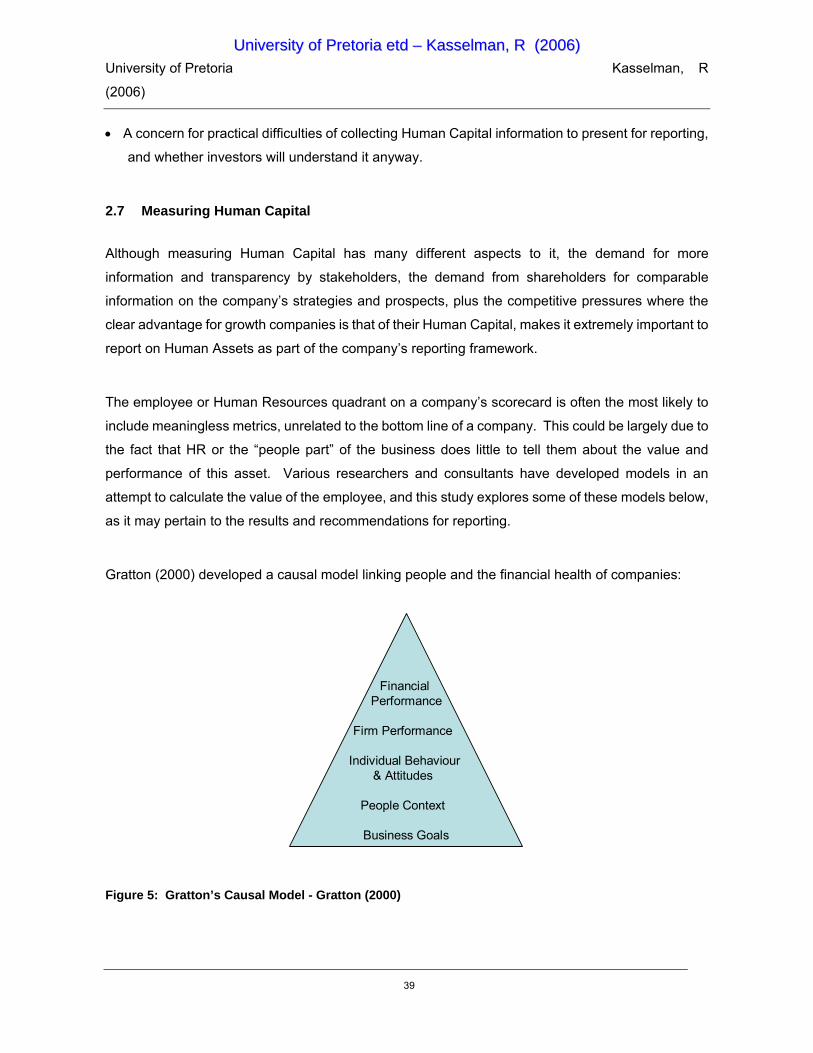
University of Pretoria Kasselman, R
(2006)
39
• A concern for practical difficulties of collecting Human Capital information to present for reporting,
and whether investors will understand it anyway.
2.7 Measuring Human Capital
Although measuring Human Capital has many different aspects to it, the demand for more
information and transparency by stakeholders, the demand from shareholders for comparable
information on the company’s strategies and prospects, plus the competitive pressures where the
clear advantage for growth companies is that of their Human Capital, makes it extremely important to
report on Human Assets as part of the company’s reporting framework.
The employee or Human Resources quadrant on a company’s scorecard is often the most likely to
include meaningless metrics, unrelated to the bottom line of a company. This could be largely due to
the fact that HR or the “people part” of the business does little to tell them about the value and
performance of this asset. Various researchers and consultants have developed models in an
attempt to calculate the value of the employee, and this study explores some of these models below,
as it may pertain to the results and recommendations for reporting.
Gratton (2000) developed a causal model linking people and the financial health of companies:
Financial Performance
Firm Performance
Individual Behaviour & Attitudes
People Context
Business Goals
Figure 5: Gratton’s Causal Model - Gratton (2000)
UUnniivveerrssiittyy ooff PPrreettoorriiaa eettdd –– KKaasssseellmmaann,, RR ((22000066))
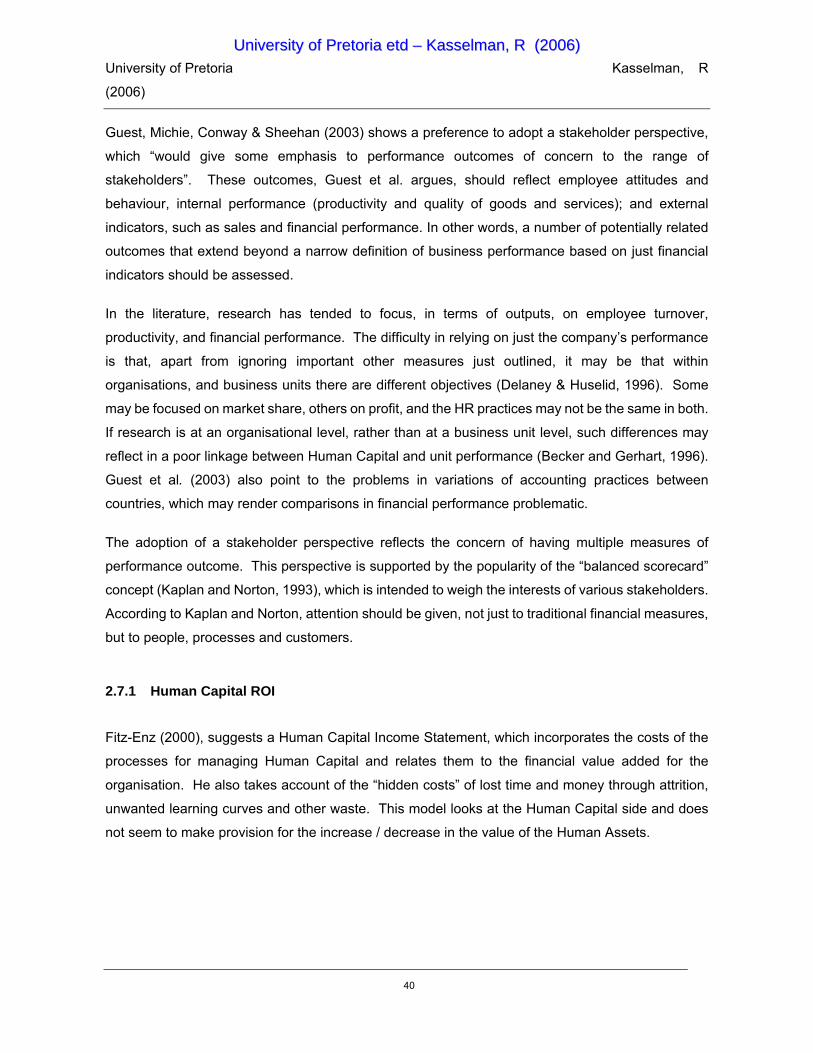
University of Pretoria Kasselman, R
(2006)
40
Guest, Michie, Conway & Sheehan (2003) shows a preference to adopt a stakeholder perspective,
which “would give some emphasis to performance outcomes of concern to the range of
stakeholders”. These outcomes, Guest et al. argues, should reflect employee attitudes and
behaviour, internal performance (productivity and quality of goods and services); and external
indicators, such as sales and financial performance. In other words, a number of potentially related
outcomes that extend beyond a narrow definition of business performance based on just financial
indicators should be assessed.
In the literature, research has tended to focus, in terms of outputs, on employee turnover,
productivity, and financial performance. The difficulty in relying on just the company’s performance
is that, apart from ignoring important other measures just outlined, it may be that within
organisations, and business units there are different objectives (Delaney & Huselid, 1996). Some
may be focused on market share, others on profit, and the HR practices may not be the same in both.
If research is at an organisational level, rather than at a business unit level, such differences may
reflect in a poor linkage between Human Capital and unit performance (Becker and Gerhart, 1996).
Guest et al. (2003) also point to the problems in variations of accounting practices between
countries, which may render comparisons in financial performance problematic.
The adoption of a stakeholder perspective reflects the concern of having multiple measures of
performance outcome. This perspective is supported by the popularity of the “balanced scorecard”
concept (Kaplan and Norton, 1993), which is intended to weigh the interests of various stakeholders.
According to Kaplan and Norton, attention should be given, not just to traditional financial measures,
but to people, processes and customers.
2.7.1 Human Capital ROI
Fitz-Enz (2000), suggests a Human Capital Income Statement, which incorporates the costs of the
processes for managing Human Capital and relates them to the financial value added for the
organisation. He also takes account of the “hidden costs” of lost time and money through attrition,
unwanted learning curves and other waste. This model looks at the Human Capital side and does
not seem to make provision for the increase / decrease in the value of the Human Assets.
UUnniivveerrssiittyy ooff PPrreettoorriiaa eettdd –– KKaasssseellmmaann,, RR ((22000066))
University of Pretoria Kasselman, R
(2006)
41
Figure 6: A Human Capital Income Statement Fitz-End (2002)
Another model for the calculation of ROI comes from the Corporate Leadership Council in the USA
(2002). This model focuses on the actual intervention(s) offered by HR and works as follows:
Calculate all the costs of the intervention, including the time of specialists and participants, then
multiply the number of employees participating by:
• The percentage of the job related to performance changes
• The performance change (in standard deviations)
• The value of one standard deviation in performance
• The duration of performance gain in x number of years
Then subtract the costs and divide the result by the costs to give return on investment.
The cost lines in this statement may not be 100% accurate; however, this approach has considerable
merit because it defines the financial cost of maintaining Human Capital in relation to the financial
value added it produces.
UUnniivveerrssiittyy ooff PPrreettoorriiaa eettdd –– KKaasssseellmmaann,, RR ((22000066))

University of Pretoria Kasselman, R
(2006)
42
2.7.2 Human Capital Index (HCI)
The contribution of Human Capital to aggregate productivity growth is important, but uncertainty
remains about its magnitude and calculating the effect on the bottom line in real monetary terms.
Brown (1999) developed two models he calls the Simple Human Capital Index and Complicated
Human Capital Index.
2.7.2.1 Simple HC Index
This index is made up of four sub-metrics:
• Number of years in the business / field.
• Level in the company (by job/grade or organisational chart level).
• Performance rating.
• Number and variety of positions / assignments held.
Each of these four factors is weighted, based on their relative importance. Each individual is then
given a score based on these factors. This index may tell a company about the strength of a team
and the entire workforce, and provide a method to calculate the true loss of a key person to turnover.
The limitation of this index is that it does not take into consideration the potential of the individual,
whilst the advantage is that it is relatively simple and easy to understand and administer (Brown,
1999).
2.7.2.2 Complex HC Index
This index takes into consideration the level of competency or skills mix and first weights the two
dimensions of skills/competencies vs. experience/performance. This weighting could be different for
UUnniivveerrssiittyy ooff PPrreettoorriiaa eettdd –– KKaasssseellmmaann,, RR ((22000066))

University of Pretoria Kasselman, R
(2006)
43
companies wanting to acquire new skills vs. a company who is concerned with having seasoned
employees.
Skills and competencies are categorised in technical and non-technical and these are then rated
according to the person’s level of proficiency in each area. The overall Human Capital score for each
employee is then calculated by taking the competency score multiplied by the weight and the
experience score multiplied by the weight (Brown, 1999).
2.7.3 Best Investment in Human Capital (BIHC)
Best Investment in Human Capital (BIHC) provides a framework for Human Resources to move from
a soft-skill business to one based on hard-skill measurement (Weiss, 1999). “Best” reflects
comparative analyses of the company’s current investment performance versus external standards.
“Investment” refers to the change in treating the money and effort spent on developing HC as an
investment rather than cost. “HC” refers to the money and effort it takes to cultivate people and their
talent, reflecting the economic value of the knowledge, skill, experience and innovations of people in
the company to be productive and competitive (Weiss, 1999).
2.7.4 Balanced Scorecard (BSC)
The Balanced Scorecard (BSC) was not designed specifically to measure and publish intangible
assets, only to take a more “balanced view” on internal performance measurement. The objectives
and the measures of the scorecard are derived from an organisation’s vision and strategy and thus
complement the financial measures of past performance with measures of the drivers of future
performance.
The Balanced Scorecard (Kaplan and Norton, 1996) seeks to align the evaluation of Human Capital
to the company‘s strategic aims under four headings:
1. Financial success (to succeed financially, how should we appear to customers?)
2. Customer success (to achieve our vision, how should we appear to customers?)
UUnniivveerrssiittyy ooff PPrreettoorriiaa eettdd –– KKaasssseellmmaann,, RR ((22000066))

University of Pretoria Kasselman, R
(2006)
44
3. Operational success (to satisfy our shareholders and customers, at what business processes
must we excel?); and
4. Learning and growth (to achieve our vision, how shall we sustain our ability to change and
improve?)
Kaplan and Norton distinguish between outcome measures (which they term “lag measures”) and
performance drivers (termed “lead measures”), and emphasise that a good scorecard should have a
mixture of both. Although organisations may have hundreds of performance measures scattered
through the various functions, they are frequently unconnected with the financial outcomes that
govern decisions at the top level.
The Balanced Scorecard does not specifically focus on people - it is implicit that each of the four sets
of outcomes is generated by them. However, some company applications have changed the name
of the learning and growth perspective to “employees” or “people”. Kaplan and Norton (1996) did
include in these perspective two sets of people performance drivers, as follows.
• Employee capabilities
In this area, three outcome measurements are identified as:
1. Employee satisfaction.
2. Employee retention.
3. Employee productivity.
Driven by the following enablers:
• Staff competence.
• Technology infrastructure.
UUnniivveerrssiittyy ooff PPrreettoorriiaa eettdd –– KKaasssseellmmaann,, RR ((22000066))
University of Pretoria Kasselman, R
(2006)
45
• The climate for action.
• Motivation, empowerment, and alignment.
The outcome measures described here are:
• Measures of suggestions made and implemented.
• Measures of improvement (in processes).
• Measures of organisational and individual alignment (this refers to individual and team goals
being consistent with and supportive of the overall business goals).
Kaplan and Norton (1996) state that they can supply fewer examples of company-specific measures
the human capital (people) perspective compared to the financial, customer and internal process
perspectives in their balanced scorecard.
Becker et al. (2001) argue that Human Capital is the foundation of value creation based on the fact
that up to 85% of a company’s value is based on intangibles, and propose an adaptation of the
Balanced Scorecard called HR Scorecard (discussed next). As the BSC achieves its purpose to
balance the traditional (financial) perspective by adding the three other perspectives, there could, in
principle, be many more perspectives.
2.7.5 HR Scorecard
The HR scorecard (Becker et al., 2001) seeks to link HR policies and practices to the firm‘s strategic
aims and values via analysis and measurement of essential workforce outcomes, employee
behaviours, workforce competencies, workforce costs and investments and cultural attributes.
UUnniivveerrssiittyy ooff PPrreettoorriiaa eettdd –– KKaasssseellmmaann,, RR ((22000066))

University of Pretoria Kasselman, R
(2006)
46
The model recognises the importance of both intangible and tangible assets, as well as of financial
and non-financial measures. It also acknowledges the complex, value-generating connections
among the firm’s customers, operations, employees, and technology, and integrates HR’s role in an
unprecedented way. The model highlights the important distinction between lagging and leading
indicators. Lagging indicators, such as financial metrics, typically reflect only what has happened in
the past. Such metrics may accurately measure the impact of prior decisions, but they won’t help
one to make today’s decisions, nor do they guarantee future outcomes.
REVENUEHuman capital value added $2665 Revenue less nonhuman expenses
DIRECT EXPENSESAcquiring 15 Cost of hiringMaintaining 1128 Pay and benefit costDeveloping 12 Cost of training
GROSS INCOME 1510
INDIRECT EXPENSESVacancy costs 126 Revenue lost for, say, jobs unfilledLearning curve 438 Revenue lost for partial production
during first year of employment
NET INCOME 946
Figure 7: Transforming the HR Architecture into a Strategic Asset - Becker et al. (2001)
Becker et al. (2001) list a Seven-Step Model for Implementing HR’s Strategic Role with a strong
focus on designing a Strategic HR Measuring System.
• Step 1: Clearly Define Business Strategy
At the strategy-development “table,” senior HR leaders provide an essential perspective. The key is
to state the firm’s goals in such a way that employees understand their role and the organisation
knows how to measure its success in achieving them.
• Step 2: Build a Business Case for HR as a Strategic Asset
UUnniivveerrssiittyy ooff PPrreettoorriiaa eettdd –– KKaasssseellmmaann,, RR ((22000066))

University of Pretoria Kasselman, R
(2006)
47
Once a firm clarifies its strategy, HR professionals should be able to build a clear business case for
why and how HR can support that strategy, showing the high-performance work system that has a
distinct, positive influence on a firm’s financial performance.
The business case for a strategic HR role must also incorporate HR’s key influence on strategy implementation and the role of strategically focused measurement systems.
Figure 8: HR and Strategy Implementation - Becker et al. (2001)
• Step 3: Create a Strategy Map
Clarifying the firm’s strategy sets the stage for implementing that strategy. To define the
value-creation process, the top- and mid-level managers who will be implementing the firm’s strategy
should develop a strategy map to represent the firm’s value chain, asking the following questions:
• Which strategic goals/objectives/outcomes are critical rather than “nice to have”?
• What are the performance drivers for each goal?
UUnniivveerrssiittyy ooff PPrreettoorriiaa eettdd –– KKaasssseellmmaann,, RR ((22000066))

University of Pretoria Kasselman, R
(2006)
48
• How would progress toward these goals be measured?
• What are the barriers to the achievement of each goal?
• How would employees need to behave to ensure that the company achieves these goals?
• Is the HR function providing the company with the employee competencies and behaviours
necessary to achieve these objectives?
• If not, what needs to change?
A strategy map of the value-creation process contains hypotheses, or predictions, about which
organisational processes drive firm performance. Normally, a company validates these hypotheses
only after achieving targets on performance drivers and observing the impact of these results on firm
performance.
• Step 4: Identify HR Deliverables within the Strategy Map
HR creates much of its value at the points of intersection between the HR system (rewards,
competencies, work organisation, etc.) and the strategy implementation system. Maximising that
value requires an understanding of both sides of that intersection.
• Step 5: Align the HR Architecture with HR Deliverables
Evaluate how the HR system (rewards, competencies, work organisation, etc.) can be structured so
as to provide those deliverables i.e. bottom up.
UUnniivveerrssiittyy ooff PPrreettoorriiaa eettdd –– KKaasssseellmmaann,, RR ((22000066))

University of Pretoria Kasselman, R
(2006)
49
•Market rewards•Career opportunities
Senior staff employment
stability
R&D cycle time
Focus of HR system Alignment
HR Deliverable(enabler)
Single Performance Driver
Figure 9: Intersection of HR with Strategy Map - Becker et al. (2001)
• Step 6: Design the Strategic HR Measurement System
Steps 1 through 5 guide the development of the HR architecture and lay the groundwork necessary
to measure the HR-firm performance relationship. In Step 6, the actual design of the HR
measurement system takes place. To measure the HR-firm performance relationship with precision,
valid measures of HR deliverables need to be developed.
1. Choose the correct HR performance drivers and enablers. This requires comprehension of the
causal chain for effective strategy implementation of the organisation.
2. Choose the correct measures for those deliverables and measure those variables accurately.
Becker et al. (2001) go on to illustrate the measurement choices facing HR professional Figure 11
below).
UUnniivveerrssiittyy ooff PPrreettoorriiaa eettdd –– KKaasssseellmmaann,, RR ((22000066))

University of Pretoria Kasselman, R
(2006)
50
Figure 10: The Creation of Employee Strategic Focus through Increasing Measurement Sophistication - Becker et al. (2001)
Most HR measurement systems fall in the traditional category, or Stage 1. These include
operational metrics such as cost per hire and activity counts. The gap between Stages 1 and 2 in the
diagram symbolises the substantial divide between strategically and operationally focused HR
measurement systems.
In the second stage, HR measures have the aura of strategic import, but they do little to validate HR’s
role as a strategic contributor. If companies declare their “people” measures, such as employee
satisfaction, as having strategic value, and these metrics are used in the reward system, there is a
“balance” between financial and non-financial measures, but there is no consensus about how these
variables serve to implement strategy. There is therefore no strategic logic linking these measures
together.
Stage 3 is a key transition point. The firm includes non-financial measures (among them HR
measures) in its strategic performance measurement system. In addition, it locates each measure
within a strategy map - assisting HR to legitimately track HR’s contribution to firm performance.
UUnniivveerrssiittyy ooff PPrreettoorriiaa eettdd –– KKaasssseellmmaann,, RR ((22000066))

University of Pretoria Kasselman, R
(2006)
51
In Stage 4, HR measurement systems let the firm estimate the impact of HR policies on firm
performance. If the firm’s value chain is short, the company can gauge the full impact of HR on
overall performance. In organisations with more complex value chains, estimates of HR’s influence
may be limited to segments within the chain.
• Step 7: Implement Management by Measurement
Once the HR Scorecard is developed, and if the Scorecard is aligned with the imperatives of the
firm’s strategy, HR professionals will have new insight into what it takes to actually manage HR as a
strategic asset.
According to Becker et al. (2001), implementing a new management process based on the work
done in Steps 1 through 6 requires considerable change and flexibility, and the process is not just a
one-time event. Human resource executives must regularly review the HR deliverables they’ve
defined in order to be sure that these drivers and enablers remain strategically significant. This is
particularly true for HR enablers that have direct links to specific business objectives. Some
questions arise:
• How many HR professionals can build business cases to support a company strategy?
• What is the profile and competence of the HR professional to support such measures?
Research is required to identify the extent of this competency among HR professionals. Skilled HR
managers understand when an enabler is no longer playing a strategic role and needs to be replaced
(Becker et al., 2001).
2.8 Measuring Intellectual Capital
Intellectual Capital (IC) is concerned with accounting for the firm’s future prospects in an
organisational mode. It is concerned with laying out the competencies which represent drivers of
growth as potentialities (Brooking, 1997; Edvinsson & Malone, 1997; Johansson, 1998; Johansson
et al., 1998; Roos et al., 1997a; Roslender, 1997; Stewart, 1997; and Sveiby, 1997). It is not
concerned with the growth found in present markets, technologies and products, but it is rather
focused on mobilising internal, foundational capabilities and competencies useful for growth in a
UUnniivveerrssiittyy ooff PPrreettoorriiaa eettdd –– KKaasssseellmmaann,, RR ((22000066))
University of Pretoria Kasselman, R
(2006)
52
long-term perspective (cf. Hamel and Pralahad, 1994; Roberts, 1998; and Wernerfeld, 1984). Here,
organisational capabilities and competencies constitute the specific bases - organisational routines -
for competitiveness built up over a long period of time and realised in a multitude of products and
technologies over time. Growth and value creation are not a matter of particular products and
markets but of the broad organisational knowledge, unique to a firm, which allows it constantly to
adapt to changing conditions.
A few models have been developed to measure Intellectual Capital.
2.8.1 Intellectual Capital (IC) Index
An IC statement is a set model; not a set calculation that arrives at a digit for the worth of a firm’s
intellectual capital. IC includes employees, organisation, and customers for a possible extended
reporting on a firm’s situation beyond the narrowly financial measures typically reported on.
Tangible assets, albeit important, are not decisive. More important is the “value of the talented
people” that are valuable because they are part of an organisational system. Such a competence
theory (Grant, 1996) suggests that organisational competence is gradually built and historically
forged, and always placed in the uneasy position between discursive and tacit understanding of
organisational rules of conduct. It directs attention to internal processes within the firm and not
merely to external markets and competition.
The IC index is a second generation model that attempts to consolidate all the different individual
indicators into a single index and correlate the changes in Intellectual Capital with changes in market
value. This index was developed by Johan and Göran Roos who concluded that because it was so
difficult to measure Intellectual Capital itself, the focus should be on measuring changes (Roos &
Roos, 1997b). To this end they developed the IC-Index tool.
2.8.2 EFQM Excellence Model (EFQM)
The EFQM Excellence Model is a non-prescriptive, self-assessment approach, developed as a
framework for assessing applications for the European Quality Award (ECEDG, 2000). It uses nine
criteria covering
1 Leadership;
UUnniivveerrssiittyy ooff PPrreettoorriiaa eettdd –– KKaasssseellmmaann,, RR ((22000066))

University of Pretoria Kasselman, R
(2006)
53
2 Policy and strategy;
3 People;
4 Partnerships and resources;
5 Processes;
6 Customer results;
7 People results;
8 Society results; and
9 Key performance results.
Points are allocated based on assessment of results, approach, deployment and assessment and
review.
2.8.3 People Value Add (PVA)
Kunath (2003) said that “people value” drives all economic value added, and HR functions are high
on his list of those organisational units that have not “sold” their true importance within most
organisations. To meet the challenge of measuring the value added by people, a ratio, People Value
Add (PVA), has been defined as the Economic Value Add (EVA) divided by the capitalised value of
employee costs. It recognises that financial value is ultimately dependent on Human Capital.
2.8.3.1 Economic Value Add (EVA)
Economic Value Add (EVA) is a comprehensive performance measure that uses the variables of
capital budgeting, financial planning, goal setting, performance measurement and incentive
compensation to account for all the ways in which corporate value can be added or lost, and
UUnniivveerrssiittyy ooff PPrreettoorriiaa eettdd –– KKaasssseellmmaann,, RR ((22000066))

University of Pretoria Kasselman, R
(2006)
54
concentrates on changes in value as a result of new projects. It has been applied to Human
Resource measurement by the Saratoga Institute, deriving metrics from the key drivers of value for
the organisation.
EVA = Net operating profit after taxes (NOPAD) - Capital x Cost of Capital.
The capital charge is the most distinctive and important aspect of EVA. Under conventional
accounting, most companies appear profitable but many in fact are not. As Drucker (1995:1-9)
stated in a Harvard Business Review article, “Until a business returns a profit that is greater than its
cost of capital, it operates at a loss. Never mind that it pays taxes as if it had a genuine profit. The
enterprise still returns less to the economy than it devours in resources... Until then it does not create
wealth; it destroys it”. EVA corrects this error by explicitly recognising that when managers employ
capital they must pay for it, just as if it were a wage.
EVA, relating profits or cash flow to tangible assets, capital employed or equity, defines that only by
focusing on tangible flows are shareholders guaranteed that management will create “shareholder
value”. EVA is generally used and accepted in industry as a measure for Human Capital and has
been used by Fitz-end (2000). This involves deriving metrics from the key drivers of value for the
organisation. Examples of these metrics include: Revenue per Employee; Employee contribution to
critical outputs (process), and the effectiveness of HR within the organisation.
This method is internally focused and does not report on Human Assets, rather on HR specific
indices; i.e. best ways to manage the Human Asset. The EVA approach from finance relies heavily
on discounted cash flow to evaluate the net present value of a capital project. If the return on capital
is greater than the cost of capital, then value is created and the project should be implemented. This
financial theory of capital will be used as a model from which to develop the measurement of
Intellectual Capital. According to Robinson and Kleiner (1996), this financial project evaluation
approach, which relies on value creation, should be applied to all of the internal processes of the
value chain.
2.9 Measuring Intangibles
As Human Capital may be considered as an intangible asset, an understanding of the methods used
to value intangibles is required. When researching the measurement of intangibles, it was found that
UUnniivveerrssiittyy ooff PPrreettoorriiaa eettdd –– KKaasssseellmmaann,, RR ((22000066))

University of Pretoria Kasselman, R
(2006)
55
suggested measuring approaches for intangibles fall into at least four categories of measurement.
The categories are an extension of the classifications suggested by Luthy (1998).
1 Human Capital
2 Customer Capital
3 Organisational Capital
4 Intellectual Capital
Intangible assets are a broader category than Human Capital and include aspects such as
Intellectual Capital, copyright, brands, customer service and company image. Human Capital is thus
seen initially as one element of a sub-set of intangibles as defined by Arthur Anderson (Group,
1998).
Measuring Intangible Capital has been approached in various manners - some of which are briefly
described below:
Direct Intellectual Capital Methods (DIC)
This method estimates the Rand value of intangible assets by identifying its various components.
Once these components are identified, they can be directly evaluated, either individually or as an
aggregated coefficient.
Market Capitalisation Methods (MCM)
This method calculates the difference between a company’s market capitalisation and its
stockholders’ equity as the value of its Intellectual Capital or intangible assets.
Return on Assets (ROA)
UUnniivveerrssiittyy ooff PPrreettoorriiaa eettdd –– KKaasssseellmmaann,, RR ((22000066))

University of Pretoria Kasselman, R
(2006)
56
This method uses the average pre-tax earnings of a company for a period of time, divided by the
average tangible assets of the company. The result is a company ROA that is then compared with its
industry average. The difference is multiplied by the company’s average tangible assets to calculate
an average annual earning from the Intangibles. By dividing the above-average earnings by the
company’s average cost of capital or an interest rate, one can derive an estimate of the value of its
Intangible Assets or Intellectual Capital.
The above categories are an extension of the classifications suggested by Luthy (1998) and Williams
(2000), and have been applied for various situations; e.g. the methods offering $-valuations, such as
ROA and MCM methods. These are useful in merger and acquisition situations and for stock market
valuations.
The following figure provides a graphical illustration of the various Intangible Assets measuring
models. Details of those considered most important by the researcher are provided thereafter.
UUnniivveerrssiittyy ooff PPrreettoorriiaa eettdd –– KKaasssseellmmaann,, RR ((22000066))

University of Pretoria Kasselman, R
(2006)
57
Figure 11: Invisible Assets Measuring Models - adapted from Sveiby (1997)
2.9.1 Skandia Navigator / Intangible Assets Monitor
The Skandia Navigator, pioneered by Leif Edvidsson (Anon 1992) is a collection of critical
measurements that aim to provide a balanced view of performance and goal achievement. This
monitor is considered by the researcher as the most comprehensive of all the Intangible measures.
It is based on identification of critical indicators under five perspectives linked to the value creation
process:
1 Financial focus
2 Customer focus
3 Process focus
4 Renewal and development focus and
5 Human focus
Figure 12: Skandia Framework – Edvidsson (in Anon, 1992)
UUnniivveerrssiittyy ooff PPrreettoorriiaa eettdd –– KKaasssseellmmaann,, RR ((22000066))
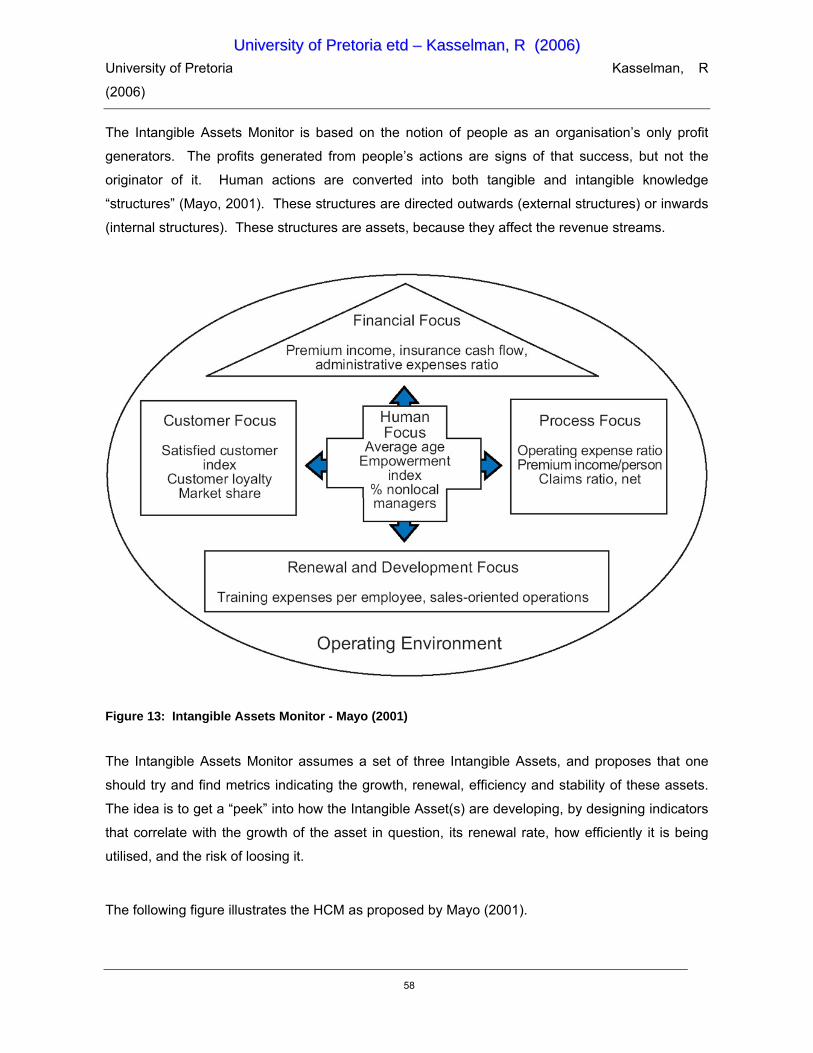
University of Pretoria Kasselman, R
(2006)
58
The Intangible Assets Monitor is based on the notion of people as an organisation’s only profit
generators. The profits generated from people’s actions are signs of that success, but not the
originator of it. Human actions are converted into both tangible and intangible knowledge
“structures” (Mayo, 2001). These structures are directed outwards (external structures) or inwards
(internal structures). These structures are assets, because they affect the revenue streams.
Figure 13: Intangible Assets Monitor - Mayo (2001)
The Intangible Assets Monitor assumes a set of three Intangible Assets, and proposes that one
should try and find metrics indicating the growth, renewal, efficiency and stability of these assets.
The idea is to get a “peek” into how the Intangible Asset(s) are developing, by designing indicators
that correlate with the growth of the asset in question, its renewal rate, how efficiently it is being
utilised, and the risk of loosing it.
The following figure illustrates the HCM as proposed by Mayo (2001).
UUnniivveerrssiittyy ooff PPrreettoorriiaa eettdd –– KKaasssseellmmaann,, RR ((22000066))

University of Pretoria Kasselman, R
(2006)
59
Figure 14: Human Capital Monitor – Mayo (2001)
Sveiby (1997) recommended having only one or two measures in each box. He uses the term
“employee competence” for Human Capital, and he confines this to “professionals”. This seems
appropriate for totally knowledge-based companies such as consulting firms, but could overlook the
very real added value provided by others.
Sveiby’s (1997) leverage effect is a formula that looks at the effect of the firm’s own professionals in
generating revenue, in the context of all the Human Capital available.
UUnniivveerrssiittyy ooff PPrreettoorriiaa eettdd –– KKaasssseellmmaann,, RR ((22000066))

University of Pretoria Kasselman, R
(2006)
60
The formula is as follows:
Profit Revenue #employees &
freelancers Profit per
Professional =
Revenue
X
#employees &
freelancers
X
Number of
professionals
General
efficiency factor
Sales
efficiency
factor
Personnel efficiency
factor
Leverage indicator
Equation 1: Sveiby’s leverage effect formula – Sveiby (1997)
Under the “internal structure” category several measures relating to Human Capital are included:
• Proportion of support staff to total employees (efficiency).
• Sales per support person (efficiency) .
• Values and attitudes (efficiency).
• Age of the organisation (stability).
• Support staff turnover (stability).
• “Rookie ratio”- number of people with less than two years’ employment (stability).
Sveiby (1997) compares the Balanced Scorecard with the Intangible Assets Monitor. He notes that
there are clear similarities between the non-financial areas of focus and their links to the strategy of
UUnniivveerrssiittyy ooff PPrreettoorriiaa eettdd –– KKaasssseellmmaann,, RR ((22000066))

University of Pretoria Kasselman, R
(2006)
61
the firm. The two were developed independently, but both recognise the importance of intangible
assets.
2.10 Valuing Assets
Invisible assets are the key drivers of shareholder value in the knowledge economy, but accounting
rules do not acknowledge this shift in the valuation of companies. Statements prepared under GAAP
do not record these assets. GAAP covers such aspects as revenue recognition, balance sheet item
classification and outstanding share measurements. Companies are expected to follow GAAP rules
when reporting their financial data via financial statements.
There are a number of methods generally accepted and applied in valuing the assets of a company.
These traditional methods include:
• Cost based methods - these method typically look at acquisition or replacement cost.
• Market based methods - this method uses the price to be paid in an open market.
• Income based methods - this method uses the cash streams to be expected into the
organisation related to the contribution of the Human Asset, calculated as the present value of
the expected net cash flows.
Flamholz (1999) states that the aim of Human Resource management is to optimise Human
Resource value. He defines the measure of individual value as resulting from two interacting
variables: a person’s conditional value and the probability that they will stay with the organisation.
An individual’s conditional value is the present worth of the potential services that could be rendered
if they stay with the organisation for x number of years. The conditional value is a combination of
productivity (performance), transferability (flexible skills), and promotability. The latter two are
heavily influenced by the first element. This is then multiplied by a probability factor that the
individual will stay for the x number of years. This gives the expected realisable value, which is a
measure of the person’s worth. Flamholz (1999) extends the principle to evaluating the
effectiveness of development programmes. If a programme produces a measured change in
UUnniivveerrssiittyy ooff PPrreettoorriiaa eettdd –– KKaasssseellmmaann,, RR ((22000066))
University of Pretoria Kasselman, R
(2006)
62
productivity, transferability, or promotability, this translates into an increase in the value of the
individuals concerned.
There are a number of difficulties with this approach, not least of which is the estimation of potential
future services. It also leads to lower values for older and more experienced people who have less
time to render future services. There is a case for looking at them this way if one considers value
over a future lifetime, but it fails to take account of the wealth of value in past experience.
2.10.1 Calculated Intangible Value Method (CIV)
This method overcomes drawbacks of the market-to-book method of valuing intangibles, which
simply subtracts a company’s book value from its market value and labels the difference. Because it
rises and falls with market sentiment, the market-to-book figure cannot give a fixed value of
Intellectual Capital. CIV examines earnings performance and identifies the assets that produced
those earnings. In many cases, CIV also points to the enormity of the unrecorded value. The
formula is as follows:
• Step 1: Calculate average pre-tax earnings for a period e.g. three years.
• Step 2: Use the average year-end tangible assets for the same period.
• Step 3: Calculate the return on assets (ROA), by dividing earnings by assets.
• Step 4: Obtain the industry’s average ROA for the same period.
Step 5: Calculate the excess ROA by multiplying the industry average ROA by the company’s
tangible assets. Subtract this from the pre-tax earnings in step one to identify the company earnings
from its assets.
Step 6: Calculate the three-year average income tax rate and multiply this by the excess return.
Subtract the result from the excess return for the after-tax number, the premium attributable to
intangible assets.
UUnniivveerrssiittyy ooff PPrreettoorriiaa eettdd –– KKaasssseellmmaann,, RR ((22000066))

University of Pretoria Kasselman, R
(2006)
63
Step 7: Calculate the net present value of the premium by dividing the premium by an appropriate
discount rate e.g. weighted average cost of capital (WACC).
This apportions the calculated intangible value of the organisation, i.e. what doesn’t appear on the
balance sheet.
Figure 15: Intangible assets as a percentage of tangible assets – Value Line Publishing (1998)
2.11 Measuring Human Assets
2.11.1 Individual Human Asset Worth
A Human Capital Monitor considers what is it that makes one person more valuable than another
and concludes that the answer is very organisation specific. For some, it is finding people who will fit
in well and make good team members. For others, the ability to get certain kinds of results is all that
matters. So any approach has to have some flexibility to meet different situations.
UUnniivveerrssiittyy ooff PPrreettoorriiaa eettdd –– KKaasssseellmmaann,, RR ((22000066))
University of Pretoria Kasselman, R
(2006)
64
The formula suggested in the Human Capital Monitor for calculating Human Asset Worth (Mayo
2001):
HAW = EC × IAM / 1,000
(Human Asset Worth = Employment Cost × Individual Asset Multiplier / 1,000)
This is divided by 1,000 so that the end result will not look like a monetary amount that can be directly
compared with cost. The purpose is to be able to understand relativities and provide a guide to
taking appropriate actions.
Employment Cost (EC) = Base salary + value of benefits + employer taxes
This is the cost of employing a person, including taxes such as social security or national insurance,
and the value of the benefits package. It excludes bonuses unless they are in whole or part
guaranteed. It also does not include the overheads of providing space and equipment, as these are
so variable and are likely to be averaged out on a per person basis.
The Individual Asset Multiplier (IAM) is designed to reflect the different level of present and potential
value to the person’s current role and to the organisation. It uses a Weighted Average assessment
of:
• Capability- the cumulative skills, knowledge, experience, and useful networks.
• Potential- to grow and contribute at a higher level.
• Contribution- to stakeholder value.
• Alignment- to organisational values.
To calculate the IAM, each of the factors is assessed on a scale of 0.1 to 2.0. These four factors are
assigned a percentage importance out of 100; i.e., if all were equal, 25% to each. In some
companies, and for some groups of people, potential may be deemed less important etc.
UUnniivveerrssiittyy ooff PPrreettoorriiaa eettdd –– KKaasssseellmmaann,, RR ((22000066))

University of Pretoria Kasselman, R
(2006)
65
Capability
The value of an individual is in all their cumulative knowledge, skills, experience, and their relevant
network of contacts. It is more than whether they have what is required by their current role. Their
breadth is a measure of their flexibility for deployment in different roles - and this makes them more
valuable. Whereas it is difficult to encapsulate this in numbers, it should be relatively easy to make
judgments, as follows:
0.5 Has some noticeable deficiencies compared to expectations for this role.
1.0 Generally has the balance of capability expected for this role.
1.5 In several areas exceeds the level needed for the role; has unique knowledge and experience, and capability that can be applied in various other roles.
2.0 Has considerable breadth and depth beyond the basic needs of the role; known for unique expertise or has a range of capabilities that can be applied very flexibly.
UUnniivveerrssiittyy ooff PPrreettoorriiaa eettdd –– KKaasssseellmmaann,, RR ((22000066))
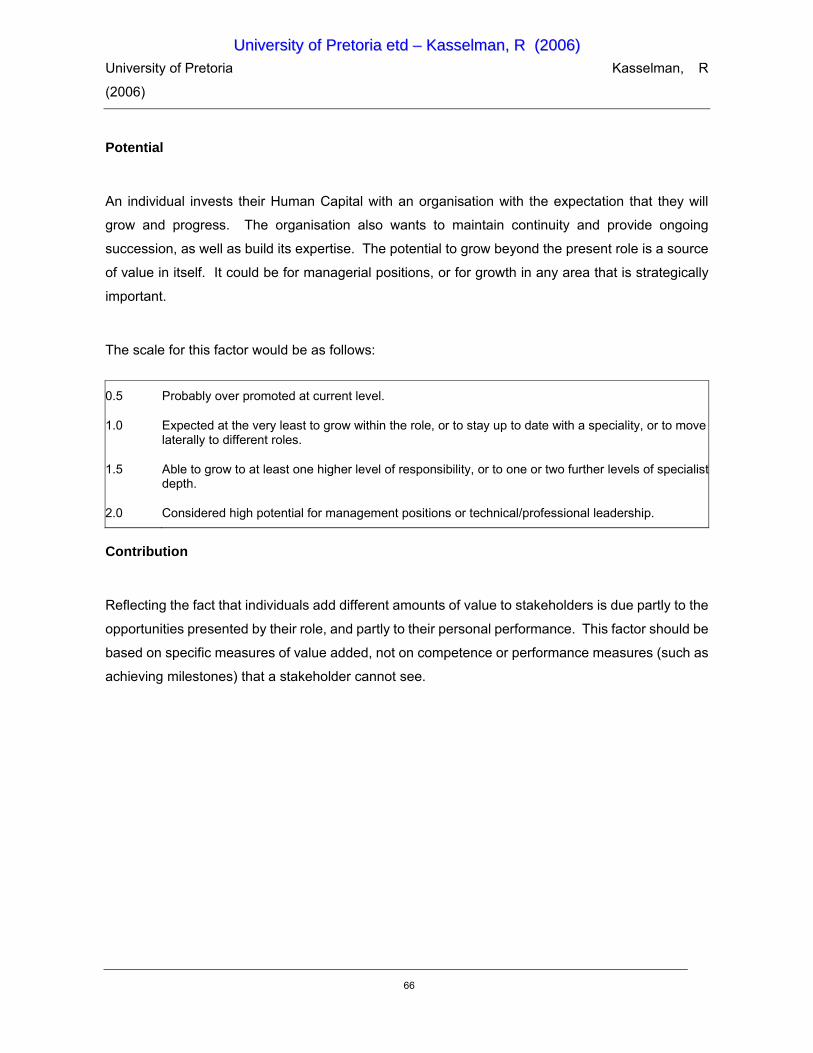
University of Pretoria Kasselman, R
(2006)
66
Potential
An individual invests their Human Capital with an organisation with the expectation that they will
grow and progress. The organisation also wants to maintain continuity and provide ongoing
succession, as well as build its expertise. The potential to grow beyond the present role is a source
of value in itself. It could be for managerial positions, or for growth in any area that is strategically
important.
The scale for this factor would be as follows:
0.5 Probably over promoted at current level.
1.0 Expected at the very least to grow within the role, or to stay up to date with a speciality, or to move laterally to different roles.
1.5 Able to grow to at least one higher level of responsibility, or to one or two further levels of specialist depth.
2.0 Considered high potential for management positions or technical/professional leadership.
Contribution
Reflecting the fact that individuals add different amounts of value to stakeholders is due partly to the
opportunities presented by their role, and partly to their personal performance. This factor should be
based on specific measures of value added, not on competence or performance measures (such as
achieving milestones) that a stakeholder cannot see.
UUnniivveerrssiittyy ooff PPrreettoorriiaa eettdd –– KKaasssseellmmaann,, RR ((22000066))

University of Pretoria Kasselman, R
(2006)
67
The evaluation scale for this factor is suggested as follows:
0.5 Makes some measurable contribution to non-financial measures.
1.0 Makes an average level of contribution to either a financial or a non-financial measure, or a combination.
1.5 Makes an above-average contribution to either a financial or a non- financial measure, or a combination, with a significant proportion being aimed at future value creation.
2.0 Contributes considerably more to both financial and non-financial value measures than the average employee, with the majority aimed at future value creation.
Alignment
“Values”, in the sense of the philosophy or ethos of the organisation, may be expressed formally in
written (or espoused) form, or in an accepted unwritten understanding. In some organisations, but
not all, this would be a key factor. Managers make judgments about “chemistry” and “fit” when they
hire people. Good-performing, capable people who comfortably align themselves to our values have
particular worth. They become “part of us” and are likely to be loyal to the organisation.
0.5 Shows little alignment to corporate values.
1.0 Behaviour does not explicitly conflict with values.
1.5 Makes considerable effort to live as many of the values as possible.
2.0 Known throughout as a role model for the organisation’s values.
2.11.2 Collective Human Asset Worth
The purpose of an organisation is to organise the Human Capital of individuals in ways that produce
more than they would as individual contributors. A team should be more than the sum of the
individuals that make it up. Workgroup effectiveness is picked out as one of the contributing factors
to the value-adding contribution. For the purposes of asset value comparisons, the combination of
the Human Asset Worth of all the members of the team can be used.
Monti-Belkaoui & Riahi-Belkaoui (1995) suggested that Human Resource valuation should be based
on value-addition, as it is a measure of wealth. Value addition is defined as the increase in wealth,
generated by the productive use of the companies’ resources before it’ allocation among
UUnniivveerrssiittyy ooff PPrreettoorriiaa eettdd –– KKaasssseellmmaann,, RR ((22000066))

University of Pretoria Kasselman, R
(2006)
68
stakeholders. A discussion paper by the Accounting Standards Committee in 1975 recommended
that, amongst other things, a statement of value added showing how the benefits of the efforts of an
enterprise are shared by employees, providers of capital, the government and reinvestment, be
included in the external reporting.
The relative value of teams and departments
Efforts on the retention of talent can be focused through seeing the relative value of different groups
of people. This value may then be compared with the contribution that the group is making, and their
costs. Mayo (2001) states that there should be a more or less linear relationship between “asset
value” and “value added” for most groups.
The distribution of potential
An understanding of how potential is distributed and where continuity problems exist is required.
The extent of values alignment
The factors that have been judged need to be taken into account to get a feel of how values
alignment is distributed in functions and in areas. This may lead to some action to shift the culture
more toward the espoused values.
The flexibility of the workforce
The higher the average factors for “capability,” the more flexible the group. In times of restructuring
this may save unnecessary redundancies and it also provides more options in career management.
This statement of value-add provides a useful measure to help gauge performance by relating key
figures such as capital employed and employee costs. The limitation of this reporting method is that
it reports on the performance, but not on the efficiency, of the value-addition.
UUnniivveerrssiittyy ooff PPrreettoorriiaa eettdd –– KKaasssseellmmaann,, RR ((22000066))

University of Pretoria Kasselman, R
(2006)
69
2.12 Selected International Case Studies
The following studies have been reviewed to assess the components of the framework against
potential applicability globally. These cases where selected from a research paper done by
University of Cambridge on Human Capital and Performance (Stiles and Kulvisaechana, 2003). The
cases list the types of HR measures and business measures which form part of the companies’
metrics and include the findings initiated due to the focus on these particular measures. These
cases were evaluated to identify any link between the HRM practices, are related to perceptual
measures of organisational performance. Links are found between employee productivity, cash
flow, and market value, and the value of HR initiatives measured for increase in productivity. Most
studies support the link between HRM and performance but do not imperially show that HRM causes
high performance.
Case study 1: Arthur (1994)
Single industry: 30 US steel mini-mills
HR measures: 10 variables - decentralisation, participation, general training, skilled workers, and level of supervision, social events, due process, wages, benefits, bonus, and percentage unionised. Clustered into two systems: control and commitment.
Outcome measures: manufacturing performance (labour efficiency, scrap rate) and employee turnover.
Controls: firm age, firm size, union status, business strategy.
Method: Regression
Findings: Commitment based HR systems associated with lower scrap rates and higher labour efficiency than control-based systems.
Case study 2: MacDuffie (1995)
Single industry: 62 automotive assembly plants in 16 countries (volume plants)
HR measures: HR policies (index of four items - hiring criteria, incentive pay, presence of status barriers and level of training)
Production organisation measures: use of buffers - 3 items, (e.g. incoming and work in progress inventory), work systems 6 items - including employment involvement (production-related suggestions, job rotation and quality tasks), total automation, production scale, model mix complexity, parts complexity, production design
UUnniivveerrssiittyy ooff PPrreettoorriiaa eettdd –– KKaasssseellmmaann,, RR ((22000066))
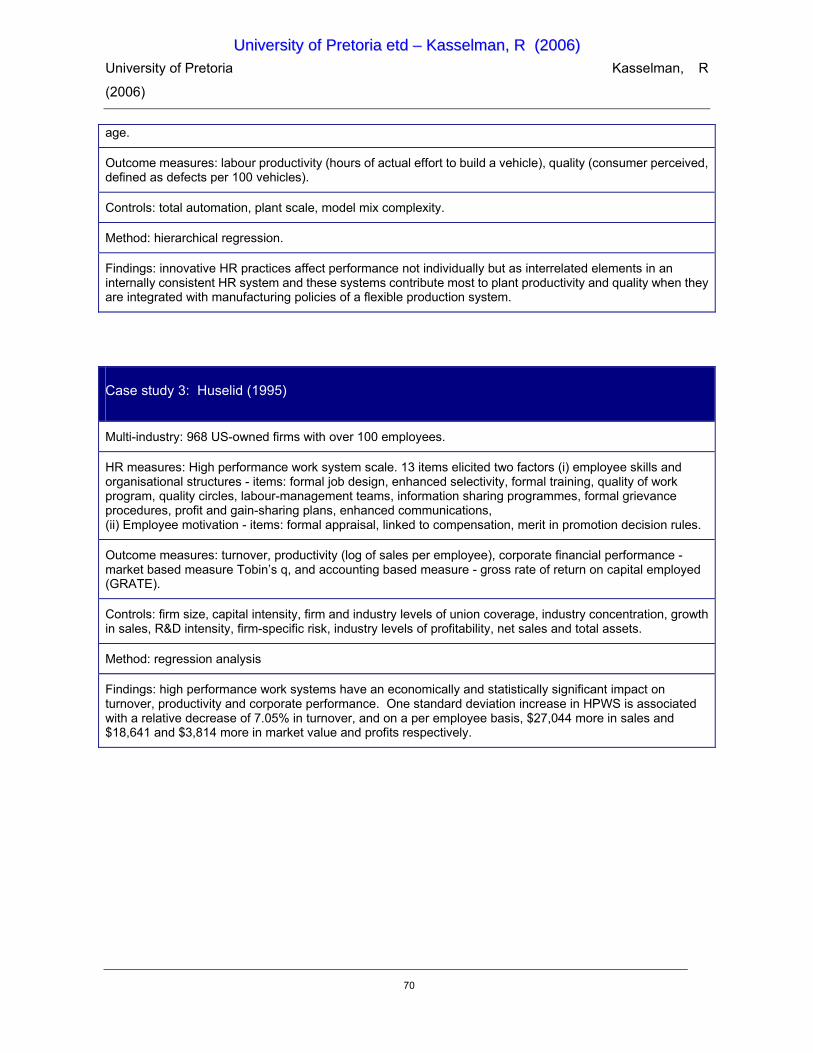
University of Pretoria Kasselman, R
(2006)
70
age.
Outcome measures: labour productivity (hours of actual effort to build a vehicle), quality (consumer perceived, defined as defects per 100 vehicles).
Controls: total automation, plant scale, model mix complexity.
Method: hierarchical regression.
Findings: innovative HR practices affect performance not individually but as interrelated elements in an internally consistent HR system and these systems contribute most to plant productivity and quality when they are integrated with manufacturing policies of a flexible production system.
Case study 3: Huselid (1995)
Multi-industry: 968 US-owned firms with over 100 employees.
HR measures: High performance work system scale. 13 items elicited two factors (i) employee skills and organisational structures - items: formal job design, enhanced selectivity, formal training, quality of work program, quality circles, labour-management teams, information sharing programmes, formal grievance procedures, profit and gain-sharing plans, enhanced communications, (ii) Employee motivation - items: formal appraisal, linked to compensation, merit in promotion decision rules.
Outcome measures: turnover, productivity (log of sales per employee), corporate financial performance - market based measure Tobin’s q, and accounting based measure - gross rate of return on capital employed (GRATE).
Controls: firm size, capital intensity, firm and industry levels of union coverage, industry concentration, growth in sales, R&D intensity, firm-specific risk, industry levels of profitability, net sales and total assets.
Method: regression analysis
Findings: high performance work systems have an economically and statistically significant impact on turnover, productivity and corporate performance. One standard deviation increase in HPWS is associated with a relative decrease of 7.05% in turnover, and on a per employee basis, $27,044 more in sales and $18,641 and $3,814 more in market value and profits respectively.
UUnniivveerrssiittyy ooff PPrreettoorriiaa eettdd –– KKaasssseellmmaann,, RR ((22000066))
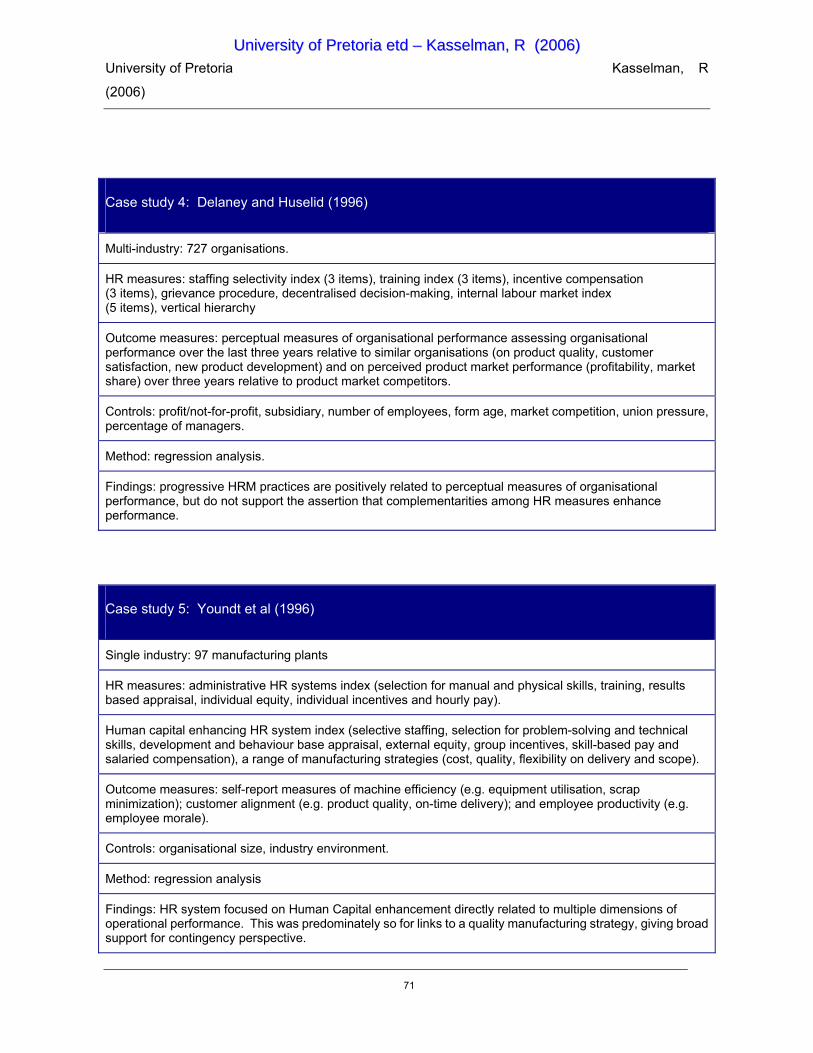
University of Pretoria Kasselman, R
(2006)
71
Case study 4: Delaney and Huselid (1996)
Multi-industry: 727 organisations.
HR measures: staffing selectivity index (3 items), training index (3 items), incentive compensation (3 items), grievance procedure, decentralised decision-making, internal labour market index (5 items), vertical hierarchy
Outcome measures: perceptual measures of organisational performance assessing organisational performance over the last three years relative to similar organisations (on product quality, customer satisfaction, new product development) and on perceived product market performance (profitability, market share) over three years relative to product market competitors.
Controls: profit/not-for-profit, subsidiary, number of employees, form age, market competition, union pressure, percentage of managers.
Method: regression analysis.
Findings: progressive HRM practices are positively related to perceptual measures of organisational performance, but do not support the assertion that complementarities among HR measures enhance performance.
Case study 5: Youndt et al (1996)
Single industry: 97 manufacturing plants
HR measures: administrative HR systems index (selection for manual and physical skills, training, results based appraisal, individual equity, individual incentives and hourly pay).
Human capital enhancing HR system index (selective staffing, selection for problem-solving and technical skills, development and behaviour base appraisal, external equity, group incentives, skill-based pay and salaried compensation), a range of manufacturing strategies (cost, quality, flexibility on delivery and scope).
Outcome measures: self-report measures of machine efficiency (e.g. equipment utilisation, scrap minimization); customer alignment (e.g. product quality, on-time delivery); and employee productivity (e.g. employee morale).
Controls: organisational size, industry environment.
Method: regression analysis
Findings: HR system focused on Human Capital enhancement directly related to multiple dimensions of operational performance. This was predominately so for links to a quality manufacturing strategy, giving broad support for contingency perspective.
UUnniivveerrssiittyy ooff PPrreettoorriiaa eettdd –– KKaasssseellmmaann,, RR ((22000066))
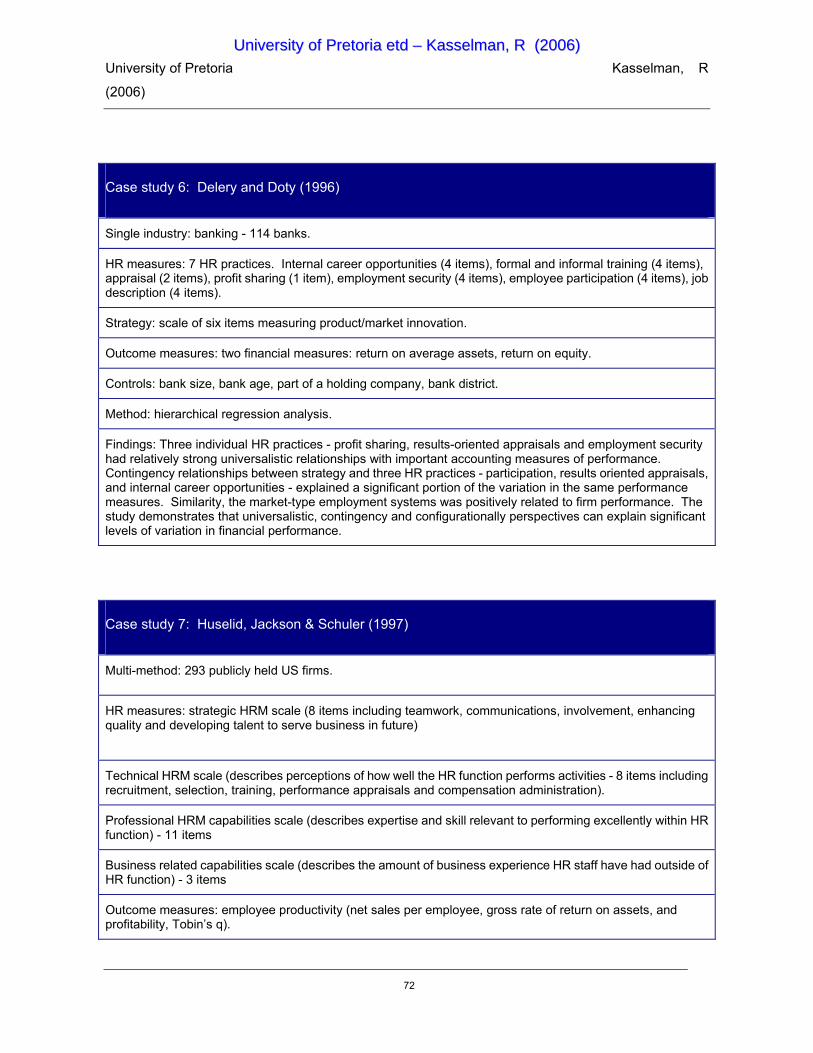
University of Pretoria Kasselman, R
(2006)
72
Case study 6: Delery and Doty (1996)
Single industry: banking - 114 banks.
HR measures: 7 HR practices. Internal career opportunities (4 items), formal and informal training (4 items), appraisal (2 items), profit sharing (1 item), employment security (4 items), employee participation (4 items), job description (4 items).
Strategy: scale of six items measuring product/market innovation.
Outcome measures: two financial measures: return on average assets, return on equity.
Controls: bank size, bank age, part of a holding company, bank district.
Method: hierarchical regression analysis.
Findings: Three individual HR practices - profit sharing, results-oriented appraisals and employment security had relatively strong universalistic relationships with important accounting measures of performance. Contingency relationships between strategy and three HR practices - participation, results oriented appraisals, and internal career opportunities - explained a significant portion of the variation in the same performance measures. Similarity, the market-type employment systems was positively related to firm performance. The study demonstrates that universalistic, contingency and configurationally perspectives can explain significant levels of variation in financial performance.
Case study 7: Huselid, Jackson & Schuler (1997)
Multi-method: 293 publicly held US firms.
HR measures: strategic HRM scale (8 items including teamwork, communications, involvement, enhancing quality and developing talent to serve business in future)
Technical HRM scale (describes perceptions of how well the HR function performs activities - 8 items including recruitment, selection, training, performance appraisals and compensation administration).
Professional HRM capabilities scale (describes expertise and skill relevant to performing excellently within HR function) - 11 items
Business related capabilities scale (describes the amount of business experience HR staff have had outside of HR function) - 3 items
Outcome measures: employee productivity (net sales per employee, gross rate of return on assets, and profitability, Tobin’s q).
UUnniivveerrssiittyy ooff PPrreettoorriiaa eettdd –– KKaasssseellmmaann,, RR ((22000066))

University of Pretoria Kasselman, R
(2006)
73
Controls: union coverage, firm size, capital intensity, industry concentration, sales growth, R&D expenditures, stock price variability (beta) and firm industry.
Method: regression analysis.
Findings: Significant relationship between strategic HRM and employee productivity, cash flow, and market value. No meaningful relationship between technical HRM and firm performance. On a per employee present value basis, a one standard deviation increase in overall HRM effectiveness corresponds to an estimated increase in sales per employee of 5.2%, a cash flow of 16.3%, and a market value of 6%.
Case study 8: Ichniowski ,Shaw, and Prennushi (1997)
Single industry: 36 finishing lines in 17 US owned companies matched with 2190 monthly observations of productivity data.
HR measures: identified 8 HR variables (incentive pay, recruitment and selection, employment security, flexible job assignment, communications and labour relations) and identified 4 distinctive combinations of HR practices.
System 1 (incorporates innovative practices in all areas). Lines with this system have incentive pay plans, profit sharing, extensive screening of new employees, recruitment, high participation, multiple teams, formal team practice, employment security, job rotation, high training, low training, information sharing, managers meet workers regularly, meet with union, unionised, low grievance.
System 2 (similar to three but also includes extensive skills training and high involvement in teams).
System 3 (similar to system 4 except introduced innovative practices through worker involvement in teams and enhanced labour management communication).
System 4 - traditional HRM (firms identified as having no innovative practices with close supervision, strict work rules, narrow job responsibilities, incentive based pay on quantity not on quality of output, no work teams, no information sharing and no formal training).
Outcome measures: productivity (production line uptime - percentage of scheduled operating time that the line actually runs); quality (percentage of total production that met the industry standards).
Controls: capital vintage (when line was built), learning curve effects, technical line specifications, periods of unusually high downtime, quality of steel input, maintenance activity effects.
Method: OLS regression.
Findings: innovative HRM practices raise worker productivity and systems of innovative HRM practices had large effects on production workers’ performance. While changes in individual employment practices have little or no effect.
UUnniivveerrssiittyy ooff PPrreettoorriiaa eettdd –– KKaasssseellmmaann,, RR ((22000066))

University of Pretoria Kasselman, R
(2006)
74
Case study 9: Patterson et al (1997)
Single industry: 67 single site single product manufacturing firms with less than 1000 employees.
HR measures: acquisition and development of employee skills (selection, induction, training and use of appraisals); job design (skill flexibility, job responsibility, job variety and use of formal teams); quality improvement teams, communication, harmonisation, comparative pay, incentive compensation systems.
Outcome measures: labour productivity, real profits per employee (profits before tax, deflated by the producer price index of the industry and controlling for size of firm).
Method: qualitative and quantitative data collection, multi-level.
Findings: HRM practices account for 19% of variation between companies in change for profitability and 18% of variation between companies for change of productivity. The acquisition and development of skills and job design are significant determinants of change in both productivity and profitability.
Case study 10: Guest et al. (2000)
Multi-industry: 610 firms above 50 employees
HR measures: use and coverage of HR practice (48 items in the following sections): recruitment and selection, training and development, appraisal, financial flexibility, concern with quality, job design, communication and consultation, employment security and single-status and harmonisation.
Outcome measures: HR outcomes 8 items, including employee commitment, flexibility, and behaviour.
Human capital and performance 38, Human capital and performance 39.
Performance outcomes: labour turnover, absenteeism, perception of the firm’s financial results, labour productivity, quality of products/services and effectiveness of HR practices compared with other organisations in the same industry.
Controls: composition (part-time, short-term employment), representation at the workplace (trade union recognition, single union/partnership deals, presence of a staff association) and redundancies.
Method: matched sample of HR managers and CEOs. Regression.
Findings: effective use of progressive HR practices is linked to superior performance, and also linked to perceptions of positive employee attitudes and behaviour.
Case study 11: Guest et al. (2003)
UUnniivveerrssiittyy ooff PPrreettoorriiaa eettdd –– KKaasssseellmmaann,, RR ((22000066))

University of Pretoria Kasselman, R
(2006)
75
Multi-industry: 366 firms with over 50 employees
HR measures: 48 items on HRM covering nine main areas: recruitment and selection, training and development, appraisal, financial flexibility, job design, two-way communication, employment security and the internal labour market, single-status and harmonisation, and quality.
Outcome measures: labour turnover, absence and industrial conflict. Labour productivity (value of sales per employee) and financial performance (company’s profit per employee).
Controls: sector, trade union membership, part of multinational, presence of consultative committee, staff committee, and single union deal, respondent holds HR position, perceived importance of overall HR policy in terms of controlling for labour costs.
Method: telephone interview using structured questionnaire, regression.
Findings: using objective measures of performance, greater use of HR practices was associated with lower labour turnover and higher profit per employee, but showed no association with HR and productivity. There was a strong association between subjective estimates of HR and productivity and financial performance. The study supports the association between HRM and performance but does not show that HRM causes high performance.
From these cases, it is clear that HR measures have a direct influence on the performance and
productivity of companies. This is again linked to the bottom line of the organisations as it effects
production, client interactions and team effectiveness. Measures such as the increase in sales per
employee have a positive effect on cash flow, which in turn has a positive effect on profits and thus
market value. Although a number of similarities exist, it is the opinion of the researcher that there are
a number of South African specific issues to be taken into consideration and a global framework may
have to include a country specific section (identified as a limit to the current study).
2.13 Arguments against Accounting for Human Capital
Although many authors have evaluated the theory of valuing Human Assets by putting it on the
balance sheet, there are those who argue against such a concept.
Kearns (2003:94) states that “surely Human Capital is already on the balance sheet even though it is
not explicitly listed and the problem of measuring Human Capital is not actually an accounting or
actuarial problem”. Kearns (2003) supports his assessment by referencing the Enron scandal
whereby the accounting conventions followed was subverted in order to create a false impression.
Philips (2005:95), states “Several disadvantages are inherent in macro level (Human Capital)
analyses. First, a study is often very complex, difficult to conduct, and often requires skills that are
UUnniivveerrssiittyy ooff PPrreettoorriiaa eettdd –– KKaasssseellmmaann,, RR ((22000066))

University of Pretoria Kasselman, R
(2006)
76
beyond the capability of many Human Capital managers. Attempting to replicate a study at the
organisational level may be impossible for most Human Capital functions.”
Another question HR practitioners battle to answer which affects the approach for accounting for HR
is; Do effective HR practices drive (cause) positive financial results or do positive financial results
lead to better HR practices (i.e., successful business can afford higher quality HR programs)?.
Watson Watt (1999) showed in their study that the relationship moves both ways, creating a “virtuous
cycle.”
Kearns (2003) is the biggest critique of both intangible and accounting principles applied to Human
Capital. He has very compelling arguments against the book value view of Human Capital; based on
the fact that share price determines market capitalisation or market value. His reasoning is based on
the fact that share prices can swing in either direction which will in effect mean that should the share
price be at its lowest, by implication the Human Capital of such an organisation would also be at its
lowest. “Share prices, which can be subject to wide fluctuations on a daily basis, can hardly be said
to truly reflect the value of human beings” (Kearns, 2003:92). In defence of his argument, one may
ask what the value is of properties and buildings as assets on the balance sheet of such an
organisation at that particular moment in time. The value certainly does not fluctuate with the share
price, as the value of the Human Assets should not fluctuate. This concern is shared by Lester
(2002) who concurs that the IC ratio is susceptible to market fluctuation.
Rutledge (1997:3) wrote, “Monkeying with financial statements, for almost any reason, is a terrible
idea. Investors have 500 years of practice interpreting financial statements while learning to
understand, project, get comfortable with, and value our more than $60 trillion in total assets. In
doing so, they have developed methods to adjust for many of the anomalies (for example,
amortisation of goodwill, which can only be defined by describing what it is not) that emerge from our
archaic double-entry bookkeeping practices from time to time. Scrambling the financial data we use
to make such judgments would render these methods less useful. It also would throw up a cloud of
uncertainty large enough to make owning assets more risky, and therefore less valuable. Giving
people more information is fine. They can make their own judgments. Tinkering with the balance
sheet is not a good idea. Although Intellectual Capital is important (who would doubt that people who
know how to do things are more successful than people who don’t?), it should be left off the balance
sheet. Balance sheets are for stuff, the stuff that George Carlin talks about, not people or ideas.
People aren’t assets because you can’t own them, at least not in this country (I’m neglecting alimony
UUnniivveerrssiittyy ooff PPrreettoorriiaa eettdd –– KKaasssseellmmaann,, RR ((22000066))
University of Pretoria Kasselman, R
(2006)
77
here); you can only rent them. Ideas are not assets because, partly due to the fact that the people
who generate them can’t be owned, you can’t keep them bottled up for very long (except for the
secret formula for Coke, that is). If you want to measure the value of people and their ideas, you
need to look at cash flows, not assets.”
In the case of this study, the researcher did not edit any of the above statements, but placed the
proposition of this study in a broader framework. This study does not only look at accounting for
Human Capital in terms which business will understand and relate to, but also considers the
extraction of value, focused on increasing shareholder value, through Human Resources
Management.
2.14 Conclusion
The literature studied in this chapter provided a solid foundation for the study and objectives stated at
the beginning of the chapter was met, providing substantial information to facilitate the development
of a draft framework to facilitate the research process.
The literature shows that there are many dimensions to be taken into account for evaluating and
calculating the value of Human Capital in an organisational context. Although the idea that Human
Capital should be recognised as a line item in financial statements has been considered by a number
of authors, researchers and even valuers, many of the proposed methods and calculations have lost
acceptance. This may well be because most of these methods use different logic and calculation
methods. For this study, the researcher endeavours to identify those components that are common
or appear in multiple methods, testing this against the South African environment and the HR
industry in general, and uses the generally accepted financial principles to measure this against the
view to increase the knowledge base with an increased understanding of what influences (increases
or detracts from) the value of Human Assets for an organisation.
The key consideration seemingly not taken into account is that valuing Human Assets will be
required to overcome a number of hurdles to be accepted as an Asset in International Accounting
Standards. An asset needs to meet the following criteria (Flamhotlz, 1999):
• Possess a potential for future benefits.
UUnniivveerrssiittyy ooff PPrreettoorriiaa eettdd –– KKaasssseellmmaann,, RR ((22000066))

University of Pretoria Kasselman, R
(2006)
78
• Benefits must be measured in monetary terms.
• Future benefits which might include a contribution to future net cash flows, or cost savings, must
be owned or controlled by the firm.
From the literature review, it is clear that all these methodologies depend upon the use of metrics
(quantitative measures). However, whilst some of these (such as EVA approaches) focus on factors
that are capable of being valued in monetary terms, others (such as the Skandia Navigator, the
Balanced Scorecard and the EFQM Excellence Model) concentrate more on non-monetary
methods. Whereas some (such as EVA and the IC index) adopt a holistic approach, concentrating
on one or a few high level metrics such as wealth generated per full time equivalent employee and
human investment ratios, others (such as the Balanced Scorecard and the Skandia Navigator) adopt
an atomistic approach, with numerous measures of different aspects of skills and learning, employee
engagement and behaviours etc.
The contribution of Human Capital to technological progress, i.e. to the development and adoption of
new technologies and to the continued improvement of existing production processes, innovation
and ultimately company growth is mostly measured in intangible terms and even some of these may
not be in line with the new economy for knowledge workers. That is measured is almost certain to
improve. If there is uncertainty as to what to measure should all, or nothing, be measured? What is
the impact on the organisation - the investment by stakeholders in the organisation?
Consideration will need to be given to the fact that the literature shows it is difficult to quantify most
intangible assets in a monetary way, and whatever measures are reported on will compete with the
financial measures’ credibility and appearance of accuracy. People are mobile, subjective,
changeable, and variable and as far from an accountant’s concept of an asset as can be imagined.
Reporting on Human Assets clearly will possess a challenge for the current accounting standards.
The International Accounting Standard (IASC 38), which deals with the valuation of intangible
assets, excludes the whole area of Human Capital (and others, such as brands) as not conforming to
the definition of an asset (Mayo, 2001).
However, as stated by Zimmerman (2001:3), “Under growing pressures to innovate and to respond
to turbulent competitive environments, there is a widespread recognition across all industrial sectors
UUnniivveerrssiittyy ooff PPrreettoorriiaa eettdd –– KKaasssseellmmaann,, RR ((22000066))
University of Pretoria Kasselman, R
(2006)
79
that the know-how, imagination and creativity of employees is becoming at least as critical to
business success as ‘hard’ assets”.
Another consideration is that the increasing or measuring the value of Human Assets is the function
of Human Resources. Using HR practices that facilitate achieve and enhance Human Capital
effectiveness requires investing in HR activities. However, HRM practices need to be applied
effectively in order to increase the performance as indicated by productivity, turnover and financial
indicators. A study by the Fortune Magazine (1997) on the world’s most admired companies, clearly
showed that highly admired and successful companies take their HR responsibilities more seriously
than their competitors. The companies included Bayer, Bertlesmann, Citibank, Daimler-Benz, Dai
Nippon, Disney, General Electric, Gillette, Federal Express, Intel, L’Oreal, Nestle, Nucor, Procter &
Gamble, Roche Holdings, SBC Communications, Smith Kline Beecham, and Sony. It is thus safe to
assume that HR programmes such as attraction and recruitment, retention, training and
development, motivation, rewards and recognition, aligning business and HR strategies, etc. can be
considered as the key to unleashing the value of Human Assets for the organisation. Showing the
correlation between these programmes and the bottom line remains the challenge for HR
practitioners.
Chapter 3 introduces the research methodology followed in the study based on the theoretical
construct set out in this chapter to derive at the Framework for Human Capital Reporting.
UUnniivveerrssiittyy ooff PPrreettoorriiaa eettdd –– KKaasssseellmmaann,, RR ((22000066))

University of Pretoria Kasselman, R
(2006)
80
CHAPTER 3 - RESEARCH METHODOLOGY
A journey of a thousand miles must start with a single step
- Chinese proverb
3.1 Introduction
The intent of this chapter on the research methodology followed in the research, serves to highlight
the fact that, underlying all research, the scientific foundation must be above question. This chapter
will describe the scientific methodology and approach utilised during this study.
Thorough research generates scientifically dependable data, which enables the researcher to
practice professional conduct in the process of responsible decision-making (Cooper and Schindler,
2001). According to Kerlinger (1986), scientific research should include the following:
• A scientifically researched and proven integrating theory. Public and open resources (preferably
primary resources).
• Precise definitions.
• A systematic and cumulative approach.
• Replicable findings.
• Objective and scientific replicable data collection and sampling.
• A clear statement of the research problem.
• A clear understanding and explanation of the phenomenon, contextualised in its broader domain.
UUnniivveerrssiittyy ooff PPrreettoorriiaa eettdd –– KKaasssseellmmaann,, RR ((22000066))

University of Pretoria Kasselman, R
(2006)
81
This study adheres to the scientific approach through the application of both quantitative and
qualitative methodologies, and utilises both inductive and deductive reasoning. The study includes a
combination of theoretical and interpretive findings, and due to the complexity of the subject as well
as the high quantity of qualitative data, the study was performed through the combination of
methodologies and reasoning methods, a technique referred to as triangulation. Triangulation refers
to the use of several research frameworks of reference analysing the same set of data to ensure
scientific validation with the aim to overcome intrinsic bias arising from single methodology research
(Leedy, 1993).
This research project was divided into the following phases:
1. Research design
2. Planning
3. Data collection and analyses
4. Evaluation and approval
as illustrated in Figure 17) which serves as a visualisation of the research process in the context of
this research.
UUnniivveerrssiittyy ooff PPrreettoorriiaa eettdd –– KKaasssseellmmaann,, RR ((22000066))

University of Pretoria Kasselman, R
(2006)
82
Figure 16: Research Process (author’s own)
3.2 Theory
The study estimates (with the objective to optimise and improve) the value add of Human Capital to
the bottom-line of organisations; i.e. value the Human Assets of an organisation; following a scientific
approach by developing a framework for accounting Human Capital.
A company’s ability to support its business strategies with Human Capital is an important indication
of the company’s future business performance. Traditional HR metrics fails to report on the level of
performance, knowledgebase or value of their Human Capital, making it virtually impossible for
stakeholders or valuators of companies to take this most important asset - Human Resources - into
account in valuing the company against its competitors.
Consequently, resulting from the application of the value-add concept of Human Capital, an
evolutionary HR Value-add Framework, open to validation and replication, is developed to enable
companies to report on their Human Assets to shareholders and other stakeholders, to apply when
UUnniivveerrssiittyy ooff PPrreettoorriiaa eettdd –– KKaasssseellmmaann,, RR ((22000066))

University of Pretoria Kasselman, R
(2006)
83
calculating the value of the company. This framework thus needs, amongst others (to be discussed
later in this study) to include information that allows a holistic and informed assessment of the
company’s operations, finances, future strategies and prospects.
The study furthermore investigates the Human Resource Management (HRM) theories and defined
activities which can have an effect on the company’s Income and Expenditure Statement and/or
Balance Sheet, to evaluate whether this has any correlation with the value of the Human Assets.
3.3 Detail of the chosen procedure
The research design is exploratory, aimed at developing a new model. As defined by Mouton
(2001), good theories and models provide causal accounts of the world, allow one to make predictive
claims under certain conditions, bring conceptual coherence to a domain of science, and simplify our
understanding of the world. Please refer to Figure 18 which serves as a schematic of the research
methods applied during this study.
Empirical Non-Empirical
Existing data
New Data
Surveys
Case Studies
Delphi-workshops
LiteratureReview
Figure 17: Research Methods (author’s own)
The following research instruments were utilised to obtain data for the research:
• Literature review that provides an overview of the field of study to assist the researcher to identify
and build the link between finance and HR.
UUnniivveerrssiittyy ooff PPrreettoorriiaa eettdd –– KKaasssseellmmaann,, RR ((22000066))

University of Pretoria Kasselman, R
(2006)
84
• Case studies which provides the researcher with an in-depth description of current practices
globally in HR accounting from various companies and studies in Industry as input into the
planning and design of the semi-structured interview questions.
• Development of questionnaires to be used as a survey of the target groups.
• Survey methodology, used with the objective of obtaining a broad overview of the current status
as well as (perceived) limitations to the proposed model from a large population.
• Semi-structured interviews; used to allow executives and HR practitioners to respond
spontaneously to open questions, allowing different dimensions and viewpoints as well as the
considerations specific to the company.
• Delphi-technique used after the initial failing of the surveys to obtain enough responses (data) to
enable the researcher to make the required inductive reasoning. Evaluating current practices
and leveraging the experience of HR experts (HR practitioners, students and consultants in
Deloitte), allowed the researcher to evaluate and refine the framework.
Triangulation is defined as a process by which the researcher guards against the accusation that a
study’s findings are simply an artefact of a single method, a single source or a single investigator’s
biases (Patton, 1987), and thus was used to verify and validate the research in order to conquer
intrinsic bias.
The research process consisted of the following activities:
1. Literature review of Human Capital and Corporate Reporting to ensure that a thorough knowledge
and understanding is developed (descriptive and qualitative).
2. Evaluation of International Case studies as obtained through literature reviews.
3. Development of a draft framework.
UUnniivveerrssiittyy ooff PPrreettoorriiaa eettdd –– KKaasssseellmmaann,, RR ((22000066))

University of Pretoria Kasselman, R
(2006)
85
4. Development of a survey based on the draft framework (to use for verification), piloted for input
from students in Organisational Behaviour.
5. Survey developed in Step 4 reviewed and adjusted according to pilot feedback.
6. Development of a survey for HR Practitioners.
7. Verification of the current practice and required Human Capital reporting requirements by industry
by means of the qualitative survey, followed by semi-structured interviews of Human Capital
practitioners.
8. Development of a Survey for Auditors based on information gathered in Step 1, 4, 6 and 7.
9. Survey of auditors to evaluate the relevance of the proposed categories of reporting for internal
and external reporting as well as their ability to audit such information.
10. Refinement of the framework based on responses and further, in-dept literature reviews, steps
7 and 9.
11. Evaluation of the application and validity of the metrics identified with HR Consultants and
students using the Delphi-technique and a questionnaire based on Step 10.
12. Testing of and final adjustments and refinement of the framework with input from Human
Capital specialists.
13. Development of the final HC Framework and Index.
The steps followed in the research are illustrated below:
UUnniivveerrssiittyy ooff PPrreettoorriiaa eettdd –– KKaasssseellmmaann,, RR ((22000066))
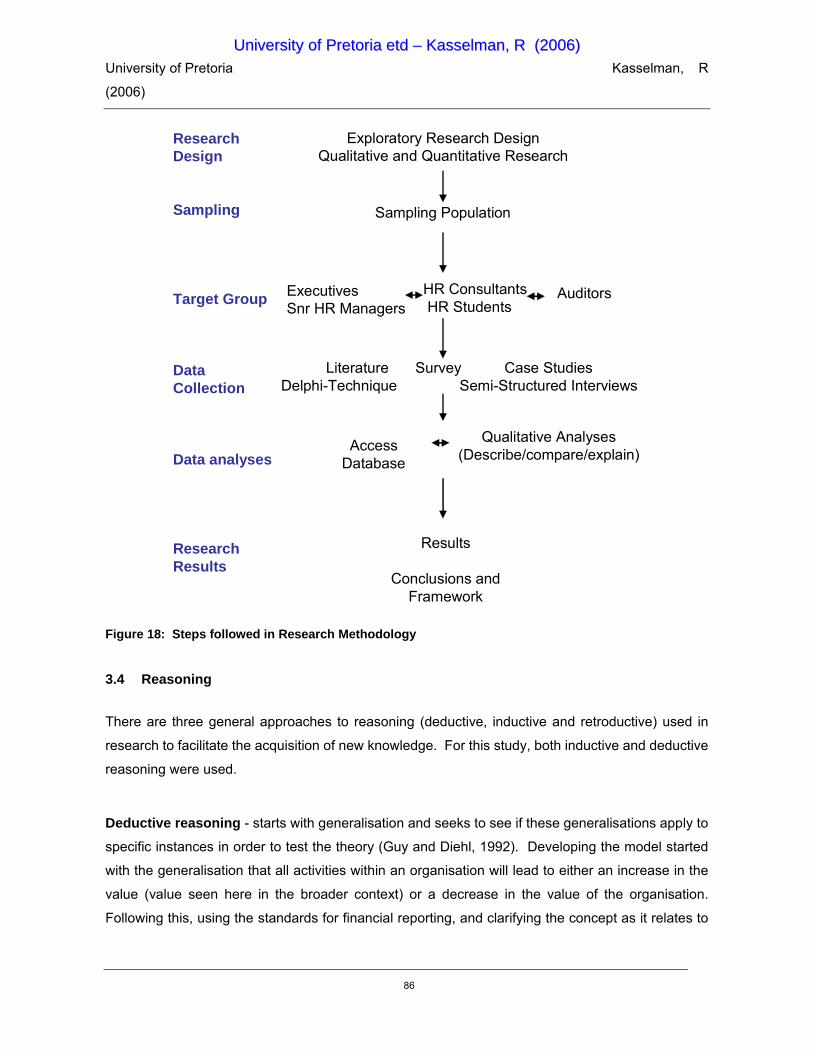
University of Pretoria Kasselman, R
(2006)
86
Research Design
Sampling
Target Group
Data Collection
Data analyses
Research Results
Exploratory Research DesignQualitative and Quantitative Research
Sampling Population
Results
Conclusions andFramework
AccessDatabase
Executives Snr HR Managers
Literature Survey Case StudiesDelphi-Technique Semi-Structured Interviews
Qualitative Analyses(Describe/compare/explain)
HR ConsultantsHR Students
Auditors
Figure 18: Steps followed in Research Methodology
3.4 Reasoning
There are three general approaches to reasoning (deductive, inductive and retroductive) used in
research to facilitate the acquisition of new knowledge. For this study, both inductive and deductive
reasoning were used.
Deductive reasoning - starts with generalisation and seeks to see if these generalisations apply to
specific instances in order to test the theory (Guy and Diehl, 1992). Developing the model started
with the generalisation that all activities within an organisation will lead to either an increase in the
value (value seen here in the broader context) or a decrease in the value of the organisation.
Following this, using the standards for financial reporting, and clarifying the concept as it relates to
UUnniivveerrssiittyy ooff PPrreettoorriiaa eettdd –– KKaasssseellmmaann,, RR ((22000066))

University of Pretoria Kasselman, R
(2006)
87
the Human Resources function and activities, a framework was developed to be tested against
existing theories and insight from experts in this field.
Inductive reasoning: - commences with the observation of specific instances and seeks to
establish generalisations or theories. This reasoning method is especially prevalent in this study in
the analyses of the case studies as well as the population used during the Delphi-workshops.
3.5 Participants and Sampling
Participants and sampling for the study required an understanding of the primary objective; i.e. to
determine the current status and application of HR metrics, reporting and insight into HR accounting
methodologies in South Africa, where such techniques or tools/models have been deployed.
In qualitative research, non-probability sampling techniques are used as the researcher’s intended
purpose is to research individuals, groups or settings where the specific phenomenon being studied
is most likely to occur. De Vos, Strydom, Fouche & Delport (2002) expressed an opinion that data
are derived from one or two cases and therefore it is unlikely that these cases are randomly selected.
Judgement sampling (sample elements have a relationship on common ground; i.e. the Human
Resources function) and snowball sampling (researcher gathers information from respondents that
enables the location of other respondents that has the same common ground) was used during this
study. The snowball sampling produced four additional sample elements for the executive and
senior HR managers’ group that were not identified through the initial survey, and this additional
information from participants has been included in the data analyses (Leedy, 1993).
The empirical section of this study has three parts, and three target groups were identified and used
during this study. In the following paragraphs the different methods used for data collection as well
as the participants from each of the groups is described.
3.6 Target Groups
The target groups identified for this study consists of three separate groupings plus one specialist
group:
UUnniivveerrssiittyy ooff PPrreettoorriiaa eettdd –– KKaasssseellmmaann,, RR ((22000066))

University of Pretoria Kasselman, R
(2006)
88
3.6.1 Executives and Senior HR Managers
Senior HR managers and executives who have a reporting line function in HR were identified and
their knowledge of the topic tested through the initial survey. These senior managers and executives
have a direct responsibility for either HR or profitability from a line function perspective. As senior
people within the organisation, their level of understanding of the organisation’s key drivers and
strategies, as well as their knowledge of the company’s internal and external reporting, allowed them
the insight into both the current status as well as the potential for the framework. The researcher
selected this group specifically due to their involvement in the strategic focus of the organisation.
The nine sample elements that constitute the sample are presented in Figure 20 which graphically
illustrates the element groupings for executives and senior HR managers.
Executives and Snr HR Managers Respondents by Industry
2, 22%
2, 22%3, 34%
1, 11%1, 11%
Consulting Energy Mining and Resources
consumer business Other
Figure 19: Executives and Senior Managers Respondents by Industry
Figure 20 indicates that 34% of sample elements are from Mining and Resources organisations,
22% from Consulting and Energy, 1% from Consumer Business and 1% from Other (not specified).
A benefit of the above sampling methodology is that the respondents have indicated their knowledge
and insight on the topic from their organisational specific viewpoint.
UUnniivveerrssiittyy ooff PPrreettoorriiaa eettdd –– KKaasssseellmmaann,, RR ((22000066))

University of Pretoria Kasselman, R
(2006)
89
3.6.2 HR Consultants and Students
Consultants and students of Human Resources were identified from a database of employees in
Deloitte as well as partner or sub-contracting companies. The pool of 119 HR consultants and
students who were non-randomly chosen includes students who attended post-graduate studies
which included Human Resource Management and/or Finance and consultants who specialise in
Human Capital advisory services.
3.6.3 Auditors
Auditors were identified from a list of Deloitte & Touche employees, by selecting two audit teams.
The snowball technique was used to solicit more respondents and this increased the number of
elements by three not originally identified by the researcher. These auditors are qualified CAs
(Chartered Accountants) and have at least 2 years’ auditing experience. Figure 21 indicates that
57% of sample elements are between 30 – 45 years of age, and 43% between 20 – 30 years. None
of the respondents are older than 45.
Auditors - No of years in position
2 - 4 years57%
5 - 8 years29%
9 - 12 years14%
more than 12 years0%
Figure 20: Auditors - Group Age Distribution
Whilst most of the respondents have between two and four years’ experience as auditors, 14% have
between 9 -12 years and 29% have between 5 – 8 years (refer Figure 23).
UUnniivveerrssiittyy ooff PPrreettoorriiaa eettdd –– KKaasssseellmmaann,, RR ((22000066))

University of Pretoria Kasselman, R
(2006)
90
Auditors - No of years in position
1 - 4 years57%
5 - 8 years29%
9 - 12 years14%
more than 12 years0%
Figure 21: Auditors – Number of years in position
3.6.4 Human Capital Specialists
Human Capital specialists were identified using judgement sampling (purposely stratified / selected)
from the group of respondents’ HR specialists and students. This specialist group of five (40% male
and 60% female) was asked to evaluate and comment on the final model. This group comprises
specialist advisors in Deloitte Human Capital with six years or more experience in Human Resource
Management and/or Human Capital and/or HR Strategy advisory services (refer to Figure 21 for a
graphical illustration of their experience and educational qualifications).
UUnniivveerrssiittyy ooff PPrreettoorriiaa eettdd –– KKaasssseellmmaann,, RR ((22000066))

University of Pretoria Kasselman, R
(2006)
91
Honours, 1
Masters, 4
PhD, 01 - 3yrs
0%4 - 6 yrs
20%
7 - 10 yrs20%10 - 15yrs
40%
15yrs +20%
Figure 22: Specialists Education and Experience
3.7 Data Collection
Primary data sources such as journal and magazine articles, newspaper and media reports, and
information available on the Internet was collected and integrated with the data obtained via the case
studies, surveys, focus groups and interviews to add further information, trends and industry
knowledge. This data is integrated in the conclusion of the study and used to confirm or contradict
the researcher’s proposed model.
3.7.1 Case Studies
The case studies obtained through the documentary sources are qualitative in nature, based on a
number of different studies globally (refer Chapter 2). These cases were analysed to provide the
researcher with insight into the current practices globally and provides for the ability to compare
these with current practice in South Africa as well as providing the researcher with input to increase
the relevance of the metric list and survey questionnaire.
3.7.2 Semi-structured Interviews with Executives and Senior HR Managers
The Executives and senior HR manager target group were surveyed with the intention of gathering
knowledge and an understanding of the current situation, as well as to ascertain and develop
additional ideas not necessarily found in the literature research, which may relate to the topic under
UUnniivveerrssiittyy ooff PPrreettoorriiaa eettdd –– KKaasssseellmmaann,, RR ((22000066))

University of Pretoria Kasselman, R
(2006)
92
study in order to strengthen the implicit hypotheses generated by the research as it progressed.
They were probed on their own perceptions of the value of the HR function, the value of Human
Capital employed by the organisation, and most importantly, the methods they use to report on such
matters.
A survey was first developed and distributed to this target group with the objective of:
1. Ascertaining the current status of HR reporting and level of understanding in the organisation.
2. Ascertaining the level of insight from the interviewee with regards to the topic.
3. Requesting names of organisations and/or other executives or senior HR management within the
organisation that may be able to provide content to the research; i.e. using a “snowballing”
technique.
Where applicable, the Likert-type rating scale, with a 1 - 5 agreement format was chosen for this
survey. The scale was also described to ensure a higher level of consistency in evaluation. This
survey was administered electronically to facilitate self-administration, whilst obtaining detailed
information, which posed some challenges in it. Very few unspoiled returns were received (12 out of
19); however due to the exploratory nature of this questionnaire, this was acceptable to the
researcher. Of the total returns received, 8 companies were selected to participate in this study,
based on the answers and level of insight displayed in the returns.
3.7.3 Interviews
The interviews with respondents were aimed at gathering an understanding of the current “as-is”
situation in the application of HR metrics and reporting.
The target group for interviews included senior managers and executives at the strategic and tactical
level of the organisation. These manager and executives currently perform HR duties or have an HR
function reporting to them. The interviews were conducted according to the semi-structured
interview guide and schedule. According to Thietart (2001), the benefit of non-structured interviews
is the possibility that respondents can identify elements related to the research that structured
UUnniivveerrssiittyy ooff PPrreettoorriiaa eettdd –– KKaasssseellmmaann,, RR ((22000066))
University of Pretoria Kasselman, R
(2006)
93
interviews may miss. This point strengthens the methodology followed in this research. The
objective of the interviews was to i) identify the current practices in South Africa, and ii), to
understand the aspects which are considered as importance or of strategic nature to the
organisation.
The interview guide used provided the researcher with prompts to probe to determine:
• Methods followed in HR reporting at the organisation of the respondent.
• Key indicators to measure Human Capital and the extent to which these measures are associated
with other reporting or measuring within the organisation; specifically those relating to the
company’s profitability and/or competitiveness.
• The respondents’ opinions regarding the importance of linking the HR and business strategy and
how this should be demonstrated / reported.
The final section of the interview was to determine and prioritise the elements identified through the
data collection and literature reviews that are required to ensure important HR information is
included in reporting for companies as well as what the challenges or difficulties experienced in such
reporting may be for their company.
3.7.4 Surveys (Questionnaires)
While qualitative data collection techniques aid in identifying relevant constructs and concepts to be
examined, survey research provides a means of quantifying these concepts and examining relevant
relationships in-depth. In this context an important consideration is the instrument design. Since the
instrument used in this survey research is a self-administered questionnaire, the design and
questionnaire formulation was designed to facilitate respondent comprehension and response
accuracy.
The target group for the auditors’ survey included qualified auditors employed by Deloitte and
Touche. This group was surveyed to determine the relevance of the dimensions and descriptive
elements of a model for Human Capital Reporting as well as to identify any additional elements that
UUnniivveerrssiittyy ooff PPrreettoorriiaa eettdd –– KKaasssseellmmaann,, RR ((22000066))
University of Pretoria Kasselman, R
(2006)
94
are perceived to be relevant from an external auditors’ perspective. The objective of the
questionnaire was to identify which elements of the Human Capital information (data) is essential
and should be shared i) only internally, and ii) internally and externally. This group was also asked
what other information (if any) they considered important to share with external stakeholders.
3.7.4.1 Survey methodology
The survey was administered electronically. This survey method of collecting data lends itself to a
high level of standardisation and therefore high reliability (Singleton et al., 1988). It is relatively
inexpensive, not too time consuming and matches the sampling proposed.
The electronic administration of the questionnaire has the added benefit that it can be completed and
data stored in near real time and respondents can easily be reached through an electronic medium,
irrespective of their geographic location. This however, had received limited response and the
researcher had to use the semi-structured interview process to increase the number of respondents.
3.7.5 Delphi Technique
The Delphi technique has been found to be an appropriate mechanism for ensuring that emergent
differences between and within key stakeholder groups (that can arise from differences in focus,
situation and context) can be accounted for in a systematic way.
The Delphi method, as a research methodology, has been presented widely as a survey, procedure
method and technique. The aim of employing the Delphi technique is to achieve consensus through
a process of iteration (Hanafin, 2004). A key advantage of the Delphi technique is the potential it
holds to recognise and acknowledge the contribution of each participant. The key advantage of this
technique however, relates to the use of questionnaires that have the capacity to capture a wide
range of inter-related variables and multi-dimensional features (Gupta and Clarke, 1996).
For purposes of this study, the definition set out by Linstone and Turoff (quoted by Hanafin, 2004) “a
method for structuring a group communication process so that the process is effective in allowing a
group of individuals, as a whole, to deal with a complex problem”, is used.
The target group for the Delphi facilitated session using quantitative questionnaire and focus groups
included HR Consultants from Management Consulting Groups and/or specialists HR consultants to
UUnniivveerrssiittyy ooff PPrreettoorriiaa eettdd –– KKaasssseellmmaann,, RR ((22000066))

University of Pretoria Kasselman, R
(2006)
95
include academic, strategic and operational thinking. The questionnaires were given to students of
Organisational Behaviour as a pilot for electronic completion. Very few responses were received
from the latter group - which can be construed as either due to a lack of understanding or ability to
complete the questionnaires electronically. Due to this, a change in the methodology from the
original intended electronic surveying was made and the Delphi facilitated sessions were used.
Three workshops were held using the Delphi technique, described as drawing on “group intelligence”
and relying on the fact that although no one person may be able to provide reliable estimates
confidently (Kendrick, 2004), the information gathered from these workshops were collated to
enable the evaluation of the proposed framework. An observation from the researcher is that even
though all participants agreed that there is a requirement for such a model, the lack of insight into the
financial aspects of the business may have hindered the effectiveness of the detailed input. This
was somewhat countered by the explanations and discussions during the sessions; however, the
researcher balanced this with the literature research conducted.
Using focus groups, respondents were asked to complete a questionnaire at their leisure after a
discussion of the topic and the context for the study. This reduces time pressures and allowed for
more reflection and consideration of the responses. This method increased the number and quality
of contributions and decreased the respondents’ burden by allowing participation during the time
session. Participants evaluated the dimensions of the proposed framework as well as the metrics
which was obtained from the literature review and semi-structured interviews. The latter was
evaluated on nine dimensions (refer to Appendix D, Metric Questionnaire)
Snyder-Halpern (2002:185) summarises the primary advantages of the Delphi technique as “its
adaptability to diverse data collection strategies, decreased peer pressure secondary to anonymity
and the ease of condensing opinions of many and varied experts into a few precise statements”.
Although many authors have questioned the reliability, validity and credibility of this research
methodology, it needs to be noted that anonymity may lead to a lack of accountability. It is the
opinion of the researcher that since the evaluation of the model has no personal gain or potential
effect on the respondents, this is not a concern for this study.
The Delphi technique was also used to validate the final model with the judgement sample of
specialists.
UUnniivveerrssiittyy ooff PPrreettoorriiaa eettdd –– KKaasssseellmmaann,, RR ((22000066))
University of Pretoria Kasselman, R
(2006)
96
3.8 Data Analyses
The data analyses commenced with the case studies and semi-structured interviews. In the words
of Rubin and Rubin (1995: 226-227), “data analysis begins while the interviews are still underway.
The preliminary analyses tell you how to redesign your questions to focus on the central themes as
you continue interviewing”. During the formal analyses, themes and concepts were identified and
categorised into the framework to build the one theme: Shareholder Value.
The first step in the data analysis involved the categorising of the data. This involved the breaking
down of the non-structured interview contents into units of analysis and performing content analysis
on this data to interpret the words and statements recorded into themes. These categories were
correlated with the categories of the surveys and workshops. The accuracy, stability and replicability
of the data was tested by evaluating the data multiple times, using the database capability of
Microsoft Access.
The data gathered from the HR consultants and students during the Delphi workshops were based
on the theoretical model of the dimensions of the framework. 119 respondents completed this
questionnaire. The categories and themes discovered during analyses were compared for
variations and nuances in meaning and cross-compared with the goal of developing an accurate,
detailed and understandable theory for the model.
The semi-structured nature of the questionnaire and method of data collection does not facilitate an
easy coding of the data, however, the aim of the analysis was to understand the various constructive
elements of the data through an inspection of relationships between concepts, constructs and
variables, and to identify any patterns or trends that can be isolated, or to establish themes in the
data (Mouton, 2001).
Data analysis was assembled using Microsoft Access, since this tool allows for the capturing of
largely descriptive survey questions, summaries, calculations and flexibility in reporting, which is a
very important factor due to the matrix structure of the questions.
UUnniivveerrssiittyy ooff PPrreettoorriiaa eettdd –– KKaasssseellmmaann,, RR ((22000066))

University of Pretoria Kasselman, R
(2006)
97
3.9 Conclusion
The complexity of the model and the seemingly limited exposure and understanding by the groups in
the target population is an accurate reflection of the current understanding and insight into the
reporting of Human Capital in the industry. The research method was followed, and the stumbling
blocks addressed by the researcher by changing the method applied to obtain useful information.
Awareness of the pitfalls and limitations when conducting research of this nature always serve as
caveats for future studies. The results and findings derived from implementing these methods are
reported and discussed in the next chapter.
Chapter 4 will present the results and findings of the study.
UUnniivveerrssiittyy ooff PPrreettoorriiaa eettdd –– KKaasssseellmmaann,, RR ((22000066))

University of Pretoria Kasselman, R
(2006)
98
CHAPTER 4 - RESULTS AND DISCUSSIONS
“There is no major decision that takes place in the company in which [the VP of HR] is not
involved, and I fully expect him to have an opinion on business decisions. As CEO, I use [the
VP of HR] as a personal consultant and sounding board for ideas and problem solving.” - Chairman and CEO, ARCO
4.1 Introduction
This chapter describes the analysis of the empirical part of the study aimed at fulfilling the primary
research objectives as described in Chapter 1. The main research objective was to develop a
framework which can be used for reporting Human Capital as part of company reporting. Human
Resource practitioners need to be able to identify and leverage activities, interventions and/or
actions which will provide qualifiable results that demonstrate shareholder value for the organisation.
This reporting framework with categories provides a holistic, future-orientated account of the human
assets in a company, leading to a new model / theory.
In order to develop this framework, the study investigated the following:
1. Insight required by stakeholders into the Human Capital employed by organisations.
2. What Human Capital reporting and information are relevant, reliable and consistent for internal
and external stakeholders.
3. Which Human Resource Management components can be used for comparative external
reporting.
Consideration was also specifically given to consequences (please read as benefits) such as:
1. Strategic alignment of human resource development related initiatives.
UUnniivveerrssiittyy ooff PPrreettoorriiaa eettdd –– KKaasssseellmmaann,, RR ((22000066))

University of Pretoria Kasselman, R
(2006)
99
2. Measurement of ROI for HR initiatives.
3. Related value propositions against which measurements can take place and against which HR
development policies, procedures, guidelines and/or initiatives can ultimately be aligned.
It needs to be understood that the following research reflects largely the qualitative aspect of the
research, and will be dealt with in literary format. This is an integration of the data obtained through
the triangulation process.
4.2 Current situation - Human Capital Value Add
An understanding of the current situation relating to the functional area of Human Resources
Management as well as the management of Human Capital (people) in South African organisations
was one of the key starting points for the data collection phase of this study.
This is important at two levels:
1. Providing insight into the current practices and thinking within the industry and specifically the
organisations in which the potential interviewee operates.
2. As an initiator to the thinking required to develop a model for the future which will be considered
beneficial to the development of Human Assets in the organisation.
Using the survey developed for the Executive and Senior HR Managers group also worked as an
initial “screening” that enabled the researcher to focus on those individuals or companies who had
already shown some thinking or interest in the topic under consideration.
4.2.1 Findings
4.2.1.1 Category 1: Human Resource Management Today
An understanding of the management of the HR function and the level of maturity of this discipline is
required to assist in evaluation of the input and discussions. At the start of the semi-structured
UUnniivveerrssiittyy ooff PPrreettoorriiaa eettdd –– KKaasssseellmmaann,, RR ((22000066))

University of Pretoria Kasselman, R
(2006)
100
interviews, ensuring alignment on the context of the study, the researcher had to explain some of the
theoretical models and thinking as it pertains to measuring Human Assets. This also sparked
discussions on what the current levels of understanding are and the importance of Human
Resources as a function in the organisation.
Nine organisations were identified through the judgement sampling (post the initial survey). This
portion of the interview was guided by Questions 2, 3, and 6 (Appendix A) to determine the current
status of HR reporting within the organisation. The responses were very similar in that they all
confirmed that Human Capital was considered as a key driver of the companies’ performance and
that “it is very obvious that People are our most important asset”.
The senior HR managers interviewed confirmed that they believed that the HR strategies are
aligned, thus enabling the business strategy, and this was confirmed by the executives interviewed.
The methods to demonstrate or prove that this is so posed its own challenges as this group
explained in great detail the diverse methods which they use to report on people issues within the
organisation. In probing the link to the bottom line, many faltered and were not able to clearly
articulate how their key indicators (such as demographics, turnover, exit interview data - reference
Table 2) relate to their bottom line. An exception to this is organisations in the Mining industry – they
were able to link their key indicator, absenteeism, to the loss of productivity and thus the direct
impact on the bottom line. They also linked this indicator to the line management report - manpower
plan. The latter report has evolved during the lifecycle of mining to include many factors, including
that of the skills level of the workforce (it initially started as a report that lists the quantity of the
workforce available for shifts) and potential impact of trends in sick leave or unplanned absences.
Of key interest were the comments regarding the shift in focus for organisations and the demand on
HR practitioners, particularly post-ERP systems implementations (see Category 3 below). The role
of the HR practitioner is clearly changing and one of the issues identified by this group is the lack of
understanding and knowledge for the new role. This is also a finding throughout this study as one of
the key barriers to an effective model for Human Capital reporting.
4.2.1.2 Category 2: Reporting key indicators - Internally and Externally
UUnniivveerrssiittyy ooff PPrreettoorriiaa eettdd –– KKaasssseellmmaann,, RR ((22000066))

University of Pretoria Kasselman, R
(2006)
101
Executives and Senior HR Managers were asked in their initial survey to list the key indicators they
currently use (internally and externally) within their organisation and then rate the importance of
linking their key indicators to company profitability on a 5-point scale.
Indu
stry
Reported Indicators Associated with your company’s profitability or competitiveness
Complicatedness
(1 - 5)
What prevents you reporting this externally?
Commitment/ satisfaction 1 To a great extent Very straightforward
Demographics 2 To some extent Very straightforward
Informal feedback to management (spontaneous Q&A sessions, socials)
2 To some extent Straightforward Externally
Turnover 1 To a great extent Complicated Not something that can be shared externally
Feedback from the Staff Mentorship Program
2 To some extent Complicated Not something that can be shared externally
Con
sulti
ng
Internally Only
Individual Employee Competency and Development Plan
1 To a great extent
Externally Demographics 1 To a great extent Very straightforward
Absenteeism 2 To some extent Very straightforward Other: (Please specify)
Commitment/ satisfaction 2 To some extent Straightforward
Exit Interviews 2 To some extent Straightforward Not something that can be shared externally
Recruitment and selection
2 To some extent Straightforward Not enough time
Staff Attitude Survey 2 To some extent Complicated Not something that can be shared externally
Ener
gy
Internally Only
Training ROI 2 To some extent Complicated
UUnniivveerrssiittyy ooff PPrreettoorriiaa eettdd –– KKaasssseellmmaann,, RR ((22000066))

University of Pretoria Kasselman, R
(2006)
102
Indu
stry
Reported Indicators Associated with your company’s profitability or competitiveness
Complicatedness
(1 - 5)
What prevents you reporting this externally?
Turnover 2 To some extent Very straightforward Not something that can be shared externally
Absenteeism 2 To some extent Straightforward Little support from senior management
Commitment/ satisfaction 1 To a great extent
Demographics 2 To some extent Very straightforward
Externally
Productivity 2 To some extent Straightforward
Absenteeism 1 To a great extent Very straightforward Not something that can be shared externally
Demographics 1 To a great extent Very straightforward
Exit Interviews 2 To some extent Straightforward Not something that can be shared externally
Performance management
2 To some extent Strategically not viable
Not something that can be shared externally
Recruitment and selection
2 To some extent Straightforward Not enough time
Skills Gap 1 To a great extent Complicated
Turnover 1 To a great extent Very straightforward Not something that can be shared externally
Min
ing
Internally Only
Turnover 2 To some extent Very straightforward
Demographics 1 To a great extent Straightforward
Employee brand 2 To some extent
Recruitment and selection
2 To some extent Complicated Other: (Please specify)
Oth
er (p
leas
e sp
ecify
)
Externally
Training ROI 2 To some extent Complicated
UUnniivveerrssiittyy ooff PPrreettoorriiaa eettdd –– KKaasssseellmmaann,, RR ((22000066))

University of Pretoria Kasselman, R
(2006)
103
Indu
stry
Reported Indicators Associated with your company’s profitability or competitiveness
Complicatedness
(1 - 5)
What prevents you reporting this externally?
Turnover 2 To some extent Very straightforward Not something that can be shared externally
Absenteeism 2 To some extent Very straightforward Other: (Please specify)
Best company to work for 2 To some extent Straightforward Not something that can be shared externally
Commitment/ satisfaction 2 To some extent Straightforward Not something that can be shared externally
CSR 1 To a great extent
Internally Only
Performance management
2 To some extent Straightforward Other: (Please specify)
Table 2: Key Indicators
From the evidence presented in Table 2, it can be concluded that those indicators that are reported
on externally are metrics which are considered “Very straightforward” or “Straightforward”. A single
exception, Recruitment and Selection as identified as complicated by Industry Other, was discarded
by the researcher as non-valid data due to the broadness of this function. In probing the reason for
the more complicated indicators not being reported on externally, the group stated that the level of
complicatedness is not considered as a limitation to reporting externally, but rather that time (linked
to the complicatedness of the reporting) and strategic or competitive reasons i.e. “not something
which can be shared externally” is the key driver in the reluctance to report externally on this
information.
4.2.1.3 Category 3: Technology Systems utilised for Human Capital Management (HCM)
Technology systems are important enablers for knowledge management and reporting of HRM. All
organisations interviewed used some form of technology-enabled systems, 90% using an ERP
system which is integrated with other functional areas within the company (refer Figure 25 below).
UUnniivveerrssiittyy ooff PPrreettoorriiaa eettdd –– KKaasssseellmmaann,, RR ((22000066))

University of Pretoria Kasselman, R
(2006)
104
The company using a non-ERP system indicated that the size of the company does not warrant the
use and expense of such as system.
0
1
2
3
4
5
6
Peoplesoft SAP Oracle non-ERP
Technology Systems used by respondents
Figure 23: Usage of Technology Systems
Questions 5 and 6 guided the researcher in determining the relative importance of using a system to
enable reporting and analytics of Human Capital information. Without exception, the interviewees
confirmed that the system(s) inform and guide them (through best practices built into the system) in
the reporting and reporting requirements.
Of key interest is that the users of the systems (HR functional staff) were trained on the functionality
of the system, but not necessarily on the application and usage of the reports or data analytics. As
part of the ERP systems implementation, reports were identified (by the business) as required and
where standard reports were not available, reports developed specifically. One organisation setup
an HR team (HR business solutions) to specifically address the HR business requirements and
employed an analyst who specialises in data warehousing and reporting. The other organisations all
depend on an IT support function to provide them with relevant reporting and data analyses, and
they specify the business requirements. As the HR specialists are not trained on data mining or
analyses, this may be considered as a barrier to moving reporting in this environment to the next
level.
UUnniivveerrssiittyy ooff PPrreettoorriiaa eettdd –– KKaasssseellmmaann,, RR ((22000066))

University of Pretoria Kasselman, R
(2006)
105
4.2.2 Lessons learned and considerations
From the evidence presented above and the data analyses, the following lessons regarding the
current status of HR in South Africa was learned:
• HR is still fighting the battle to be considered a strategic business partner. Although the value of
people (Human Capital) is considered key for organisations today, the value of the HR
contributions remains unproven and challenged.
• Organisations report on the latest trends rather than specific issues which can be considered a
competitive advantage in their industry and the reporting are mostly lagging (re-active).
• ERP technology enables the HR function and the built-in best practices in these applications
assists HR practitioners in providing reports. These reports are not necessarily analysed with a
view of identifying trends, nor are they necessarily valued (and read) by the line function. A
perception by senior HR managers is that the line manager asks for reports (during system
implementation phase) that they do not use. (Please note: line managers were not interviewed).
• HR practitioners do not determine which reports should be included in company external
reporting.
The above categories provided an insight into the culture prevailing in South African organisations
regarding the utilisation and perceived value of the HR function’s contributions. It also confirmed that
Human Capital (people) is considered a key asset for organisations.
4.3 Reporting on Human Capital
Evaluating the current reporting on Human Capital provides insight into the type and levels of
reporting in South African organisations, and more importantly, which reports provide organisations
with insights into the effective usage of their Human Capital. Understanding the internal and external
reporting, and what metrics are being applied by the HR function, as well as the link to the
organisational strategies and impact on the bottom line, is the key focus of this dimension.
UUnniivveerrssiittyy ooff PPrreettoorriiaa eettdd –– KKaasssseellmmaann,, RR ((22000066))

University of Pretoria Kasselman, R
(2006)
106
4.3.1 Findings
HR Managers surveyed and interviewed had varied opinions regarding reporting on the Human
Capital within an organisation. Although interviewees were all in agreement that reporting from a
Human Capital or Human Resource Management perspective is required, and that Human Capital is
the most important asset within a company, not many were clear on exactly what should or should
not be reported on.
4.3.1.1 Category 1: Most important indicators
When asked what the top most important reports (indicators) are, i.e. those issues of most concern in
the organisation, respondents gave varied answers, depending on the type of industry and maturity
of the organisation, which was to be expected.
Issues top of the list are illustrated graphically below (Figure 23 ).
Top Most Important Report (Indicators)
Demographics45%
Employee Turnover11%
Skills Gap22%
Talent Management22%
Figure 24: Top Most Important Indicators (Reports)
UUnniivveerrssiittyy ooff PPrreettoorriiaa eettdd –– KKaasssseellmmaann,, RR ((22000066))
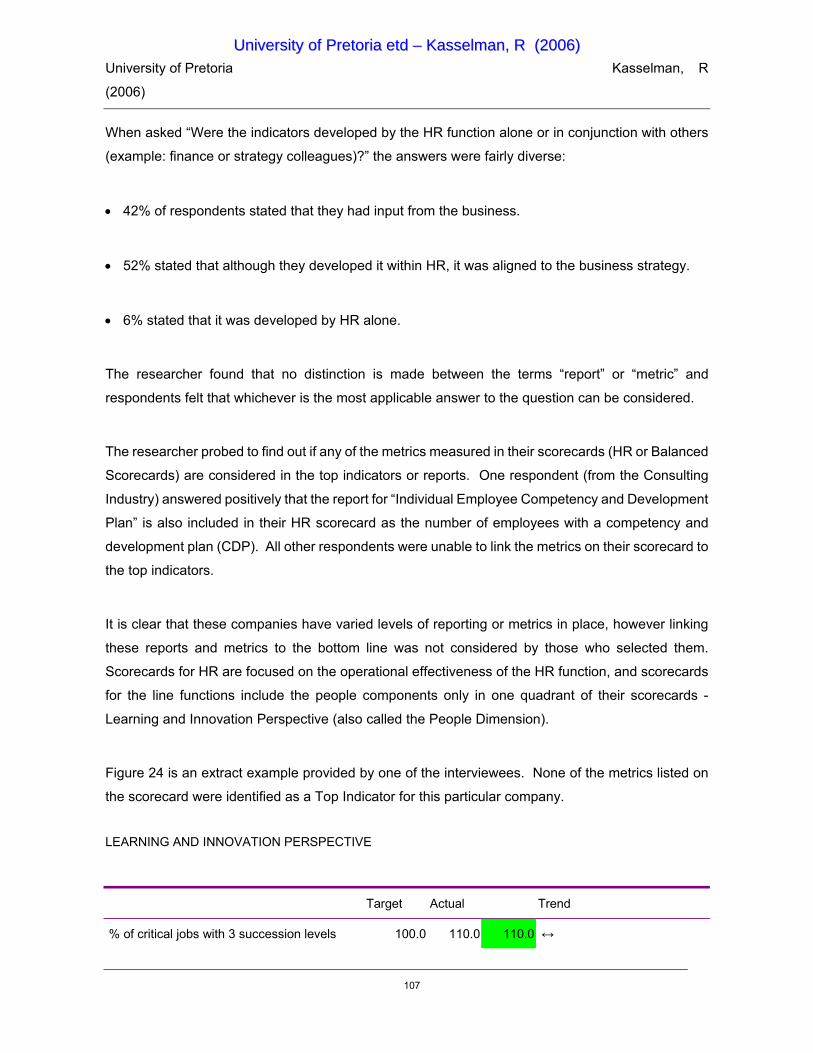
University of Pretoria Kasselman, R
(2006)
107
When asked “Were the indicators developed by the HR function alone or in conjunction with others
(example: finance or strategy colleagues)?” the answers were fairly diverse:
• 42% of respondents stated that they had input from the business.
• 52% stated that although they developed it within HR, it was aligned to the business strategy.
• 6% stated that it was developed by HR alone.
The researcher found that no distinction is made between the terms “report” or “metric” and
respondents felt that whichever is the most applicable answer to the question can be considered.
The researcher probed to find out if any of the metrics measured in their scorecards (HR or Balanced
Scorecards) are considered in the top indicators or reports. One respondent (from the Consulting
Industry) answered positively that the report for “Individual Employee Competency and Development
Plan” is also included in their HR scorecard as the number of employees with a competency and
development plan (CDP). All other respondents were unable to link the metrics on their scorecard to
the top indicators.
It is clear that these companies have varied levels of reporting or metrics in place, however linking
these reports and metrics to the bottom line was not considered by those who selected them.
Scorecards for HR are focused on the operational effectiveness of the HR function, and scorecards
for the line functions include the people components only in one quadrant of their scorecards -
Learning and Innovation Perspective (also called the People Dimension).
Figure 24 is an extract example provided by one of the interviewees. None of the metrics listed on
the scorecard were identified as a Top Indicator for this particular company.
LEARNING AND INNOVATION PERSPECTIVE
Target Actual Trend
% of critical jobs with 3 succession levels 100.0 110.0 110.0 ↔
UUnniivveerrssiittyy ooff PPrreettoorriiaa eettdd –– KKaasssseellmmaann,, RR ((22000066))
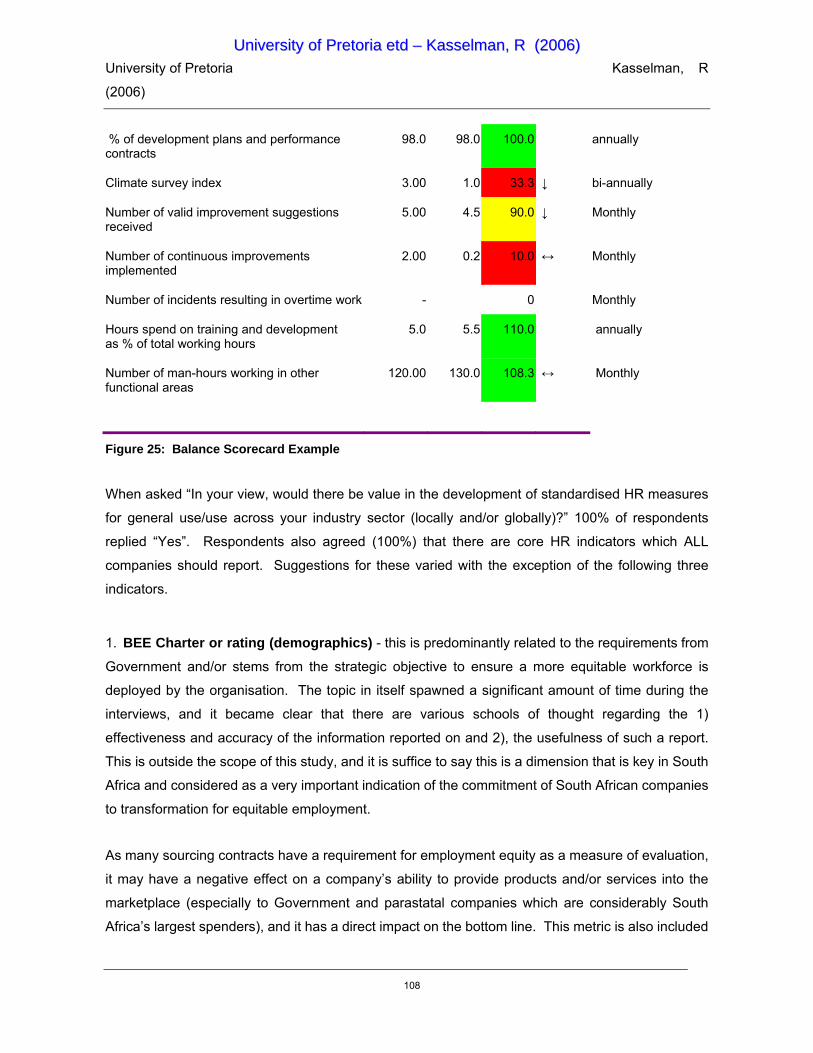
University of Pretoria Kasselman, R
(2006)
108
% of development plans and performance contracts
98.0 98.0 100.0 annually
Climate survey index 3.00 1.0 33.3 ↓ bi-annually
Number of valid improvement suggestions received
5.00 4.5 90.0 ↓ Monthly
Number of continuous improvements implemented
2.00 0.2 10.0 ↔ Monthly
Number of incidents resulting in overtime work - 0 Monthly
Hours spend on training and development as % of total working hours
5.0 5.5 110.0 annually
Number of man-hours working in other functional areas
120.00 130.0 108.3 ↔ Monthly
Figure 25: Balance Scorecard Example
When asked “In your view, would there be value in the development of standardised HR measures
for general use/use across your industry sector (locally and/or globally)?” 100% of respondents
replied “Yes”. Respondents also agreed (100%) that there are core HR indicators which ALL
companies should report. Suggestions for these varied with the exception of the following three
indicators.
1. BEE Charter or rating (demographics) - this is predominantly related to the requirements from
Government and/or stems from the strategic objective to ensure a more equitable workforce is
deployed by the organisation. The topic in itself spawned a significant amount of time during the
interviews, and it became clear that there are various schools of thought regarding the 1)
effectiveness and accuracy of the information reported on and 2), the usefulness of such a report.
This is outside the scope of this study, and it is suffice to say this is a dimension that is key in South
Africa and considered as a very important indication of the commitment of South African companies
to transformation for equitable employment.
As many sourcing contracts have a requirement for employment equity as a measure of evaluation,
it may have a negative effect on a company’s ability to provide products and/or services into the
marketplace (especially to Government and parastatal companies which are considerably South
Africa’s largest spenders), and it has a direct impact on the bottom line. This metric is also included
UUnniivveerrssiittyy ooff PPrreettoorriiaa eettdd –– KKaasssseellmmaann,, RR ((22000066))

University of Pretoria Kasselman, R
(2006)
109
in all executive’s KPIs (those interviewed and according to those senior HR managers interviewed
for their executive team and/or board members).
Although this indicator is reported, mostly in industry charter format, the impact of this on the
organisation (positive or negative) is not measured. This indicator is linked to an external factor that
has a real impact on the bottom line. The fact that this indicator has been included in the KPIs of the
top management team seems to have driven it down into the organisation and back down the value
chain of HR (back to the attraction of staff). It can be concluded that if an indicator is included in the
KPIs of the top management team, the relevant importance of this is elevated to a strategic level by
default. This should be considered in the implementation of the proposed model as criteria for
success.
2. Leadership pipeline / succession planning (assurance of the existence if not necessarily the
details) - this topic, interlinked with talent management, was discussed considerably during
interviews. Although there are different opinions as to the risk of making this information available
internally (outside the HR function) or externally, the importance of having a plan in place and
developing leaders for future is of equal high concern for executives and HR practitioners.
Understanding the leadership pipeline and how to develop this, as well as the broader topic of talent
management, is high on the agenda of all the HR practitioners interviewed. They are unclear as to
how to reflect the success (or failure) of such a programme, however the programmes to address this
have in all cases been put in place.
The discussion regarding the leadership development and succession planning programmes
prompted the question regarding ROI being measured and tracked for HR programmes, to which
87% of those interviewed admitted not doing nor having the ability (tools, techniques or resources) to
do this.
Concern regarding the shortage (supply) of key skills in the country makes the success of many HR
programmes critical and as a result, the focus for ROI measures has been predominantly in Training
and Development programmes. All respondents were familiar with the calculation of Training ROI.
3. Employee turnover - this lagging (historic) measure is reported on by all respondents and 46%
of those interviewed admitted to not using this information, even if they do track or report it. One
respondent mentioned that this may be used as input into the planning for recruitment; however this
UUnniivveerrssiittyy ooff PPrreettoorriiaa eettdd –– KKaasssseellmmaann,, RR ((22000066))

University of Pretoria Kasselman, R
(2006)
110
was not validated by the senior HR Manager within this company. As the staff turnover rate is very
company and industry specific, the researcher also asked those who do use the metric if they
compare their turnover rate with the industry average. This was confirmed, however internal
benchmarking (i.e. comparing turnover in departments, divisions, teams) is not considered standard
practice and only one respondent replied positively about (ever) having benchmarked this.
The turnover rate is very important on two dimensions: 1) to ensure that the company has a
reasonable amount of “fresh, new blood” and avoid incestuous thinking and 2), to manage the cost
and negative effect on employee efficiency due to a high turnover rate. As the staff turnover rate in
an organisation may be considered a reflection of management, stability and workplace conditions
within a company, this metric is considered important, however not necessarily of major strategic
value.
4.3.1.2 Category 2: HR reports that support and/or enable business decisions
When probed as to what type of questions business managers need HR to provide answers to which
can improve their decision making or add value to the business, a number of questions were
identified:
Please note: Questions have been reworded for clarity. Comments in brackets are related and
added by the researcher.
• Which segments of the workforce create the value for the core business (those components of the
business where most of the revenue is initiated or generated)?
• Which areas of the business will be impacted by retirement (or unplanned leavers)?
• What impact will retirement have (on the skills and productivity necessary to meet future
demand)?
• What is done to prepare successors (using coaching, training, cross-skilling or related HR
programmes, and what is the success rate / ROI of such initiatives)?
UUnniivveerrssiittyy ooff PPrreettoorriiaa eettdd –– KKaasssseellmmaann,, RR ((22000066))

University of Pretoria Kasselman, R
(2006)
111
• In what areas is there a shortage of skills - demand greater than supply (what are the potential
top-line and bottom-line implications)?
• What skills will we need over the next medium term period (five years) that we don’t currently
possess? (Is there a supply of these skills in the market place?)
• How will we create capacity for those skills required during the next five years which do not
currently exist? (What happens to the business if not found?)
• What is the staff turnover within critical areas (and how much does this cost in customers,
productivity, innovation, and quality)?
• What are we doing to resolve the root cause of unacceptable staff turnover? (Are there areas
where staff turnover is actually required / needs to be encouraged?)
Please note: Those interviewed were not certain that they were able to answer all or easily access
this information if asked!
When asked about their strategic objectives and plans and what tactics they have established to
allow for this, HR practitioners identified a number of overall objectives that they hoped to achieve
through measurement. The objectives ranged from the improvement of the efficiency of the HR
function through to partnering with business to help support business decisions.
• Increase HR’s effectiveness and efficiency.
• Introduce HR to best-practice thinking and benchmarking expertise.
• Demonstrate HR’s credibility and value-add.
• Support critical decision-making through data analysis (pro-actively).
UUnniivveerrssiittyy ooff PPrreettoorriiaa eettdd –– KKaasssseellmmaann,, RR ((22000066))

University of Pretoria Kasselman, R
(2006)
112
• Align the “people” (Human Capital) with the business needs of the company through placement of
the right person in the right position.
• Establish HR as a strategic business partner.
4.3.2 Lessons learned and considerations
The HR function is still operationally focused, but may be starting to take on a strategic role. HR
strategies are set in alignment with the overall business strategy and this may invariably force HR
practitioners to think more in terms of leading (forward thinking) indicators.
Executives’ understanding and insight into the value of the Human Capital within the business is
clear, albeit only at a qualitative level. People are seen part of the competitive advantage of the
organisation and it is a conscious decision to invest in and develop the Human Capital of the
organisation. Line managers are taking on a more “people management” role; i.e. learning to
manage the people as assets of the organisation to draw value from other assets (financial and
physical). The value added by the HR function is not as clear and is still being questioned.
Implementing so called “Best Practices” because they worked elsewhere or come built-in standard
with the system, will not significantly improve HR’s ability to achieve their objectives - the value in the
systems are only effective if they are extracted. This requires the insight and know-how of HR
practitioners. This knowledge and skill seems to be lacking in current HR practitioners and thus the
ability to link the value of HR using reporting to the bottom-line impact is limited. This means that a
lot of what may be termed “Value Add” HR activities are a waste of time and effort! Many reports run
may not be worth the paper it is printed on and may end up in “File 13”. It is unlikely that HR will
achieve the full value of initiatives unless they are really strategically aligned and understood in the
context of the organisational objectives, linked to the bottom line and their effect measured and
demonstrated. This view is shared by the executives, however they are at an impasse as to how to
achieve or enable it.
4.4 Using Metrics and Benchmarking
Using metrics to report on Human Capital and Human Resources Management is a very important
component of the ability to link the value contribution of the HR function back to the organisations’
UUnniivveerrssiittyy ooff PPrreettoorriiaa eettdd –– KKaasssseellmmaann,, RR ((22000066))

University of Pretoria Kasselman, R
(2006)
113
bottom line. Benchmarking this information either internally or against industry best practices will
provide the organisation with insight as to how they compare to the rest of the market in their industry
and provide imperative for improvement. Many qualitative measures and ratios (quantitative) have
been developed for HR, most often used being the Balance Scorecard. The employee or Human
Resources quadrant on a company’s scorecard is, however, often most likely to include meaningless
metrics, unrelated to the bottom line. HR scorecards (refer Section 2) are used within the HR
functional area.
4.4.1 Findings
Executives and senior HR managers surveyed indicated that they use HR scorecard reports to their
Executive Committee or Board Meetings (71%) as well as within HR (86%) (Refer Table 3). The HR
functions provide specific reporting to Line Management (100%), demonstrating that their reporting
skills exist and (based on the assumption that the line reports are utilised) are considered of value to
the operations.
HR Scorecard to Exco / Board 71%
HR Scorecard within HR 86%
Report to HR Directors 71%
Special reports for Line Management 100%
Special reports for Employees 29%
Report to External Stakeholders and Investors 29%
Separate Corporate Social Responsibility Report 43%
Table 3 HR Reporting
During the semi-structured interviews, it became clear that these reports have different impacts on
the various businesses and that the reporting to a large degree has become “historical” i.e. there is
uncertainty as to why particular metrics are being reported.
HR consultants and students were approached with a list of metrics for evaluation (see Addendum
B) to obtain their input regarding the usability of these metrics, and if they can be considered to
provide insight into the effectiveness and efficiency of the Human Resources function. They were
UUnniivveerrssiittyy ooff PPrreettoorriiaa eettdd –– KKaasssseellmmaann,, RR ((22000066))

University of Pretoria Kasselman, R
(2006)
114
also asked to evaluate the components of the framework to measure the value of Human Capital
against a model for shareholder value.
Questions asked for the evaluation of the metrics include:
• Is the indicator/ metric applicable?
• Is the indicator/ metric complete?
• Is the indicator applicable to all types of organisations?
• Is the data for the indicator easily obtained?
• Is the calculation required for the indicator simple?
• Is the indicator understandable?
• Is the data objective, qualifiable and reliable?
• Does the indicator point towards sustainable improvement?
• Can the indicator be measured on an ongoing basis?
See Addendum B - Delphi Workshop Results
Respondents’ results to these questions are categorised and reported on below (Table 4). The
researcher accessed the knowledge regarding the metrics first by asking if the metrics is
understandable to the respondents. Metrics not understood were discussed and explained during
the Delphi-workshop.
UUnniivveerrssiittyy ooff PPrreettoorriiaa eettdd –– KKaasssseellmmaann,, RR ((22000066))
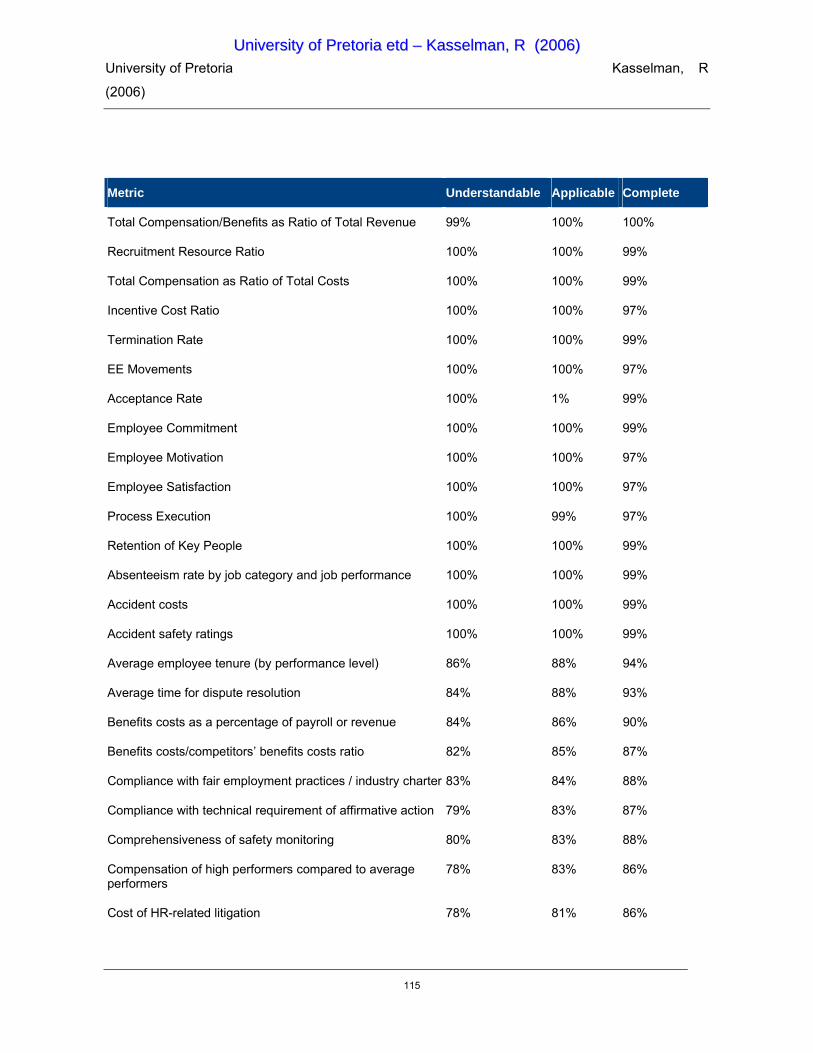
University of Pretoria Kasselman, R
(2006)
115
Metric Understandable Applicable Complete
Total Compensation/Benefits as Ratio of Total Revenue 99% 100% 100%
Recruitment Resource Ratio 100% 100% 99%
Total Compensation as Ratio of Total Costs 100% 100% 99%
Incentive Cost Ratio 100% 100% 97%
Termination Rate 100% 100% 99%
EE Movements 100% 100% 97%
Acceptance Rate 100% 1% 99%
Employee Commitment 100% 100% 99%
Employee Motivation 100% 100% 97%
Employee Satisfaction 100% 100% 97%
Process Execution 100% 99% 97%
Retention of Key People 100% 100% 99%
Absenteeism rate by job category and job performance 100% 100% 99%
Accident costs 100% 100% 99%
Accident safety ratings 100% 100% 99%
Average employee tenure (by performance level) 86% 88% 94%
Average time for dispute resolution 84% 88% 93%
Benefits costs as a percentage of payroll or revenue 84% 86% 90%
Benefits costs/competitors’ benefits costs ratio 82% 85% 87%
Compliance with fair employment practices / industry charter 83% 84% 88%
Compliance with technical requirement of affirmative action 79% 83% 87%
Comprehensiveness of safety monitoring 80% 83% 88%
Compensation of high performers compared to average performers
78% 83% 86%
Cost of HR-related litigation 78% 81% 86%
UUnniivveerrssiittyy ooff PPrreettoorriiaa eettdd –– KKaasssseellmmaann,, RR ((22000066))
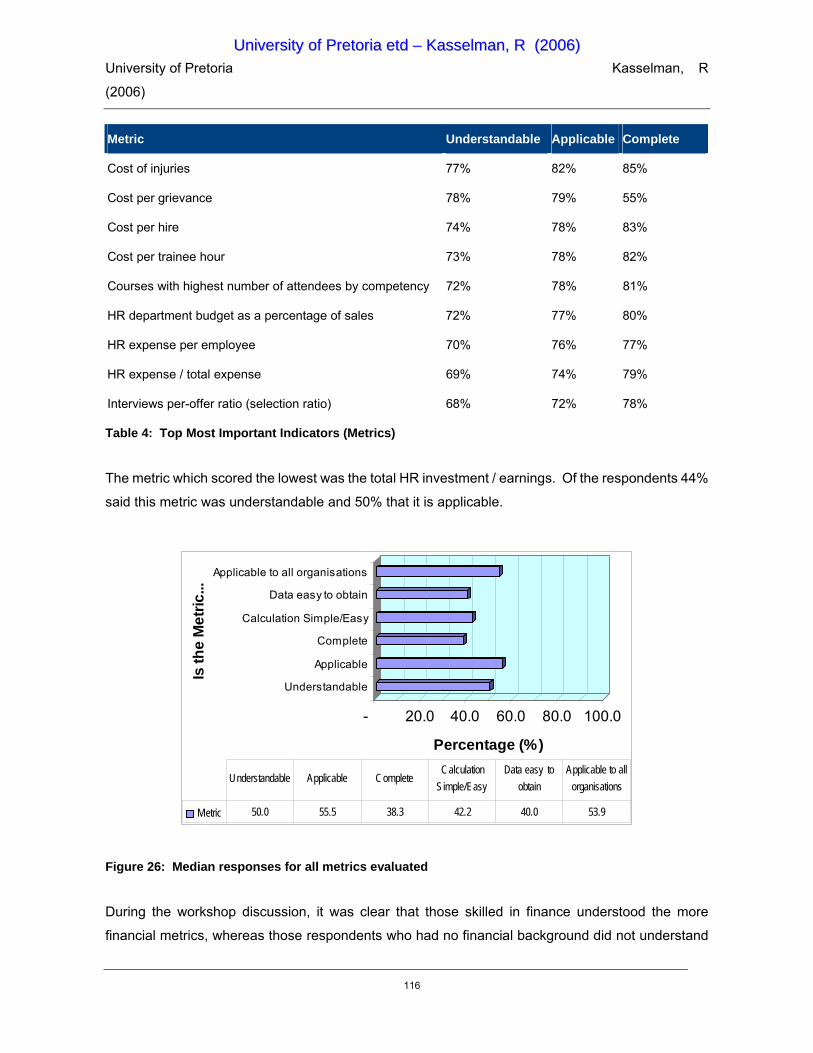
University of Pretoria Kasselman, R
(2006)
116
Metric Understandable Applicable Complete
Cost of injuries 77% 82% 85%
Cost per grievance 78% 79% 55%
Cost per hire 74% 78% 83%
Cost per trainee hour 73% 78% 82%
Courses with highest number of attendees by competency 72% 78% 81%
HR department budget as a percentage of sales 72% 77% 80%
HR expense per employee 70% 76% 77%
HR expense / total expense 69% 74% 79%
Interviews per-offer ratio (selection ratio) 68% 72% 78%
Table 4: Top Most Important Indicators (Metrics)
The metric which scored the lowest was the total HR investment / earnings. Of the respondents 44%
said this metric was understandable and 50% that it is applicable.
- 20.0 40.0 60.0 80.0 100.0
Percentage (%)
Understandable
Applicable
Complete
Calculation Simple/Easy
Data easy to obtain
Applicable to all organisations
Is th
e M
etric
...
Metric 50.0 55.5 38.3 42.2 40.0 53.9
Understandable Applicable CompleteCalculation
Simple/EasyData easy to
obtainApplicable to all
organisations
Figure 26: Median responses for all metrics evaluated
During the workshop discussion, it was clear that those skilled in finance understood the more
financial metrics, whereas those respondents who had no financial background did not understand
UUnniivveerrssiittyy ooff PPrreettoorriiaa eettdd –– KKaasssseellmmaann,, RR ((22000066))

University of Pretoria Kasselman, R
(2006)
117
metrics with a strong financial grounding. This explains the phenomenon of the lower level of
understanding of this metric. The median responses for the entire list of metrics presented during
the Delphi workshop are illustrated in Figure 27 for all metrics evaluated. On average, 50% of the
metrics listed were understandable to the participants of the Delphi-workshops with only 40% of data
identified as easy / available to obtain. Those items identified as applicable had no significant
difference to the percentage identified as applicable to all. One may conclude that any of the metrics
considered applicable are applicable across all industries.
4.4.2 Lessons learned and considerations
A wealth of HR metrics exists and are being applied with varied degrees of understanding and
insight. In the new role of HR, financial skills should be considered a prerequisite for HR
practitioners.
Metrics is the starting point in evaluating the performance, efficiency and/or effectiveness of
employees and the HR function. These metrics should not be contained in pure HR “softer”
measures, but should include strong financial measures that demonstrate the value of HR initiatives
at a financial, bottom line impact level.
The objectives of the organisation should define the key performance areas to be evaluated and
inclusive of this should be areas of technology, processes, individual and team performance and
impact on the customer. Using metrics provide the platform for benchmarking, both internally
(amongst business units or divisions) as well as externally (against other industry players). Metrics
and benchmarking are focused on the measurement of efficiency and effectiveness and relate to the
function of Human Resource Management, rather than the efficiency and effectiveness of the
Human Capital (person). It is important to understand the measurement of metrics, and using these
for benchmarking has to be balanced and carefully assessed to ensure that it does not motivate or
result in value detracting behaviour.
4.5 Comparative External Reporting on Human Capital
Comparative external reporting on Human Capital and the related value of Human Assets has been
under discussion for a number of years. The Chartered Accountants of Canada (CICA) Board of
Governors established a task force in May 1996 to review the CICA’s standard-setting activities and
UUnniivveerrssiittyy ooff PPrreettoorriiaa eettdd –– KKaasssseellmmaann,, RR ((22000066))

University of Pretoria Kasselman, R
(2006)
118
a chapter of their final reporting was dedicated to what they call Beyond Standard Setting — A
Structure for Innovation. In this report, it is stated that in addition to internationally-accepted
accounting and auditing standards, the business world is demanding the profession move beyond
the historical annual financial statements. These statements on which standards are focused, and
into a future where knowledge is rapidly changing and the need for reporting is continuous, require
consideration for where wealth is generated more by Intellectual Capital than by plant and
equipment; and where the needs of decision makers are focused on measuring and enhancing
organisational performance (Lord, 1998).
The Canadian Performance Measures Initiative (CPMI) began in late 1995 under the joint
sponsorship of the CICA and several other organisations. It was charged with developing an
integrated performance measurement framework with indicators relating to Intellectual Capital,
quality, environmental performance, customer satisfaction, innovation, and other issues. Their
recommendation in this report was to establish a “Centre for Innovation” to sponsor and champion
initiatives that will meet this market needs (Lord, 1998). Although this centre was established, it
would seem that not much has come from the investigation into Intangible Assets to be included in
reporting. No consideration has been given to this by the Chartered Accountants of South Africa
(contacted by the researcher in November 2005), and as such, the survey for auditors to gather their
views on reporting Human Capital externally is the only base for this category.
4.5.1 Findings
Auditors interviewed were all (100%) of the opinion that although it would be beneficial to include the
information in company annual reports, it would be difficult if not impossible to audit such information
year after year. By implication, this means that the result of this study may only be a guideline for
reporting, but that the report will not be able to be validated through the normal governance and audit
structures within organisations. One cannot help but wonder if it needs to be legislated before this
very important aspect of the business is valued. Taking into consideration the defined role of
auditors, the accountability for this information and the obligation to report on this remains with the
directors of the company.
4.5.1.1 Category 1: Is it essential to share strategic information with all stakeholders?
UUnniivveerrssiittyy ooff PPrreettoorriiaa eettdd –– KKaasssseellmmaann,, RR ((22000066))

University of Pretoria Kasselman, R
(2006)
119
Auditors were asked whether they consider it essential to share certain information with all
stakeholders. In determining the importance of sharing information with stakeholders, from an
auditors’ perspective, the key business questions gathered from the research into reporting on
Human Capital were categorised into themes and included in the auditors’ questionnaire. They were
asked to indicate whether this information should be readily available and shared with company
stakeholders.
Auditors - Q: It is Essential to share the following information with all stakeholders?
Information Question Yes
1. Which segments of the workforce create the value for which we are most rewarded in the market? 100%
2. Which areas of the business will be most impacted by impending waves of retirement? 100%
3. What is being done to prepare successors? 100%
4. What impact will anticipated retirement have on the skills and productivity necessary to meet future demand? 100%
5. Which segments of the workforce will be most impacted by the areas where the talent market is heating up (i.e., demand will outpace supply)? 100%
6. What is the potential top-line and bottom-line implications of demand outpacing supply in the talent market per segment of workforce? 100%
7. What skills will be required over the next five years that the company don’t have currently? 100%
8. How will the company create capacity for skills which they currently do not have? 100%
9. What is staff turnover within critical areas? 100%
10. How much is staff turnover costing the company In customers / productivity/ innovation / quality? 100%
11. What is being done to resolve the root cause of high staff turnover? 100%
12. What is being done to retain our key / core workforce segments? 100%
13. Is the company actively developing talent portfolios or workforce plans that will help us to understand and communicate the financial consequences of talent decisions on business? 100%
Table 5: Information readily available and shared with stakeholders
Table 5 presents the findings from auditors to determine which information is required for reporting to
stakeholders (including internal and external stakeholders). The entire list was considered to be
essential by respondents. This confirms the requirements identified by the executives and senior HR
UUnniivveerrssiittyy ooff PPrreettoorriiaa eettdd –– KKaasssseellmmaann,, RR ((22000066))

University of Pretoria Kasselman, R
(2006)
120
managers. Auditors were also asked what other information should be provided. Table 6 below lists
the additional information they consider to be essential and the rationale provided for this.
Information Reason / rationale for being essential to report externally
A statement by management as to whether they have adequate skills in the company to run the business efficiently
This is important bearing in mind the current shortage of qualified and trained staff in the country.
What effects transformation has had on the skills base of the company
In many instances staff is being replaced by previously disadvantaged individuals. As this portion of the population has a significant shortage of skills, previously trained persons may be replaced by inappropriately qualified personnel. This will effect the efficiency of the organisation.
Table 6: Additional Information considered essential by auditors
Table 6 also indicates that auditors consider the listed information important for both internal and
external stakeholders. The issue of the level and quality of skills was also identified by a number of
the senior HR managers interviewed and the consideration of the level of skills as well as the
potential negative effect of transformation (Employment Equity) on the Human Capital of the
organisation a consideration. The effects of transformation on the skills base of the organisation
may also be linked to the question “Is the company actively developing talent portfolios or workforce
plans that will help us to understand and communicate the financial consequences of talent
decisions on business?”
The question regarding the reporting of this information identified as essential, as described above,
was also evaluated for relevance to report externally by the auditors. The percentage of
respondents who considered the category theme questions to be reported on externally is illustrated
in Table 7. From this table, it is clear that leading indicators and financially linked indicators has been
given preference for external reporting by the Auditor group.
Auditors - Q: This information should be shared with External?
Question Yes
UUnniivveerrssiittyy ooff PPrreettoorriiaa eettdd –– KKaasssseellmmaann,, RR ((22000066))

University of Pretoria Kasselman, R
(2006)
121
Question Yes
1. Which segments of the workforce create the value for which we are most rewarded in the marketplace? 0%
2. Which areas of the business will be most impacted by impending waves of retirement? 100%
3. What is being done to prepare successors? 86%
4. What impact will anticipated retirement have on the skills and productivity necessary to meet future demand? 43%
5. Which segments of the workforce will be most impacted by the areas where the talent market is heating up (i.e., demand will outpace supply)? 43%
6. What is the potential top-line and bottom-line implications of demand outpacing supply in the talent market per segment of workforce? 43%
7 What skills will be required over the next five years that the company don’t currently possess? 43%
8 How will the company create capacity for skills which they currently do not have? 0%
9. What is staff turnover within critical areas? 100%
10. How much is staff turnover costing the company in customers/productivity/innovation/quality? 43%
11. What is being done to resolve the root cause of high staff turnover? 14%
12. What is being done to retain our key / core workforce segments? 29%
13. Is the company actively developing talent portfolios or workforce plans that will help us to understand and communicate the financial consequences of talent decisions on business? 100%
Table 7: Information to be shared externally
Even though the impact of retirement and what is done to prepare for successors as well as staff
turnover in critical areas have all been identified as information to be shared with external
stakeholders, the respondents did not consider that the impact (strategically or financially) should be
reported on externally. Taking into consideration that a lack of transparency—in historical results or
in what the company is saying about the future—raises a red flag with investors, a potential negative
effect on forecasts (refer Chapter 1: Measuring Shareholder Value) may be eminent should these
categories be reported on exclusively.
Demand and supply factors (information themes 5, 6 & 7) which have a direct correlation with staff
turnover and risks linked to a lack of succession planning, with a mean score of 43%, is of particular
interest. These factors have the potential to provide a valuator with insight relating to asset
productivity as well as potential for revenue growth (negative or positive) and as drivers of future
UUnniivveerrssiittyy ooff PPrreettoorriiaa eettdd –– KKaasssseellmmaann,, RR ((22000066))

University of Pretoria Kasselman, R
(2006)
122
performance (leading indicators), may be compared (benchmarked) with other organisations. The
lack of understanding the HR environment and the cause and effect in this environment is a major
barrier of constraint for auditors of HR information.
4.5.2 Lessons learned and considerations
The lack of integration and alignment between Human Resources and Finance practitioners in their
level of insight and focus on the financial aspects of Human Capital reporting may be considered as
the biggest barrier to calculating and reporting the value of Human Assets in organisations.
• Understanding that the market value of an organisation is bigger than its book value and
attributing this to “intangible assets” seems to be an easy way out. Understanding the value and
impact of these intangible assets - in particular the application of Human Capital that has an
effect on the assets - requires an understanding of this discipline by those who govern and audit
to ensure that reliable, fair values are attributed to the organisation’s assets.
• A lack of insight into the discipline of HR and its impact on the bottom line can clearly be seen by
the responses received from auditors. This seems to indicate simply that a “new breed” of
auditors may be required for auditing information on Human Assets. Accountants should not be
asked to value this asset, just as accountants are not asked to value physical assets, but rather
taught about the aspects which may be considered for such a calculation.
• Depreciation of assets can be applied using the generally accepted principles and guidelines by
government. A similar model should be considered for Human Assets - it simply requires a lot
more innovative thinking and approach. “I cannot audit these factors” was a comment made by
the Audit partner of the team surveyed - this does not take away the fact that this information is
considered “essential” to stakeholders as confirmed by 100% of those surveyed.
The GAAP rules for company reporting do not make provision for the level and information required
for Human Capital reporting. The question of whether or not it is the GAAP rules which need to be
adopted or Human Capital reporting which needs to be conformed remains the key, critical question.
UUnniivveerrssiittyy ooff PPrreettoorriiaa eettdd –– KKaasssseellmmaann,, RR ((22000066))

University of Pretoria Kasselman, R
(2006)
123
4.6 Further results of semi-structured interviews
Other topics of discussion during the semi-structured interviews have been categorised and are
briefly discussed below:
4.6.1 Preferred Employer / Employer of Choice Status
Most of the respondents mentioned the strategic objective for their company of becoming a
Preferred Employer / Employer of Choice, which, with the current shortage of certain skills in South
Africa, seems to be indicative of the war for talent and again links into the HR programme for talent
management.
The ubiquitous phrase, “An Equal Opportunity Employer” of the 1990s has been replaced in
recruiting advertisements with “A Preferred Employer.” The un-stated implication is that the
company truly values diversity and has a culture, policies and practices that make it a comfortable
and productive working environment for people of different cultures (ethnic origin), people with
disabilities, homosexuals, immigrants, senior citizens, and women. Today, the working environment
benefits and opportunities offered to employees are considered in a more serious light as a key
differentiator.
Most HR practitioners stated that they do not currently see their own organisation as a “preferred
employer” and are not totally confident about the possibility of becoming one; however they state that
this is the goal or focus of their HR strategy and tactics. The same question posed to executives had
a different response - they are of the opinion that their organisation has plenty to offer and may be
considered a “Preferred Employer”.
Many organisations have entered or considered entering the prestigious “Best Company to Work for”
competition which allows the benchmarking of their offerings against other South African companies.
This survey is administered by Deloitte and the employees’ and employers’ perceptions are
assessed according to the following dimensions:
• Job Satisfaction
UUnniivveerrssiittyy ooff PPrreettoorriiaa eettdd –– KKaasssseellmmaann,, RR ((22000066))
University of Pretoria Kasselman, R
(2006)
124
• Leadership
• Relationships and Trust
• Management Style
• Training and Development
• Communication
• Change and Transformation
• HR Policies and Procedures
• Rewards, Recognition and Performance
• Management Diversity
• Values and Culture
Where there are sufficient participants, an industry ranking and comparison is provided. In addition
to being ranked among the total sample, participants are able to be ranked against companies within
their particular industry. The prestige of this award, however, comes from being published as one of
the Top 50 in the annual publication of “Best companies to work for in South Africa” by the Financial
Mail, which is considered a key differentiator for attracting talent.
4.7 Conclusion
This chapter reports on the empirical research results obtained through the surveys, Delphi
workshops and semi-structured interviews, the conclusions drawn from this information, and the
lessons learned. The data was grouped into categories and assigned to support the primary and
secondary objectives of the research.
UUnniivveerrssiittyy ooff PPrreettoorriiaa eettdd –– KKaasssseellmmaann,, RR ((22000066))

University of Pretoria Kasselman, R
(2006)
125
There is a gap between the competence, understanding, interpretation and views between
executives, HR practitioners and auditors (finance practitioners). Linking these disciplines to set a
common ground basis for HR reporting to be taken into consideration in the valuation of businesses
is critical. Reaching this common ground may have very many different paths it can follow, however
this study focuses on increasing the knowledge and skills of HR practitioners to bring their reporting
methods closer to those in the finance discipline.
The researcher acknowledges that the requirement for auditors, especially those who will be
required to audit this type of reporting, will need to include an improved understanding of the HR
discipline, however she does not necessarily believe that those in the finance discipline are required
to have the same level of depth in HR metrics and reporting - this function should rather be included
in the new role for HR. The latter is considered a huge challenge which is demonstrated throughout
the results of the data / information gathered from respondents in this discipline and the next Chapter
provides a framework which will assist in bridging that gap.
Best practices and demands from industry (including Government) drives the focus areas for HR and
could be considered the root cause of the reactive reporting style prevalent. This is also evident from
the discussion focus such as Employment Equity or BEE Charter reporting, which is topical for a
number of reasons. Including this measure as a KPI for executives elevated this metric to the
relevant strategic level which prompted the reporting framework for this metric. A key learning from
this includes the fact that the BEE Charters have been defined and set per industry with industry is
leading the initiative. Does this prove that an industry standard is possible for Human Capital
Reporting?
When probed about the seeming misalignment between HR and business, some comments from
Executives were:
“I value the hard work of HR but I worry that our company may not know which HR issues are the
most strategic ones, versus operational.”
“I know in finance, but I am not sure about HR.”
“HR cannot articulate its perspective with as much precision as finance or even line managers.”
“I wish HR had more to offer here.”
UUnniivveerrssiittyy ooff PPrreettoorriiaa eettdd –– KKaasssseellmmaann,, RR ((22000066))

University of Pretoria Kasselman, R
(2006)
126
These comments clearly shows that HR practitioners need to realise and understand that something
needs to be done - demonstrating the strategic value of HR in understandable business terminology
is crucial.
Chapter 5 will provide a proposed framework for Human Capital reporting which addresses all the
elements identified during this study, linking it to the company bottom line and top line with the
primary objective of providing a framework for external reporting to be included in company reports.
UUnniivveerrssiittyy ooff PPrreettoorriiaa eettdd –– KKaasssseellmmaann,, RR ((22000066))
University of Pretoria Kasselman, R
(2006)
127
CHAPTER 5 PROPOSED FRAMEWORK
“A discovery is said to be an accident meeting a prepared mind.”
- Albert von Szent-Gyorgyi, US biochemist (1893 - 1986)
5.1 Introduction
From the previous chapter and the results of the surveys, it becomes clear that HR reporting is
generally focused and reported on internally. This does not allow stakeholders (especially investors
or shareholders) the ability to view or have insight into the Human Assets (value or risks) or even the
Human Capital employed by the organisation.
This chapter consists of the framework developed by the researcher based on the empirical study.
The chapter is divided into three categories:
1. Framework for the Human Resources function to enable a clear understanding of the components
within Human Resources which affect the Human Capital Asset.
2. Human Capital reporting (internal measures).
3. Metrics to manage the value of Human Assets.
It concludes with proposed principles for reporting Human Capital as part of Company Annual
Reports.
The proposed framework will provide companies and their stakeholders (employees, management,
shareholders, government etc) insight as to the value of the Human Capital and the methods to
manage the Human Resources employed by a specific organisation. Should the framework be
adopted, the information can be trusted by investors and other stakeholders and available for
auditing. The Human Resources function will understand which components of the discipline forms
UUnniivveerrssiittyy ooff PPrreettoorriiaa eettdd –– KKaasssseellmmaann,, RR ((22000066))
University of Pretoria Kasselman, R
(2006)
128
a basis for comparative external reporting on Human Capital Assets. This will also provide HR with a
framework of related value propositions against which measurements can take place and against
which HR development policies, procedures, guidelines and/or initiatives can ultimately be aligned.
5.2 Methodology for the Framework
The researcher used the Enterprise Value Map (EVM) methodology from Deloitte as a basis for the
framework for Human Capital Reporting. This methodology is used to evaluate processes or identify
opportunity improvement levers that positively effect shareholder value (refer Chapter 2).
The framework proposes to look at the following improvement levers for Human Capital
Management:
• Reduction in Total Cost of Employee Interactions.
• Increase in Employee Efficiency.
• Improvement of the Employee’s Impact on Customers.
• Improvement of Employee Performance.
• Improvement of Asset Profitability.
• External Factors that influence the view of stakeholders in their value / perception of the
organisation.
5.3 Framework for HR
Based on the findings and aims, the following components are included in a salient manner in the
framework:
1. Human Resources strategy
UUnniivveerrssiittyy ooff PPrreettoorriiaa eettdd –– KKaasssseellmmaann,, RR ((22000066))

University of Pretoria Kasselman, R
(2006)
129
Reporting on Human Capital begins with an account of the firm’s Human Resources strategy. This
highlights the company’s overall approach to the acquisition, development, management and
performance of Human Capital. The strategy statement outlines the company’s vision for the
contribution of human assets in relation to future opportunities and challenges, and outlines the role
of its HR policies in securing that contribution.
2. Sections on recruitment (acquisition) and retention, learning and development and Human Capital management
This is supported by evidence on how organisations acquire, develop, manage and retain Human
Capital. The evidence that organisations are able to provide and what is appropriate will depend on
the organisations’ individual circumstances. The evidence should be a balance of both quantitative
and qualitative data. Quantitative data in particular can be misunderstood / interpreted, and
therefore adequate explanation is required.
3. Information on performance
The organisation should provide details of the effectiveness and performance of their Human Capital
and Human Capital management policies and practices, using a mix of quantitative and qualitative
data to indicate how well their strategic objectives are being achieved.
4. Information on asset productivity
The organisation should provide details of the productivity and effectiveness of its Human Assets as
well as the technology which enables the accurate accounting of such assets and the improvement
of these assets, using a mix of quantitative and qualitative data to indicate how well the assets are
enabled to increase their productivity.
This will highlight the company’s ability to utilise their investment in technology to increase the
capacity and effectiveness of the employees and highlight the level of automation a company may
have invested in and leverage off. This dimension needs to be future-orientated to ensure that the
value of the contribution of Human Assets to future performance is clear. The trade-off between
UUnniivveerrssiittyy ooff PPrreettoorriiaa eettdd –– KKaasssseellmmaann,, RR ((22000066))

University of Pretoria Kasselman, R
(2006)
130
employing more Human Resources vs. the value (benefit) of deploying technologies is important; not
only from an invested cash perspective, but also from a value generation perspective.
5. Information which may relate to the considerations of the external environment
The impact of the political and social environment on organisations is especially prevalent in South
Africa. Reporting the status of the company’s employment equity policy and achievements as well
as social investments provides an indicator of the organisation’s impact on the South African social
and political policies and the economy of the country.
This is very important for non-profit or government organisations where questions such as “what is
the value of a hospital that saves the lives of thousands of people?” or “what is the value of a
university that educates the new leaders of tomorrow?” cannot be answered by looking purely at the
revenue growth or operating margin, or even the assets of the organisation.
In order to facilitate this, a Human Capital Reporting Framework based on the EVM as described in
Chapter 2 was developed as illustrated below.
5.4 Proposed Framework
Increase Shareholder Value
Revenue GrowthOperating Margin
Reduce Total Cost of Employee Interactions
Assets External Factors
1
Automate Recruiting Process
1
Improve Recruiting Efficiency
2
Improve Recruiting Analytics
3
Reduce Recruiting Costs
1
Automate Compensation and
Benefits Administration
1
Improve Compensation and Benefits Processes
Efficiency 2
Improve Compensation and Benefits Analytics
3
Reduce Compensation and Benefits
Administration Costs 2Adhere to
Government Legislative
requirements
2
Prioritize Social Responsibility
1
Improve Safety Management / Safety Record
4
Union Management
3
Preferred Employer Image
2
Improve Diversity Management Programme
1
Prioritize Employment Equity Targets and Charter
3
HR Programmes
12
Other
13
Improve Transformation
Programme
2
Manage Talent Development and
Succession Planning
1
Increase IT Efficiency
3
Improve Program Management
2
Optimize IT Inventory and
Prioritize
1
HR Technology Assets10
Improve Goal Setting and Mentoring
4
Improve Management
Efficiency
3
Increase Time Available
2
Improve Competency Management
1
Improve Information Accessibility
1
Improve Employee Promotability
2
Improve Employee Satisfaction
3
Improve Incentive Compensation
4
Improve Knowledge Management
5
Accelerate Product-to-Market Time
3
Improve Corporate Communication
2
Develop Communities of
Practice
1
Customize Learning and Development
2
Design, Develop and Produce New Products and
Services
1
Evaluate and Optimise
Outsourcing and Shared Services
5
Provide Self Service Capabilities
4
Automate Administrative
Processes
3
Improve Financial and Business Data
2
Improve Forecasting and Planning
Analytics
1
Improve Performance
Analytics
3
Improve Performance
Processes Efficiency
2
Automate Performance
Management Cycle
1
Improve Learning and Training
Analytics
3
Improve Learning and Training Efficiency
2
Automate Learning and Training
Processes
1
Reduce Learning and Training Costs
3
Reduce Performance Management Costs
4Improve Execution
5Broaden Collaboration
and Support7
Improve Employee Retention
8
Improve Employee Effectiveness 9
People Assets11
Improve Stakeholder Relationships
6
Improve Asset Productivity
5Improve Employee Performance
4
Increase Employee Impact on Customer
3
Improve Planning
6
Increase Efficiency2
Manage Employee Relations
5
Figure 27: Proposed Framework
The framework is based on the principles of accounting as specified in GAAP (refer to Chapter 2)
and consists of the following components (please refer to the full framework print included in cover of report):
• Reduce Operating Margins – Lower transaction costs and increase knowledge dissemination.
UUnniivveerrssiittyy ooff PPrreettoorriiaa eettdd –– KKaasssseellmmaann,, RR ((22000066))

University of Pretoria Kasselman, R
(2006)
131
• Increase Revenue – Leveraging increased employee satisfaction and improved performance
management.
• Improve Asset Productivity – Optimal alignment and management of Human Capital resources
including enabling technology.
• Improve Stakeholder Relationship - Investment in social responsibility programmes and
adherence to legislation.
Under each of these categories a distinct section on management and leadership is required.
Information on Human Capital utilisation for this category of employees, with the greatest scope to
affect the strategic performance of the organisation, will often be most readily available in
organisations. It also has particular value to financial analysts and investors, as evidenced by the
fact that the remuneration of company directors is already an important component of annual
reports.
To read the model (large copy included in cover pocket of dissertation), the following approach
should be taken:
Top-Down/Bottom-up
The brown boxes (value drivers) marked A 1 - 4, are the metrics by which shareholders, analysts,
and potential investors assess company performance - in absolute terms and relative to that of
competitors. The four main value drivers of shareholder value are Revenue Growth (A1), Operating
Margin (A2), Asset Efficiency (A3), and Expectations (A4). Starting at the top level and tracking
downward, the successive layers of the model help answer the question, “How can we improve
this?” The colour-coded items in the lower section of the model are specific actions you can take and
have been linked to the HR strategic themes. Reading bottom to top, you can reverse the process
and answer the question, “Why are we improving this?”
Left to Right
UUnniivveerrssiittyy ooff PPrreettoorriiaa eettdd –– KKaasssseellmmaann,, RR ((22000066))

University of Pretoria Kasselman, R
(2006)
132
The left side of the model, including the Revenue Growth and Operating Margin sections, represents
the Income Statement portion of the model. These two sections combine to describe current
operational performance. The Asset Efficiency section is a subset of the Balance Sheet, showing
how efficiently assets are utilised in delivering operational performance. The External Factors
section addresses factors that influence future Income Statement and Balance Sheet performance,
and focuses on factors that influence shareholder confidence in the organisation and its leadership.
White Boxes - Improvement Levers
The first level of white boxes (B 1-6) defines actions organisations can take to improve revenue,
operating margin, asset efficiency, and forward-looking performance. The next level (C 1-13)
defines those areas on which the activities for improvement for maximum value may be focused on.
Colour coded text
The text within the blocks described above is colour coded to highlight the link to the HR themes.
• Improve Employee Productivity.
• Develop a Continuous Performance Culture.
• Strengthen Knowledge Sharing and Learning.
• Elevate People Management to a Strategic Level.
• Increase Value to Customers through Employees.
UUnniivveerrssiittyy ooff PPrreettoorriiaa eettdd –– KKaasssseellmmaann,, RR ((22000066))

University of Pretoria Kasselman, R
(2006)
133
5.4.1 Operating Margin (A1)
Operating Margin
Reduce Total Cost of Employee Interactions 1
Automate Recruiting Process
1
Improve Recruiting Efficiency
2
Improve Recruiting Analytics
3
Reduce Recruiting Costs
1
Automate Compensation and
Benefits Administration
1
Improve Compensation and Benefits Processes
Efficiency 2
Improve Compensation and Benefits Analytics
3
Reduce Compensation and Benefits
Administration Costs 2
Evaluate and Optimise
Outsourcing and Shared Services
5
Provide Self Service Capabilities
4
Automate Administrative
Processes
3
Improve Financial and Business Data
2
Improve Forecasting and Planning
Analytics
1
Improve Performance
Analytics
3
Improve Performance
Processes Efficiency
2
Automate Performance
Management Cycle
1
Improve Learning and Training
Analytics
3
Improve Learning and Training
Efficiency
2
Automate Learning and Training
Processes
1
Reduce Learning and Training Costs
3
Reduce Performance Management Costs
4Improve Execution
5
Increase Efficiency
2
Figure 28: Operating Margin
There are two main factors that influence the operating margin:
• Reducing costs (B1) - Total cost of employee’s interactions.
• Increasing efficiency (B2) - through improvement of execution capabilities.
5.4.1.1 Reduce total cost of employee interactions (B1)
This area refers to ways in which Human Resource Management can reduce the costs of employee
interactions to reduce the costs of the programmes for which they are responsible that directly
impact the employee. Costs present a negative (-) effect on the Income Statement and thus the
control of this is very important.
These include areas where HR is able to influence and control the costs directly:
• Reducing Recruitment costs (C1).
• Reducing HR administration costs (C2) - compensation and benefits administration.
UUnniivveerrssiittyy ooff PPrreettoorriiaa eettdd –– KKaasssseellmmaann,, RR ((22000066))

University of Pretoria Kasselman, R
(2006)
134
• Reducing Learning / Training costs (C3).
• Reducing Performance Management costs (C4).
This management of costs is predominantly focused on the administration side and a balance
between this focus and the value which may be extracted by applying HR initiatives needs to be
maintained. An example of such a balance for consideration is in training and development. A study
by Bassi Investments (Phillips, 2005) where the results shows that portfolio firms that made
unusually large investments in employee education, training and development outperformed the
S&P 500 by a factor of two (113% versus 55%). This may encourage an increase in the cost for
Learning / Training and the reduction in cost focused purely on the administration of the function.
Using metrics such as training ROI can help to ensure time, effort, focus and funds are spent on the
right programmes that indeed deliver the increase in value for the organisation.
5.4.1.2 Increase efficiency (B2)
This area refers to increasing efficiency of the Human Resources function to provide the services
and expertise to add value to the Human Capital of the organisation.
This includes:
• Improvement of Execution (C5) - of HR programmes.
These programmes need to be monitored and tested for Return on Investment (ROI) to ensure value
is not destroyed, but added.
UUnniivveerrssiittyy ooff PPrreettoorriiaa eettdd –– KKaasssseellmmaann,, RR ((22000066))

University of Pretoria Kasselman, R
(2006)
135
5.4.2 Revenue Growth (A2)
Revenue Growth
Improve Goal Setting and Mentoring
4
Improve Management
Efficiency
3
Increase Time Available
2
Improve Competency Management
1
Improve Information Accessibility
1
Improve Employee Promotability
2
Improve Employee Satisfaction
3
Improve Incentive Compensation
4
Improve Knowledge Management
5
Accelerate Product-to-Market Time
3
Improve Corporate Communication
2
Develop Communities of
Practice
1
Customize Learning and Development
2
Design, Develop and Produce New Products and
Services
1
Broaden Collaboration and Support
7Improve Employee
Retention8
Improve Employee Effectiveness
9
Improve Employee Performance
4
Increase Employee Impact on Customer
3
Improve Planning
6
Manage Employee Relations
5
Figure 29: Revenue Growth
There are two main factors that influence revenue growth:
• Customers (B3) - increasing the positive impact that employees have on customers.
• Employee performance (B4) - improvement of the effectiveness and efficiency of the employee.
5.4.2.1 Increase employee’s impact on customer
In order to maintain a positive impact on customers and the interaction of the organisation’s
employees with customers, planning to increase the services and products that are offered and the
“customisation” of such services and products as well as the training of employees in these products
and services, needs to be addressed. The time to market of such products is crucial for revenue
growth and ensuring that the relationship with customers is maintained, and customer loyalty build
even more so.
The impact of employee satisfaction, loyalty, and productivity is linked to customer satisfaction and
growth of customer loyalty (Heskett, Sasser & Schlesinger, 1994). The service-profit chain clarifies
the links between the following:
UUnniivveerrssiittyy ooff PPrreettoorriiaa eettdd –– KKaasssseellmmaann,, RR ((22000066))

University of Pretoria Kasselman, R
(2006)
136
Employee Satisfaction
Customer Loyalty
Profitability and Growth
Employee Loyalty
Employee Productivity
ValueCustomer Satisfaction
Internal Quality
Employee Satisfaction
Customer Loyalty
Profitability and Growth
Employee Loyalty
Employee Productivity
ValueCustomer Satisfaction
Internal Quality
Figure 30: Service Profit Chain – adapted from Heskett et al., (1994)
A study by Watson Wyatt (2004), Communication ROI Study™, demonstrated that there is a
correlation between communication effectiveness, organisational turnover and financial
performance. Some of the findings include evidence that:
• Companies that communicate effectively have a 19.4% higher market premium than companies
that do not.
• Shareholder returns for organisations with the most effective communication were over 57%
higher over the last five years (2000-2004) than returns for firms with less effective
communication.
Based on the above, this dimension includes:
• Improve planning (C4).
• Broaden collaboration and support (C5).
UUnniivveerrssiittyy ooff PPrreettoorriiaa eettdd –– KKaasssseellmmaann,, RR ((22000066))

University of Pretoria Kasselman, R
(2006)
137
5.4.2.2 Improve employee performance (B4)
This area refers to the improvement of employee effectiveness. Retaining effective employees has a
direct impact on both the operating margin and revenue growth. As the improvement and
management of the efficiency of employees has been categorised to be influenced predominantly by
the Human Resources function, the direct effectiveness of employees will have a larger impact on
revenue growth than on the operating margin. This category is placed under the improvement of
employee performance with the retention of employees which includes:
• Improve employee retention (C8).
• Improve employee effectiveness (C9).
Assets
Figure 31: Assets
UUnniivveerrssiittyy ooff PPrreettoorriiaa eettdd –– KKaasssseellmmaann,, RR ((22000066))
University of Pretoria Kasselman, R
(2006)
138
There is only one main factor that influences the assets value of an organisation:
• Improving asset productivity (B5).
Assets are depreciated over time, however Human Capital and intangibles are amortised due to their
increase in value.
5.4.2.3 Improve asset productivity (B5)
In order to improve the productivity of your HR assets, an organisation may focus on two aspects:
• Technology Assets (C10).
• People Assets (C11).
5.4.2.4 Technology Assets (C10)
HR technology, for example online benefits enrolment, retirement planning, compensation and
pension administration, Employee / Manager self-service tools, e-recruiting tools, etc., can play a
huge role in helping HR play a more value added strategic role. This technology must be
implemented with the fundamentals in mind—improving accuracy, service, and cost-effectiveness to
pay off in higher shareholder value. However, care must be taken to not implement the technology
for the sake of it and to drive the value extraction from the technology - something which HR may not
be skilled in yet.
As this technology is used to enable the HR efficiency and effectiveness, the cost of the technology
is traded off against the reduction in Human Resources and the costs related to the latter. Taking
this into consideration, the value generated from this method contributes to the value of the Human
Resources function only.
UUnniivveerrssiittyy ooff PPrreettoorriiaa eettdd –– KKaasssseellmmaann,, RR ((22000066))
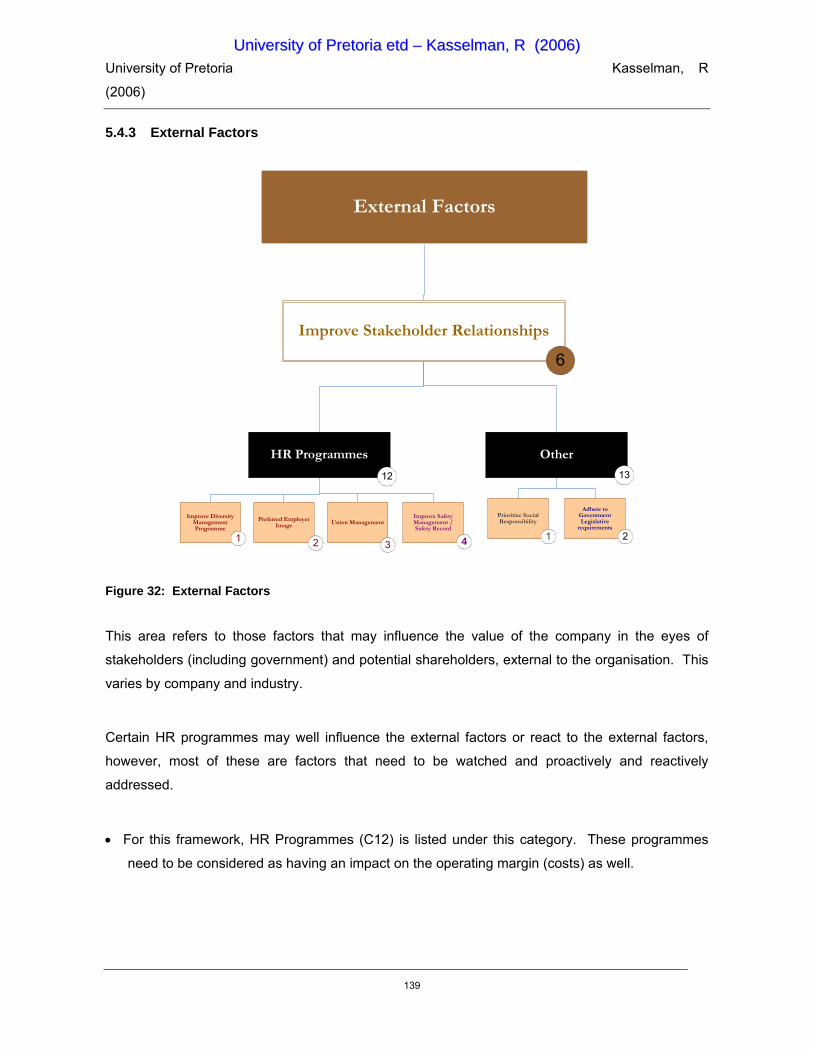
University of Pretoria Kasselman, R
(2006)
139
5.4.3 External Factors
External Factors
Adhere to Government Legislative
requirements
2
Prioritize Social Responsibility
1
Improve Safety Management / Safety Record
4
Union Management
3
Preferred Employer Image
2
Improve Diversity Management Programme
1
HR Programmes
12
Other
13
Improve Stakeholder Relationships
6
Figure 32: External Factors
This area refers to those factors that may influence the value of the company in the eyes of
stakeholders (including government) and potential shareholders, external to the organisation. This
varies by company and industry.
Certain HR programmes may well influence the external factors or react to the external factors,
however, most of these are factors that need to be watched and proactively and reactively
addressed.
• For this framework, HR Programmes (C12) is listed under this category. These programmes
need to be considered as having an impact on the operating margin (costs) as well.
UUnniivveerrssiittyy ooff PPrreettoorriiaa eettdd –– KKaasssseellmmaann,, RR ((22000066))
University of Pretoria Kasselman, R
(2006)
140
• A category for Other (C13) is listed for consideration that needs to be given to market and external
environment factors. These considerations are specific to the organisation and/or industry and
cannot be listed in the model, but rather need to be identified by those using the model.
5.5 Using the Framework
To use the framework effectively, an understanding of the levers and what can be done is required.
Actions You Can Take
To address the Improvement Levers, there are two basic categories of actions you can take:
Change What You Do (Change your strategy / Refocus your resources)
To maximise shareholder value, companies need to focus on activities that provide the best possible
return on the resources they utilise. Focusing and refocusing can happen at many levels - from
reducing costs spent on impact areas, to the discontinuation or outsourcing of services with little
value add, to a diminished focus on lower-value employees. The first horizontal band of
colour-coded actions addresses actions that can be taken from a strategy and focus viewpoint to
improve the value of Human Assets in the organisation.
Do What You Do Better (Improve your execution)
There are two paths to better business process execution: improve the business processes
themselves, and raise the efficiency and effectiveness of the people and technologies executing and
managing the processes. Improving the performance of people and technologies means improving
their respective capabilities, productivities and capacities.
The high interdependency of value drivers requires careful consideration of initiatives undertaken to
improve a value driver. This will almost always have an impact on another value driver. The
challenge is to recognise and account for these effects and balance the trade-offs in ways that align
with the company’s direction and priorities.
UUnniivveerrssiittyy ooff PPrreettoorriiaa eettdd –– KKaasssseellmmaann,, RR ((22000066))

University of Pretoria Kasselman, R
(2006)
141
CHAPTER 6 - PROPOSED HUMAN CAPITAL REPORTING (business questions)
“With regard to excellence, it is not enough to know, but we must try to have and use it. “
- Aristotle (384 BC - 322 BC)
6.1 Introduction
The reporting offered by Human Resources management has evolved during the last few years as
Human Capital has become more and more of a competitive advantage to organisations. In the
Industrial Age, machinery was considered the key asset for an organisation; in the computer age,
having further evolved, computing power was of utmost strategic value. In the new millennium,
organisations started to realise that the value of knowledge management and Intellectual Capital far
outweighs any machinery or equipment assets, and the many knowledge intensive companies such
as Microsoft, Oracle, SAP and other consulting firms, as well as companies, are very focused and
dependant on R&D and innovation. Human Assets may be seen as a company’s greatest asset.
This requires HR, as the “custodian” of the information relating to the Human Capital in an
organisation, to develop their skills in providing companies with intellectual, analytical analyses of its
workforce and the strategic value of its Human Assets, enabled by the computer technology of the
previous age.
There are three (3) levels of reporting for HR:
1. Efficiency Reports - reports addressed predominantly through metrics and benchmarking the
efficiency or effectiveness of the HR function.
2. Data Analytics - reports which address those aspects of the line function concerned with the
management of the workforce.
UUnniivveerrssiittyy ooff PPrreettoorriiaa eettdd –– KKaasssseellmmaann,, RR ((22000066))
University of Pretoria Kasselman, R
(2006)
142
3. Company Reporting (value adding, strategic) - reports which address specific business issues,
or potential problems the business may need to address, from a Human Resources perspective; i.e.
where Human Capital is applied to extract value for the business.
Using technology needs to enable HR to elevate their reporting to a strategic level; however, the
journey will need to start by having an understanding of the value which can be added by the HR
function to increase the Human Assets of an organisation.
To understand the elements of the tactics which are required to elevate the Human Resources
Function to a strategic level, understanding of what HR strategy really means in required. Paul
Kearnes stated that “HR strategy, like a military or any other strategy, is also not about individual
battles, it is rather the thread that ensures all individual battles are making a contribution to the
overall common cause; the winning of the war” (Kearns, 2003:7). It is important for the strategy to
provide clear guidance, and more important for the HR function to have the tactics ready to ensure
that the strategy is executed and aligned with the business strategy. In order to do that, many
different tactics may be deployed - the key question is which really adds value to the organisation
and are there any that detract value. To be able to answer this in terms that businesses can
understand, HR needs to be able to use quantifying measures, supported by the qualitative
measures they are so good at.
In a study done by researchers at Cornell (Boudreau, 1998) the perceptions of line executives and
HR executives regarding HR effectiveness was compared. In every category across the board, line
executives rated HR effectiveness less highly than HR executives themselves did. The study also
examined how HR’s effectiveness in different roles was perceived. Again, the line executives rated
HR less highly in every category. Both groups agreed that HR fulfilled its HR services role best and
its “change consulting” role least effectively.
The Cornell researchers looked at how the two groups valued HR’s overall contribution to the
success of the firm. The HR executives gave themselves significantly higher ratings than the line
executives (Boudreau, 1998).
UUnniivveerrssiittyy ooff PPrreettoorriiaa eettdd –– KKaasssseellmmaann,, RR ((22000066))
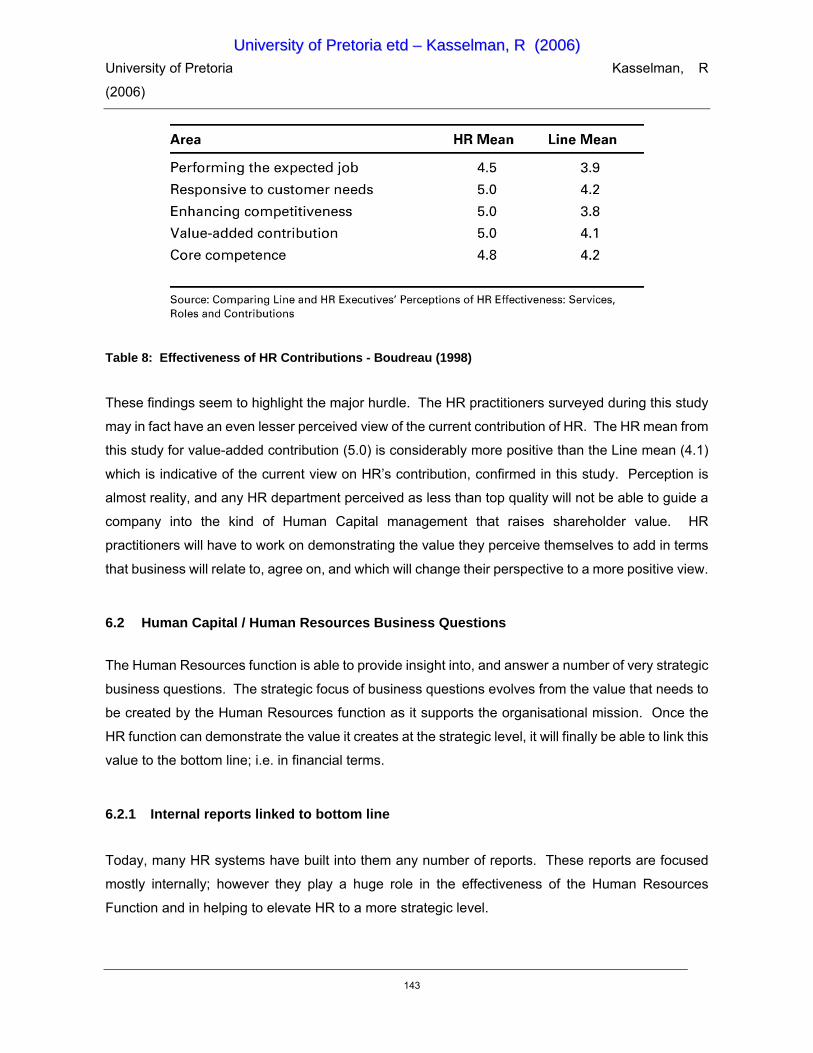
University of Pretoria Kasselman, R
(2006)
143
Table 8: Effectiveness of HR Contributions - Boudreau (1998)
These findings seem to highlight the major hurdle. The HR practitioners surveyed during this study
may in fact have an even lesser perceived view of the current contribution of HR. The HR mean from
this study for value-added contribution (5.0) is considerably more positive than the Line mean (4.1)
which is indicative of the current view on HR’s contribution, confirmed in this study. Perception is
almost reality, and any HR department perceived as less than top quality will not be able to guide a
company into the kind of Human Capital management that raises shareholder value. HR
practitioners will have to work on demonstrating the value they perceive themselves to add in terms
that business will relate to, agree on, and which will change their perspective to a more positive view.
6.2 Human Capital / Human Resources Business Questions
The Human Resources function is able to provide insight into, and answer a number of very strategic
business questions. The strategic focus of business questions evolves from the value that needs to
be created by the Human Resources function as it supports the organisational mission. Once the
HR function can demonstrate the value it creates at the strategic level, it will finally be able to link this
value to the bottom line; i.e. in financial terms.
6.2.1 Internal reports linked to bottom line
Today, many HR systems have built into them any number of reports. These reports are focused
mostly internally; however they play a huge role in the effectiveness of the Human Resources
Function and in helping to elevate HR to a more strategic level.
UUnniivveerrssiittyy ooff PPrreettoorriiaa eettdd –– KKaasssseellmmaann,, RR ((22000066))
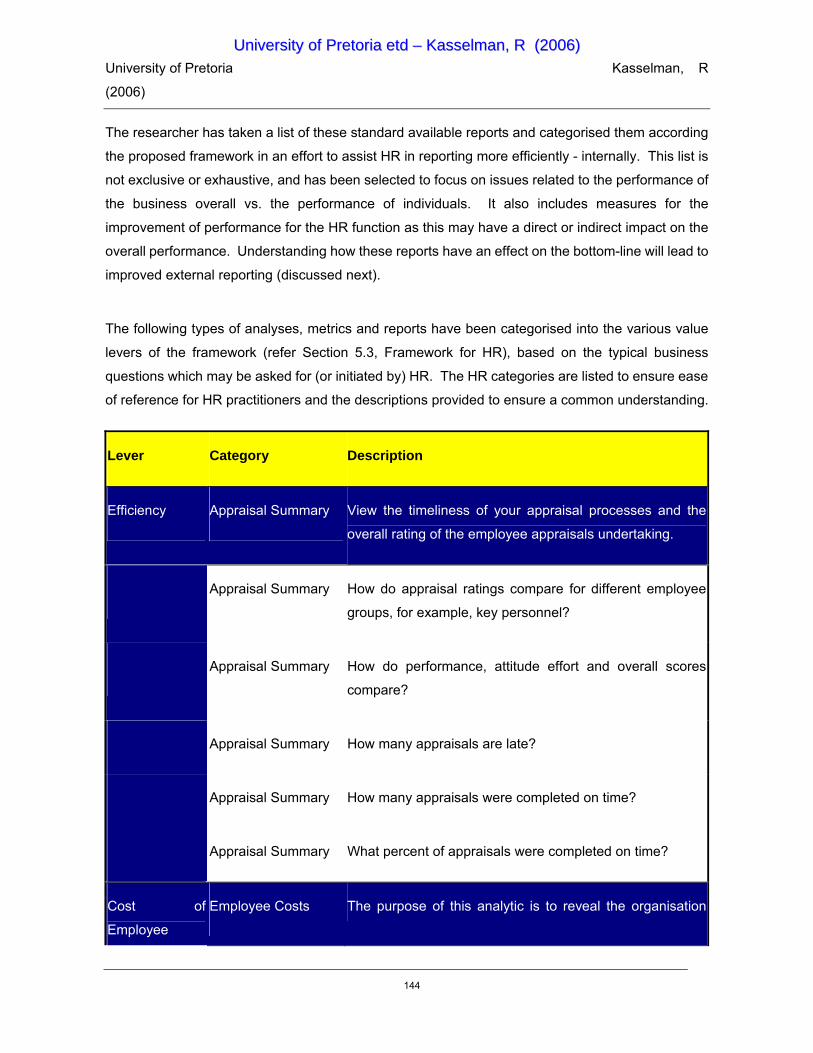
University of Pretoria Kasselman, R
(2006)
144
The researcher has taken a list of these standard available reports and categorised them according
the proposed framework in an effort to assist HR in reporting more efficiently - internally. This list is
not exclusive or exhaustive, and has been selected to focus on issues related to the performance of
the business overall vs. the performance of individuals. It also includes measures for the
improvement of performance for the HR function as this may have a direct or indirect impact on the
overall performance. Understanding how these reports have an effect on the bottom-line will lead to
improved external reporting (discussed next).
The following types of analyses, metrics and reports have been categorised into the various value
levers of the framework (refer Section 5.3, Framework for HR), based on the typical business
questions which may be asked for (or initiated by) HR. The HR categories are listed to ensure ease
of reference for HR practitioners and the descriptions provided to ensure a common understanding.
Lever Category Description
Efficiency Appraisal Summary View the timeliness of your appraisal processes and the
overall rating of the employee appraisals undertaking.
Appraisal Summary How do appraisal ratings compare for different employee
groups, for example, key personnel?
Appraisal Summary How do performance, attitude effort and overall scores
compare?
Appraisal Summary How many appraisals are late?
Appraisal Summary How many appraisals were completed on time?
Appraisal Summary What percent of appraisals were completed on time?
Cost of
Employee
Employee Costs The purpose of this analytic is to reveal the organisation
UUnniivveerrssiittyy ooff PPrreettoorriiaa eettdd –– KKaasssseellmmaann,, RR ((22000066))

University of Pretoria Kasselman, R
(2006)
145
Lever Category Description
Interactions wide employment costs for the current and previous year.
Employee Costs How has my employment costs changed over time?
Employee Costs What are my employment costs for the organisation or part
of the organisation?
Employee Costs What is the breakdown of my employment costs?
Cost of
Employee
Interactions
Employee Lifecycle Evaluate the employment life cycle of a typical employee
within the organisation and how this has changed period on
period.
Employee Lifecycle On average, how long do employees remain in the
organisation?
Employee Lifecycle On average how long does it take to hire an employee?
Employee Lifecycle On average, how many job roles do employees have during
their employment with the organisation?
Employee Lifecycle On average, how much of the notice period do employees
work prior to leaving?
Employee Lifecycle On average, what is the notice period of employees?
Cost of
Employee
Interactions
Headcount Summary This analytic enables you to view the headcount status of
the organisation in terms of number of employees and the
associated full time equivalents (FTE)
UUnniivveerrssiittyy ooff PPrreettoorriiaa eettdd –– KKaasssseellmmaann,, RR ((22000066))

University of Pretoria Kasselman, R
(2006)
146
Lever Category Description
Headcount Summary How many positions are vacant?
Headcount Summary What is the employee headcount in terms of full time
equivalents (FTE)?
Headcount Summary What is the employee headcount within the organisation?
Headcount Summary What is the percent breakdown of headcount?
Headcount Summary What is the trend of my headcount, period on period?
Efficiency HR Departmental
Costs
This analytic lets you understand how much the Human
Resources function costs in total and by function.
HR Departmental
Costs
How does the cost of running the HR function compare to
last year / budget?
HR Departmental
Costs
What is my departmental HR spending against budget (by
spend type)?
HR Departmental
Costs
What is the cost of running the HR function?
HR Departmental
Costs
What is the cost of the recruiting or compensation and
benefits or training and education functions and how does
this compare against last year / budget?
HR Departmental What is the global cost of running a particular HR function?
UUnniivveerrssiittyy ooff PPrreettoorriiaa eettdd –– KKaasssseellmmaann,, RR ((22000066))
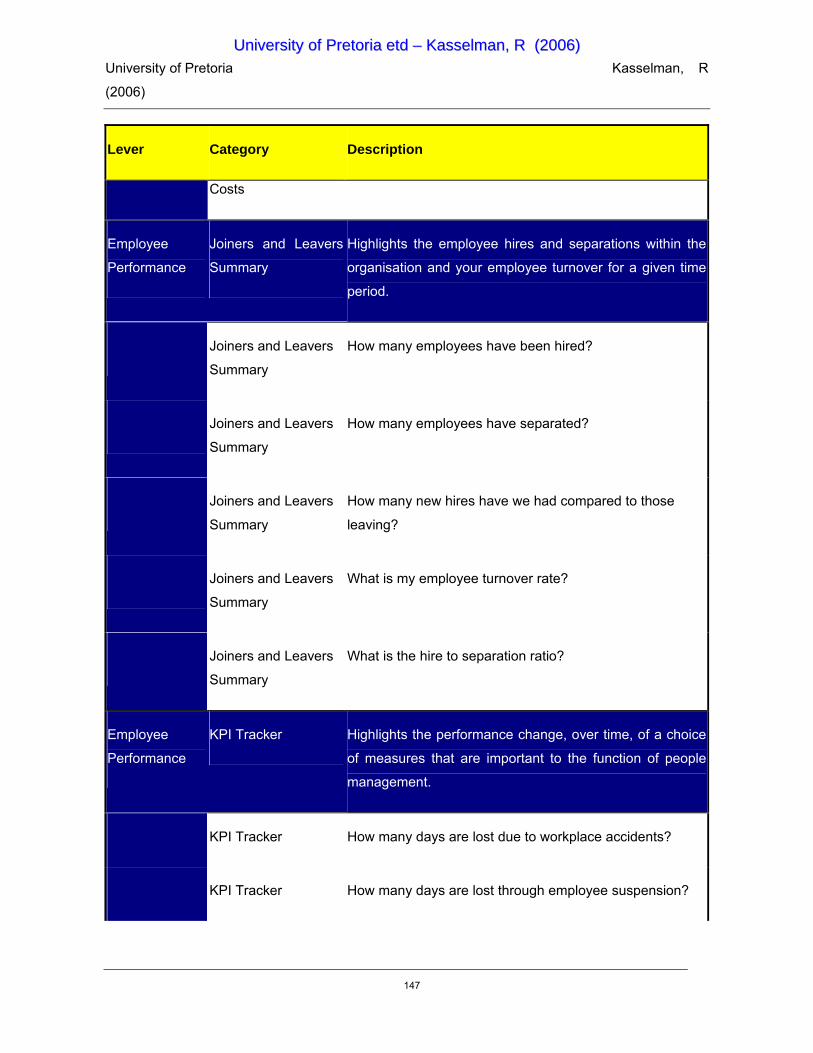
University of Pretoria Kasselman, R
(2006)
147
Lever Category Description
Costs
Employee
Performance
Joiners and Leavers
Summary
Highlights the employee hires and separations within the
organisation and your employee turnover for a given time
period.
Joiners and Leavers
Summary
How many employees have been hired?
Joiners and Leavers
Summary
How many employees have separated?
Joiners and Leavers
Summary
How many new hires have we had compared to those
leaving?
Joiners and Leavers
Summary
What is my employee turnover rate?
Joiners and Leavers
Summary
What is the hire to separation ratio?
Employee
Performance
KPI Tracker Highlights the performance change, over time, of a choice
of measures that are important to the function of people
management.
KPI Tracker How many days are lost due to workplace accidents?
KPI Tracker How many days are lost through employee suspension?
UUnniivveerrssiittyy ooff PPrreettoorriiaa eettdd –– KKaasssseellmmaann,, RR ((22000066))

University of Pretoria Kasselman, R
(2006)
148
Lever Category Description
KPI Tracker How many days are lost through sickness?
KPI Tracker What is the number of days with employees on maternity
leave?
KPI Tracker What is the total number of training days?
Employee
Performance
Satisfaction Survey Monitor the level of job satisfaction experienced by your
workforce and compare period on period - comparing
improvements or issues that require improvement
Satisfaction Survey Has the satisfaction rating improved since last conducted?
Satisfaction Survey What is the response rate to the survey?
Satisfaction Survey What number/percent of my employees are satisfied?
People Assets Separation Analysis Analyze by period, the employee separation and turnover
rate by location, organisation, function etc.
Separation Analysis How many employees have separated?
Separation Analysis What is my employee turnover rate?
Separation Analysis What is the percent of my key employees leaving?
Separation Analysis What is the ratio of voluntary to involuntary separation?
UUnniivveerrssiittyy ooff PPrreettoorriiaa eettdd –– KKaasssseellmmaann,, RR ((22000066))

University of Pretoria Kasselman, R
(2006)
149
Lever Category Description
People Assets Skill Gap The purpose of this analytic is to provide a high level view of
the skill gap or skill shortage within the workforce, matching
the employees’ skill against the skill requirement for the job
role
Skill Gap How many employees within the organisation have skill
gaps?
Skill Gap What percent of employees have skill gaps?
Skill Gap Which department within the organisation has the highest
skill gap?
Efficiency Skill Gap Trend The purpose of this analytic is to give you a high level view
of the skill gap or skill shortage within your workforce, and
how this has changed over time
Skill Gap Trend How many employees within the organisation have skill
gaps?
Skill Gap Trend How many employees have skill gaps compared to a
previous period?
Skill Gap Trend What percent of employees have skill gaps?
Skill Gap Trend What is the percent change in the overall skill gap?
Skill Gap Trend Which department has improved the least in terms of
UUnniivveerrssiittyy ooff PPrreettoorriiaa eettdd –– KKaasssseellmmaann,, RR ((22000066))

University of Pretoria Kasselman, R
(2006)
150
Lever Category Description
reducing the skill gap?
Skill Gap Trend Which department has improved the most in terms of
reducing the skill gap?
Cost of
Employee
Interactions
Training Summary This analytic gives you a high level summary of the time and
costs invested in training and developing your employees,
comparing period on period.
Training Summary How many employees have received training?
Training Summary What are the total training costs?
Training Summary What is the average number of training days per employee?
Training Summary What is the average training cost per employee?
Training Summary What is the course attendance rate?
Training Summary What is the overall employee rating of the training courses?
Asset
Productivity
Employee Distribution This analytic allows you to view your workforce by
demographics for improved planning
Age Distribution How is the age for the current employees distributed?
Age Distribution Is there a connection between age and gender within the
organisation?
UUnniivveerrssiittyy ooff PPrreettoorriiaa eettdd –– KKaasssseellmmaann,, RR ((22000066))

University of Pretoria Kasselman, R
(2006)
151
Lever Category Description
Headcount by Ethnic
Origin
How is each ethnic origin distributed in the organisation?
Headcount by Ethnic
Origin
What are the different employee nationalities in the
organisation?
Headcount by Ethnic
Origin
What is the percentage of each nationality and ethnic
group?
Headcount Listing What are these individual employees’ job details?
Headcount Listing What are these individual employees’ personal details?
Headcount Listing Who are the current employees in the organisation?
Asset
Productivity
Hire Analysis Details of all employees hired into the organisation over a
specified time period.
Hire Analysis How many of the new hires are from each country?
Hire Analysis How many of the new hires are in each part of the
organisation?
Hire Analysis How many of the new hires are male and female?
Hire Analysis How many of the new hires fall into each of the age
bandings?
UUnniivveerrssiittyy ooff PPrreettoorriiaa eettdd –– KKaasssseellmmaann,, RR ((22000066))

University of Pretoria Kasselman, R
(2006)
152
Lever Category Description
Hire Analysis How many of the new hires fall into each of the previous
experience bandings?
Hire Analysis How many of the new hires have the same hiring source?
Hire Analysis What are the yearly figures for employees that have been
hired?
Hire Analysis What are these individual employees’ personal details?
Hire Analysis What is their previous experience?
Hire Analysis Who has been hired recently?
Hire Analysis Which part of the organisation have they been hired into?
Employee
Performance
Length of Service
Distribution
Analyse how length of service is distributed within the
organisation by gender / ethnic origin etc. including the
costs and impact of turnover
Length of Service
Distribution
How is the length of service for the current employees
distributed?
Length of Service
Distribution
Is there a connection between gender and length of service
within the organisation?
Recent Hire
Separation Analysis
View the number of employees that have been recently
hired but are now separated.
UUnniivveerrssiittyy ooff PPrreettoorriiaa eettdd –– KKaasssseellmmaann,, RR ((22000066))

University of Pretoria Kasselman, R
(2006)
153
Lever Category Description
Recent Hire
Separation Analysis
How many of recent hires are now leavers that fall into each
of the previous experience bandings?
Recent Hire
Separation Analysis
How many of these leavers have the same departure
decision? Are from the same department / function?
Recent Hire
Separation Analysis
What are the yearly figures for employees that have been
recently hired and then left?
Recent Hire
Separation Listing
What are the job details of each individual leaver?
Recent Hire
Separation Listing
What is the listing of employees that have been recently
hired and then left?
Separation Analysis How many of these leavers have the same departure
decision? Are from the same department / function?
Separation Analysis What is the yearly turnover rate?
Separation Listing How many employees have left voluntarily?
Non-voluntarily?
Employee
Performance
Benefit Optimisation The purpose of this analytic is to enable you to either
reduce costs or increase the value to employees (or a
combination of both) by altering your benefits provision
Benefit Optimisation How do my employee benefits compare across tax
UUnniivveerrssiittyy ooff PPrreettoorriiaa eettdd –– KKaasssseellmmaann,, RR ((22000066))

University of Pretoria Kasselman, R
(2006)
154
Lever Category Description
brackets?
Benefit Optimisation How effective are my employee benefits packages?
Benefit Optimisation How much money could I save if I discontinue a particular
employee benefit?
Benefit Optimisation How much money could I save if I extend a particular
employee benefit?
Benefit Optimisation What is the take up of my employee benefits?
Benefit Optimisation Which employee benefits should I discontinue?
Benefit Optimisation Which employee benefits should I extend?
Efficiency Benefit Subscription Analyse the take up of benefits by tax bracket to determine
whether any are potentially discontinuable.
Benefit Subscription What is the take up of employee benefits? Which should be
continued, discontinued?
People Assets Headcount Trend View the current workforce and trends relating to the
employment status of the organisation including joiners and
leavers
Headcount Trend What is the employee headcount in terms of full time
equivalents (FTE)?
UUnniivveerrssiittyy ooff PPrreettoorriiaa eettdd –– KKaasssseellmmaann,, RR ((22000066))
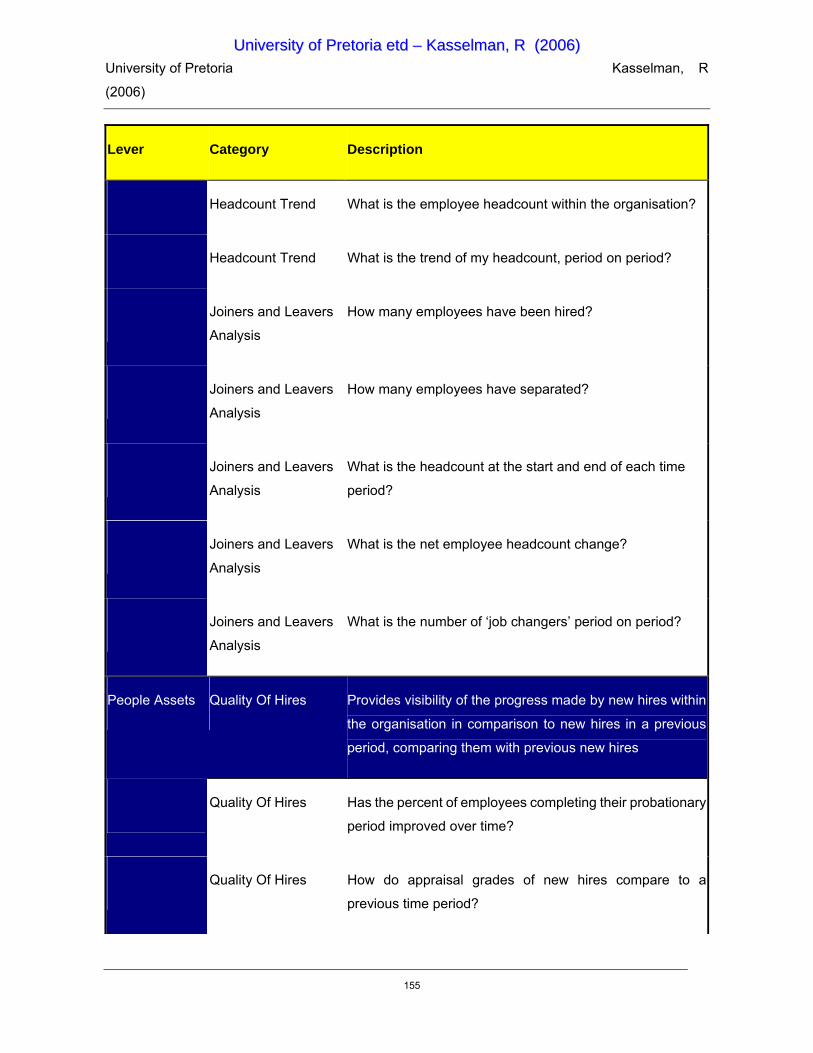
University of Pretoria Kasselman, R
(2006)
155
Lever Category Description
Headcount Trend What is the employee headcount within the organisation?
Headcount Trend What is the trend of my headcount, period on period?
Joiners and Leavers
Analysis
How many employees have been hired?
Joiners and Leavers
Analysis
How many employees have separated?
Joiners and Leavers
Analysis
What is the headcount at the start and end of each time
period?
Joiners and Leavers
Analysis
What is the net employee headcount change?
Joiners and Leavers
Analysis
What is the number of ‘job changers’ period on period?
People Assets Quality Of Hires Provides visibility of the progress made by new hires within
the organisation in comparison to new hires in a previous
period, comparing them with previous new hires
Quality Of Hires Has the percent of employees completing their probationary
period improved over time?
Quality Of Hires How do appraisal grades of new hires compare to a
previous time period?
UUnniivveerrssiittyy ooff PPrreettoorriiaa eettdd –– KKaasssseellmmaann,, RR ((22000066))

University of Pretoria Kasselman, R
(2006)
156
Lever Category Description
Quality Of Hires How does my retention rate of new hires compare to a
previous time period?
Quality Of Hires How many employees have been hired?
Quality Of Hires How many employees have successfully completed their
probationary period?
Quality Of Hires How many employees remain employed a year from their
hire date?
Quality Of Hires What is the uptake of training by new hires compared to a
previous period?
Employee
Retention
Remuneration Index This analytic enables you to compare your total
remuneration as well as the compensation and benefits
components, against the industry.
Remuneration Index How does the job role remuneration compare to the
industry?
Remuneration Index How well do we remunerate key employees / positions?
Remuneration Index What are the components of remuneration and how do they
compare to each other and the industry by job role?
Remuneration Index What is the spread of remuneration by job role?
UUnniivveerrssiittyy ooff PPrreettoorriiaa eettdd –– KKaasssseellmmaann,, RR ((22000066))

University of Pretoria Kasselman, R
(2006)
157
Lever Category Description
Employee
Effectiveness
Employee Scoring Rank employees within the organisation based on different
scoring methodologies (Job performance, Aptitude,
Appraisal, Experience, Attendance, Discipline), combined
to produce an overall score per employee
Employee Scoring 1) Job Performance - the latest employee job score within
their current position multiplied by 100.
Employee Scoring 2) Aptitude - the latest employee aptitude score is the
composite score based on the following 4 skills multiplied
by 100: flexibility, initiative, self-motivation and teamwork.
Employee Scoring 3) Appraisal - the latest employee appraisal rating multiplied
by 100. For those employees who have not yet had an
appraisal an imputed figure is used based on the average of
the selected organisation node.
Employee Scoring 4) Experience - is calculated on the current job position: 75
for less than 2 years service, 100 for 2-4 years, 125 for 4-6
years and 125 for more than 6 years experience.
Employee Scoring 5) Attendance - is calculated by multiplying the number of
sickness occurrences over the last 24 months by -5.
Employee Scoring 6) Discipline - is calculated by multiplying the discipline
score over the last 24 months by -20. The discipline score
for each grievance is 1 for verbal warning, 2 for written
warning, 3 for final warning 4 for dismissal and 0 following a
successful appeal.
UUnniivveerrssiittyy ooff PPrreettoorriiaa eettdd –– KKaasssseellmmaann,, RR ((22000066))
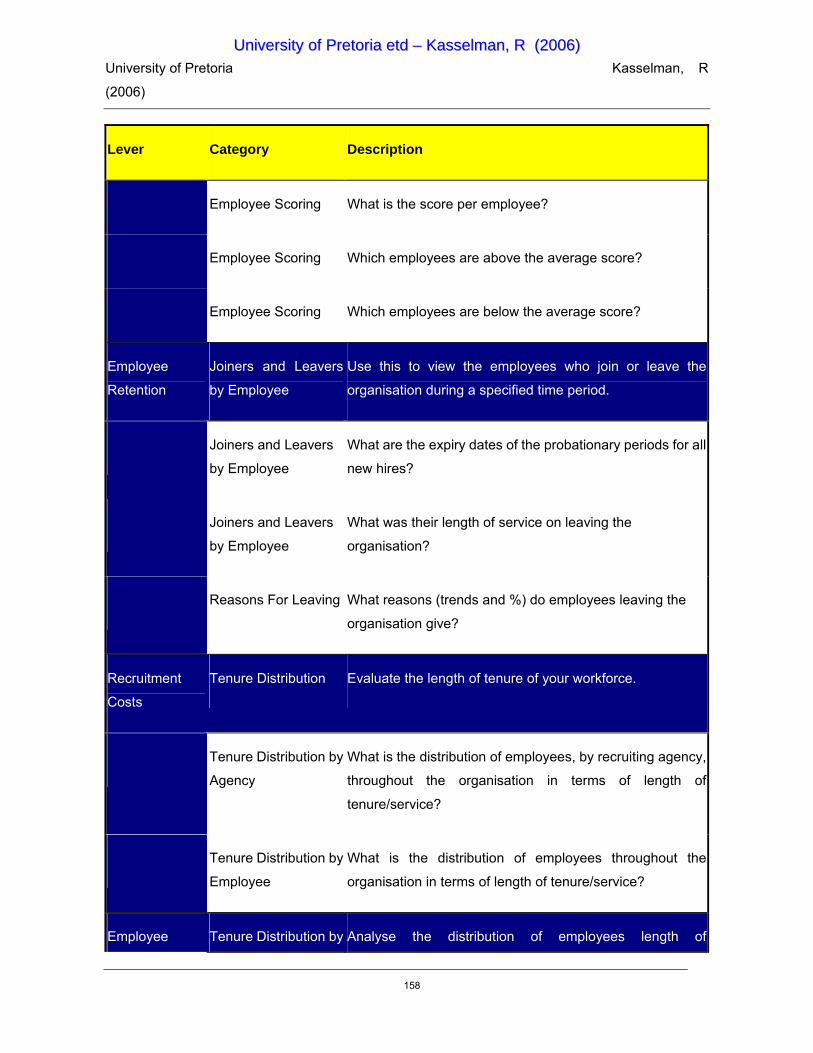
University of Pretoria Kasselman, R
(2006)
158
Lever Category Description
Employee Scoring What is the score per employee?
Employee Scoring Which employees are above the average score?
Employee Scoring Which employees are below the average score?
Employee
Retention
Joiners and Leavers
by Employee
Use this to view the employees who join or leave the
organisation during a specified time period.
Joiners and Leavers
by Employee
What are the expiry dates of the probationary periods for all
new hires?
Joiners and Leavers
by Employee
What was their length of service on leaving the
organisation?
Reasons For Leaving What reasons (trends and %) do employees leaving the
organisation give?
Recruitment
Costs
Tenure Distribution Evaluate the length of tenure of your workforce.
Tenure Distribution by
Agency
What is the distribution of employees, by recruiting agency,
throughout the organisation in terms of length of
tenure/service?
Tenure Distribution by
Employee
What is the distribution of employees throughout the
organisation in terms of length of tenure/service?
Employee Tenure Distribution by Analyse the distribution of employees length of
UUnniivveerrssiittyy ooff PPrreettoorriiaa eettdd –– KKaasssseellmmaann,, RR ((22000066))

University of Pretoria Kasselman, R
(2006)
159
Lever Category Description
Retention Job Role tenure/service by job role
Tenure Distribution by
Job Role
What is the distribution of employees, by job role,
throughout the organisation in terms of length of
tenure/service?
Employee
Retention
Tenure Distribution by
Leavers
Use this to view the distribution of leavers length of
tenure/service.
Tenure Distribution by
Leavers
What is the distribution of leavers throughout the
organisation in terms of length of tenure/service?
People Assets Workforce DNA Use this to understand the typical characteristics of
employees within the organisation.
Workforce DNA What are the demographics of my workforce?
Workforce DNA What is the average age of employees within the
organisation?
Workforce DNA What is the average salary of employees within the
organisation?
Recruitment
Costs
Recruitment
Efficiency
Understand the average time taken to complete the
advertising stage of the hire cycle. This stage is made up of
three specific phases within the advertising stage,
Identification of Need Date to Approve Need Date, Approve
Need Date to Job Specification Date and Job Specification
Date to Communicate Date.
UUnniivveerrssiittyy ooff PPrreettoorriiaa eettdd –– KKaasssseellmmaann,, RR ((22000066))

University of Pretoria Kasselman, R
(2006)
160
Lever Category Description
Recruitment
Efficiency
What is the average length of time it takes to advertise for a
new job position via Agencies?
Recruitment
Efficiency
What is the average length of time it takes to advertise for a
new job position via the HR department?
Recruitment
Efficiency
What is the average time taken from Approve Need Date to
Job Specification Date via Agencies?
Recruitment
Efficiency
What is the average time taken from Approve Need Date to
Job Specification Date via the HR department?
Recruitment
Efficiency
What is the average time taken from Identification of Need
Date to Approve Need Date via Agencies?
Recruitment
Efficiency
What is the average time taken from Identification of Need
Date to Approve Need Date via the HR department?
Recruitment
Efficiency
What is the average time taken from Job Specification Date
to Communicate Date via Agencies?
Recruitment
Efficiency
What is the average time taken from Job Specification Date
to Communicate Date via the HR department?
Recruitment
Costs
Hire Cycle Time It will enable you to identify which stage of the hiring cycle
takes the most time, by understanding this you may be able
to change your hiring processes and thus reduce your
overall cycle time.
UUnniivveerrssiittyy ooff PPrreettoorriiaa eettdd –– KKaasssseellmmaann,, RR ((22000066))
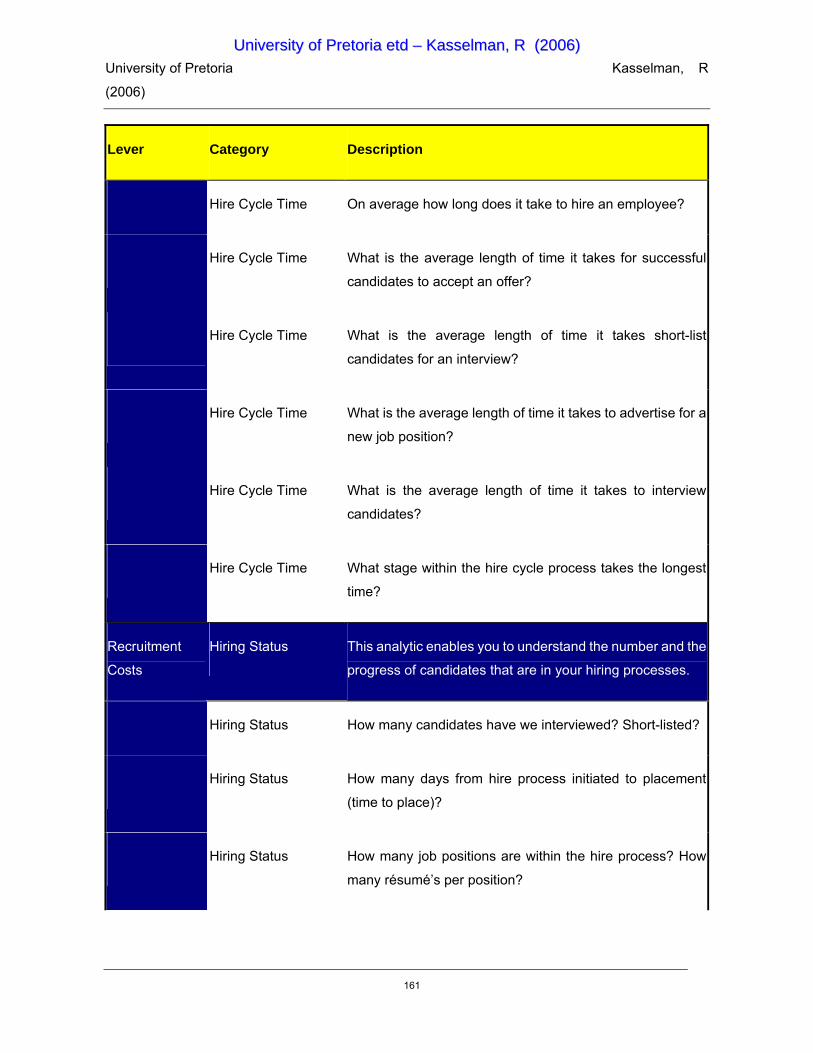
University of Pretoria Kasselman, R
(2006)
161
Lever Category Description
Hire Cycle Time On average how long does it take to hire an employee?
Hire Cycle Time What is the average length of time it takes for successful
candidates to accept an offer?
Hire Cycle Time What is the average length of time it takes short-list
candidates for an interview?
Hire Cycle Time What is the average length of time it takes to advertise for a
new job position?
Hire Cycle Time What is the average length of time it takes to interview
candidates?
Hire Cycle Time What stage within the hire cycle process takes the longest
time?
Recruitment
Costs
Hiring Status This analytic enables you to understand the number and the
progress of candidates that are in your hiring processes.
Hiring Status How many candidates have we interviewed? Short-listed?
Hiring Status How many days from hire process initiated to placement
(time to place)?
Hiring Status How many job positions are within the hire process? How
many résumé’s per position?
UUnniivveerrssiittyy ooff PPrreettoorriiaa eettdd –– KKaasssseellmmaann,, RR ((22000066))

University of Pretoria Kasselman, R
(2006)
162
Lever Category Description
Hiring Status What is the current status for each job position?
Hiring Status What stage in the hire cycle is the job position?
Hiring Status Which job positions are in the process of being filled?
Recruitment
Costs
Interview Cycle Time View the average time taken to complete the interview
stage of the hire cycle. This stage is made up of the
following phases, Shortlist to Interview Round 1, Interview
Round 1 to Interview Round, Interview Round 2 to Interview
Round 3 and Interview Round 3 to Job Offer.
Interview Cycle Time What is the average length of time from Final Interview to
Job Offer via the HR department versus Agencies?
Interview Cycle Time What is the average length of time it takes from Shortlist to
Interview Round 1 via the HR department versus Agencies?
Interview Cycle Time What is the average length of time it takes to interview
candidates through the HR department versus Agencies?
Recruitment
Costs
Offer Cycle Time Use this analytic to view the average time taken to complete
the offer stage of the hire cycle. This stage is made up of the
following phases, Job Offer Date to Offer Reply Date and
Offer Reply Date to Job Start Date.
Offer Cycle Time What is the average length of time it takes for successful
candidates to accept an offer via the HR department versus
Agencies?
UUnniivveerrssiittyy ooff PPrreettoorriiaa eettdd –– KKaasssseellmmaann,, RR ((22000066))

University of Pretoria Kasselman, R
(2006)
163
Lever Category Description
Offer Cycle Time What is the average length of time it takes from Job Offer
Date to Offer Reply Date via the HR department versus
Agencies?
Offer Cycle Time What is the average length of time it takes from Offer Reply
Date to Job Start Date via the HR department versus
Agencies?
Recruitment
Costs
Shortlist Cycle Time Use this analytic to view the average time taken to complete
the shortlist stage of the hire cycle. This stage is made up of
two specific phases within the shortlist stage,
Communication Date to Close Date and Close Date to
Shortlist Date.
Shortlist Cycle Time What is the average length of time it takes from Close Date
to Shortlist Date via the HR department versus Agencies?
Shortlist Cycle Time What is the average length of time it takes from
Communication Date to Close Date via the HR department
versus Agencies?
Shortlist Cycle Time What is the average length of time it takes short-list
candidates for an interview via the HR department versus
Agencies?
People Assets Vacancy Exceptions This analytic highlights the vacancies that are still
outstanding for all the job roles where the hire process has
been initiated.
UUnniivveerrssiittyy ooff PPrreettoorriiaa eettdd –– KKaasssseellmmaann,, RR ((22000066))

University of Pretoria Kasselman, R
(2006)
164
Lever Category Description
Vacancy Exceptions How many days has the position been vacant?
Vacancy Exceptions What is the current status for each job position?
Training Costs /
Efficiency
Development This analytic enables you to view the courses available for a
particular employee so that a skill gap may be reduced
through further training.
Development What is the current skill level of the employee for the
particular skill?
Development Which training courses are available to improve skills?
Course Quality This analytic summarises the quality, in terms of employee
feedback, of the organisation’s education program.
Course Quality How many employees have attended the course?
Course Quality How many employees have attended the course over this
time period?
Course Quality What is the rating for each course?
Course Quality What is the rating of the course overall?
Training Costs /
Efficiency
Course Quality Detail This analytic enables you to review the quality of a
particular course and instructor in light of feedback from
delegates. It gives details of the quality rating, average cost
UUnniivveerrssiittyy ooff PPrreettoorriiaa eettdd –– KKaasssseellmmaann,, RR ((22000066))

University of Pretoria Kasselman, R
(2006)
165
Lever Category Description
per delegate and course duration.
Course Quality Detail How many courses have been delivered for this skill?
Course Quality Detail How many employees have attended the course?
Course Quality Detail What is the average delegate cost?
Course Quality Detail What is the rating of the course instructor?
Course Quality Detail What is the rating of the course overall?
Training Costs /
Efficiency
Employee Course
History
These analytic details the courses that an individual
employee has attended over a chosen time frame.
Employee Course
History
How many courses has an employee attended?
Employee Course
History
What dates did the employee attend courses?
Employee Course
History
What was the cost per course?
Employee Course
History
What was the description of the course attended?
Employee Course What was the duration of the course?
UUnniivveerrssiittyy ooff PPrreettoorriiaa eettdd –– KKaasssseellmmaann,, RR ((22000066))

University of Pretoria Kasselman, R
(2006)
166
Lever Category Description
History
Employee Course
History
What was the qualification gained by attending this course?
Training Costs /
Efficiency
Future Training
Summary
This analytic enables you to view a list of planned employee
courses by location.
Future Training
Summary
How many employees are booked on the course?
Future Training
Summary
What courses are available in the future?
Future Training
Summary
Which employees are booked on the course?
Training Costs /
Efficiency
Post Course Skill
Enhancement
Understand the impact that training courses have on the
overall skill improvement of your workforce.
Post Course Skill
Enhancement
How many employees have attended the course over this
time period?
Post Course Skill
Enhancement
How many employees have improved their skill?
Post Course Skill
Enhancement
How many employees have not improved their skill?
UUnniivveerrssiittyy ooff PPrreettoorriiaa eettdd –– KKaasssseellmmaann,, RR ((22000066))

University of Pretoria Kasselman, R
(2006)
167
Lever Category Description
Post Course Skill
Enhancement
What dates did the employee attend courses?
Post Course Skill
Enhancement
What is the average length of time that an employee takes
to improve their skill?
Post Course Skill
Enhancement
What is their skill level after improvement?
Post Course Skill
Enhancement
What is the percent of employees that improve their skills as
a result of the course?
Post Course Skill
Enhancement
What skills does the course offer?
Post Course Skill
Enhancement
What was their skill level prior to the course?
Training Costs /
Efficiency
Proposed Course
Skills
This analytic enables you to understand which training
courses are available to enhance which skill within your
workforce.
Proposed Course
Skills
How many employees do not have the skill at all?
Proposed Course
Skills
What is the duration of the course?
UUnniivveerrssiittyy ooff PPrreettoorriiaa eettdd –– KKaasssseellmmaann,, RR ((22000066))

University of Pretoria Kasselman, R
(2006)
168
Lever Category Description
Proposed Course
Skills
What is the number of employees within the organisation at
each grade of the skill?
Proposed Course
Skills
What is the percent of employees within the organisation at
each grade of the skill?
Proposed Course
Skills
Which courses are available to improve particular skills?
Employee
Effectiveness
Skill Absence by
Employee
This analytic enables you to understand what skills are
absent in your workforce. This information may be used to
identify under skilled employees and plan future training
needs.
Skill Absence by
Employee
How long have these employees been in the job?
Skill Absence by
Employee
How many employees do not have a particular skill?
Skill Absence by
Employee
Which employees do not have a particular skill?
Skill Absence by
Employee
Which job roles do these employees undertake?
Employee
Effectiveness
Skill Gap Analysis Skill Gap Analysis gives you a listing of all employees within
the Organisation that have an identified skill gap. It enables
you to understand which employees are below the
UUnniivveerrssiittyy ooff PPrreettoorriiaa eettdd –– KKaasssseellmmaann,, RR ((22000066))

University of Pretoria Kasselman, R
(2006)
169
Lever Category Description
minimum skill score for their job role.
Skill Gap Analysis What is the skill score of the employee versus the required
skill score for the job role?
Skill Gap Analysis Which employee has a skill gap?
Skill Gap Analysis Which employee has the highest skill gap?
Employee
Effectiveness
Skill Gap Trend
Analysis
Skill Gap Analysis Trend gives you a listing of all employees
within the Organisation that have reduced their skill gap.
Skill Gap Trend
Analysis
Which employee has improved the most over the time
period?
Skill Gap Trend
Analysis
Which employees have improved their skill score over the
time period?
Skill Improvers by
Employee
This details the change in skill score of an employee over
given time period for their various skills.
Skill Improvers by
Employee
How long has the employee been in their current role?
Skill Improvers by
Employee
What is the change in skill score for this employee over the
time period?
Skill Improvers by Which skill has the employee improved the least over the
UUnniivveerrssiittyy ooff PPrreettoorriiaa eettdd –– KKaasssseellmmaann,, RR ((22000066))
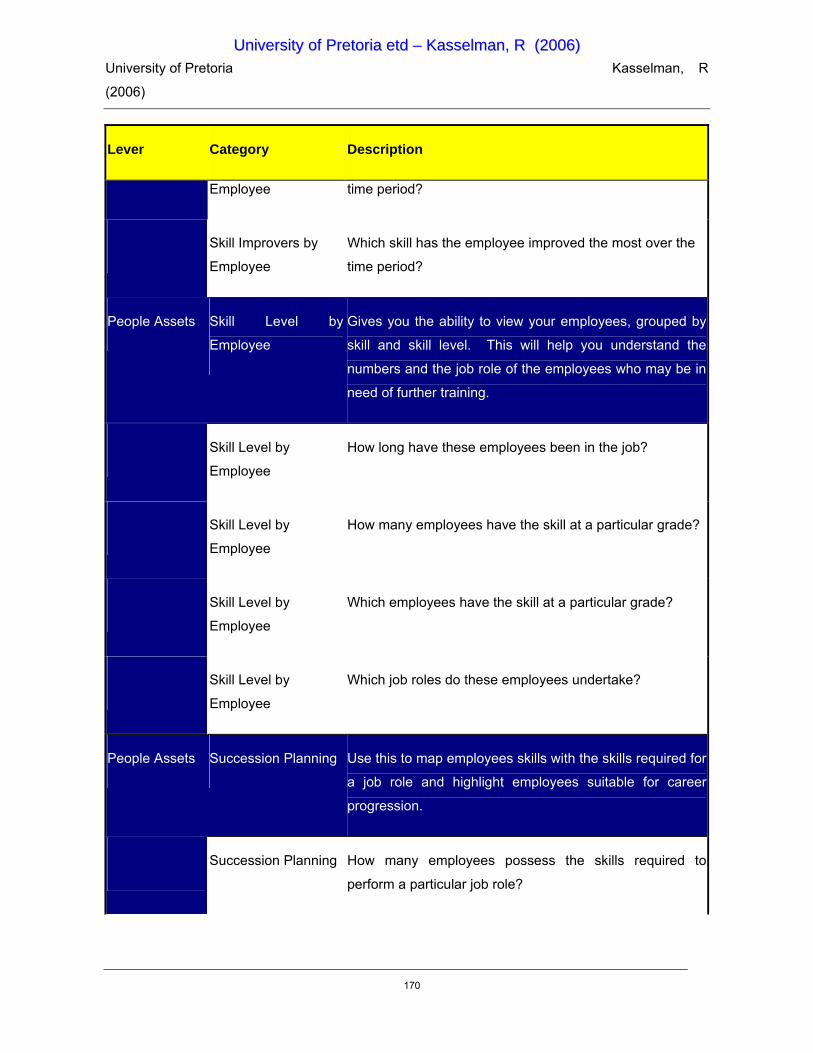
University of Pretoria Kasselman, R
(2006)
170
Lever Category Description
Employee time period?
Skill Improvers by
Employee
Which skill has the employee improved the most over the
time period?
People Assets Skill Level by
Employee
Gives you the ability to view your employees, grouped by
skill and skill level. This will help you understand the
numbers and the job role of the employees who may be in
need of further training.
Skill Level by
Employee
How long have these employees been in the job?
Skill Level by
Employee
How many employees have the skill at a particular grade?
Skill Level by
Employee
Which employees have the skill at a particular grade?
Skill Level by
Employee
Which job roles do these employees undertake?
People Assets Succession Planning Use this to map employees skills with the skills required for
a job role and highlight employees suitable for career
progression.
Succession Planning How many employees possess the skills required to
perform a particular job role?
UUnniivveerrssiittyy ooff PPrreettoorriiaa eettdd –– KKaasssseellmmaann,, RR ((22000066))
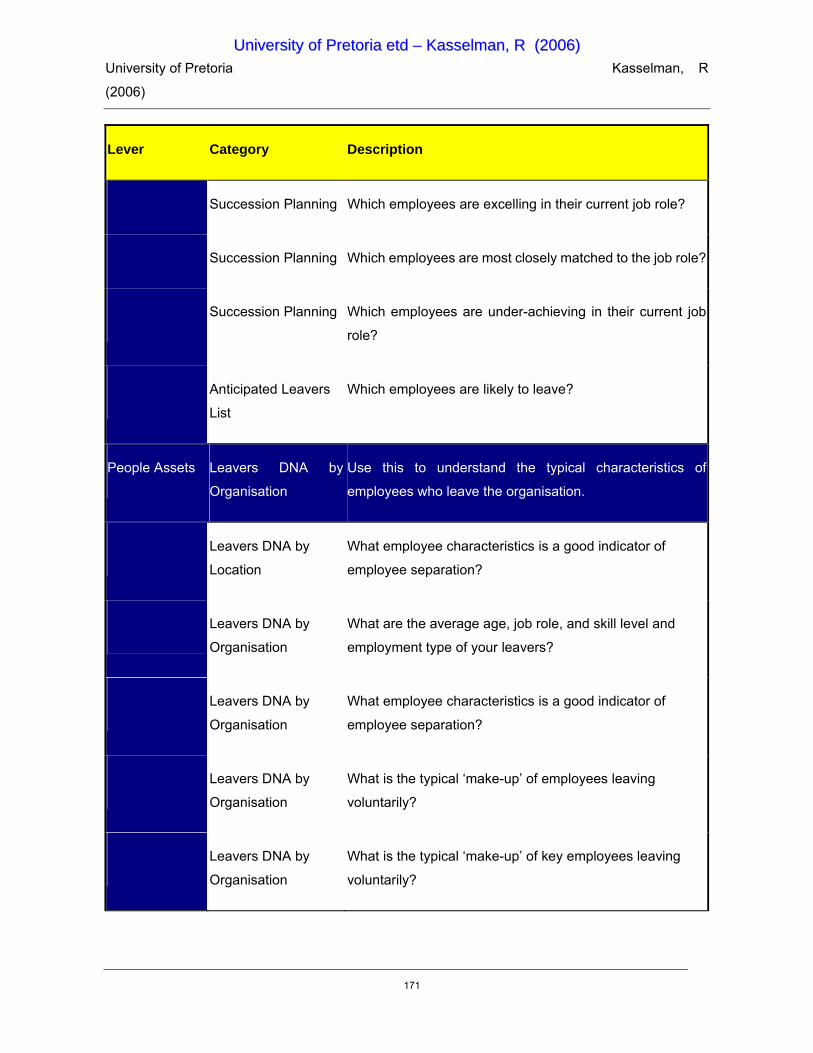
University of Pretoria Kasselman, R
(2006)
171
Lever Category Description
Succession Planning Which employees are excelling in their current job role?
Succession Planning Which employees are most closely matched to the job role?
Succession Planning Which employees are under-achieving in their current job
role?
Anticipated Leavers
List
Which employees are likely to leave?
People Assets Leavers DNA by
Organisation
Use this to understand the typical characteristics of
employees who leave the organisation.
Leavers DNA by
Location
What employee characteristics is a good indicator of
employee separation?
Leavers DNA by
Organisation
What are the average age, job role, and skill level and
employment type of your leavers?
Leavers DNA by
Organisation
What employee characteristics is a good indicator of
employee separation?
Leavers DNA by
Organisation
What is the typical ‘make-up’ of employees leaving
voluntarily?
Leavers DNA by
Organisation
What is the typical ‘make-up’ of key employees leaving
voluntarily?
UUnniivveerrssiittyy ooff PPrreettoorriiaa eettdd –– KKaasssseellmmaann,, RR ((22000066))

University of Pretoria Kasselman, R
(2006)
172
Lever Category Description
Employee
Retention
Leavers Forecast This analytic uses statistical technique to estimate the
number of employees that are likely to leave your company
over the coming periods.
Leavers Forecast How many leavers should I anticipate over the coming
months?
Employee
Retention
Leavers Profile This analytic uses statistical techniques to discover which
employee characteristics are good indicators of employee
churn.
Leavers Profile What are the average age, job role, and skill level and
employment type of your leavers?
Leavers Profile What employee characteristics are good indicators of
employee separation?
Employee
Retention
Salary Analysis View the distribution of basic salaries within the
organisation by employee grade, demographics and age.
Salary Analysis How do salaries compare in different organisational units
within the business?
Salary Analysis What are basic, bonus and total salaries?
Salary Analysis What is the spread of salaries in the organisation by age
range?
UUnniivveerrssiittyy ooff PPrreettoorriiaa eettdd –– KKaasssseellmmaann,, RR ((22000066))

University of Pretoria Kasselman, R
(2006)
173
Lever Category Description
Salary Analysis What is the spread of salaries in the organisation by job
grade?
Employee
Effectiveness
Skill Depletion Impact Use this analytic to measure the effect on department skill
levels when an employee leaves the organisation. It details
the average skill score with and without the ‘leaver’ and also
highlights the number of employees remaining with the skill.
Skill Depletion Impact How many employees remain who are competent in the
skill?
Skill Depletion Impact What impact is there on the overall skill score of an
employee leaving a department?
Skill Depletion Impact
Detail
View in detail the effect on department skill levels when an
employee leaves the organisation
Skill Depletion Impact
Detail
What is their job position?
Skill Depletion Impact
Detail
What is their skill level?
Skill Depletion Impact
Detail
When did they acquire the skill?
Skill Depletion Impact
Detail
Which employees remain in the department who have the
skill?
Table 9: Business Questions - adapted from SAP (2003)
UUnniivveerrssiittyy ooff PPrreettoorriiaa eettdd –– KKaasssseellmmaann,, RR ((22000066))
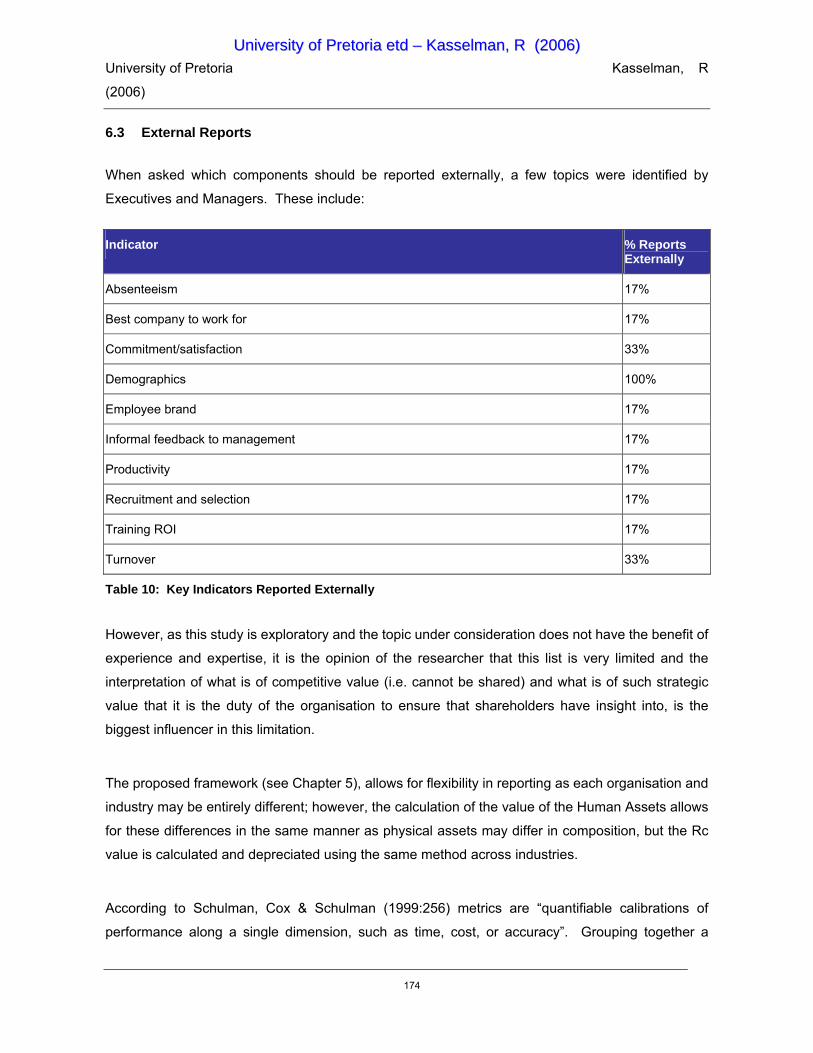
University of Pretoria Kasselman, R
(2006)
174
6.3 External Reports
When asked which components should be reported externally, a few topics were identified by
Executives and Managers. These include:
Indicator % Reports Externally
Absenteeism 17%
Best company to work for 17%
Commitment/satisfaction 33%
Demographics 100%
Employee brand 17%
Informal feedback to management 17%
Productivity 17%
Recruitment and selection 17%
Training ROI 17%
Turnover 33%
Table 10: Key Indicators Reported Externally
However, as this study is exploratory and the topic under consideration does not have the benefit of
experience and expertise, it is the opinion of the researcher that this list is very limited and the
interpretation of what is of competitive value (i.e. cannot be shared) and what is of such strategic
value that it is the duty of the organisation to ensure that shareholders have insight into, is the
biggest influencer in this limitation.
The proposed framework (see Chapter 5), allows for flexibility in reporting as each organisation and
industry may be entirely different; however, the calculation of the value of the Human Assets allows
for these differences in the same manner as physical assets may differ in composition, but the Rc
value is calculated and depreciated using the same method across industries.
According to Schulman, Cox & Schulman (1999:256) metrics are “quantifiable calibrations of
performance along a single dimension, such as time, cost, or accuracy”. Grouping together a
UUnniivveerrssiittyy ooff PPrreettoorriiaa eettdd –– KKaasssseellmmaann,, RR ((22000066))
University of Pretoria Kasselman, R
(2006)
175
number of metrics provides you with performance measures into an area of focus. These
performance measures provide you with the ability to compare various companies with each other in
a meaningful way. These measures will not only allow the organisation to look forward and improve
their planning, but will also give stakeholders in the organisation or market place the ability to
evaluate the organisations’ current and future potential performance.
6.4 Performance Metrics
The metrics evaluated during the Delphi workshops are linked below with the elements within the
proposed Framework to allow HR practitioners to draw the link between their metrics and the value it
adds to the shareholders. Metrics have also been added based on input from specialist HR input
post-evaluation of the model. These metrics can be included in external reporting as well as internal
reporting.
Metrics are categorised into typical HR functional topics and linked to the levers on the framework via
the numbering system of the framework; e.g. C11 (D1) refers to People Assets, Manage Talent
Development and Succession Planning.
UUnniivveerrssiittyy ooff PPrreettoorriiaa eettdd –– KKaasssseellmmaann,, RR ((22000066))

University of Pretoria Kasselman, R
(2006)
176
UUnniivveerrssiittyy ooff PPrreettoorriiaa eettdd –– KKaasssseellmmaann,, RR ((22000066))

University of Pretoria Kasselman, R
(2006)
177
UUnniivveerrssiittyy ooff PPrreettoorriiaa eettdd –– KKaasssseellmmaann,, RR ((22000066))

University of Pretoria Kasselman, R
(2006)
178
UUnniivveerrssiittyy ooff PPrreettoorriiaa eettdd –– KKaasssseellmmaann,, RR ((22000066))
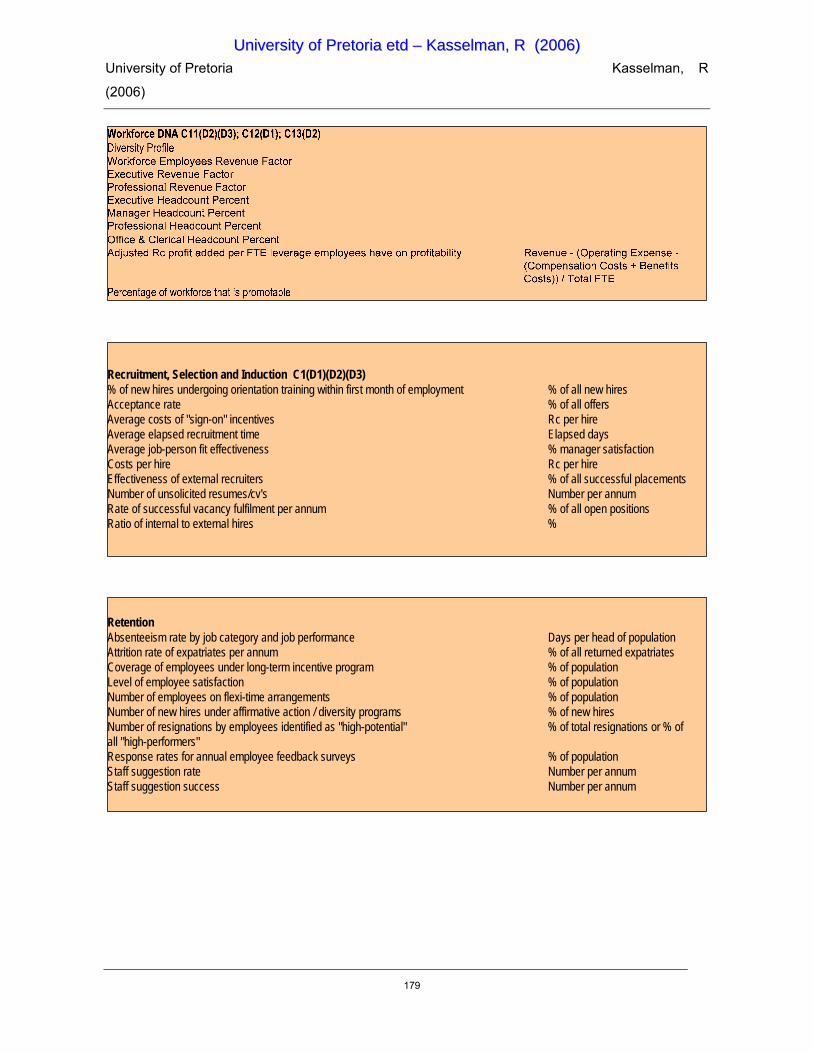
University of Pretoria Kasselman, R
(2006)
179
Recruitment, Selection and Induction C1(D1)(D2)(D3)% of new hires undergoing orientation training within first month of employment % of all new hiresAcceptance rate % of all offersAverage costs of "sign-on" incentives Rc per hireAverage elapsed recruitment time Elapsed daysAverage job-person fit effectiveness % manager satisfactionCosts per hire Rc per hireEffectiveness of external recruiters % of all successful placementsNumber of unsolicited resumes/cv's Number per annumRate of successful vacancy fulfilment per annum % of all open positionsRatio of internal to external hires %
RetentionAbsenteeism rate by job category and job performance Days per head of populationAttrition rate of expatriates per annum % of all returned expatriatesCoverage of employees under long-term incentive program % of populationLevel of employee satisfaction % of populationNumber of employees on flexi-time arrangements % of populationNumber of new hires under affirmative action / diversity programs % of new hiresNumber of resignations by employees identified as "high-potential" % of total resignations or % of all "high-performers"Response rates for annual employee feedback surveys % of populationStaff suggestion rate Number per annumStaff suggestion success Number per annum
UUnniivveerrssiittyy ooff PPrreettoorriiaa eettdd –– KKaasssseellmmaann,, RR ((22000066))

University of Pretoria Kasselman, R
(2006)
180
Training and Development C3(D1)(D2)(D3)Attainment of performance goals % of successful achievementAverage evaluation of training programs % satisfaction per courseAverage training hours per level per annum HoursAverage training investment per FTE Rc per personAverage training provided by line managers per annum Hours per managerCost of internal training to cost of external training %Cost of training trainers Rc per internal trainerLearning penetration % of total populationNumber of full-time dedicated internal trainers per head of population %Training investment per annum Rc per annum
IT Business Solutions Measures C10 (D1)(D2)(D3)No of Projects successfully implemented #No of management employees with access to business information to facilitate decision making #Cost of IT Solution RcCost of development per FTE Rc per FTECost of solution development as % of turnover % of turnover
UUnniivveerrssiittyy ooff PPrreettoorriiaa eettdd –– KKaasssseellmmaann,, RR ((22000066))

University of Pretoria Kasselman, R
(2006)
181
6.5 Conclusion
The value of functional areas such as HR can be assessed only through their effect on the bottom
line and the value they add to line functions by enabling line to improve their own effectiveness and
efficiency. Understanding the impact of people and how best to apply it in a line function can be
advised by HR. Analysing the result of such application of Human Resources in the business, from
both a cost and a productivity perspective, can be calculated using HR analytics such as described in
Chapter 6. The efficiency of HR as a function in itself, however, also requires measurement and
using metrics such as those described in Chapter 7 allows the business to determine the return on
investment for such HR programmes.
An understanding of both the cost as well as the benefits of Human Capital, those who employ the
human resource, as well as the function of Human Resource management within an organisation, is
what drives the value from Human Assets. In the preceding chapters, those elements that make up
such costs and determine the benefits has been explored and listed. HR practitioners and People
Managers may select those metrics and reports that will add most value to their business by
balancing them against the Human Capital Reporting Framework. The following Chapter provides
the recommended reporting elements to be included for Human Capital in company annual reports.
UUnniivveerrssiittyy ooff PPrreettoorriiaa eettdd –– KKaasssseellmmaann,, RR ((22000066))
University of Pretoria Kasselman, R
(2006)
182
CHAPTER 7 – REPORTING HUMAN CAPITAL IN COMPANY ANNUAL REPORTS
“Everything that can be counted, does not necessarily count; everything that counts cannot
necessarily be counted”
- Albert Einstein 1879 - 1955
7.1 Introduction
Assets have an intrinsic value to the organisation, and at the same time they generate value for
others. In other words, we add value to stakeholders through the deployment of our assets. So, when
we talk about people in an organisation, there are two separate ways in which we can use the
concept of value:
• What they are worth to us, and
• The value they add to others and the organisation.
We remunerate the individual based on their perceived worth as influenced by the market salaries for
the position in which the individual is employed.
The person contributes with his Human Capital individually as well as within a team where the value
is even greater than that of one single individual. It is the intrinsic worth of people that comprises the
Human Capital available to us, and at the same time that worth is creating an asset by it’s
contribution to the organisation.
Money is used to fund purchases of or rent/lease physical (tangible) assets and in their day- to-day
use. It is also employed by people, both in managing the tangible assets and in building intangible
assets, such as brand value, customer loyalty, efficient processes, and new knowledge. An
UUnniivveerrssiittyy ooff PPrreettoorriiaa eettdd –– KKaasssseellmmaann,, RR ((22000066))

University of Pretoria Kasselman, R
(2006)
183
intangible asset, like any other asset, generates value or even subtract value i.e. assets can turn into
liabilities (negative asset value).
The value and use of an asset attracts certain expenses (administration costs). Increasing the value
generated from an asset requires investment in that asset (training and development, initiatives for
increasing efficiency etc), and certain factors determine or influences the manner in which the asset
is applied and used.
This chapter looks at the framework for the reporting of, measuring and improving of Human Assets
and the organisational function that is linked to the management of this resource.
7.2 Principles for Reporting
A reporting model is required as a standard for reporting Human Capital. This model needs to take
into consideration the general accepted accounting principles and be innovative and future
orientated to enable the reporting of Human Assets. The model needs to be sensitive to those
factors that provide the company a competitive edge.
7.2.1 Principles
Reporting on Human Capital requires certain expected and accepted principles based on good
practice of reporting:
UUnniivveerrssiittyy ooff PPrreettoorriiaa eettdd –– KKaasssseellmmaann,, RR ((22000066))

University of Pretoria Kasselman, R
(2006)
184
Principle Method of address
Show value to the stakeholders in respect of Human Capital value contributions, including the impact of the costs of such contributions on the operating margin
Provide both the effect on revenue growth and operating margin to balance the contribution, demonstrating potential income (revenue) and the conditions required to realise this
Information on possible barriers to the effective development and utilisation of Human Capital and the impact on customers and employee performance that may impact on revenue generation
Provide the value of the asset productivity and the information that may influence the application of the asset within the organisation which can be measured (benchmarked) against competitors
Information on the human assets deployed and the value being contributed - be future-oriented
Report on external factors which influences stakeholders
Information on the factors that influence the contribution of Human Assets i.e. productivity, meeting legislative requirements, potential risks and influence of market conditions.
Table 11: HR Reporting Principles
7.2.2 Features of the report
Information is relevant to the identification of Human Capital and should be available in both
quantitative and qualitative indicators. A distinction between primary and secondary indicators is
required.
The framework incorporates information on both the short-term and the long-term, highlighting both
investments in and depreciation of human assets. It provides information not only on Human Capital
“staff” but also on the management and utilisation of the flow of Human Capital. Categorizing the
workforce is an essential component to this reporting framework.
There are multiple themes of indicators to reflect the value add from Human Resource Management
- these are important to guide the tactics deployed by HR to enable the value creation.
UUnniivveerrssiittyy ooff PPrreettoorriiaa eettdd –– KKaasssseellmmaann,, RR ((22000066))
University of Pretoria Kasselman, R
(2006)
185
• Indicators to highlight possible barriers to the under-utilisation of Human Capital based on gender,
age or ethnic origin are not depicted in the framework, however, the level of adoption of
employment equity in the organisation is an important distinction and required to be shown.
• Indicators to highlight the contribution to social or community projects i.e. a companies social
responsibility is an important distinction.
7.3 Company Annual Report
When reporting from a financial perspective in company annual reports, the Human Resources asset
value needs to be taken into account. The Rand value of the Capital invested is not difficult to obtain,
and is currently available as part of the normal Chart of Accounts within an organisation. The total
cost of Human Resources does however need to reflect (as a line item) all categories of the
workforce, including consultants employed to execute activities on behalf of the organisation,
part-time labour employed from time to time as well as fixed term contractors. People are employed
by the organisation with the objective of trading their skills and knowledge for monetary reward. The
capabilities applied have the same or similar effect on the organisation whether a full-time employee
or that of a part-time employee or contractor.
The effect of revenue should be accounted for to balance this investment in HR capital. Balanced,
these two amounts equate to the Human Capital Value Addition. An example of what such a Human
Capital Statement may look is illustrated below, providing an account of potential risk and risk
mitigation factors for this category of assets. This is required to ensure that shareholders have a full
view of the deployment of the Human Assets in the organisation.
UUnniivveerrssiittyy ooff PPrreettoorriiaa eettdd –– KKaasssseellmmaann,, RR ((22000066))
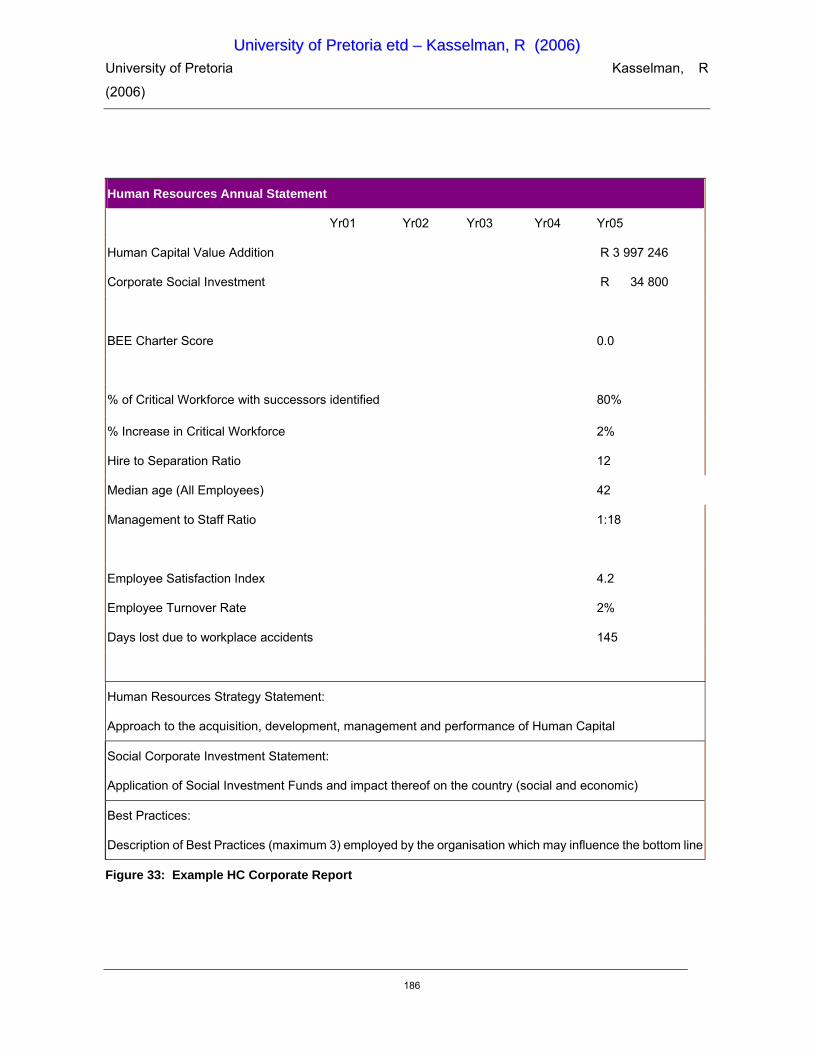
University of Pretoria Kasselman, R
(2006)
186
Human Resources Annual Statement
Yr01 Yr02 Yr03 Yr04 Yr05
Human Capital Value Addition R 3 997 246
Corporate Social Investment R 34 800
BEE Charter Score 0.0
% of Critical Workforce with successors identified 80%
% Increase in Critical Workforce 2%
Hire to Separation Ratio 12
Median age (All Employees) 42
Management to Staff Ratio 1:18
Employee Satisfaction Index 4.2
Employee Turnover Rate 2%
Days lost due to workplace accidents 145
Human Resources Strategy Statement:
Approach to the acquisition, development, management and performance of Human Capital
Social Corporate Investment Statement:
Application of Social Investment Funds and impact thereof on the country (social and economic)
Best Practices:
Description of Best Practices (maximum 3) employed by the organisation which may influence the bottom line
Figure 33: Example HC Corporate Report
UUnniivveerrssiittyy ooff PPrreettoorriiaa eettdd –– KKaasssseellmmaann,, RR ((22000066))

University of Pretoria Kasselman, R
(2006)
187
7.4 Conclusion
Delivering “value” is why organisations exist. This is clearly about providing “sustainable returns to
shareholders” for those companies that have owners and investors. Even non-profit organisations
that create value for their stakeholders, though it may not be measured financially, have the same
goal. It is safe to assume that stakeholders will only want to continue their association with an
organisation if their expectations of value are being met. In the new era of knowledge workers,
organisations and markets need to look for value beyond the traditional net book worth, which
reflects only the physical and financial assets. Intangible assets such as Human Resources, which
due to the nature of the knowledge worker in the 21st century contributes most, if not all of currently
unaccounted value.
For stakeholders to assess the real value of an organisation, they need to be fully informed of
physical, financial and human assets. In order to do this, organisations will need to provide enough
information, of reliable source and in a format understandable (if not standard) to it’s shareholders.
This framework sets out to provide just such a method.
Chapter 8 will conclude this study with a summary, recommendations, limitations and proposed
further studies.
UUnniivveerrssiittyy ooff PPrreettoorriiaa eettdd –– KKaasssseellmmaann,, RR ((22000066))

University of Pretoria Kasselman, R
(2006)
188
CHAPTER 8 - CONCLUSIONS AND RECOMMENDATIONS
“Everyone is looking for a quick fix, but what they really need is fitness.”
- Kevin Myers (2005)
8.1 Introduction
A company’s management of its Human Resources and its ability to align them with it’s strategic
objectives play a key role in the company’s level of success. Increasingly, HR practitioners face the
challenge of quantifying the value of HR management processes and their worth to the company.
There is a need to focus beyond mere acceptance that HR management is good practice and
common sense, and instead measure the actual value it brings.
Executives regard the HR function as facilitators of administrative needs rather than as strategic
business partners and seems interested in having HR fulfil only the basics (i.e., getting the HRIS
data accurate) instead of gathering insight into the strategic realm of the business. This thinking is
outdated as the HR landscape has changed, and the acknowledged critical role of people
management demands that HR performs a strategic role in the key decision-making team. This also
means that HR has to raise its own profile and prove that it can add value.
This requires managing more than just the simple operations. It means defining the organisation’s
HR strategies to attract, retain, and support the right people and linking Human Capital strategies to
UUnniivveerrssiittyy ooff PPrreettoorriiaa eettdd –– KKaasssseellmmaann,, RR ((22000066))

University of Pretoria Kasselman, R
(2006)
189
the right technology solutions to maximise efficiencies. It means linking technologies and HR
processes to business strategies and objectives, assisting in the tactics business leaders want to
deploy to leverage their investment in the Human Resources of the organisation. It means showing
in financial terms, the value creation of the Human Resources of an organisation.
The objectives defined at the start of this study was to explore the fields of Human Resources and
finance to formulate a reporting framework that will integrate these fields in the area of value
extraction from human assets. This framework will assist Human Resources practitioners to link
their contribution and the contribution of the Human Resources within the organisation to the bottom
line of the organisation. Taking into consideration that it may be argued that there is no difference
between money measures and other measures. Both are uncertain and all are dependent on the
observer. The main reasons why the money measures seem more “objective” and “real” are that
they are founded on implicit concepts of what a company is and that the measures have been around
for so long that they are guided by definitions and standards.
With this context in mind, the framework developed during this study provides an approach to
support organisations in improving their ability to:
1. Analyse, design, manage and strategically align their HR processes
2. Identify Human Resources’ contribution to the business
3. Identify a method of evaluating, especially in quantitative terms, the value added by the
company’s human assets
Simply stated, the Human Capital invested in the organisation is a key factor in the performance of
the organisation. The talent of the organisation stems from their Human Resources, flowing from the
people within the organisation. This means that the most effective practices for the attraction,
deployment, retention and even separation of people and the organisation has a direct impact on the
bottom line and thus shareholder value. How these resources are applied may add to the value of
the organisation or even detract from it.
UUnniivveerrssiittyy ooff PPrreettoorriiaa eettdd –– KKaasssseellmmaann,, RR ((22000066))
University of Pretoria Kasselman, R
(2006)
190
Based on the above, how aligned HR practices are with the stakeholders’ values needs to be
measured, improved and reported on as part of good governance to enable stakeholders and
potential stakeholders in an organisation to have a holistic view of the real value of the organisation.
These practices are not limited to what the HR function does / does not do, but include all aspects of
people management within the organisation.
Conventional wisdom dictates that a company’s management of its Human Resources and its ability
to align them towards strategic objectives play a key part in a company’s level of business success.
This is a generally accepted fact of corporate life, but increasingly, HR practitioners face the
challenge of quantifying just what this contribution is and the worth of HR to a company.
During the semi-structured interviews, the researcher explored the topic of HR management
reporting in-depth and it became clear that the “pressure” for HR analytics and/or reporting has been
brought about by various factors, key amongst which are the requirements for cost-cutting efforts
and justification of spending, as well as the increasing requirement for corporations to be more
accountable and provide more transparency for their activities. HR functions are at risk of being
overlooked if they are unable to accurately justify HR investments and show returns.
Complacency by the HR function would mean reduced ability to demand the required amount of
financial attention for continued investment in people-related aspects of business. When asked how
difficult or easy it was for HR to obtain funding, HR managers felt that as long as they stick to the
budgetary guidelines, it is reasonably easy as “everyone realises the value of the people and
developing them and of course we have to pay them or this business will come to a complete
standstill”. Although HR are pressured for lower increases or even decreases in budget (by %), they
are not required to compete from the same base or to the same degree as other functions such as
Finance.
Reporting on Human Capital may indeed require a different, innovative perspective; however
funding the Human Resources and the initiatives developed to increase the value added by these
resources, remains of monetary importance. The organisation is faced with the challenge of
applying its cash or investment from shareholders to those initiatives that will generate most value.
As it is the people or Human Resources of the organisation who makes these decisions as well as
executes the activities that generate this value, investment needs to be made to ensure that the bar
is continually raised for the Human Resources.
UUnniivveerrssiittyy ooff PPrreettoorriiaa eettdd –– KKaasssseellmmaann,, RR ((22000066))

University of Pretoria Kasselman, R
(2006)
191
Including Human Assets in the chart of accounts will require an adjustment of the current accepted
methods of reporting financial results. The basic principle that net profit equals revenue less
expense remains to drive those initiatives that organisations focus on, but extracting value from the
assets of the organisation, will need to include the value encapsulated in the human assets of the
organisation. The categories of expense should include the total cost of Human Resources; i.e. all
categories of the workforce, including consultants employed to execute activities on behalf of the
organisation, part-time labour employed from time to time as well as fixed term contractors, but so
should the value generated by these groups.
Delivering “value” is why organisations exist. This is clearly about providing “sustainable returns to
shareholders” for those companies that have owners and investors. The knowledge worker era
requires the market to look for value beyond the traditional net book worth which reflects only the
physical and financial assets. In order to address this requirement for the Human Assets of the
organisation and HR will need to provide reporting that satisfies the principles that:
• Provide both the effect on revenue growth and operating margin to balance the contribution,
demonstrating potential income (revenue) and the conditions required to realise this
• Provide the value of the asset productivity and the information that may influence the application
of the asset within the organisation which can be measured (benchmarked) against competitors
• Report on external factors which influences stakeholders
The research demonstrated the different viewpoints from the various stakeholders (HR, Finance,
Auditors and Executives) and their insight (or lack thereof) into the value contribution of the HR
function as well as Human Capital. The lack of insight into the cross-functional disciplines of HR and
Finance has become more emphasised and the change in the role of HR practitioners prevalent.
This will require a re-look at the profile of HR practitioners to include skills that include financial and
analytical competence. Likewise, the biased views towards financial measures limit the ability of
auditors to audit the information in this discipline and will also require a look into the skills and
knowledge of this.
UUnniivveerrssiittyy ooff PPrreettoorriiaa eettdd –– KKaasssseellmmaann,, RR ((22000066))
University of Pretoria Kasselman, R
(2006)
192
8.2 Expected impact of results
In implementing the proposed Human Capital Measurement Framework, it is expected that
companies will be able to achieve the following benefits:
Primary benefits:
• A framework to evaluate the company’s Human Capital Value Addition.
• Be able to counter the one-sidedness of “people are costs” with “they also have worth as assets
and they add value.”
• Understand the relative value of individuals and teams, and make choices regarding which we
must retain if required.
• Make informed and intelligent investment decisions, and understand the relative benefits of
investing in people compared to other assets
• “Keep stock” of talent and expertise in a much more meaningful way than counting heads, and
know whether the human assets available to us is increasing or decreasing.
Secondary benefits:
• Introduction of common language between HR, Finance and other business functions.
• Articulation of expected results between business strategic objectives and HR processes,
investments, etc. (prerequisites not only for measuring HR efficiency and ROI, but also HR’s
impact on business results).
• Establishment of strategic and operational guidelines of HR performance management model.
UUnniivveerrssiittyy ooff PPrreettoorriiaa eettdd –– KKaasssseellmmaann,, RR ((22000066))

University of Pretoria Kasselman, R
(2006)
193
• Operational tools and overall approach to design and implement HR strategy consistent with
business strategy, including those measures that calculates the effectiveness and efficiency of
such as strategy.
• Better conditions for a more balanced budget allocation based on business return analysis.
A further benefit is the proposed standard report for information supplied by organisations that is
balanced and objective (refer example HC Report). This proposed report provides for Human
Capital information without divulging details that is considered of competitive advantage, but meets
the requirement for transparency to shareholders.
In order to understand key people issues in the organisation, shareholders have to understand:
• Why the workforce is shrinking or expanding.
• Whether the workforce profile fit the core business and strategy of the organisation.
• How reliant is the organisation on it’s key positions and what are the risks associated with this.
• How to maximise the value which can be obtained from the available workforce which requires an
understanding of:
The size and composition of the workforce.
Strategies for motivation, development and retention.
Value of the skills, competencies and knowledge of employees in key / strategic
positions.
Succession planning.
UUnniivveerrssiittyy ooff PPrreettoorriiaa eettdd –– KKaasssseellmmaann,, RR ((22000066))

University of Pretoria Kasselman, R
(2006)
194
Remuneration and reward linked to performance.
Employment practice (employment equity, diversity, compliance to charter).
8.3 Contributions of the present study
This study has contributed to the fields of Human Resources as well as finance; however, the overall
value is in the holistic view of the contribution of Human Resources to increase the value of the
organisation.
For Human Resources practitioners, this study provides a framework that links the activities and
initiatives within this function to shareholder value.
• It assists HR practitioners to focus on those activities that really add value to the bottom line whilst
controlling those that has the potential to detract value; i.e. aligning HR initiatives with the
business strategy and tactics the operation wishes to employ.
• It provides HR with a method of reporting their own as well as the value contributed by the Human
Resources of the organisation both internally as well as externally.
• It assists organisations to identify methods of extracting or increasing the Human Capital within
the organisation.
• It assists HR practitioners in identifying information which can be compared to competitors and
industry for assessment of their own position in the market.
For Finance practitioners, this study provides insight into the value that HR and invested Human
Capital adds to the organisation and the method(s) with which to assess the value of this
contribution. It also provides insight into those areas which can be benchmarked, using this
technique to evaluate the efficiency of the applied capital.
UUnniivveerrssiittyy ooff PPrreettoorriiaa eettdd –– KKaasssseellmmaann,, RR ((22000066))

University of Pretoria Kasselman, R
(2006)
195
For the organisation and stakeholders of the organisation, the framework enables organisations to
assess their present organisational effectiveness and efficiency in applying the Human Resources of
the organisation. It also provides insight into information regarding the application of human assets
within an organisation, comparative by industry.
For researchers the benefits of the study are:
• A framework for Human Capital Reporting developed through literature review and empirical
research.
• A framework that assists in linking metrics and business reporting requirements to allow
organisations to extract value from their Human Capital.
The study identified areas for further study (e.g. developing a calculator for Human Assets as a line
item on the balance sheet).
The body of knowledge on reporting for Human Capital and human resource management has
expanded due to the findings of this research and serves as a contribution to the theory and research
base of the field of organisational behaviour.
8.4 Recommendations for future work
This study was explorative and identified the need for further studies pertaining to reporting Human
Assets and related areas. A brief statement of possible areas for future work includes formulating
hypotheses for:
• The variables included in the HC framework are not significantly different in different industries.
• The HC framework does not include country specific issues and thus cannot be applied globally.
• A Human Capital Balance Chart of Accounts based on the principles of the report as identified in
this study allows for a line item calculation in company Chart of Accounts.
UUnniivveerrssiittyy ooff PPrreettoorriiaa eettdd –– KKaasssseellmmaann,, RR ((22000066))

University of Pretoria Kasselman, R
(2006)
196
• Lastly, an evaluation of the new role required of HR practitioners i.e. development of an adjusted
job profile for Human Resource Practitioners should be investigated and tested.
8.5 Limitations of the present study
Due to the limited experience and knowledge on this subject, a full model for the calculation of
Human Assets as a line item could not be completed and tested. The suggested framework
developed during this study allows for reporting and proposes a model that may be considered as an
exploratory step in such a calculation. The limitation is due to information of a qualifiable nature that
is 1) lacking and 2) not linked to the specific impact on an organisation.
A further limitation is that not all industries in South Africa are represented. Organisations who have
implemented some form of HR accounting are limited, and the number of HR consultants and
students with a detailed understanding of this topic even more so. This has narrowed the sample
size considerably.
Companies who have implemented more than just internal HR reporting could not be found and thus,
this study, by default, was influenced predominantly by the literature reviews and global case
studies. Even in global studies, there are several obvious weaknesses in applying HR metrics into
an acceptable accounting framework.
The discussions with respondents lack an explicit understanding that takes into account the
complexity of the interdisciplinary nature of Human Resource accounting. This is further
complicated due to the sensitivity of the nature of the topic which is considered by most as either
confidential or highly sensitive and of a competitive advantage.
To counter these limitations in the current study, the researcher took into account the very simple
question “who benefits” throughout the analyses. Although the researcher was not able to test the
model in a “real” environment although there is no question that the model can be tested and will
yield satisfactory results, and recommendations for future studies are to use evaluation research to
focus on the implementation of this model in companies.
UUnniivveerrssiittyy ooff PPrreettoorriiaa eettdd –– KKaasssseellmmaann,, RR ((22000066))

University of Pretoria Kasselman, R
(2006)
197
ADDENDUM A - TERMS AND DEFINITIONS
GAAP - Generally Accepted Accounting Principles - These are accounting guidelines, formulated by
the CICA’s (Canadian Institute of Chartered Accountants) Accounting Standards Committee, that
govern how businesses report their financial statements to the public. These rules, conventions, and
procedures define accepted accounting practices.
GAAP are a combination of authoritative standards (set by policy boards) and simply the commonly
accepted ways of recording and reporting accounting information.
(http://www.finance.gov.ab.ca/business/ahstf/glossary.html#g)
BALANCED SCORECARD - A technique for measuring organisational success and identifying
areas for improvement and action. The idea of the balanced scorecard came from management
theorists Robert Kaplan and David Norton, who recognised that organisations often focused too
much on financial criteria for performance management, thereby neglecting other features that help
to deliver competitive advantage. Their solution was to devise a method by which managers can
translate their vision into clear measures of success through balancing the financial perspective with
three other, equally important perspectives: the customer, the internal processes, and innovation
and learning. Each perspective requires the managers to identify different factors that are critical to
success, and to devise key performance measures for these factors. The resultant ‘balanced
scorecard’ will be a template for the organisation to evaluate its overall performance and identify
areas of strength and weakness (Heery and Noon, 2001).
AFFIRMATIVE ACTION - is the term used to describe initiatives designed to promote equal
opportunity and redress the existing disadvantage experienced by some groups. It is a combination
of both positive action and positive discrimination.
ACOP - Approved Code of Practice - Issued by the Health and Safety Executive under the health
and safety regulations, ACOPs are designed to provide detailed guidance to employers on how to
comply with health and safety law. Like other statutory codes of practice they are not legally binding,
but a failure to comply with the code may be used as evidence against an employer by a court of law.
UUnniivveerrssiittyy ooff PPrreettoorriiaa eettdd –– KKaasssseellmmaann,, RR ((22000066))

University of Pretoria Kasselman, R
(2006)
198
BALANCE SHEET - in formal bookkeeping and accounting, a statement of the book value of a
business or other organisation or person at a particular date, often at the end of its "fiscal year," as
distinct from an income statement, also known as a profit and loss account (P&L), which records
revenue and expenses over a specified period of time.
A balance sheet is often described as a "snapshot" of the company's financial condition on a given
date. Of the four basic financial statements, the balance sheet is the only statement which applies to
a single point in time, instead of a period of time. A modern balance sheet usually has three parts:
assets, liabilities and shareholders' equity. The main categories of assets are usually listed first and
are followed by the liabilities. The difference between the assets and the liabilities is known as the
'net assets' or the 'net worth' of the company.
CIPD (Chartered Institute of Personnel and Development) - A professional association for
personnel/human resource practitioners in the UK. It offers advice and support to its members as
well as promoting good practice and providing the accreditation for professional training courses and
qualifications in personnel management. However, unlike other professions, such as accountancy,
personnel/HR specialists are not obliged to become members of the CIPD, or to take professional
qualifications; however firms may insist on CIPD membership and qualifications for their personnel
staff. This was formerly titled the Institute of Personnel Management (IPM) but merged with the
Institute of Training and Development in 1994 and became the Institute of Personnel and
Development (IPD).
COMPENSATION - is payment for work which ‘compensates’ the employee for the ‘disutility’ of
labour. The rather negative connotation associated with the term has led some personnel specialists
to replace it with reward or reward management. ‘Compensation’ and ‘compensation and benefits’—
‘comp-and-ben’ - are also used to refer to the specialist activity involved in administering and
managing remuneration systems and to the specialist group of managers who have responsibility for
this area.
COMPETENCY BASED APPROACH - to managing people focuses on the skills and talents needed
to be able to perform a particular task to a certain standard. The assessment of competencies is
useful for various aspects of the management of Human Resources: setting standards of
performance that can be expected from employees and appraising them against such standards;
assessing the training and development needs of individual employees; and identifying the skills,
UUnniivveerrssiittyy ooff PPrreettoorriiaa eettdd –– KKaasssseellmmaann,, RR ((22000066))

University of Pretoria Kasselman, R
(2006)
199
abilities, and characteristics needed when recruiting and selecting new employees. Competency
may be broken down into two categories: behaviour-based or work-based. Behaviour-based
competencies are personal characteristics/attributes that contribute to effective job performance (for
example, interpersonal skills, attitudes, motivation). Work-based competencies are specific skills
and abilities required to perform the job to a specific standard (for example, the use of spreadsheet
software, and fluency in spoken Zulu, management of a budget). A focus on competency not only
allows for the development of employees, it also provides a new means of rewarding people; thus
there has been a growing interest in systems of competence-based pay.
CORPORATE GOVERNANCE - the control and organisation of private corporations. It is an issue
of relevance to human resource management for two reasons. First, it is argued with increasing
frequency that national systems of corporate governance shape the pattern of employment relations
within the economy. In the UK, the system of corporate governance emphasises accountability to
shareholders and there is an active market for corporate control that encourages firms to seek a high
return on investment. These features of corporate governance, in turn, are said to encourage
short-term and an opportunist or adversarial approach to workforce management. Continental
Europe systems exist that allow for worker participation in company management through works
councils and worker directors as a measure of good corporate governance. This is also largely
legislated in the USA through the Sarbanes-Oxley Act whilst guidance is offered in South Africa
through the King Report and King II Report.
CFROI (cash flow return on investment) - is a one-year spot performance measure that uses only
current year financial information. In its simplest form, CFROI is an estimate of a company’s
achieved real rate of return. The calculation can be performed using a financial calculator where the
inputs are: N - Asset Life: An estimate of how long a business’ productive assets will generate cash.
PMT - Operating Cash Flow: Operating cash flow measures the cash produced by a business
before financing and unusual items. PV - Inflation-Adjusted Gross Assets: measures the original
or cumulative investment in the business. FV - Non-Depreciating Assets: represents the “terminal
value” of a business e.g. land, investments, and current assets less current liabilities.
ETHNICITY - is the concept of categorising a person according to his or her ethnic group or origin.
An ethnic group has a shared history and a cultural tradition of its own. These features are usually
identified through characteristics such as a common geographical origin, a common language, a
common literature, and a common religion or belief system. Normally an ethnic group will be a
UUnniivveerrssiittyy ooff PPrreettoorriiaa eettdd –– KKaasssseellmmaann,, RR ((22000066))
University of Pretoria Kasselman, R
(2006)
200
minority within a larger community. Because an ethnic group is a cultural construct, it is constantly
changing and developing, thereby creating its own identity and redefining itself. This term
encompasses the dynamic nature of a social group, and is used to replace the fixed and somewhat
discredited concept of race.
HUMAN CAPITAL THEORY - is based on the assumption that individuals can affect their value in
the labour market by choosing whether or not to take advantage of educational opportunities and
training. If they do so, they increase their Human Capital and consequently will increase their value
to employers. Human Capital theory suggests employees should be treated as individuals with
specific sets of skills and abilities, so it emphasises competence-based pay as an effective
remuneration system. Proponents argue this leads to a very meritocratic system and helps to
achieve equal opportunities based on talent and ability, and regulated by a market economy.
HUMAN RESOURCE ACCOUNTING - is the technique of treating expenditure on the development
of employees as capital investment. Accountants are frequently dismissive of this, arguing that it is
impossible to put a monetary value on human assets that would be generally acceptable. Another
ethical consideration is whether free human beings should be regarded as assets in the same way
as legally owned property.
IiP (Investors in People) - a national standard of action and excellence in the UK. It specifies good
practice for improving an organisation’s performance through its people, thus making such
organisations attractive for employees to work in. Organisations applying for the IiP award must (1)
demonstrate commitment to invest in people to achieve business goals; (2) undertake planning
about how skills, individuals, and teams are to be developed to achieve these goals; (3) take action
to develop and use necessary skills in a well-defined and continuing programme directly tied to
business objectives; and (4) constantly evaluate outcomes of training and development in terms of
employee progress towards goals, the value achieved, and future needs.
In theory, it is designed to raise the standard of training and development in UK organisations, but in
practice research reveals a mixed picture of success. Some organisations are fully committed to
training and developing their employees, and are convinced that it will lead to improvements in
performance. Others do the minimum possible to achieve the IiP recognition because they believe it
is good for the company image, but will have little impact on performance.
UUnniivveerrssiittyy ooff PPrreettoorriiaa eettdd –– KKaasssseellmmaann,, RR ((22000066))

University of Pretoria Kasselman, R
(2006)
201
JOB FAMILY - set of jobs based around common activities but conducted at different levels of the
organisation. For example, a finance and accounting job family could embrace junior finance
officers, senior accountants, and the finance director of the enterprise. A job family may form the
basis of an integrated pay structure, such that all jobs within the family are managed using a
common set of pay rules and procedures. The reason for basing pay on job families is that it allows
rates of pay for each family identified to be set with regard to the external labour market. For
example, the rates of pay for those within the finance job family can reflect the going rate for
accountants and finance directors, with different rates of pay being established for those in other job
families, such as operations or personnel management.
KNOWLEDGE-BASED COMPANIES - organisations whose success derives from their ability to
create new knowledge, and use this as the basis for new products and services. Within the
organisation, the emphasis is on ‘knowledge management’ whereby the processes and operations
of the organisation are directed towards the creation of knowledge and its dissemination throughout
the organisation. Essential to these processes are employees at all levels whose ideas and insights
form the basis of knowledge creation, and provide the potential competitive advantage for the
organisation. The idea of the knowledge-creating company has been developed by management
theorists Ikojiro Nonaka and Hirotaka Takenchi, who drew upon Japanese companies such as
Matsushita, NEC, and Kao to substantiate their arguments.
SUCCESSION PLANNING - is the process of ensuring that managerial posts are filled with effective
managers through either identifying and developing talent with the organisation (through career
management), or recruiting suitable people from outside the organisation. The process should be
proactive, in the sense that it should include planning for both certainties—such as retirement—and
eventualities such as resignation and vacancies as a result of internal promotions or transfers.
NETT CURRENT ASSETS - (also called working capital) refers to the total of current assets less
the total of current liabilities.
NUMERICAL FLEXIBILITY - the policy of ensuring that the appropriate amount of labour is
employed for the needs of the organisation. This may involve putting people on a variety of contracts
to ensure that fluctuations in the demand for employees across the working day, week, or year are
matched with the appropriate supply of labour. The most common forms of numerical flexibility are:
(1) part-time working, (2) temporary/fixed-term contracts, (3) subcontracting.
UUnniivveerrssiittyy ooff PPrreettoorriiaa eettdd –– KKaasssseellmmaann,, RR ((22000066))

University of Pretoria Kasselman, R
(2006)
202
PEST analysis - an audit of an organisation’s environmental influences with the purpose of using this
information to guide strategic decision-making. The PEST technique involves assessing four sets of
factors: Political/legal, Economic, Socio-cultural, and Technological. The assumption is that if the
organisation is able to audit its current environment and assess potential changes, it will be better
placed than its competitors to respond to changes.
SHARED SERVICES - typically HR administrative services that are consolidated in a service centre
and accessed by managers from different business divisions and strategic business units via
different channels such as telephone or intranet (self-service). In large multinational companies
shared services may be provided from a single centre to staff across the globe, with service centre
staff fielding inquiries and offering advice on a broad range of company policy, procedures or general
HR activities.
TACIT SKILLS - or tacit knowledge are acquired through experience in an organisation and arise
from detailed familiarity with equipment, procedures, co-workers, and customers. One of the
justifications for employee participation is that it allows managers to draw upon these tacit skills and
feed them into the decision-making process.
TOTAL REMUNERATION - consists of three elements. The first is base pay, expressed as an
hourly rate or annual salary. The second is variable pay, which consists of additional supplements,
bonuses, and other payments that typically are linked to performance. The third component is
benefits or indirect pay, including cash payments like occupational sick pay and maternity pay and
non-cash awards like paid holidays and health insurance. Increasingly it is recommended that
companies calculate and manage total remuneration for each employee as a means of securing
tighter control of labour costs.
ZERO BASED BUDGETING - a technique that requires departmental managers to propose and
justify their entire budget for the year. It is a planning system that assumes the starting point for each
year is no budget, rather than the traditional method of using the previous year’s budget as the
baseline.
UUnniivveerrssiittyy ooff PPrreettoorriiaa eettdd –– KKaasssseellmmaann,, RR ((22000066))
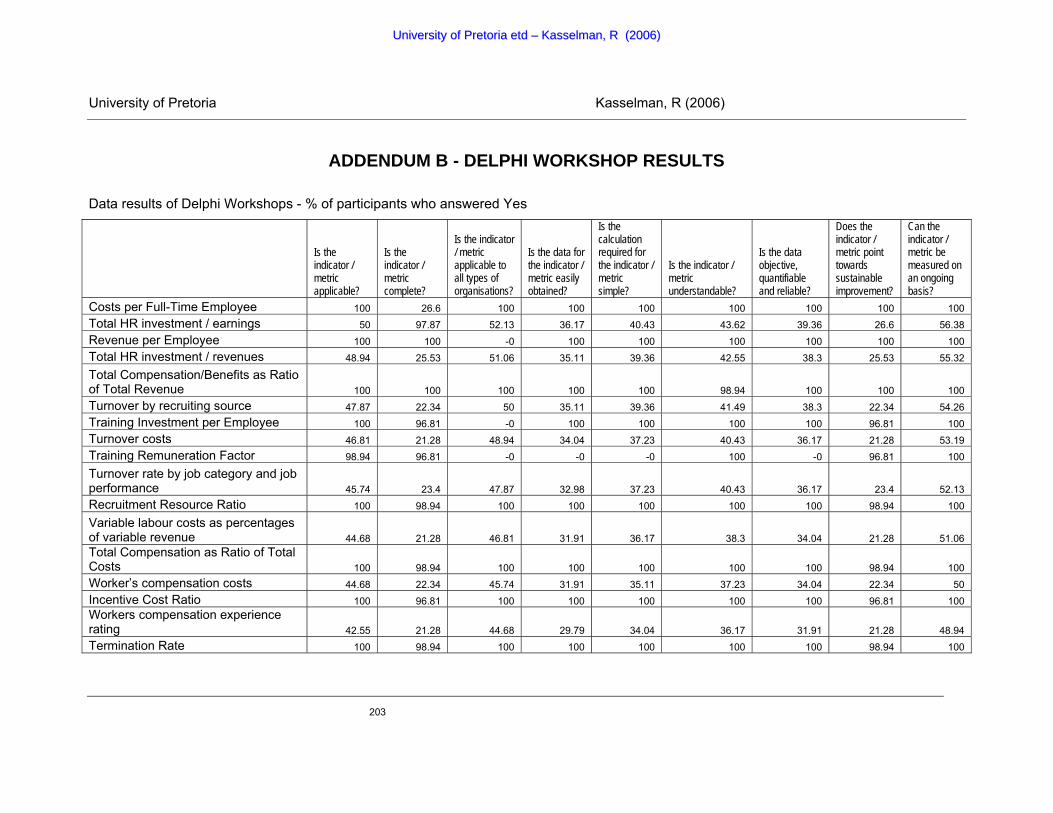
University of Pretoria Kasselman, R (2006)
203
ADDENDUM B - DELPHI WORKSHOP RESULTS
Data results of Delphi Workshops - % of participants who answered Yes
Is the indicator / metric applicable?
Is the indicator / metric complete?
Is the indicator / metric applicable to all types of organisations?
Is the data for the indicator / metric easily obtained?
Is the calculation required for the indicator / metric simple?
Is the indicator / metric understandable?
Is the data objective, quantifiable and reliable?
Does the indicator / metric point towards sustainable improvement?
Can the indicator / metric be measured on an ongoing basis?
Costs per Full-Time Employee 100 26.6 100 100 100 100 100 100 100 Total HR investment / earnings 50 97.87 52.13 36.17 40.43 43.62 39.36 26.6 56.38 Revenue per Employee 100 100 -0 100 100 100 100 100 100 Total HR investment / revenues 48.94 25.53 51.06 35.11 39.36 42.55 38.3 25.53 55.32
Total Compensation/Benefits as Ratio of Total Revenue 100 100 100 100 100 98.94 100 100 100 Turnover by recruiting source 47.87 22.34 50 35.11 39.36 41.49 38.3 22.34 54.26 Training Investment per Employee 100 96.81 -0 100 100 100 100 96.81 100 Turnover costs 46.81 21.28 48.94 34.04 37.23 40.43 36.17 21.28 53.19 Training Remuneration Factor 98.94 96.81 -0 -0 -0 100 -0 96.81 100
Turnover rate by job category and job performance 45.74 23.4 47.87 32.98 37.23 40.43 36.17 23.4 52.13 Recruitment Resource Ratio 100 98.94 100 100 100 100 100 98.94 100
Variable labour costs as percentages of variable revenue 44.68 21.28 46.81 31.91 36.17 38.3 34.04 21.28 51.06 Total Compensation as Ratio of Total Costs 100 98.94 100 100 100 100 100 98.94 100 Worker’s compensation costs 44.68 22.34 45.74 31.91 35.11 37.23 34.04 22.34 50 Incentive Cost Ratio 100 96.81 100 100 100 100 100 96.81 100 Workers compensation experience rating 42.55 21.28 44.68 29.79 34.04 36.17 31.91 21.28 48.94 Termination Rate 100 98.94 100 100 100 100 100 98.94 100
UUnniivveerrssiittyy ooff PPrreettoorriiaa eettdd –– KKaasssseellmmaann,, RR ((22000066))

University of Pretoria Kasselman, R (2006)
204
Is the indicator / metric applicable?
Is the indicator / metric complete?
Is the indicator / metric applicable to all types of organisations?
Is the data for the indicator / metric easily obtained?
Is the calculation required for the indicator / metric simple?
Is the indicator / metric understandable?
Is the data objective, quantifiable and reliable?
Does the indicator / metric point towards sustainable improvement?
Can the indicator / metric be measured on an ongoing basis?
Access to business information to facilitate decision making 43.62 18.09 45.74 29.79 34.04 36.17 31.91 18.09 47.87 EE Movements 100 96.81 100 100 100 100 100 96.81 100 Adherence by the workforce to core values 41.49 17.02 43.62 28.72 34.04 35.11 30.85 17.02 46.81 Acceptance Rate 1.06 98.94 100 100 100 100 100 98.94 100
Average change in performance appraisal rating over time 40.43 15.96 42.55 28.72 31.91 34.04 30.85 15.96 45.74 Employee Commitment 100 98.94 100 -0 -0 100 -0 98.94 100 Change in employee mind-set 39.36 14.89 41.49 27.66 30.85 32.98 28.72 14.89 44.68 Employee Motivation 100 96.81 100 -0 -0 100 -0 96.81 100 Climate Surveys 38.3 13.83 40.43 26.6 30.85 31.91 28.72 13.83 43.62 Employee Satisfaction 100 96.81 100 -0 -0 100 -0 96.81 100
Consistency and clarity of messages from top management 37.23 11.7 39.36 26.6 29.79 30.85 27.66 11.7 42.55 Management Leadership 100 2.13 100 -0 -0 -0 -0 2.13 100 Customer Complaints / Praise 36.17 11.7 38.3 26.6 29.79 30.85 27.66 11.7 41.49 Knowledge Generation 100 -0 -0 -0 -0 100 -0 -0 100 Customer satisfaction with hiring process 35.11 9.57 37.23 26.6 29.79 30.85 27.66 9.57 40.43 Knowledge Integration 100 -0 100 -0 -0 100 -0 -0 100 Degree of financial literacy among employees 35.11 9.57 36.17 26.6 28.72 29.79 27.66 9.57 39.36 Knowledge Sharing 100 -0 -0 -0 -0 -0 -0 -0 100 Degree of race and gender by job category 34.04 10.64 35.11 24.47 26.6 27.66 25.53 10.64 38.3 Process Execution 98.94 96.81 100 100 100 100 100 96.81 100 Dealing with poor performers 34.04 7.45 35.11 23.4 25.53 26.6 24.47 7.45 37.23 Retention of Key People 100 98.94 100 100 100 100 100 98.94 100
UUnniivveerrssiittyy ooff PPrreettoorriiaa eettdd –– KKaasssseellmmaann,, RR ((22000066))

University of Pretoria Kasselman, R (2006)
205
Is the indicator / metric applicable?
Is the indicator / metric complete?
Is the indicator / metric applicable to all types of organisations?
Is the data for the indicator / metric easily obtained?
Is the calculation required for the indicator / metric simple?
Is the indicator / metric understandable?
Is the data objective, quantifiable and reliable?
Does the indicator / metric point towards sustainable improvement?
Can the indicator / metric be measured on an ongoing basis?
Employee Commitment Survey Scores 31.91 6.38 34.04 23.4 26.6 26.6 24.47 6.38 36.17 Relational Capital 100 2.13 100 -0 -0 -0 -0 2.13 100 Employee competency growth 31.91 5.32 32.98 22.34 24.47 24.47 23.4 5.32 35.11 Structural Capital 100 -0 100 -0 -0 -0 100 -0 100 Employee development opportunities 30.85 6.38 31.91 23.4 24.47 24.47 23.4 6.38 34.04 Value Alignment 100 -0 100 -0 -0 100 -0 -0 100
Employee turnover by performance level and controllability 28.72 3.19 30.85 21.28 22.34 22.34 21.28 3.19 32.98
Absenteeism rate by job category and job performance 100 98.94 100 100 100 100 100 98.94 100 Extent of cross-functional teamwork 28.72 2.13 30.85 21.28 22.34 22.34 21.28 2.13 31.91 Accident Costs 100 98.94 100 100 100 100 100 98.94 100 Extent of Organisational Learning 27.66 1.06 29.79 19.15 20.21 20.21 19.15 1.06 30.85 Accident safety ratings 100 98.94 100 100 100 100 100 98.94 100
Extent of understanding of the firm’s competitive strategy 26.6 1.06 27.66 20.21 21.28 21.28 20.21 1.06 29.79 Average employee tenure (by performance level) 88.3 93.62 90.43 73.4 77.66 86.17 80.85 93.62 97.87 Ready access to the information and knowledge 25.53 1.06 26.6 19.15 20.21 20.21 19.15 1.06 28.72 Average time for dispute resolution 88.3 92.55 89.36 72.34 76.6 84.04 78.72 92.55 96.81
Required employee competencies are reflected in recruiting 23.4 1.06 25.53 19.15 20.21 20.21 19.15 1.06 27.66
Benefits costs as a percentage of payroll or revenue 86.17 90.43 88.3 71.28 75.53 84.04 78.72 90.43 95.74
Employees are clear about the firm’s goals and objectives 23.4 3.19 24.47 18.09 19.15 19.15 18.09 3.19 26.6 Benefits costs/competitors’ benefits 85.11 87.23 87.23 69.15 73.4 81.91 76.6 87.23 94.68
UUnniivveerrssiittyy ooff PPrreettoorriiaa eettdd –– KKaasssseellmmaann,, RR ((22000066))

University of Pretoria Kasselman, R (2006)
206
Is the indicator / metric applicable?
Is the indicator / metric complete?
Is the indicator / metric applicable to all types of organisations?
Is the data for the indicator / metric easily obtained?
Is the calculation required for the indicator / metric simple?
Is the indicator / metric understandable?
Is the data objective, quantifiable and reliable?
Does the indicator / metric point towards sustainable improvement?
Can the indicator / metric be measured on an ongoing basis?
costs ratio Extent to which employees are clear about their own goals 23.4 3.19 23.4 17.02 17.02 18.09 17.02 3.19 25.53
Compliance with fair employment practices / industry charter 84.04 88.3 86.17 71.28 75.53 82.98 77.66 88.3 93.62 Reward knowledge creation and sharing 21.28 1.06 22.34 15.96 17.02 17.02 15.96 1.06 24.47
Compliance with technical requirement of affirmative action 82.98 87.23 85.11 68.09 71.28 78.72 73.4 87.23 92.55
HR is helping to develop necessary leadership competencies 20.21 1.06 21.28 17.02 18.09 18.09 17.02 1.06 23.4 Comprehensiveness of safety monitoring 82.98 88.3 87.23 68.09 73.4 79.79 74.47 88.3 91.49
HR does a thorough job of pre-requisition soft-asset 18.09 1.06 20.21 15.96 15.96 15.96 14.89 1.06 22.34
Compensation of high performers compared to average performers 82.98 86.17 85.11 65.96 70.21 77.66 73.4 86.17 90.43 HR leadership is involved early in selection 18.09 1.06 20.21 14.89 15.96 15.96 14.89 1.06 21.28 Cost of HR-related litigation 80.85 86.17 82.98 65.96 70.21 77.66 71.28 86.17 89.36
Extent to which HR measurement systems are seen as credible 18.09 2.13 20.21 13.83 13.83 14.89 14.89 2.13 20.21 Cost of injuries 81.91 85.11 82.98 64.89 69.15 76.6 71.28 85.11 89.36
Information is communicated effectively to employees 15.96 2.13 19.15 13.83 14.89 14.89 13.83 2.13 19.15 Cost per grievance 78.72 55.32 81.91 65.96 70.21 77.66 72.34 55.32 88.3
Average employee can describe the firm’s HR strategy 15.96 2.13 18.09 12.77 13.83 13.83 12.77 2.13 18.09 Cost per hire 77.66 82.98 80.85 63.83 68.09 74.47 69.15 82.98 87.23
UUnniivveerrssiittyy ooff PPrreettoorriiaa eettdd –– KKaasssseellmmaann,, RR ((22000066))
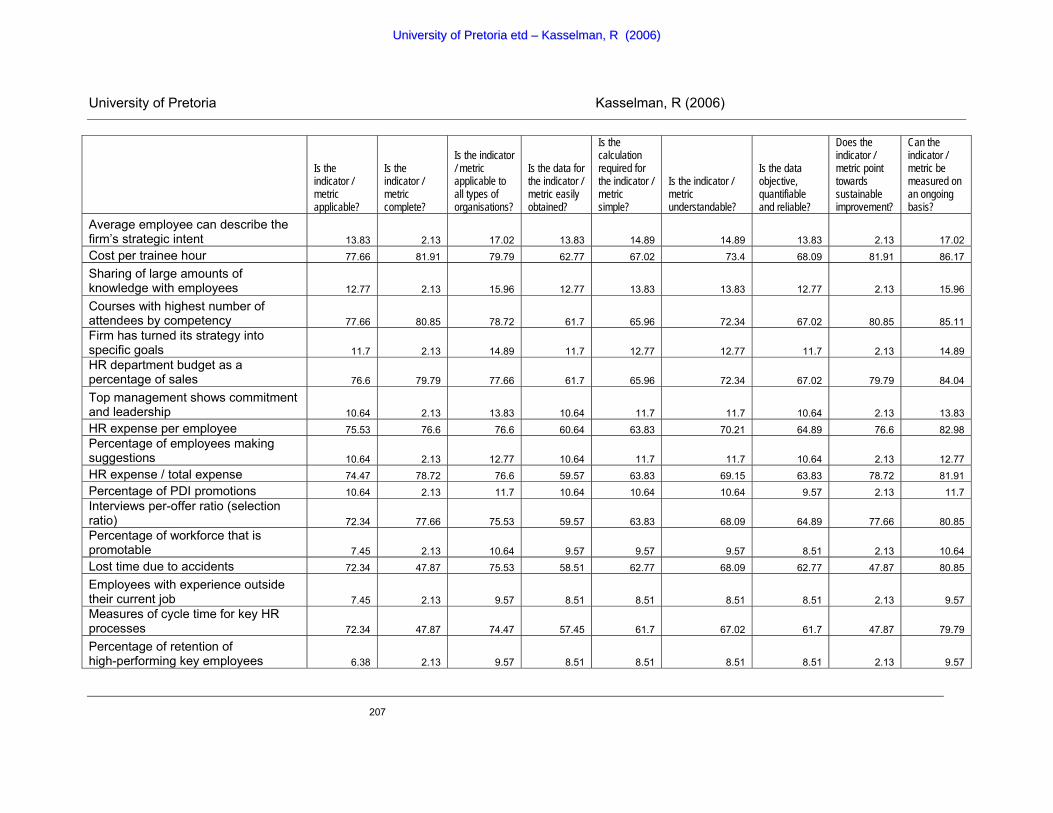
University of Pretoria Kasselman, R (2006)
207
Is the indicator / metric applicable?
Is the indicator / metric complete?
Is the indicator / metric applicable to all types of organisations?
Is the data for the indicator / metric easily obtained?
Is the calculation required for the indicator / metric simple?
Is the indicator / metric understandable?
Is the data objective, quantifiable and reliable?
Does the indicator / metric point towards sustainable improvement?
Can the indicator / metric be measured on an ongoing basis?
Average employee can describe the firm’s strategic intent 13.83 2.13 17.02 13.83 14.89 14.89 13.83 2.13 17.02 Cost per trainee hour 77.66 81.91 79.79 62.77 67.02 73.4 68.09 81.91 86.17
Sharing of large amounts of knowledge with employees 12.77 2.13 15.96 12.77 13.83 13.83 12.77 2.13 15.96
Courses with highest number of attendees by competency 77.66 80.85 78.72 61.7 65.96 72.34 67.02 80.85 85.11 Firm has turned its strategy into specific goals 11.7 2.13 14.89 11.7 12.77 12.77 11.7 2.13 14.89 HR department budget as a percentage of sales 76.6 79.79 77.66 61.7 65.96 72.34 67.02 79.79 84.04
Top management shows commitment and leadership 10.64 2.13 13.83 10.64 11.7 11.7 10.64 2.13 13.83 HR expense per employee 75.53 76.6 76.6 60.64 63.83 70.21 64.89 76.6 82.98 Percentage of employees making suggestions 10.64 2.13 12.77 10.64 11.7 11.7 10.64 2.13 12.77 HR expense / total expense 74.47 78.72 76.6 59.57 63.83 69.15 63.83 78.72 81.91 Percentage of PDI promotions 10.64 2.13 11.7 10.64 10.64 10.64 9.57 2.13 11.7 Interviews per-offer ratio (selection ratio) 72.34 77.66 75.53 59.57 63.83 68.09 64.89 77.66 80.85 Percentage of workforce that is promotable 7.45 2.13 10.64 9.57 9.57 9.57 8.51 2.13 10.64 Lost time due to accidents 72.34 47.87 75.53 58.51 62.77 68.09 62.77 47.87 80.85
Employees with experience outside their current job 7.45 2.13 9.57 8.51 8.51 8.51 8.51 2.13 9.57 Measures of cycle time for key HR processes 72.34 47.87 74.47 57.45 61.7 67.02 61.7 47.87 79.79
Percentage of retention of high-performing key employees 6.38 2.13 9.57 8.51 8.51 8.51 8.51 2.13 9.57
UUnniivveerrssiittyy ooff PPrreettoorriiaa eettdd –– KKaasssseellmmaann,, RR ((22000066))

University of Pretoria Kasselman, R (2006)
208
Is the indicator / metric applicable?
Is the indicator / metric complete?
Is the indicator / metric applicable to all types of organisations?
Is the data for the indicator / metric easily obtained?
Is the calculation required for the indicator / metric simple?
Is the indicator / metric understandable?
Is the data objective, quantifiable and reliable?
Does the indicator / metric point towards sustainable improvement?
Can the indicator / metric be measured on an ongoing basis?
Number of applicants per recruiting source (by quality) 70.21 47.87 73.4 57.45 61.7 67.02 61.7 47.87 78.72
Consistent and equitable treatment of all employees 6.38 -0 8.51 7.45 7.45 7.45 7.45 -0 8.51 Number of hires per recruiting source (by quality) 69.15 46.81 72.34 55.32 59.57 64.89 59.57 46.81 77.66 Performance of newly hired applicants 5.32 -0 7.45 7.45 7.45 7.45 7.45 -0 7.45 Number of courses taught by subject 68.09 43.62 71.28 55.32 59.57 63.83 58.51 43.62 76.6
Planned development opportunities accomplished 4.26 -0 6.38 6.38 6.38 6.38 6.38 -0 6.38
Number of recruiting advertising programs in place 67.02 42.55 70.21 53.19 57.45 62.77 57.45 42.55 75.53
Ratio of HR employees to total employment workforce 3.19 2.13 5.32 5.32 5.32 5.32 5.32 2.13 5.32
Number of safety training and awareness activities 67.02 43.62 69.15 52.13 56.38 61.7 56.38 43.62 74.47 Requests for transfer per supervisor 1.06 -0 4.26 4.26 4.26 4.26 4.26 -0 4.26 Number of poor performers who left per level 67.02 42.55 69.15 52.13 56.38 61.7 56.38 42.55 74.47 Retention rates of critical human capital 2.13 -0 3.19 3.19 3.19 3.19 3.19 -0 3.19 Number of stress-related illnesses 64.89 40.43 67.02 50 54.26 59.57 54.26 40.43 72.34 Success rate of external hires 2.13 -0 2.13 2.13 2.13 2.13 2.13 -0 2.13 Number of training days and programs per year 65.96 42.55 65.96 50 54.26 58.51 54.26 42.55 71.28 Survey results on becoming “the” employer 1.06 2.13 1.06 1.06 1.06 1.06 1.06 2.13 1.06 Offer-to-acceptance ratio 63.83 39.36 65.96 50 54.26 58.51 54.26 39.36 71.28
UUnniivveerrssiittyy ooff PPrreettoorriiaa eettdd –– KKaasssseellmmaann,, RR ((22000066))
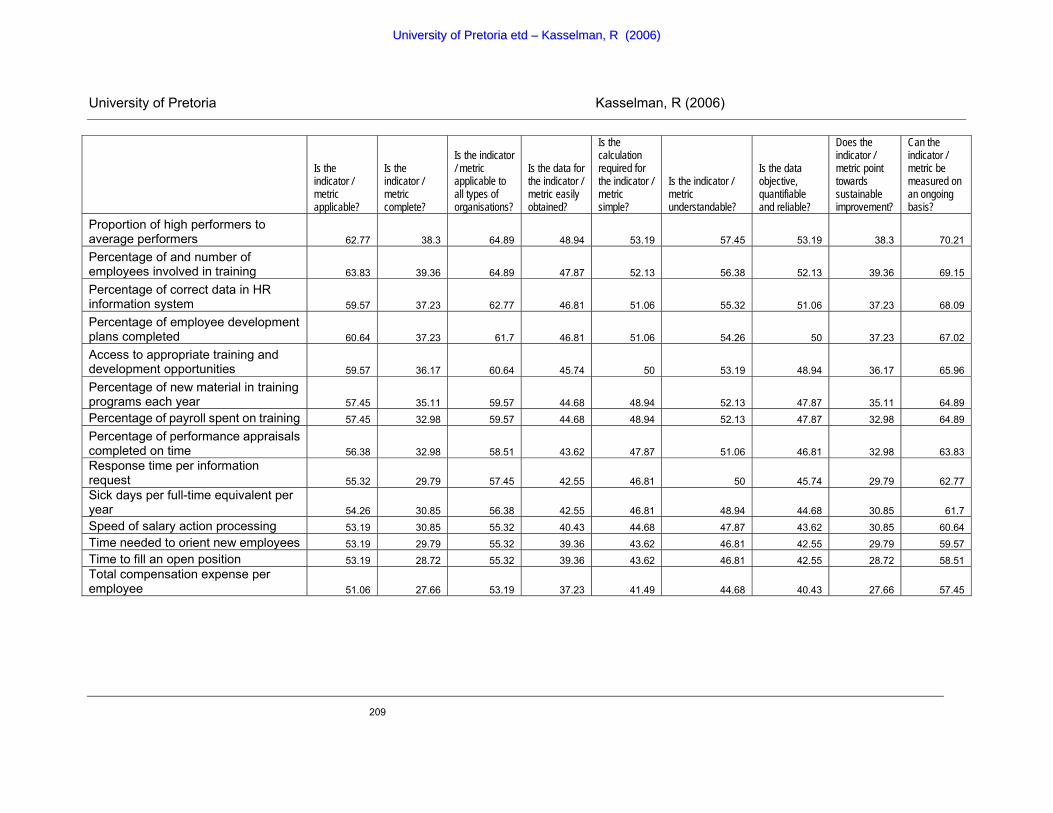
University of Pretoria Kasselman, R (2006)
209
Is the indicator / metric applicable?
Is the indicator / metric complete?
Is the indicator / metric applicable to all types of organisations?
Is the data for the indicator / metric easily obtained?
Is the calculation required for the indicator / metric simple?
Is the indicator / metric understandable?
Is the data objective, quantifiable and reliable?
Does the indicator / metric point towards sustainable improvement?
Can the indicator / metric be measured on an ongoing basis?
Proportion of high performers to average performers 62.77 38.3 64.89 48.94 53.19 57.45 53.19 38.3 70.21
Percentage of and number of employees involved in training 63.83 39.36 64.89 47.87 52.13 56.38 52.13 39.36 69.15
Percentage of correct data in HR information system 59.57 37.23 62.77 46.81 51.06 55.32 51.06 37.23 68.09
Percentage of employee development plans completed 60.64 37.23 61.7 46.81 51.06 54.26 50 37.23 67.02
Access to appropriate training and development opportunities 59.57 36.17 60.64 45.74 50 53.19 48.94 36.17 65.96
Percentage of new material in training programs each year 57.45 35.11 59.57 44.68 48.94 52.13 47.87 35.11 64.89 Percentage of payroll spent on training 57.45 32.98 59.57 44.68 48.94 52.13 47.87 32.98 64.89
Percentage of performance appraisals completed on time 56.38 32.98 58.51 43.62 47.87 51.06 46.81 32.98 63.83 Response time per information request 55.32 29.79 57.45 42.55 46.81 50 45.74 29.79 62.77 Sick days per full-time equivalent per year 54.26 30.85 56.38 42.55 46.81 48.94 44.68 30.85 61.7 Speed of salary action processing 53.19 30.85 55.32 40.43 44.68 47.87 43.62 30.85 60.64 Time needed to orient new employees 53.19 29.79 55.32 39.36 43.62 46.81 42.55 29.79 59.57 Time to fill an open position 53.19 28.72 55.32 39.36 43.62 46.81 42.55 28.72 58.51 Total compensation expense per employee 51.06 27.66 53.19 37.23 41.49 44.68 40.43 27.66 57.45
UUnniivveerrssiittyy ooff PPrreettoorriiaa eettdd –– KKaasssseellmmaann,, RR ((22000066))

University of Pretoria Kasselman, R
(2006)
210
LIST OF REFERENCES
Allan, G. & Skinner, C. 1991. Handbook for Research students in the social sciences. Abingdon:
Routledge: Falmer Press.
Anon. 1992. What is the Skandia Navigator? Description [Online] Available from: .
http://www.valuebasedmanagement.net/methods_skandianavigator.html [Accessed:
2005-10-15].
Arthur, J.B. 1992. The link between business strategy and industrial relations. Industrial and
Labour Relations Review, (45):488-506.
Arthur, J.B. 1994. Effects of human resource systems in manufacturing performance and
turnover. Academy of Management Journal, (37):670-687.
Baker, D.L. 1988. Doing Social Research. New York: McGraw-Hill.
Becker, B.A. Huselid, M. & Ulrich, D. 2001. The HR Scorecard: Linking People, Strategy, and
Performance. Boston: Harvard Business School Publishing.
Becker, G. 1994. Human Capital: A Theoretical and Empirical Analysis. Chicago: University of
Chicago Press.
Black, A. Wright, P. & Bachman, J.E. 1998. In search of shareholder value - managing drivers of
performance. Great Britain: Pitman Publishers.
Bogdan, R. & Taylor, S.J. 1975. Introduction to qualitative research methods: A
phenomenological approach to the social sciences. UK: John Wiley & Sons.
Bogdan, R. C. & Biklen, S. K. 1982. Qualitative research for education: An introduction to theory
UUnniivveerrssiittyy ooff PPrreettoorriiaa eettdd –– KKaasssseellmmaann,, RR ((22000066))

University of Pretoria Kasselman, R
(2006)
211
and methods. Needham Heights: Allyn & Bacon.
Boudreau, J.W. 1998. Strategic human resource management measures: key linkages and the
people advantage model. Working paper: 98-28. Centre for Advanced Human Resource
Studies, Cornell University.
Brown, G. 2002. Human Capital ROI Survey Results. Deloitte & Touche Research.
Brown, M.G. 1999. Human Capitals Measure for Measure. Journal for Quality and Participation,
Sept 29.
Bynner, J. & Stribley, K.M. 1978. Social research: principles and procedures. New York:
Longman Inc.
Cooper, D.R. & Schindler, P.S. 2001. Business research methods. Singapore: McGraw-Hill
International.
Corporate Research Foundation. 2003. South Africa's most promising companies. Cape Town:
Finance Week.
Crainer, S. 1995. The Financial Times Handbook of Management. Great Britain: Pitman
Publishing.
De Vos, A.S., Strydom, H., Fouche, C.B. & Delport C.S.L. 2002. Research at grass roots for the
social science and human services professions. Pretoria: Van Schaik Publishers.
Doorley, T.L. & Donovan, J.M. 1999. Value-creating Growth: how to lift your company to the next
level of performance. California: Jossey-Bass.
Drucker, P.F. 1995. Information Executives Truly Need, Harvard Business Review, January.
UUnniivveerrssiittyy ooff PPrreettoorriiaa eettdd –– KKaasssseellmmaann,, RR ((22000066))

University of Pretoria Kasselman, R
(2006)
212
Drucker, P.F. 1993. Post-Capitalist Society. New York: HarperCollins.
Drucker, P.F. 1999. Management Challenges for the 21st Century. New York: HarperCollins.
Eccles, R., Herz, R., Keegan, E. & Phillips, D.M.H. 2001. The Value Reporting Revolution. New
York: John Wiley and Sons.
ECEDG. 2000. Measurement of Intangible Assets and Associated Reporting Principles. UK:
ECEDG.
EFQM. 1992. EFQM Model. [Online] Available on http://www.efqm.org/Default.aspx?tabid=35
[Accessed: 2005-02-03].
Everingham, G.K. & Kleynhans, J.E. 1995. Introductory GAAP. Kenwyn:Juta & Co. Ltd.
Fitz-end, J. 1995. How to Measure Human Resource Management, 2nd ed, New York:
McGraw-Hill.
Fitz-end, J. 2000. The ROI of Human Capital: Measuring the economic value of employee
performance. New York: Amacom.
Flamholtz, E.G. 1985. Human resource accounting. San Francisco: Jossey-Bass.
Flamholz, E.G. 1999. Human Resource Accounting: Advances in Concepts, Methods and
Applications, 3rd ed. Amsterdam: Kluwer Academic Publishers.
Friedman, B., Hatch, J. & Walker, D. 1998. Delivering on the Promise: How to Attract, Manage
and Retain Human Capital. New York: Free Press.
Friedman, B. 1998. Delivering on the Promise: How to Attract Manage and Retain Human
UUnniivveerrssiittyy ooff PPrreettoorriiaa eettdd –– KKaasssseellmmaann,, RR ((22000066))

University of Pretoria Kasselman, R
(2006)
213
Capital. New York: Free Press.
Gilley, A.M., Callahan, G.L. & Blerema, L. 2003. Critical Issues in HRD: A New Agenda for the
Twenty-First Century. Cambridge: Perseus Publishing.
Grant, R.M. 1996. Prospering in Dynamically-competitive Environments: Organizational
Capability as Knowledge Integration. Organizational Science. 7(4):375-387.
Gratton, L. & Ghoshal, S. 2003. Managing personal human capital: new ethos for the ‘volunteer’
employee. European Management Journal, 21(1) February:1-10.
Gratton, L. 2000. Living Strategy: Putting people at the heart of corporate purpose, London:
Prentice Hall.
Group, N.G.R. 1998. Knowledge Measurement Phase Three: Global Survey findings report.
Journal of Systemic Knowledge Management, December
Guest, D.E., Michie, J, Conway, N & Sheehan, M. 2003. Human resource management and
corporate performance in the UK. British Journal of Industrial Relations, 41:291-314.
Gupta, U.G. & Clarke, R.E. 1996. Theory and Applications of the Delphi Technique: A
bibliography (1975-1994). Technological Forecasting and Social Change 53:185-211.
Guy, L.R. & Diehl, P.L. 1992. Research methods for business and management. New York:
Macmillan.
Guy, L.R., Diehl, P.L. & Huselid, M.A. 1995. The impact of human resource management
practices on turnover, productivity and corporate financial performance. Academy of
Management Journal, 635.
Hamel, G. & Prahalad, C.K. 1998. Strategic Flexibility: Managing in a Turbulent Environment.
UUnniivveerrssiittyy ooff PPrreettoorriiaa eettdd –– KKaasssseellmmaann,, RR ((22000066))

University of Pretoria Kasselman, R
(2006)
214
UK: John Wiley & Sons.
Hanafin, S. 2004. Review of literature on the Delphi Technique. Ohio: Kenyon College.
Harvey, M.G. & Lusch, R.F. 1999. Balancing the intellectual capital books: intangible liabilities.
European Management Journal, 17:29-41.
Heery, E. & Noon, M. 2001. A Dictionary of Human Resource Management. Oxford: Oxford
University Press.
Heskett, J.L., Sasser, W.E. & Schlesinger, L.A. 1994. The Service Profit Chain. Harvard
Business Review. Mar 1
Hirst, D.E., Koonce, L. & Miller, J. 1999. The joint effect of management’s credibility and the form
of their forecasts on investor judgment. Journal of Accounting Research Supplement:101-124.
Hirst, D.E., Koonce, L. & Simko, P. 1995. Investor reaction to financial analysts’ research.
Journal of Accounting Research, Autumm:335-351.
http://en.wikipedia.org/wiki/Asset. [Accessed: 2006-01-16].
Huselid, M.A. 1995. The impact of human resource management practices on turnover,
productivity and corporate financial performance. Academy of Management Journal,
38:635-670.
Huysamen, G.K. 1994. Methodology for the social and behavioural sciences. Halfway House:
ITP.
Ittner, C. D. & Larcker, D. F. 1998. Are non-financial measures leading indicators of financial
performance?: An analysis of customer satisfaction. Journal of Accounting Research, 36
(Supplement):1-36.
UUnniivveerrssiittyy ooff PPrreettoorriiaa eettdd –– KKaasssseellmmaann,, RR ((22000066))

University of Pretoria Kasselman, R
(2006)
215
Kaplan, R.S. & Norton, D.P. 1996. The Balanced Scorecard: Translating strategy into action.
Boston: Harvard Business School Press.
Kearns, P. 2003. HR Strategy: Business Focused, Individually Centred. New York:
Butterworth-Heinemann.
Kendrick, T. 2004. The Project Management Tool Kit: 100 Tips and Techniques for Getting the
Job Done Right. New York: Amacom.
Kerlinger, F.N. 1986. Foundations of behavioural research. New York: Holt Rinehart and
Winston.
King. 2004. The King II Report on Corporate Governance for South Africa. Pretoria: Government
Printers
Kunath, G. 2003. Creating value your customers will love, Leadership Series. [Online] Available
from http://www.executiveforum.net/kunath.html [Accessed: 2005-01-10].
Le Clerc, G., Moynagh, W.D. & Boisclair, J.P. 1996. Accountability, Performance Reporting,
Comprehensive Audit - An Integrated Perspective. Ottawa: CCAF-FCVI Inc.
Leedy, P.D. 1993. Practical Research. London: Prentice Hall.
Lester, T. 2002. Is HR measuring up?. Personnel Today. Vol. 035
Lev, B. 2001. Intangibles – Management, Measurement, and Reporting. Washington
D.C.:Brookings Institution Press.
Lord, B. 1996 “Strategic management accounting: The emperor's new clothes?” Management
Accounting Research, 7:347-366.
UUnniivveerrssiittyy ooff PPrreettoorriiaa eettdd –– KKaasssseellmmaann,, RR ((22000066))

University of Pretoria Kasselman, R
(2006)
216
Lord, R.E. 1998. Final report of the CICA task force on Standard Setting (TFOSS). [Online]
Available from
http://www.cica.ca/multimedia/DownloadLibrary/AbouttheCICA/CorporateGovernance/etfoss.p
df [Accessed: 2006-03-05].
Lovemore, F.C.H. & Brummer, L.M. 1993. The ABC of Financial Management. Pretoria: Van
Schaik Publishers.
Luthy, D.H. 1998. Intellectual capital and its measurement. [Online] Available from
http://www3.bus.osaka-cu.ac.jp/apira98/archives/htmls/25.htm [Accessed: 2005-03-15].
MacDuffie, J.P. 1995. Human resource bundles and manufacturing performance: Flexible
production systems in the world auto industry. Industrial Relations and Labor Review,
48:197-221.
Maines, L. A. 1996. An Experimental Examination of Subjective Forecast Combination.
International Journal of Forecasting, 12:223-233
Maines, L.E. & McDaniel, L.S. 2000. Effects of comprehensive-income characteristics on non
professional investors judgment -The role of financial-statement presentation format. The
Accounting Review, 75:200-201.
Marshall, C. & Rossman, G. B. 1980. Designing Qualitative Research. Thousand Oaks: Sage.
Mayo, A. 2001. The Human Value of the Enterprise: Valuing People as Assets. London:
Nicholas Brealey Publishing.
Mincer, J. 1958. Investment in Human Capital and Personal Income Distribution. The Journal of
Political Economy, August:281–302.
Monti-Belkaoui, J. & Riahi-Belkaoui, M. 1995. Human Resource Valuation: A Guide to Strategies
UUnniivveerrssiittyy ooff PPrreettoorriiaa eettdd –– KKaasssseellmmaann,, RR ((22000066))

University of Pretoria Kasselman, R
(2006)
217
and Techniques. Westport: Quorum Books.
Morey, D., Maybury, M. & Thuraisingham, B. (Eds.). 2000. Knowledge management: Classic
and contemporary works. Cambridge: MIT Press.
Mott, G. 2005. Accounting for Non-Accountants: A Manual for Managers and Students. 6th Ed.
US: Kogan Page Ltd.
Mouton, J. 2001. How to succeed in your Master’s and Doctoral Studies: A South African guide
and resource book. Pretoria: Van Schaik Publishers.
Nahapiet, J. & Ghoshal, S. 1998. Social capital, intellectual capital, and the organizational
advantage. Academy of Management Review, 23 (2):242-266.
Patton, MQ. 1987. How to Use Qualitative Methods in Evaluation. London: Sage Publications.
Pfau B.N. & Kay, I.T. 2001. The Human Capital Edge: 21 People Management Practices Your
Company Must Implement (or Avoid) to Maximize Shareholder Value. New York: McGraw-Hill.
Pfeffer, J. 1998. The human equation. Boston: HBS Press.
Phillips. J. 2005. Investing in your company’s Human Capital New York: Amacom.
Rastogi, P.N. 2000. Sustaining enterprise competitiveness – is Human Capital the answer?
Human Systems Management, 19:193-203.
Robbins, S.P. 1998. Organizational Behaviour: Concepts, controversies, applications, New
Jersey: Prentice Hall.
Robinson, G. & Kleiner, B. H. 1996. How to measure an organization’s intellectual capital.
Managerial Auditing Journal, 11 (8):36-39.
UUnniivveerrssiittyy ooff PPrreettoorriiaa eettdd –– KKaasssseellmmaann,, RR ((22000066))

University of Pretoria Kasselman, R
(2006)
218
Rogers, M.R. & Lopez, E.C. 2002 Identifying critical cross-cultural school psychology
competencies, Journal of school psychology 40(2):115-141.
Roos, J., Roos, G., Edvinsson, L. & Dragonetti, N.C. 1997a. Intellectual Capital. Basingstoke:
Macmillan.
Roos, J. & Roos, G. 1997b Intellectual capital: The next generation. Financial Times, “Mastering
Management,” May.
Roslender R. 1997. Measuring your company’s intellectual performance Long Range Planning,
30, No. 3:413-426
Rubin, H. & Rubin, I. 1995 Qualitative Interviewing: The art of Hearing Data. Thousand Oaks:
Sage Publications.
Rutledge, J. 1997. You're a fool if you buy into this. ASAP, April.
Schulman, E.R., Cox, V. & Schulman, A.E. 1999. How to Write a Scientific Research Report.
Annals of Improbable Research, 5, No. 6:9
Schultz, T.W. 1961. Investment in Human Capital. American Economic Review
Schurink, W.J. 2003. Introducing qualitative research, Research Methodology Class
Presentation. Pretoria: University of Pretoria.
Smith, R.B. & Manning, P.K. 1982. Qualitative Methods Volume II of Handbook of Social
Science Methods. Massachusetts: Ballinger Publishing Company.
Snyder-Halpern, R. (2002) Indicators of organizational readiness for clinical information
technology/systems innovation: a Delphi study, International Journal of Medical Informatics,
63:179-204.
UUnniivveerrssiittyy ooff PPrreettoorriiaa eettdd –– KKaasssseellmmaann,, RR ((22000066))

University of Pretoria Kasselman, R
(2006)
219
Steffy, B.D. & Maurer, S.D. 1988. Conceptualising and measuring the economic effectiveness of
human resource activities. Academy of Management Review, 13:271-286.
Stiles, P. & Kulvisaechana, S. 2003. Human Capital and performance: A literature review. Judge
Institude of Management. Cambridge: University of Cambridge.
Sveiby, K. 1997. The New Organisational Wealth - Managing and Measuring Knowledge-Based
Assets. Skandinavia:Berrett-Koehler.
Sveiby, K. 1998. Measuring Intangibles and Intellectual Capital. [Online] Available from:
http://sveiby.com. [Accessed: 2004-10-12].
Taylor, S.J. & Bogdan R. 1984. Introduction to qualitative research methods: The search for
meanings. UK: John Wiley & Sons.
The World Bank. 1995. Financial Accounting Reporting and Auditing Handbook. Central and
Operational Accounting Division. UK: John Wiley & Sons.
Thietart, R. 2001. Doing Management Research. A comprehensive guide. London: Sage
Publications.
Walker, K.B. 1996. Corporate Performance Revisited - the balance scorecard and dynamic
management reporting. Industrial Management and Data Systems [Online], 96 (3). Available
from: http://emeraldinsight.com. [Accessed: 2005-10-15].
Wang, G. 2002. People development strategies in the new economy. West Chester:
PerformTek, LLC
Watson Wyatt. 1999. Human Capital Index. [Online] Available from
http://www.watsonwyatt.com/research/featured/hci.asp. [Accessed: 2005-10-15].
UUnniivveerrssiittyy ooff PPrreettoorriiaa eettdd –– KKaasssseellmmaann,, RR ((22000066))
University of Pretoria Kasselman, R
(2006)
220
Watson Wyatt. 2004. Effective Communication: A Leading Indicator of Financial Performance -
2003/2004 Communication ROI Study. [Online] Available from
http://www.watsonwyatt.com/research/resrender.asp?id=w-868&page=1. [Accessed:
2005-10-15].
Weiss, D. 1999. High-performance HR: Transforming Human Resources to Competitive
Advantage. UK: John Wiley & Sons.
Williams, P. A. 1996. The relation between a prior earnings forecast by management and analyst
response to a current management forecast. The Accounting Review, January:103-116
Wortman, B. 2005. The value habit. [Online]. Available from
https://kx.deloitteresources.com/G1000/Lists/PublishedContent/DispForm.aspx?ID=44087&So
urce=http%3a%2f%2fkx.deloitteresources.com%2fG1000%2fLists%2fPublishedContent%2fAll
+Documents+by+Title.aspx. [Accessed 2004-10-15].
Wright, P.M., Dunford, B.B. & Snell, S.A. 2001. Human Resources and the Resource-based
view of the firm. Journal of Management, 27:701-721.
Zimmerman, E. 2001. What are employees worth? New York: Workforce.
UUnniivveerrssiittyy ooff PPrreettoorriiaa eettdd –– KKaasssseellmmaann,, RR ((22000066))

University of Pretoria Kasselman, R
(2006)
221
APPENDICES
Appendix A - Executives and Senior HR Managers’ Survey
Appendix B - Semi-structured interview guide
Appendix C - Auditors Survey
Appendix D – Metric Questionnaire
UUnniivveerrssiittyy ooff PPrreettoorriiaa eettdd –– KKaasssseellmmaann,, RR ((22000066))

Objective
RESEARCHERReuphillan KasselmanTel: +27 (82) [email protected]
SUPERVISORProf. C HooleFaculty of Economic and Management SciencesUniversity of Pretoria+27 (12) 420 4111
This information will only be processed in accordance with the provisions of the Data Protection Act 1998 and any other relevant legislation. No further information will be sent to you unless requested to do so.
Email Address
This questionnaire has been designed specifically for Executives in an attempt to understand the current HCM issues being reported on internally as well as externally, and what obstacles may exist to reporting on Human Capital as part of Company Shareholder Reports.Further input into research: g q p p yauditors to ascertain what they believe to be a reflection of the Human Capital and evaluation of Human Assets for an organization to ensure a holistic view is obtained. Interviews may also be requested for certain organizations in order to extrapolate information further or develop further, more qualitative understanding as input to the research. This will be collated into a model with input from HR Specialists to develop a framework which companies may use to report on Human Capital which should provide shareholders and stakeholders of organizations a more holistic view of ALL the assets of the organization.
• how far there should be central guidance on the most appropriate numerical measures (metrics) to be included company reports• how best to ensure that HCM is both widely reported and the information is trusted by investors and other
Your time and input is valued and appreciated.
Thank you. If you would like to receive the aggregated results of this survey from the other Companies, please provide an email address where we can send it to:
Target Population:
This research is focussed on gaining an understanding on:
Introduction
• the value of organisations’ reporting on what they identify to be their most important HCM issues• whether, in addition to organisation-specific reporting, all organisations should be encouraged to report on the
Appendix A - Executives and Senior HR Managers’ Survey
This questionnaire has been developed by a student in the course PhD: Organizational Behaviour at the University of Pretoria (2005) to gain insight into the reporting (internal and external) done by companies in South Africa in respect of their Human Capital / Human Resource Assets.
In today’s knowledge economy, a company's ability to support it's business strategy with human capital is an Most executives would agree with the statement that Human Resource Management has an impact on the
you may begin immediately or read the background introduction below first
Instructions
Please select each worksheet (Section 1 - 3) and complete questions by selecting or entering into the WHITE boxes.
Once you completed all 3 sections, please save and email back to: [email protected]
HUMAN CAPITAL FOR INCLUSION IN COMPANY ANNUAL REPORTS
Questionnaire Target Population :Company Executives andHR Professionals
UUnniivveerrssiittyy ooff PPrreettoorriiaa eettdd –– KKaasssseellmmaann,, RR ((22000066))

Instructions
SECTION 1HR Reporting --- 15 Questions
1.) Which of the following HR Reporting methods are being used / applied at present within your organization ?
Indicate with (X) if applicable
HR Scorecard to Exco / BoardHR Scorecard within HRReport to HR DirectorsSpecial reports for Line ManagementSpecial reports for EmployeesReport to External Stakeholders and InvestorsSeparate Corporate Social Responsibility Report
2.) Please list the key indicators of effective Human Capital Management that your organisation uses. (Please fill in as many as possible - one per line ) (Examples: Employee Demographics, Employee Turnover, Employee Satisfaction, Training ROI, Attitudes to work/life balance, Corporate Social Responsibility, Productivity, Employee Brand, Absenteeism, Effectiveness of performance Management)
3.) To what extent are each of these indicators associated with your company’s profitability or competitiveness ?
Please select 1 - 4 from dropdown list
4.) In your organization, how important is it to link the abovementioned indicators with profitability ? On a scale of 1 - 5 (1=Not Important 5=Very Important)
5.) Does this indicator figure in the company's external reporting ? Indicate (Y) or (N)
Please read each question and select the statement(s) to indicate your company’s current situation by ticking the box(es) or selecting from the dropdown lists where applicable (white boxes)
Once you completed all 3 sections, please save and email back to: [email protected]
UUnniivveerrssiittyy ooff PPrreettoorriiaa eettdd –– KKaasssseellmmaann,, RR ((22000066))

6.) Of those indicators that are not reported externally, how complicated would it be to report them externally and what prevents you from externally reporting these.
Indicator Complicatedness: Please select from dropdown list
What prevents you reporting this externally? Please select from dropdown list
Leave blankLeave blankLeave blankLeave blankLeave blankLeave blankLeave blankLeave blankLeave blankLeave blank
Key Indicators Used for Human Capital Management Reporting
7.) In your view, why are the indicators your organisation use to report on Human Capital / Human Resources important? (Please select from dropdown list)
8.) What (if any) indicators do you not currently use but think you could/should? Why?
9.) Please could you select and indicate 5 areas of most concern / importance for your organization from the indicators.Top Most Important2nd Most Important3rd4th5th
10.) Were the indicators you identified developed within a conceptual frame of reference related to key businesses/management processes ? (Select Yes/No from dropdown box)
11.) Were the indicators developed by the HR function alone or in conjunction with others (example: finance or strategy colleagues)?
HR Alone / In Conjunction with __________
UUnniivveerrssiittyy ooff PPrreettoorriiaa eettdd –– KKaasssseellmmaann,, RR ((22000066))

12.) How did you / your company decide which indicators to include in external reporting, (if any)?
13.) How have stakeholders (customers, suppliers, shareholders, employees) responded to external reporting of Human Capital measures?
14.) In your view, would there be value in the development of standardised HR measures for general use/use across your industry sector (locally and/or globally)? (Select Yes/No from dropdown box)
15.) In your view, are there common, core HR indicators which ALL companies should report? (Select Yes/No from dropdown box)
UUnniivveerrssiittyy ooff PPrreettoorriiaa eettdd –– KKaasssseellmmaann,, RR ((22000066))

SECTION 2Internal Human Resource Measures ---- 2 Questions
Measurement / Instrument Areas of most concern or challenge
Is this formally measured
1 (Top Most) to 5 (Yes / No)Business PerformanceEmployee CommitmentEmployee MotivationEmployee SatisfactionEmployment Equity CharterHuman CapitalKnowledge GenerationKnowledge IntegrationKnowledge SharingManagement LeadershipProcess ExecutionRelational CapitalRetention of Key PeopleStructural CapitalTrainingValue Alignment
2.) How do you currently segment your employees / workforce? (select from dropdown list)
1.) Which of the following measures / measuring instruments are utilized in your organization for formal measurement?(Internally Only ).Please could you also select 5 areas of most concern / importance for your organization and indicate these with 1 (Top Most) to 5.
UUnniivveerrssiittyy ooff PPrreettoorriiaa eettdd –– KKaasssseellmmaann,, RR ((22000066))

SECTION 3Company and Personal Information
Please provide the following information on your Company: Name of CompanyYear Company was foundedIndustry sector Location (Location of Head Office)Number of employees Headcount:
Full Time Equivalents:Part-time employees Regular:
Contingency:Headcount – Executives Headcount – Professional Staff Headcount - Human Resources staff Frequency of Company Reporting
Name and SurnameTitle*Gender*Age Group*Contact Details
Tel No: (please include dailing code)Email address:
*How long have you performed your current job function? Years
Email Address
Thank you. If you would like to receive the aggregated results of this survey from the other Companies, please provide an email address where we can send it to:
Your time and input is valued and appreciated.
Please complete the following information about you(Those indicated with an * are optional):
Click here to save and email back once completed
UUnniivveerrssiittyy ooff PPrreettoorriiaa eettdd –– KKaasssseellmmaann,, RR ((22000066))
Appendix B - Semi-structured interview guide
HUMAN CAPITAL FOR INCLUSION IN COMPANY ANNUAL REPORTS
- A South African Perspective
SEMI-STRUCTURED INTERVIEW GUIDE WITH COMPANY EXECUTIVES / SNR HR MANAGEMENT
DATE: ________________________________________
ORGANISATION: ________________________________________
INTERVIEWEE: ________________________________________
POSITION: ________________________________________
UUnniivveerrssiittyy ooff PPrreettoorriiaa eettdd –– KKaasssseellmmaann,, RR ((22000066))

Semi-structured interviews:
Question Answer 1. What is your current role in the
organisation?
2. Do you believe that your people and HCM
practices have an impact on the performance of your organisation?
3. Do you believe that your Board (or
equivalent) should try to understand the links between these practices and performance, and ensure that your HCM strategy complements and supports your business strategy?
4. How can /do you demonstrate, to your own
satisfaction and that of your stakeholders, that this is so?
5. Do you use any systems to enable your
HCM reporting?
6. What reports do you believe have provided you / your line management with the most valuable insights into HCM or HR Practices?
7. Was there a specific reason for
implementing the system(s) mentioned?
UUnniivveerrssiittyy ooff PPrreettoorriiaa eettdd –– KKaasssseellmmaann,, RR ((22000066))

Are you able to answer any of the following questions via a report or similar for your organisation? How important are these factors for your organisation, and if you do not currently receive such information, would you consider it relevant / important to provide insight with regard to Human Capital within the company? Question Can be answered Importance for your
organisation
Which segments of the workforce create the value for which we are most rewarded in the marketplace?
Which areas of the business will be most impacted by impending waves of retirement?
What is being done to prepare successors?
What impact will anticipated retirement have on the skills and productivity necessary to meet future demands?
Which segments of the workforce will be most impacted? Is the talent market heating up (i.e. demand will outpace supply)?
What skills will be required over the next five years that the company doesn’t currently possess?
How will the company create capacity for skills which they currently do not have?
What is the staff turnover within critical areas?
How much is staff turnover costing the company In customers / productivity/ innovation / quality?
What is being done to resolve the root cause of high staff turnover?
What is being done to retain our key / core workforce segments?
What are the workforce demographics? Is there any other information / reports which you believe are critical (internal or external) from a Human Capital reporting perspective for company stakeholders?
Use survey response to initiative detailed further discussion.
UUnniivveerrssiittyy ooff PPrreettoorriiaa eettdd –– KKaasssseellmmaann,, RR ((22000066))
Appendix C - Auditors Survey
HUMAN CAPITAL FOR INCLUSION IN COMPANY ANNUAL REPORTS
- A South African Perspective
Questionnaire Target Population:
Auditors (Internal and External)
Objective This questionnaire has been developed by a student in the course PhD: Organisational Behaviour at the University of Pretoria (2005) with the objective of developing a model for reporting on Human Capital / Human Resource Assets for South African companies.
RESEARCHER Reuphillan Kasselman Tel: +27 (82) 5789648 SUPERVISOR Prof. C Hoole Faculty of Economic and Management Sciences University of Pretoria +27 (12) 420 4111
UUnniivveerrssiittyy ooff PPrreettoorriiaa eettdd –– KKaasssseellmmaann,, RR ((22000066))

INTRODUCTION
In today’s knowledge economy, a company's ability to support its business strategy with Human Capital is an important indication of the company's future business performance. The King II Report on Corporate Governance in South Africa (2002) recommended that management accounting should, as a matter of best management practice, reflect requirements of human capital development. This implies that companies should lay out, in publicly reported accounts, the principles, standards and goals adopted for the development of their Human Capital, making appropriate reference to the accounting policies adopted to support adherence to them. Furthermore, King II recognises that the development of Human Capital does not only to serve the economic interest of the company, but also serves the requirements of the society within which the company operates. However, no standard or framework to enable the inclusion of this information in company reporting to demonstrate the effect on performance currently exists. This means that a company's most significant asset (Human Capital) is not included in the valuation of the business.
This research is focussed on gaining an understanding on:
• The value of organisations’ reporting on what they identify to be their most important Human Capital Management (HCM) issues
• Whether, in addition to organisation-specific reporting, all organisations should be encouraged to report on the Human Resource issues as part of the company shareholder report
• The extent of central guidance on the most appropriate numerical measures (metrics) which should be included in company reports
• How best way to ensure that HCM is both widely reported and the information is trusted by investors and other stakeholders as relevant, reliable and consistent, and what obstacles there might be to such reporting.
Target Population:
This questionnaire has been designed specifically for Auditors to determine the relevance of the dimensions and descriptive elements of model for Human Capital Reporting as well as to identify any additional elements that are perceived to be relevant.
Your time and input is valued and appreciated.
Reuphillan Kasselman Researcher [email protected] Mobile +27 82 578 9648
UUnniivveerrssiittyy ooff PPrreettoorriiaa eettdd –– KKaasssseellmmaann,, RR ((22000066))

SURVEY ON HUMAN CAPITAL MANAGEMENT REPORTING SECTION 1 Please complete the following information about you (Those areas indicated with an * are optional): If completing this form electronically, please simply delete the options not applicable. Name and surname Title Mr, Mrs, Ms, Dr, Prof, etc Highest qualifications
*Gender Male / Female *Age group Below 30; 30 – 45; 45 – 55; Over 55 *Contact details Tel No:
Email address: Your position / job title Auditor (Internal)
Auditor Manager Senior Manager Audit Partner Other (Text Box)
*How long have you performed your current job function?
____ years
Please provide the following information on your company / the company which you audit: Please copy this box if more than one Name of your company Company(ies) which you audit Industry sector Number of employees Headcount: Full time equivalents: Part-time employees Regular: Contingency: Headcount – executives Headcount – professional staff Headcount – Human Resources staff
Frequency of company Reporting
List: Quarterly Half-yearly Annually
UUnniivveerrssiittyy ooff PPrreettoorriiaa eettdd –– KKaasssseellmmaann,, RR ((22000066))
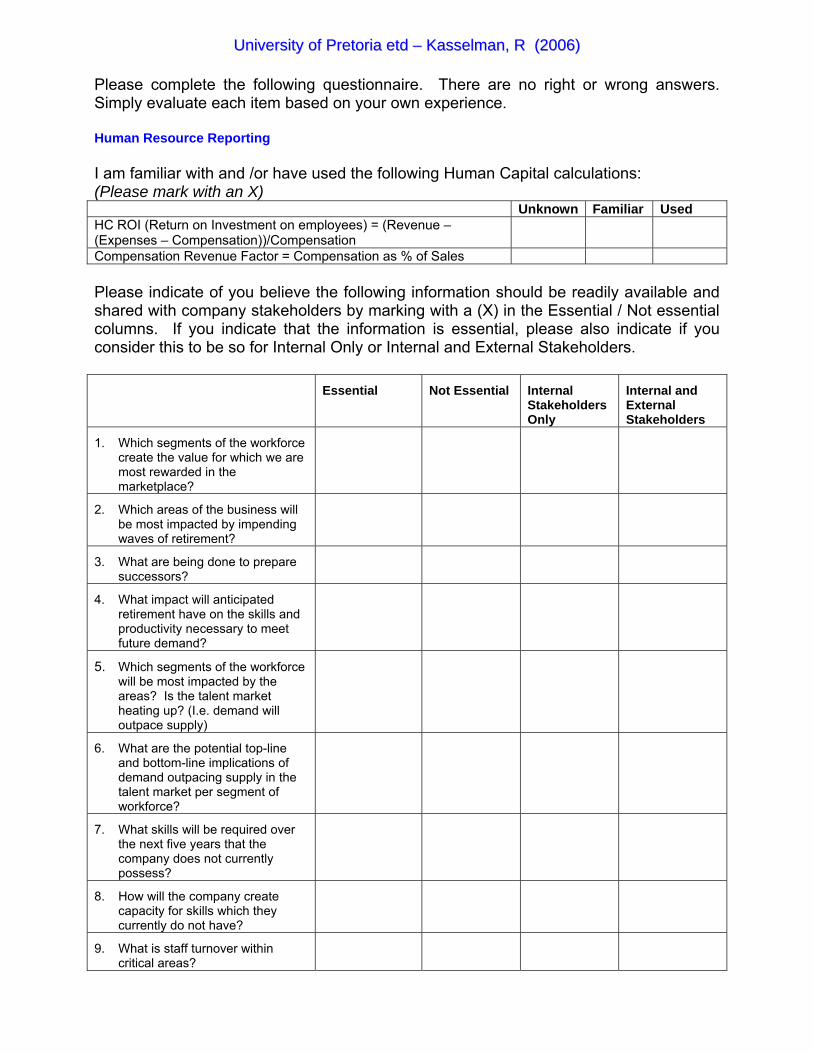
Please complete the following questionnaire. There are no right or wrong answers. Simply evaluate each item based on your own experience. Human Resource Reporting I am familiar with and /or have used the following Human Capital calculations: (Please mark with an X) Unknown Familiar Used HC ROI (Return on Investment on employees) = (Revenue – (Expenses – Compensation))/Compensation
Compensation Revenue Factor = Compensation as % of Sales Please indicate of you believe the following information should be readily available and shared with company stakeholders by marking with a (X) in the Essential / Not essential columns. If you indicate that the information is essential, please also indicate if you consider this to be so for Internal Only or Internal and External Stakeholders.
Essential Not Essential Internal Stakeholders Only
Internal and External Stakeholders
1. Which segments of the workforce create the value for which we are most rewarded in the marketplace?
2. Which areas of the business will be most impacted by impending waves of retirement?
3. What are being done to prepare successors?
4. What impact will anticipated retirement have on the skills and productivity necessary to meet future demand?
5. Which segments of the workforce will be most impacted by the areas? Is the talent market heating up? (I.e. demand will outpace supply)
6. What are the potential top-line and bottom-line implications of demand outpacing supply in the talent market per segment of workforce?
7. What skills will be required over the next five years that the company does not currently possess?
8. How will the company create capacity for skills which they currently do not have?
9. What is staff turnover within critical areas?
UUnniivveerrssiittyy ooff PPrreettoorriiaa eettdd –– KKaasssseellmmaann,, RR ((22000066))
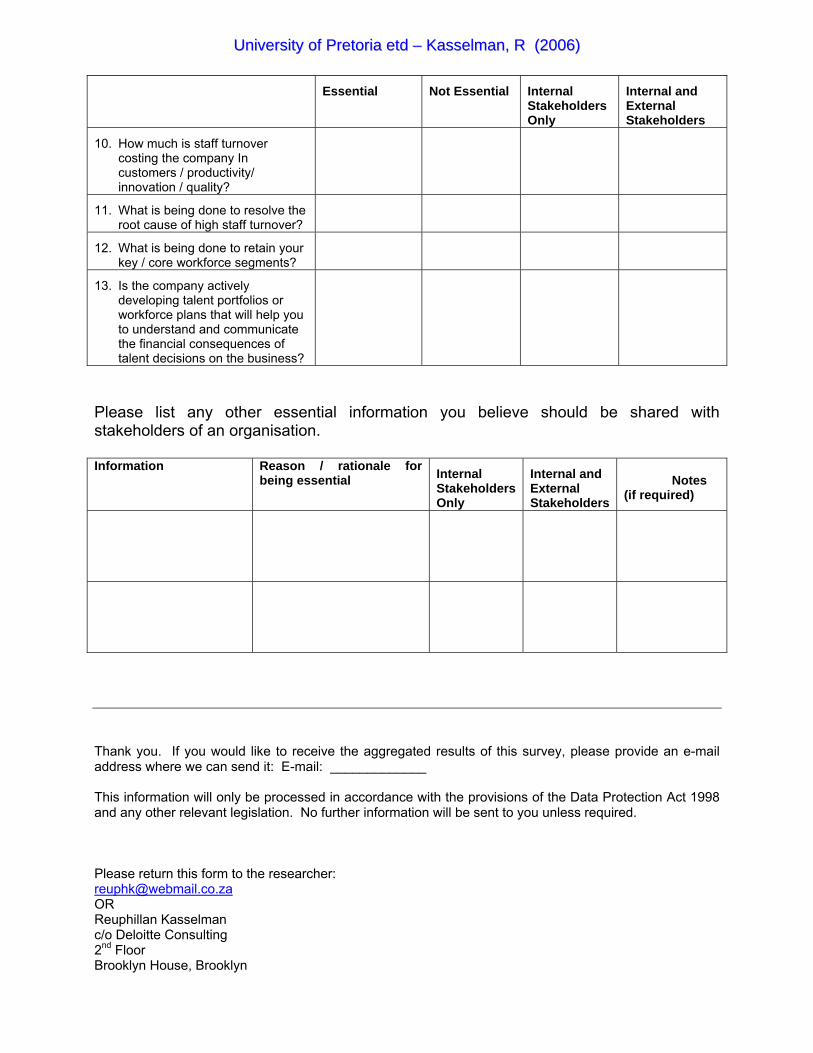
Essential Not Essential Internal Stakeholders Only
Internal and External Stakeholders
10. How much is staff turnover costing the company In customers / productivity/ innovation / quality?
11. What is being done to resolve the root cause of high staff turnover?
12. What is being done to retain your key / core workforce segments?
13. Is the company actively developing talent portfolios or workforce plans that will help you to understand and communicate the financial consequences of talent decisions on the business?
Please list any other essential information you believe should be shared with stakeholders of an organisation. Information Reason / rationale for
being essential Internal Stakeholders Only
Internal and External Stakeholders
Notes
(if required)
Thank you. If you would like to receive the aggregated results of this survey, please provide an e-mail address where we can send it: E-mail: _____________ This information will only be processed in accordance with the provisions of the Data Protection Act 1998 and any other relevant legislation. No further information will be sent to you unless required. Please return this form to the researcher: [email protected] OR Reuphillan Kasselman c/o Deloitte Consulting 2nd Floor Brooklyn House, Brooklyn
UUnniivveerrssiittyy ooff PPrreettoorriiaa eettdd –– KKaasssseellmmaann,, RR ((22000066))
Appendix D – Metric Questionnaire
HUMAN CAPITAL FOR INCLUSION IN COMPANY ANNUAL REPORTS
- A South African Perspective
Questionnaire Target Population:
HR Consultants / Experts
– Students in Human Resources Management
– HR Consultants
Objective This questionnaire has been developed by a student in the course PhD: Organizational Behaviour at the University of Pretoria (2005) with the objective of developing a model for reporting on Human Capital / Human Resource Assets for South African companies.
RESEARCHER Reuphillan Kasselman Tel: +27 (82) 5789648 SUPERVISOR Prof. C Hoole Faculty of Economic and Management Sciences University of Pretoria +27 (12) 420 4111
UUnniivveerrssiittyy ooff PPrreettoorriiaa eettdd –– KKaasssseellmmaann,, RR ((22000066))

INTRODUCTION
In today’s knowledge economy, a company's ability to support its business strategy with Human Capital is an important indication of the company's future business performance. The King II Report on Corporate Governance in South Africa (2002) recommended that management accounting should, as a matter of best management practice, reflect requirements of Human Capital development. This implies that companies should lay out, in publicly reported accounts, the principles, standards and goals adopted for the development of their Human Capital, making appropriate reference to the accounting policies adopted to support adherence to them. Furthermore, King II recognises that the development of Human Capital does not only to serve the economic interest of the company, but also serves the requirements of the society within which the company operates. However, no standard or framework to enable the inclusion of this information in company reporting to demonstrate the effect on performance currently exists. This means that a company's most significant asset (Human Capital) is not included in the valuation of the business.
This research is focussed on gaining an understanding on:
• The value of organisations’ reporting on what they identify to be their most important Human Capital Management (HCM) issues.
• Whether, in addition to organisation-specific reporting, all organisations should be encouraged to report on the Human Resource issues as part of the company shareholder report.
• The extent to which central guidance on the most appropriate numerical measures (metrics) should be included in company reports.
• How best to ensure that HCM is both widely reported, and that the information is trusted by investors and other stakeholders as relevant, reliable and consistent, and what obstacles there might be in such reporting.
Target population:
This questionnaire has been designed specifically for HR students and consultants to determine the relevance of the dimensions and descriptive elements of Human Capital Reporting, as well as to identify any additional elements that are perceived to be relevant.
Further input into research:
Further research will be done using a similar questionnaire to assess the opinion of company valuators and auditors to ascertain what they believe to be a reflection of the Human Capital and evaluation of Human Assets for an organisation to ensure a holistic view is obtained. This will be collated into a model with input from this questionnaire to develop a framework which companies may use to report on Human Capital which should provide shareholders and stakeholders of organisations a more holistic view of ALL the assets of the organisation.
Your time and input is valued and appreciated.
Reuphillan Kasselman Researcher [email protected] Mobile +27 82 578 9648
UUnniivveerrssiittyy ooff PPrreettoorriiaa eettdd –– KKaasssseellmmaann,, RR ((22000066))

SURVEY ON HUMAN CAPITAL MANAGEMENT REPORTING Please complete the following questionnaire. There are no right or wrong answers. Simply evaluate each item based on your own experience. PERSONAL INFORMATION Please complete the following information about you. (Those areas indicated with an * are optional): Name and surname Title List titles: Mr, Mrs, Ms, Dr, Prof, etc Highest qualification *Gender Male / Female *Age group Below 30; 30 – 45; 45 – 55; Over 55 *Contact details Tel No:
Email address: Your position Student
HR Consultant Other (Text Box)
SECTION 1 Model for Employee Value The following statements measure the value of Human Capital against a model for Shareholder value. Please read the question on the left, then evaluate the dimension in the next column to be either Essential or Not Essential by placing an (X) in the relevant column.
Essential Not Essential
Reduce compensation administration costs
Reduce benefits administration costs Reduce performance management costs
Reduce talent management costs Reduce recruiting and selection costs
What is the relevance of the following dimensions to lead to a reduction in the Total Cost of Employee Interactions for HR? (Please consider the impact on the service offered by HR in assessing these dimensions)
Reduce learning / training costs Reduce employee time spent on administrative functions
Increase technical skills of employee Will the following dimensions increase employee efficiency? Improve execution capability of
employee
Improve employee’s understanding of his/her impact on shareholder value
Improve planning Will the following dimensions help to improve the employee’s impact on customers? Broaden collaboration and support with
customers
Improve employee retention Improve employee’s skills and competence
Will the following dimensions assist in the improvement of employee performance? Improve employee effectiveness
UUnniivveerrssiittyy ooff PPrreettoorriiaa eettdd –– KKaasssseellmmaann,, RR ((22000066))
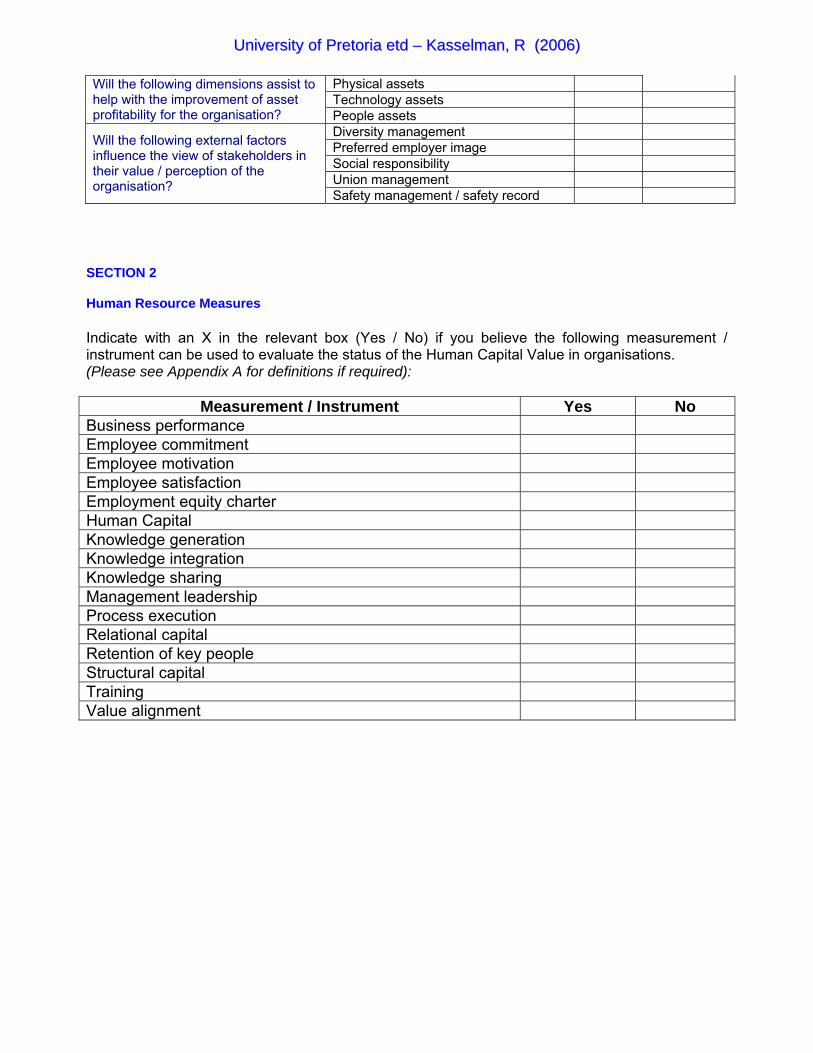
Physical assets Technology assets
Will the following dimensions assist to help with the improvement of asset profitability for the organisation? People assets
Diversity management Preferred employer image Social responsibility Union management
Will the following external factors influence the view of stakeholders in their value / perception of the organisation?
Safety management / safety record SECTION 2 Human Resource Measures Indicate with an X in the relevant box (Yes / No) if you believe the following measurement / instrument can be used to evaluate the status of the Human Capital Value in organisations. (Please see Appendix A for definitions if required):
Measurement / Instrument Yes No Business performance Employee commitment Employee motivation Employee satisfaction Employment equity charter Human Capital Knowledge generation Knowledge integration Knowledge sharing Management leadership Process execution Relational capital Retention of key people Structural capital Training Value alignment
UUnniivveerrssiittyy ooff PPrreettoorriiaa eettdd –– KKaasssseellmmaann,, RR ((22000066))

SECTION 3 The following metrics are considered required to provide insight into the effectiveness and efficiency of Human Resources in an organization and should be included in External Reporting on Human Capital. Please use the sheet (Form 1) provided and complete per indicator (reference the indicator number) the following: For electronic submissions, this form is also provided in Excel for easier completion. (Please use Metrics List.xls) 1 Is the indicator/ metric applicable? 2 Is the indicator/ metric complete? 3 Is the indicator applicable to all types of organisations? 4 Is the data for the indicator easily obtained? 5 Is the calculation required for the indicator simple? 6 Is the indicator understandable? 7 Is the data objective, quantifiable and reliable? 8 Does the indicator point towards sustainable improvement? 9 Can the indicator be measured on an ongoing basis? No Indicator/ Metric 1 Costs per Full-Time Employee
2 Revenue per Employee
3 Total Compensation/Benefits as Ratio of Total Revenue
4 Training Investment per Employee
5 Training Remuneration Factor
6 Recruitment Resource Ratio
7 Total Compensation as Ratio of Total Costs
8 Incentive Cost Ratio
9 Termination Rate
10 EE Movements
11 Acceptance Rate
12 Employee Commitment
13 Employee Motivation
14 Employee Satisfaction
15 Management Leadership
16 Knowledge Generation
17 Knowledge Integration
18 Knowledge Sharing
19 Process Execution
20 Retention of Key People
21 Relational Capital
22 Structural Capital
23 Value Alignment
UUnniivveerrssiittyy ooff PPrreettoorriiaa eettdd –– KKaasssseellmmaann,, RR ((22000066))

No Indicator/ Metric 24 Absenteeism rate by job category and job performance
25 Accident costs
26 Accident safety ratings
27 Average employee tenure (by performance level)
28 Average time for dispute resolution
29 Benefits costs as a percentage of payroll or revenue
30 Benefits costs/competitors’ benefits costs ratio
31 Compliance with fair employment practices / industry charter
32 Compliance with technical requirement of affirmative action
33 Comprehensiveness of safety monitoring
34 Compensation of high performers compared to average performers in peer group
35 Cost of HR-related litigation
36 Cost of injuries
37 Cost per grievance
38 Cost per hire
39 Cost per trainee hour
40 Courses with highest number of attendees by competency
41 HR department budget as a percentage of sales
42 HR expense per employee
43 HR expense / total expense
44 Interviews per-offer ratio (selection ratio)
45 Lost time due to accidents
46 Measures of cycle time for key HR processes
47 Number of applicants per recruiting source (by quality)
48 Number of hires per recruiting source (by quality)
49 Number of courses taught by subject
50 Number of recruiting advertising programs in place
51 Number of safety training and awareness activities
52 Number of poor performers who left per level
53 Number of stress-related illnesses
54 Number of training days and programs per year
55 Offer-to-acceptance ratio
56 Proportion of high performers to average performers, per job level
57 Percentage of and number of employees involved in training
58 Percentage of correct data in HR information system
59 Percentage of employee development plans completed
UUnniivveerrssiittyy ooff PPrreettoorriiaa eettdd –– KKaasssseellmmaann,, RR ((22000066))

No Indicator/ Metric 60 Percentage of employees with access to appropriate training and development
opportunities
61 Percentage of new material in training programs each year
62 Percentage of payroll spent on training
63 Percentage of performance appraisals completed on time
64 Response time per information request
65 Sick days per full-time equivalent per year
66 Speed of salary action processing
67 Time needed to orient new employees
68 Time to fill an open position
69 Total compensation expense per employee
70 Total HR investment / earnings
71 Total HR investment / revenues
72 Turnover by recruiting source
73 Turnover costs
74 Turnover rate by job category and job performance
75 Variable labour costs as percentages of variable revenue
76 Worker’s compensation costs
77 Workers compensation experience rating
78 Access to business information to facilitate decision making
79 Adherence by the workforce to core values, e.g. cost consciousness
80 Average change in performance appraisal rating over time
81 Change in employee mind-set
82 Climate surveys
83 Consistency and clarity of messages from top management and from HR
84 Customer complaints / praise
85 Customer satisfaction with hiring process
86 Degree of financial literacy among employees
87 Degree of race and gender by job category
88 Effectiveness of performance appraisal processes for dealing with poor performers
89 Employee commitment survey scores
90 Employee competency growth
91 Employee development / advancement opportunities, compensation, etc.
92 Employee turnover by performance level and controllability
93 Extent of cross-functional teamwork
94 Extent of organisational learning
95 Extent of understanding of the firm’s competitive strategy and operational goals
UUnniivveerrssiittyy ooff PPrreettoorriiaa eettdd –– KKaasssseellmmaann,, RR ((22000066))
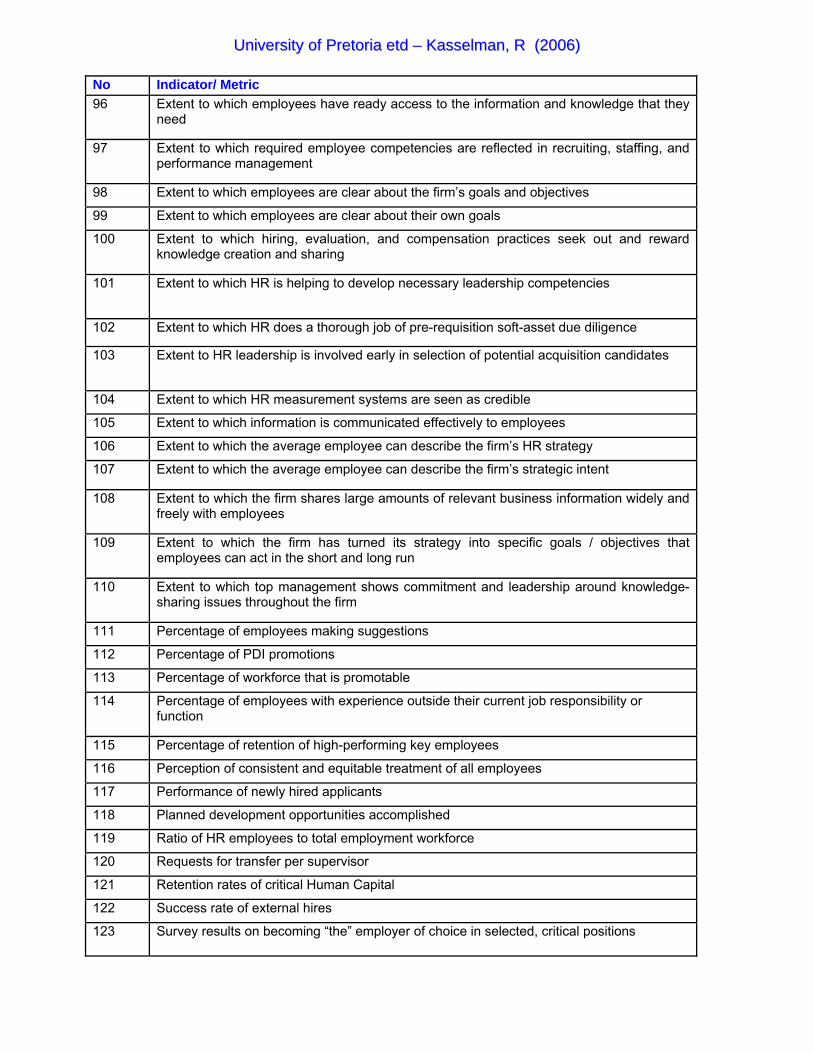
No Indicator/ Metric 96 Extent to which employees have ready access to the information and knowledge that they
need
97 Extent to which required employee competencies are reflected in recruiting, staffing, and performance management
98 Extent to which employees are clear about the firm’s goals and objectives
99 Extent to which employees are clear about their own goals
100 Extent to which hiring, evaluation, and compensation practices seek out and reward knowledge creation and sharing
101 Extent to which HR is helping to develop necessary leadership competencies
102 Extent to which HR does a thorough job of pre-requisition soft-asset due diligence
103 Extent to HR leadership is involved early in selection of potential acquisition candidates
104 Extent to which HR measurement systems are seen as credible
105 Extent to which information is communicated effectively to employees
106 Extent to which the average employee can describe the firm’s HR strategy
107 Extent to which the average employee can describe the firm’s strategic intent
108 Extent to which the firm shares large amounts of relevant business information widely and freely with employees
109 Extent to which the firm has turned its strategy into specific goals / objectives that employees can act in the short and long run
110 Extent to which top management shows commitment and leadership around knowledge-sharing issues throughout the firm
111 Percentage of employees making suggestions
112 Percentage of PDI promotions
113 Percentage of workforce that is promotable
114 Percentage of employees with experience outside their current job responsibility or function
115 Percentage of retention of high-performing key employees
116 Perception of consistent and equitable treatment of all employees
117 Performance of newly hired applicants
118 Planned development opportunities accomplished
119 Ratio of HR employees to total employment workforce
120 Requests for transfer per supervisor
121 Retention rates of critical Human Capital
122 Success rate of external hires
123 Survey results on becoming “the” employer of choice in selected, critical positions
UUnniivveerrssiittyy ooff PPrreettoorriiaa eettdd –– KKaasssseellmmaann,, RR ((22000066))
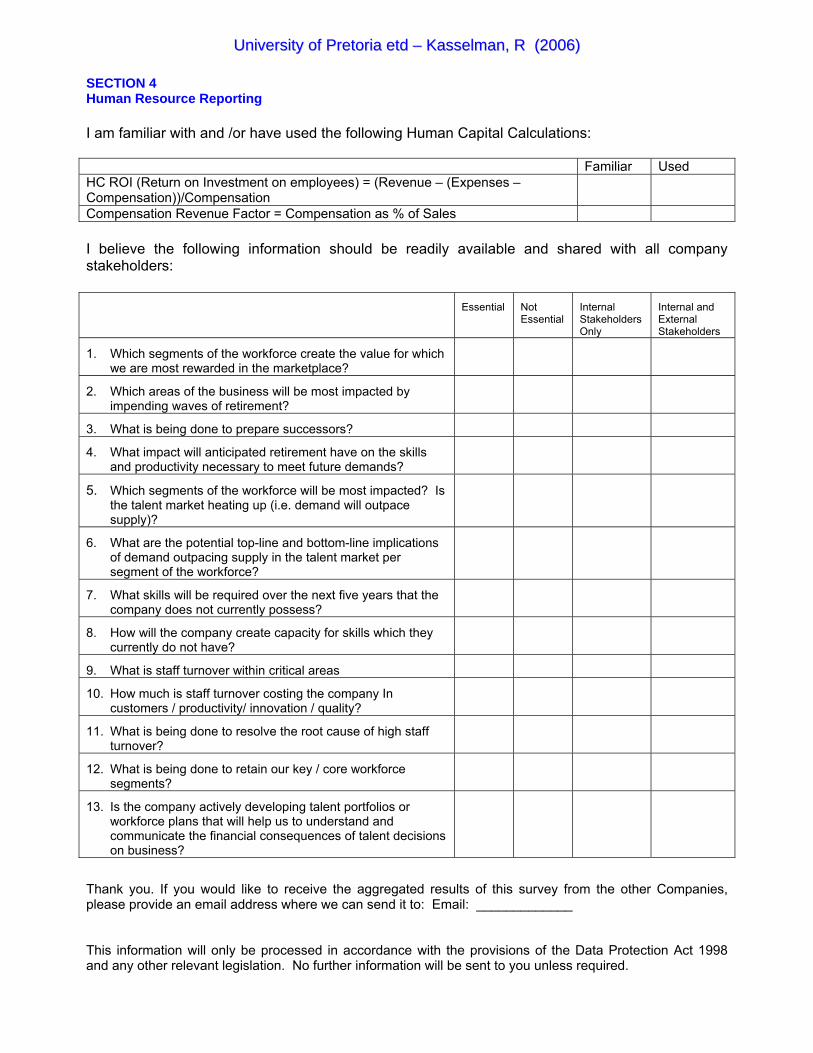
SECTION 4 Human Resource Reporting I am familiar with and /or have used the following Human Capital Calculations: Familiar Used HC ROI (Return on Investment on employees) = (Revenue – (Expenses – Compensation))/Compensation
Compensation Revenue Factor = Compensation as % of Sales I believe the following information should be readily available and shared with all company stakeholders:
Essential Not Essential
Internal Stakeholders Only
Internal and External Stakeholders
1. Which segments of the workforce create the value for which we are most rewarded in the marketplace?
2. Which areas of the business will be most impacted by impending waves of retirement?
3. What is being done to prepare successors?
4. What impact will anticipated retirement have on the skills and productivity necessary to meet future demands?
5. Which segments of the workforce will be most impacted? Is the talent market heating up (i.e. demand will outpace supply)?
6. What are the potential top-line and bottom-line implications of demand outpacing supply in the talent market per segment of the workforce?
7. What skills will be required over the next five years that the company does not currently possess?
8. How will the company create capacity for skills which they currently do not have?
9. What is staff turnover within critical areas
10. How much is staff turnover costing the company In customers / productivity/ innovation / quality?
11. What is being done to resolve the root cause of high staff turnover?
12. What is being done to retain our key / core workforce segments?
13. Is the company actively developing talent portfolios or workforce plans that will help us to understand and communicate the financial consequences of talent decisions on business?
Thank you. If you would like to receive the aggregated results of this survey from the other Companies, please provide an email address where we can send it to: Email: _____________ This information will only be processed in accordance with the provisions of the Data Protection Act 1998 and any other relevant legislation. No further information will be sent to you unless required.
UUnniivveerrssiittyy ooff PPrreettoorriiaa eettdd –– KKaasssseellmmaann,, RR ((22000066))