a house divided - amazon s3 · about zillow, inc. zillow, inc. (nasdaq: z) operates the largest...
TRANSCRIPT

A House
DividedHow Race Colors the Path
to Homeownership
January 2014With a foreword by:
Contributors
Katie CurnutteDirector of Communications
Svenja GudellDirector of Economic Research
About Zillow, Inc. Zillow, Inc. (NASDAQ: Z) operates the largest home-related marketplaces on mobile and the Web, ZLWK�D�FRPSOHPHQWDU\�SRUWIROLR�RI�EUDQGV�DQG�SURGXFWV�WKDW�KHOS�SHRSOH�ȴQG�YLWDO�LQIRUPDWLRQ�DERXW�homes, and connect with the best local professionals. In addition, Zillow operates an industry-leading economics and analytics bureau led by Zillow’s Chief Economist Dr. Stan Humphries. Dr. Humphries and his team of economists and data analysts produce extensive housing data and research covering more than 450 markets at Zillow Real Estate Research. Zillow also sponsors the quarterly Zillow Home Price Expectations Survey, which asks more than 100 leading economists, real estate experts and investment DQG�PDUNHW�VWUDWHJLVWV�WR�SUHGLFW�WKH�SDWK�RI�WKH�=LOORZ�+RPH�9DOXH�ΖQGH[�RYHU�WKH�QH[W�ȴYH�\HDUV��7KH�Zillow, Inc. portfolio includes Zillow.com®, Zillow Mobile, Zillow Mortgage Marketplace, Zillow Rentals, =LOORZ�'LJVȠ��3RVWOHWVp��'LYHUVH�6ROXWLRQVp��$JHQWIROLRp��0RUWHFKp��+RW3DGVȠ�DQG�6WUHHW(DV\p��7KH�company is headquartered in Seattle. Zillow.com, Zillow, Postlets, Mortech, Diverse Solutions, StreetEasy and Agentfolio are registered trademarks of Zillow, Inc. HotPads and Digs are trademarks of Zillow, Inc.
Cory HopkinsPublic Relations Manager
Stan HumphriesChief Economist
For additional information contact [email protected]
To download the full report, please visit www.zillow.com/research
Skylar OlsenEconomist
Alan LightfeldtAnalyst
Camille Salama Public Relations Coordinator
'LDQH�7XPDQEditor-in-Chief

A House Divided 1
Foreword by the National Urban League
Section 1
Section 2
Appendix
Diversity of Experience in the Home Mortgage Application Process
Home Mortgage Applicants: Shrinking Diversity
Section 3 'LHUHQWLDO�ΖPSDFWV�RI�WKH�+RXVLQJ�5HFHVVLRQ�DQG�5HFRYHU\
Table of Contents
Executive Summary

Foreword by the National Urban League
Foreword2
7his mortgage experience study underscores what the National Urban League has
long known – that African-Americans DQG� +LVSDQLFV� IDFH� VLJQLȴFDQWO\�greater barriers to entering the traditional housing market than their white and Asian counterparts. 7KLV� KDV� D� WUHPHQGRXV� LPSDFW�on quality of life issues, upward mobility and the ability of families to accumulate and pass on wealth to the next generation.
7KH� 1DWLRQDO� 8UEDQ� /HDJXHȇV�mission is to enable communities of color to secure economic self-reliance, parity, power and civil rights. Founded in 1910, we have 95 DɝOLDWHV��VHUYLQJ�����FRPPXQLWLHV��in 35 states and the District of Columbia. We have over 40 years of experience providing pre-purchase and foreclosure counseling to ensure borrowers are well informed of their housing rights and options, and have greater opportunities to access the housing market.
For generations, homeownership has been the primary means for Americans to acquire wealth. Sadly, according to the study, African-Americans and Hispanics are less likely to apply, and be approved, for home mortgages than whites. 7KH\� KDYH� ORZHU� LQFRPHV�� ORZHU�homeownership rates, less equity in their homes and as a result, less wealth. According to the National Urban League’s 2013 State of Black
from accessing the housing market. A commitment should be made to ensuring fair and equitable access WR�WKH�KRXVLQJ�ȴQDQFH�V\VWHP�IRU�DOO�UHVSRQVLEOH� DQG� TXDOLȴHG� EX\HUV��regardless of race or ethnicity. 7KLV� KDV� DOZD\V� EHHQ�� DQG� PXVW�remain, an important government policy goal in order to promote and support wealth-building strategies across all communities.
As one of the nation’s premier providers of HUD-approved housing counseling, the National 8UEDQ�/HDJXH�NQRZV�ȴUVWKDQG�KRZ�housing counseling can help ensure a positive home buying experience. Research shows that home buyers who work with housing counselors have better outcomes than those who navigate the system on their own. According to a recent NeighborWorks study, borrowers who receive housing counseling
America Equality Index, in 2010, the median wealth of African-Americans and Hispanics was $4,955 and $7,424, respectively, compared to $110,729 for whites. 7KH� 1DWLRQDO� 8UEDQ� /HDJXHȇV�At Risk: State of the Black Middle Class report also shows how the Great Recession adversely DHFWHG� WKH� HFRQRPLF� JDLQV�made by African-Americans in the
last 30 years – including income, employment and homeownership. Recovering from these losses means rebuilding rather than limiting ladders of opportunity for reaching the middle class – including the purchase of a home.
Because homeownership is essential to individual and family asset building, we encourage policy makers to acknowledge and confront the institutional barriers preventing communities of color
Because homeownership is essential to individual and family asset building, we
encourage policy makers to acknowledge and confront the institutional barriers preventing communities of color from
accessing the housing market.

A House Divided 3
services were one-third less likely than non-counseled borrowers to be delinquent on their mortgage. In addition, housing counseling plays a critical role in preventing mortgage abuses such as those that took place during the subprime mortgage boom. African-Americans and Hispanics were three times more likely to be steered into subprime loan products than their white counterparts, even though WKH\� TXDOLȴHG� IRU� WUDGLWLRQDO�loans. As a result, according to the National Association of Real Estate Brokers, they were more than 70 percent more likely to go into foreclosure, through no fault of WKHLU�RZQ��7KH\�ZHUH�VROG�ORDQV�WKH�banks knew they could not repay.
Housing counseling can also increase minorities’ access to the housing market. Integrating housing counseling services into the mortgage application process EHQHȴWV� DOO� SDUWLHV� LQYROYHG��including borrowers, lenders and servicers, by educating home buyers and preventing future delinquencies and foreclosures. As a result, housing counseling should be used as a compensating factor to help underserved borrowers gain access to the housing market.
Saving the necessary down payment to purchase a home is one of the major obstacles to attaining the American Dream. On average, African-Americans and
Hispanics have lower incomes than their white and Asian counterparts, making it much more challenging for them to save a down payment IRU�DQ�DRUGDEOH�KRPH�LQ�D�GHFHQW�neighborhood. Further, African-Americans and Latinos are less likely to receive an inheritance or help from their parents to make a sizable down payment. According to the Center for Responsible Lending, it takes the typical African-American and Hispanic families 28 years and 17 years, respectively, to save for a 5 percent down payment, and 31 years and 26 years, respectively, to save for a 10 percent down payment.
7KH� 1DWLRQDO� 8UEDQ� /HDJXH� KDV�long supported a reasonable and DRUGDEOH� ȊVNLQ� LQ� WKH� JDPHȋ�down payment requirement, along with quality credit standards, strong documentation and sound underwriting. However, research shows that being able to make a large down payment is not an indicator of a borrower’s ability to repay a loan. Rather, high down payment requirements reduce access to the housing market and force underserved communities to purchase FHA loans, which are generally more expensive for the borrower than conventional loans because of the mortgage insurance requirement.
7KH�HFRQRPLF�JURZWK�RI�WKLV�QDWLRQ�is closely tied to the reduction of
income and wealth inequality. Fair and equitable access to the housing market for all Americans is essential to these goals and to economically empowering FRPPXQLWLHV� RI� FRORU�� 7R� LQFUHDVH�access to the housing market, the National Urban League strongly favors the following policies:
Increase investments to the HUD Housing Counseling Assistance Program in the federal budget.
Support the Consumer Financial Protection Bureau’s (CFPB) HRUWV�� VXFK� DV� 4XDOLȴHG�Mortgages (QM), to protect consumers from predatory lending practices.
Establish and enforce PHDQLQJIXO� DRUGDEOH�housing goals for Government Sponsored Enterprise (GSE) loans.
Discourage policies that advocate arbitrarily high down payment requirements.

Executive Summary

A House Divided 5
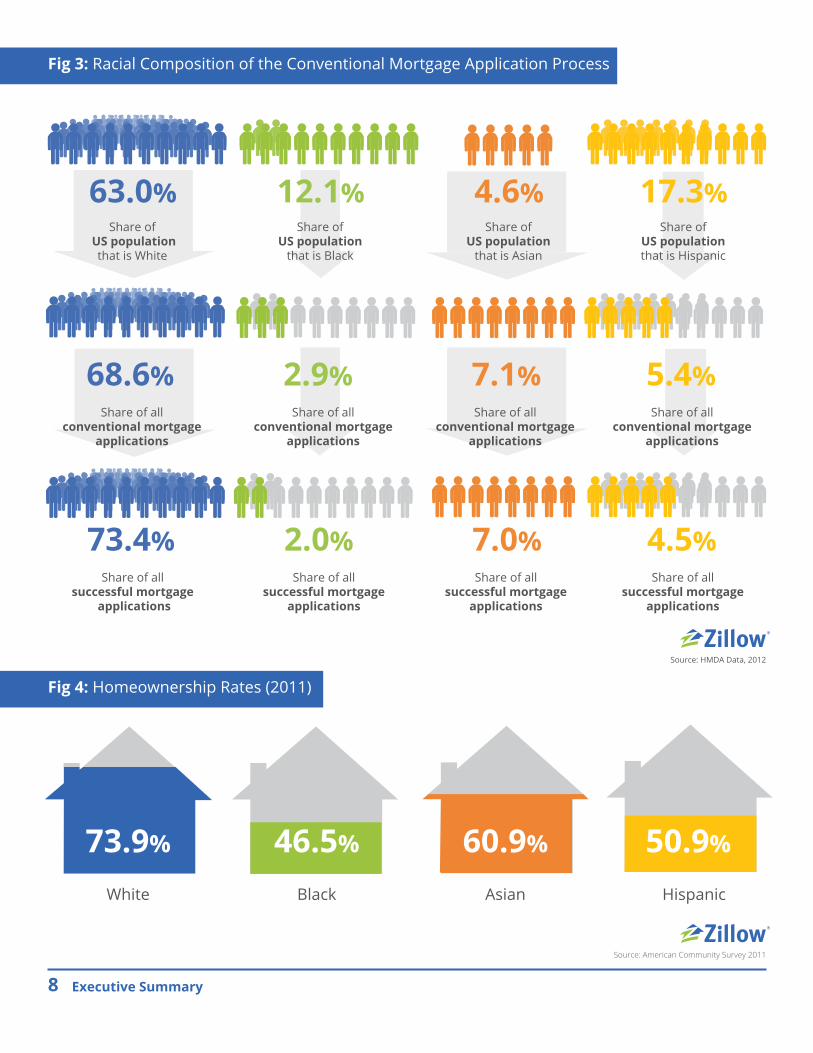
Key FindingsFewer minorities apply for conventional mortgages. Although Hispanics and blacks make up 17 percent and 12 percent the U.S. population, respectively, they represented only 5 percent and 3 percent of the conventional mortgage application pool.
Blacks experience the highest loan application denial rates. 1 in 4 blacks will be denied their conventional loan application, as opposed to 1 in 10 whites.
Wide disparities in homeownership rates among ethnic groups persist. 73.9 percent of whites own a home, whereas 60.9 percent of Asians, 50.9 percent of Hispanics, and 46.5 percent of blacks own.
7KH�ULVH�DQG�VXEVHTXHQW�IDOO�RI�KRPH�YDOXHV�LQ�WKH�8�6��KRXVLQJ�EXEEOH�GLVSURSRUWLRQDWHO\�DHFWHG�EODFN�DQG�+LVSDQLF�KRPHRZQHUV��PHDVXUHG�E\�indexed home values between the peak of the market and the bottom, or ȊWURXJK�ȋ
It’s been more than 50 years since Dr. King fought for equality, yet it is apparent that the American dream of homeownership is not equally shared by all, even today. Our research shows that minority home buyers are encountering GLɝFXOWLHV�WKDW�RIWHQ�DUHQȇW�VKDUHG�E\�ZKLWH�KRPH�buyers, and that even after they achieve the dream, they have been less likely to see a similar return on their investment.
Dr. Stan HumphriesZillow Chief Economist
Ȋ
Ȋ

Executive Summary6
For millions of Americans, owning one’s own home is a fundamental part of the
American Dream. It’s a goal shared equally among all people, regardless of race or ethnic origin. But while the goal is equally shared, the path to reaching that goal, and even experiences once homeownership is achieved, can be radically GLHUHQW� DPRQJ� WKRVH� UDFHV�
In this report, Zillow and the National Urban League examined recent trends in minority access WR� KRXVLQJ�� RXWOLQLQJ� WKH� GLHUHQW�experiences among races when seeking a mortgage and buying and owning a home. We discovered a number of areas in which outcomes for minority groups, particularly blacks and +LVSDQLFV��GLHU�JUHDWO\�IURP�WKRVH�RI� ZKLWH� $PHULFDQV�� 7R� SHUIRUP�our analysis we relied on Home Mortgage Disclosure Act (HMDA) data, Zillow Home Value Index data and unique information obtained from a survey performed by Ipsos for the purposes of this study.
Background
At a fundamental level, it is important to understand the characteristics and resources with which each group approaches the lending and homeownership SURFHVV��'LHUHQW�HGXFDWLRQ�OHYHOV�
or more towards a down payment. Asians are more likely to have down payments of 20 percent or higher. Figure 2 shows the distribution of down payment amount by race.
Experience
Regarding diversity in the home mortgage application experience, we found that blacks and Hispanics are less likely to apply for a mortgage to make a home purchase in the ȴUVW�SODFH��DQG�PXFK� OHVV� OLNHO\� WR�be approved for one than whites and Asians. While blacks make up 12.1 percent of the U.S. population, WKH\� ȴOHG� RQO\� �� SHUFHQW� RI� DOO�mortgage purchase applications in 2012. Hispanics make up 17.3 SHUFHQW�RI�WKH�SRSXODWLRQ�DQG�ȴOHG�9.4 percent of the applications. In contrast, whites make up 63 percent of the U.S. population DQG�ȴOHG������SHUFHQW�RI�SXUFKDVH�DSSOLFDWLRQV�� 7KH� GLHUHQFHV�are primarily seen within the conventional mortgage market. 7KH� UDFLDO� DQG� HWKQLF� FRPSRVLWLRQ�of FHA loan applications is much more similar to the racial and ethnic composition of the nation as a whole. Blacks and Hispanics are much more likely to apply for an FHA mortgage than a conventional loan when purchasing a home as more than half of black applicants (57.4 percent) and 60.3 percent of Hispanic applicants applied
among races, higher or lower incomes and varying credit scores all inevitably shape the home buying and homeownership experiences. 7KHUH� LV�QRW�VXɝFLHQW� LQIRUPDWLRQ�in the HMDA data nor in the survey data to determine if any of the ȴQGLQJV�LQ�WKLV�UHSRUW�UHȵHFW�LOOHJDO�discrimination. Rather, it is these FULWLFDO�GLHUHQFHV�LQ�TXDOLȴFDWLRQV�and resources among whites, blacks, Asians and Hispanics that undoubtedly help explain a PDMRULW\� RI� WKH� ȴQGLQJV� UHODWHG�WR� WKH�GLHUHQFHV� LQ� RXWFRPHV�E\�race.
In both the HMDA data and the survey data, blacks and Hispanics had a lower average income, as seen in Figure 1. Blacks and Hispanics who apply for a mortgage are also much more likely to have a lower credit score compared to whites and Asians. In addition, we found that of the surveyed Americans, Asians are much more likely to have achieved a higher level of education, which also contributes to their higher incomes.
7KHVH� XQHTXDO� LQFRPHV� QDWXUDOO\�OHDG� WR� VWDUN� GLHUHQFHV� LQ� WKH�amount of down payment that GLHUHQW� UDFHV� DUH� DEOH� WR� DRUG��Blacks are much more likely to put down 5 percent or less as a down payment, while a majority of Hispanics contribute 6 percent
Who is applying for mortgages? Who is successful?For some communities, the answer is not always the same.

White Black HispanicAsian
27%
34%33%
44%
28%
25%
21%
28%
48%
29%
39%
29%
5%
13%
19%
29%
31%
7%
25%24%
15%
23%
5%
11%
19%
26%
35%
6%
19%
26%
20%
26%
Source: Ipsos Zillow Survey
Source: Ipsos Zillow Survey
Fig. 1: Annual Household Income
Fig. 2: 'RZQ�3D\PHQW�6L]H��DV�D�3URSRUWLRQ�RI�7RWDO�+RPH�3ULFH
A House Divided 7
73.9% 46.5% 60.9% 50.9%
White Black Asian Hispanic
Source: American Community Survey 2011
Source: HMDA Data, 2012
Executive Summary8
Fig 3: Racial Composition of the Conventional Mortgage Application Process
Fig 4: Homeownership Rates (2011)
63.0%
Share of US population
that is White
12.1%
Share of US population
that is Black
4.6%
Share ofUS population
that is Asian
17.3%
Share of US population
that is Hispanic
68.6%
Share of all conventional mortgage
applications
2.9% 7.1% 5.4%
Share of all conventional mortgage
applications
Share of all conventional mortgage
applications
Share of all conventional mortgage
applications
73.4%
Share of all successful mortgage
applications
2.0% 7.0% 4.5%
Share of all successful mortgage
applications
Share of all successful mortgage
applications
Share of all successful mortgage
applications
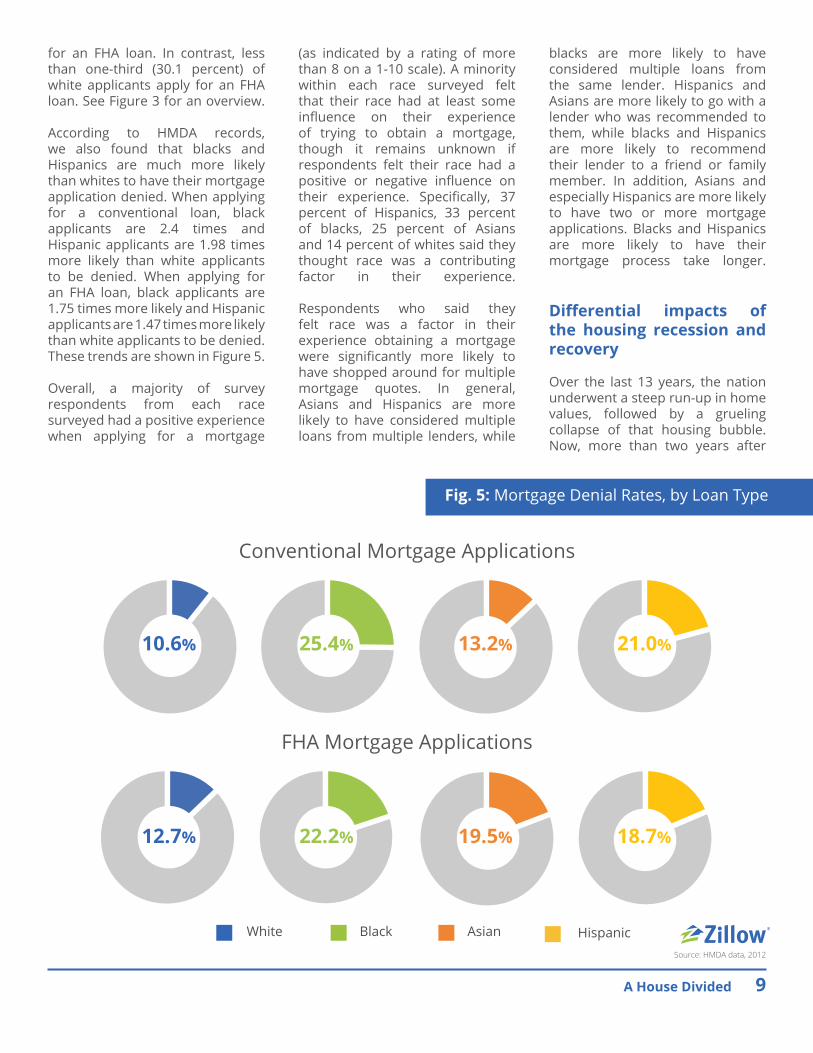
10.6% 25.4% 13.2% 21.0%
12.7% 22.2% 19.5% 18.7%
Conventional Mortgage Applications
FHA Mortgage Applications
White Black HispanicAsianSource: HMDA data, 2012
A House Divided 9
Fig. 5: 0RUWJDJH�'HQLDO�5DWHV��E\�/RDQ�7\SH
for an FHA loan. In contrast, less than one-third (30.1 percent) of white applicants apply for an FHA loan. See Figure 3 for an overview.
According to HMDA records, we also found that blacks and Hispanics are much more likely than whites to have their mortgage application denied. When applying for a conventional loan, black applicants are 2.4 times and Hispanic applicants are 1.98 times more likely than white applicants to be denied. When applying for an FHA loan, black applicants are 1.75 times more likely and Hispanic applicants are 1.47 times more likely than white applicants to be denied. 7KHVH�WUHQGV�DUH�VKRZQ�LQ�)LJXUH���
Overall, a majority of survey respondents from each race surveyed had a positive experience when applying for a mortgage
blacks are more likely to have considered multiple loans from the same lender. Hispanics and Asians are more likely to go with a lender who was recommended to them, while blacks and Hispanics are more likely to recommend their lender to a friend or family member. In addition, Asians and especially Hispanics are more likely to have two or more mortgage applications. Blacks and Hispanics are more likely to have their mortgage process take longer.
'LHUHQWLDO� LPSDFWV� RI�the housing recession and
recovery
Over the last 13 years, the nation underwent a steep run-up in home values, followed by a grueling collapse of that housing bubble. Now, more than two years after
(as indicated by a rating of more than 8 on a 1-10 scale). A minority within each race surveyed felt that their race had at least some LQȵXHQFH� RQ� WKHLU� H[SHULHQFH�of trying to obtain a mortgage, though it remains unknown if respondents felt their race had a SRVLWLYH� RU� QHJDWLYH� LQȵXHQFH� RQ�WKHLU� H[SHULHQFH�� 6SHFLȴFDOO\�� ���percent of Hispanics, 33 percent of blacks, 25 percent of Asians and 14 percent of whites said they thought race was a contributing factor in their experience.
Respondents who said they felt race was a factor in their experience obtaining a mortgage ZHUH� VLJQLȴFDQWO\� PRUH� OLNHO\� WR�have shopped around for multiple mortgage quotes. In general, Asians and Hispanics are more likely to have considered multiple loans from multiple lenders, while

2001 2003 2005 2007 2009 2011 2013
Hom
e Va
lues
by
Race
(Ind
exed
to 2
000)
White Black HispanicAsian
Home values appreciated at the highest rate among
Hispanics during the housing bubble, reaching a
peak in 2006.
Home values among Asians have nearly
rebounded completely from the housing
bubble, climbing to just 0.6% below peak
values in November 2013.
Note: This time series was formed from the Zillow Home Value Index at the zipcode level.
We categorize the zipcodes by race according to the racial or ethnic group with a plurality
of the population. We then estimate the average home value across this set of zipcodes
weighted by the total number of group members belonging to the zipcode.
Sources: Zillow November 2013, American Community Survey 2011
Executive Summary10
Fig. 6: Indexed Home Values, 2000-2013
home values bottomed, a robust housing recovery is currently underway. However, not everyone experienced the housing boom and bust in the same way.
Hispanic communities (where Hispanic individuals make up a larger share of the population than any other group) were hit hardest by the housing boom and bust, with home values falling 46.2 percent from the height of the bubble to the bottom. Black communities, where black individuals make up a larger share of the population
past two years. Comparatively, home values in black communities have only increased 13.2 percent.
)LJXUH� �� VKRZV� WKH� GLHUHQFH� LQ�current home values relative to their post-recession bottom (i.e., the low point in home values subsequent to the boom-era peak), and clearly demonstrates how much faster Asian communities have rebounded. Asian communities are in full recovery, with current home values only 0.6 percent below their peak levels. Hispanic communities are forecasted to do
than any other group, were also hit hard, with home values dropping 32.3 percent over the same period. Drops of 23.6 percent and 19.9 percent were observed within white and Asian communities, respectively (see Figure 7).
For Hispanic communities, there has been something of a silver lining. Even though home values in Hispanic communities were hardest hit, they’ve been relatively faster to recover. Home values in Hispanic communities have increased 25.3 percent from the bottom over the

Current Change from Peak 3HDN�WR�7URXJK
7URXJK�WR�&XUUHQW
7KH�SHUFHQWDJH�GLHUHQFH�LQ�LQGH[HG�=+9Ζ�OHYHOV�between the highest (peak) value and lowest (trough) value.
7KH�SHUFHQWDJH�GLHUHQFH�LQ�LQGH[HG�=+9Ζ�OHYHOV�between the highest (peak) value and the current value.
7KH�SHUFHQWDJH�GLHUHQFH�LQ�LQGH[HG�=+9Ζ�OHYHOV�between the highest (peak) value and the current value.
Black White Asian Hispanic
13.2% 13.4%
24.1%25.3%
Asian White Black Hispanic
-19.9% -23.6%
-32.3%
-46.2%
Asian White Black Hispanic
-0.6%
-13.4%
-23.3%
-32.6%
Sources: Zillow November 2013, American Community Survey 2011
A House Divided 11
Fig. 7: 'LHUHQFHV�LQ�+RPH�9DOXHV��2YHU�7LPH
the best over the next year in terms of home value growth. According to the Zillow Home Value Forecast, Hispanic communities will appreciate by 16.8 percent, Asian communities by 15.6 percent, white communities by 8.3 percent; and black communities by 8.5 percent.
Much of the drop and subsequent rise in home values can be attributed to the location of these communities. As Map 1 shows, many Asian communities are located on the West Coast, which has had an incredibly strong recovery.
homes altogether. We examined changes in homeownership rates over the last decade. In 2011, 46.5 percent of blacks and 50.9 percent of Hispanics owned their home. 7KH�KRPHRZQHUVKLS�UDWH�IRU�ZKLWHV�was 73.9 percent. Ownership rates for white and Hispanics have hardly changed over the course of the last decade (-0.1 and 0.1 percentage points respectively). However, among blacks the ownership rate dropped 2.4 percentage points, while the homeownership rate of Asians increased by 2.4 percentage points (see Figure 4).
While Hispanic communities were hit incredibly hard, with many of WKHP� ORFDWHG� LQ� WKH� ȊVDQG� VWDWHVȋ�of California, Arizona and Nevada, they are rebounding well (see Map 2). As Map 3 shows, blacks are located in many cities nationwide that have had less robust housing recoveries, putting a damper on their forecasted growth.
Unfortunately, during the housing bust, homeowners not only lost an enormous amount of value in their homes, but were frequently foreclosed upon, losing their

Alaskan Archipelago
Hawaii
Map 1: Zipcodes with Asian Plurality
Map 2: Zipcodes with Hispanic Plurality
Executive Summary12

Map Source: American Community Survey 2011
Map 3: Zipcodes with Black Plurality
A House Divided 13
A note about our survey results
7KHVH�DUH�VRPH�RI�WKH�ȴQGLQJV�RI�DQ�ΖSVRV�SROO�FRQGXFWHG�'HFHPEHU���WK�Ȃ���WK�������RQ�EHKDOI�RI�=LOORZ��)RU�WKH�survey, a sample of 700 randomly-selected adults aged 18 and over residing in the U.S. who have applied for a mortgage in the past three years were interviewed via Ipsos’ U.S. online panel. With a sample of this size, the results are considered accurate within +/-3.7 percentage points 19 times out of 20, of what they would have been had the HQWLUH�SRSXODWLRQ�RI�DGXOWV� LQ� WKH�8�6��ZKR�KDYH�DSSOLHG� IRU�D�PRUWJDJH� LQ� WKH�SDVW� WKUHH�\HDUV�EHHQ�SROOHG��7KH�PDUJLQ�RI�HUURU�ZLOO�EH� ODUJHU�ZLWKLQ�VXE�JURXSLQJV�RI�WKH�VXUYH\�SRSXODWLRQ��7KH�VXE�JURXS�RI�PRUWJDJH�DSSOLHUV�ZKR� IDOO�ZLWKLQ�HDFK�RI� WKH� IROORZLQJ� UDFH�HWKQLFLWLHV� �&DXFDVLDQV��$IULFDQ�$PHULFDQV��$VLDQV�3DFLȴF� ΖVODQGHUV�DQG�Hispanics/Latinos) is 175, which has a margin of error of +/-7.4. All sample surveys and polls may be subject to other sources of error, including, but not limited to coverage error, and measurement error. In this report when referencing the survey data the authors used the terms white and black as a proxy for Caucasian and African American.
A House Divided:
How Color Changes the
Path to Homeownership
In ����, U.S. median home values began falling in a precipitous slide that destroyed the home equity of mil-lions of U.S. homeowners and in turn, shook their con�dence. An aggregate national view, however, hidesthe di�erential impacts of the housing boom and bust on minority populations across the country. In ����,before the onset of the housing bubble, almost half of every black and Hispanic household owned theirown homes (��.� and ��.� percent, respectively), compared to almost three-quarters of white households(�� percent).
While the U.S. housing market recovery is fully underway and housing values continue to rise after theirhard fall, the story has hardly improved. According to census data, � percent fewer black households livein homes they own in ���� as compared to ����, dropping the ownership rate to ��.� percent. For thesame time period, the ownership rate of white and Hispanic households was essentially unchanged. Thispaper takes a look back on the diverging experiences of white, black, Asian, and Hispanic Americans andexplores the current access minority groups have to mortgage credit. The disparities in current access andpast experience continue to challenge the goals of equal opportunity for all.
SECTION �. HOME MORTGAGEAPPLICANTS: SHRINKING DIVERSITY
Current Composition of Mortgage Applicants
To understand the di�erences seen within the pool of mortgage applicants, it is �rst important to under-stand that there are substantial income di�erences between white, black, Asian, and Hispanic populationsin this country, and these fundamental disparities a�ect the abilities of members of each group to accumu-late �nancial assets, such as savings for a down payment on a home loan. White Americans, on average,earn $�� thousand per household. In comparison, black American households earn $�� thousand and His-panic Americans $�� thousand on average. Asian Americans are generally much more a�uent, making themost of any group at $�� thousand per household on average. On average, lower incomes mean a greatershare of earnings goes towards living expenses and less towards savings. It is then unsurprising that blacksand Hispanics are less likely to have the savings needed to apply for a mortgage to make a home purchase,and therefore end up renting.
Mortgage applicants, however, tend to be more a�uent than the population in general. Mortgage appli-cants for home purchase loans in ���� have a median income of $�� thousand, or �� percent higher thanthe national median of $�� thousand. The same applies for racial/ethnic groups. Those who do apply fora home loan tend to be each group’s more a�uent members. However, even among mortgage applicants,there are large disparities by race. Black and Hispanic applicants for conventional home loans earn muchless than their white counterparts – by more than �� percent. Federal Housing Administration (FHA) loanapplicants play on a more level �eld. Within this set, blacks and Hispanics earn $�� and $�� thousand ayear – ��.� and ��.� percent less than white FHA applicants, respectively.
In turn, the pool of applicants for primary mortgages does not re�ect the diversity of the U.S. population asa whole. Blacks make up ��.� percent of the total population, yet submitted only � percent of all applicationsfor primary mortgage loans in ����. There is a similar drop-o� for Hispanics. Making up ��.� percent of thetotal U.S. population, Hispanics contribute only �.� percent of these applications. These discrepancies areexacerbated within the pool of applications for conventional mortgages. Black applicants submit only �.�
A House Divided ��
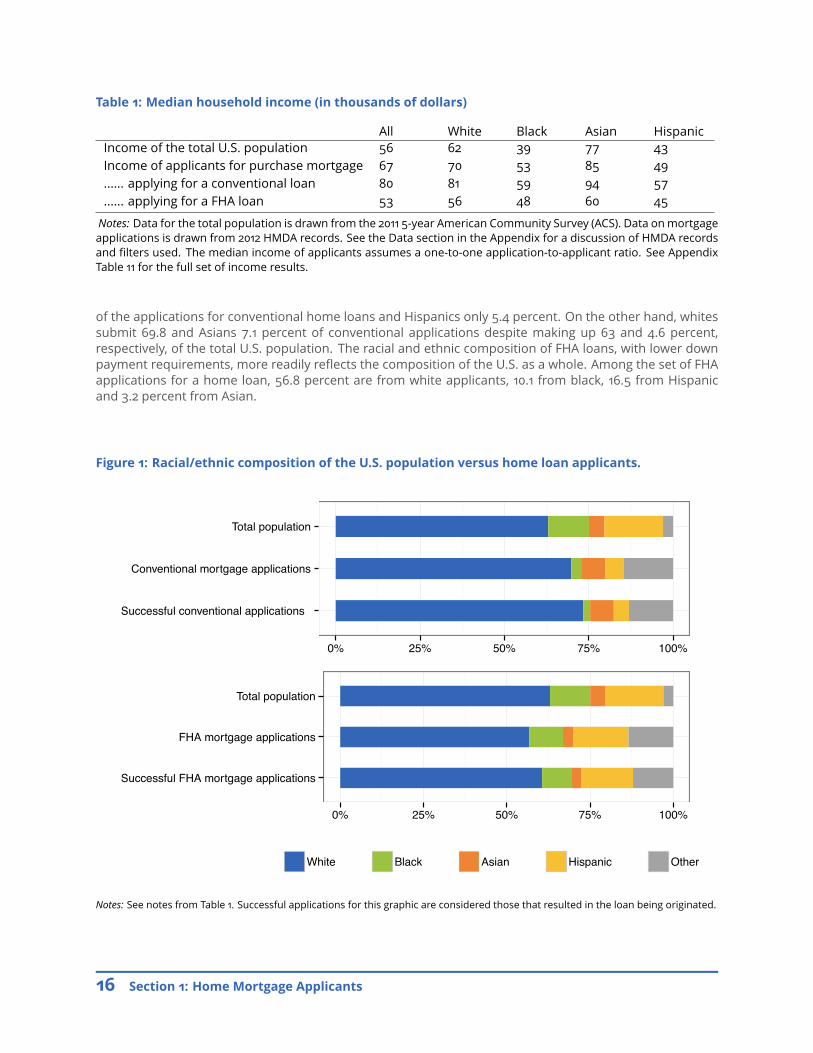
Table �: Median household income (in thousands of dollars)
All White Black Asian HispanicIncome of the total U.S. population �� �� �� �� ��Income of applicants for purchase mortgage �� �� �� �� ��...... applying for a conventional loan �� �� �� �� ��...... applying for a FHA loan �� �� �� �� ��
Notes: Data for the total population is drawn from the ���� �-year American Community Survey (ACS). Data on mortgageapplications is drawn from ���� HMDA records. See the Data section in the Appendix for a discussion of HMDA recordsand �lters used. The median income of applicants assumes a one-to-one application-to-applicant ratio. See AppendixTable �� for the full set of income results.
of the applications for conventional home loans and Hispanics only �.� percent. On the other hand, whitessubmit ��.� and Asians �.� percent of conventional applications despite making up �� and �.� percent,respectively, of the total U.S. population. The racial and ethnic composition of FHA loans, with lower downpayment requirements, more readily re�ects the composition of the U.S. as a whole. Among the set of FHAapplications for a home loan, ��.� percent are from white applicants, ��.� from black, ��.� from Hispanicand �.� percent from Asian.
Figure �: Racial/ethnic composition of the U.S. population versus home loan applicants.
Successful conventional applications
Conventional mortgage applications
Total population
0% 25% 50% 75% 100%
Successful FHA mortgage applications
FHA mortgage applications
Total population
0% 25% 50% 75% 100%
White Black Asian Hispanic Other
Notes: See notes from Table �. Successful applications for this graphic are considered those that resulted in the loan being originated.
�� Section �: Home Mortgage Applicants

Table �: Racial/ethnic composition of the U.S. population versus home loan applicants
White Black Asian Hispanic OtherTotal population ��% ��.�% �.�% ��.�% �%Primary mortgage applications ��.�% �% �.�% �.�% ��.�%Conventional mortgage applications ��.�% �.�% �.�% �.�% ��.�%FHA mortgage applications ��.�% ��.�% �.�% ��.�% ��.�%Notes: These numbers accompany Figure �. See the Appendix Table � for similar percentages for home re�nancingapplications.
Changing Number of Mortgage Applications Through theRecovery
Between ���� and ����, the number of applications for primary mortgages to purchase a home was stillfalling along with overall home sales. As national home values continued to drop, falling �.� percent fromJanuary ���� to December ����, the total number of applications in ���� fell �.� percent from the annual totalin the previous year. The drop in applications was most notable among black (-��.� percent) and Asian (-��.�percent) applicants and for FHA loan applications in general (-��.� percent).
Table �: The pattern of applications for primary mortgages to secure home purchase
All White Black Asian HispanicNumber of applications in ���� �,���,��� �,���,��� ���,��� ���,��� ���,���Change between ���� and ���� ��.�% ��.�% �.�% ��.�% �.�%Change between ���� and ���� -�.�% -�.�% -��.�% -��.�% -�.�%
Subset: Conventional loan applications
All White Black Asian HispanicNumber of applications in ���� �,���,��� �,���,��� ��,��� ���,��� ��,���Change between ���� and ���� ��.�% ��.�% ��.�% ��.�% ��.�%Change between ���� and ���� -�.�% �.�% �.�% -��.�% �.�%
Subset: FHA loan applications
All White Black Asian HispanicNumber of applications in ���� ���,��� ���,��� ��,��� ��,��� ���,���Change between ���� and ���� -�.�% �% �.�% -�.�% -�.�%Change between ���� and ���� -��.�% -��.�% -��.�% -��.�% -��.�%
Subset: VA loan applications
All White Black Asian HispanicNumber of applications in ���� ���,��� ���,��� ��,��� �,��� ��,���Change between ���� and ���� ��.�% ��% ��% ��% ��%Change between ���� and ���� ��% ��% �.�% ��.�% ��.�%Notes: Mortgage application counts are drawn from ����, ����, and ���� HMDA records. See the Data section in theAppendix for a discussion of HMDA records and �lters used. See Appendix Table � to review the changes in applicationsfor home re�nancing.
A House Divided ��
In January ����, national home values hit bottom, but the home value increases over that year began tobolster con�dence. Record low interest rates provided an opportunity for many aspiring homeowners andinvestors to purchase bargain value homes. During the �rst year of the housing market recovery we beganto see increased con�dence directly translate into a signi�cant pick-up in the number of new applicationsfor home purchase loans. In ����, the total number of applications for a primary home purchase mortgagewas ��.� percent higher than in ����. However, much of this pick-up in loan application activity was arguablydriven by investors and the a�uent: the increase between ���� and ���� is primarily within the conventionalloan market. The annual number of FHA loan applications remained essentially the same, down �.� percentfrom the total count in ����.
While not totally left out of the surge in those seeking homeownership, the increases from black and His-panic applicants are small compared to whites and Asians. Applications from white and Asian applicants forhome purchase loans went up ��.� and ��.� percent, respectively, between ���� and ����. Comparatively, thenumber of applications in ���� from blacks and Hispanics were only �.� and �.� percent higher, respectively,than in ����. Across all groups, the increases in the number of applications were driven by the market forconventional primary loans. Interestingly, the increase in conventional home purchase applications is com-parable between Asian and black applicants, ��.� and ��.� percent respectively, though whites still outpaceat ��.� percent, and Hispanics still lag at ��.� percent.
�� Section �: Home Mortgage Applicants

SECTION �. DIVERSITY OF EXPERIENCEIN THE HOME MORTGAGE APPLICATIONPROCESS
Mortgage Options and Application Success
Not only are there large di�erences in the general characteristics of mortgage applicants across race andethnic groups, there are also signi�cant di�erences in the success of these applicants through the approvalprocess.
Since it has lower down payment requirements than a conventional loan, an FHA loan is often a betterchoice for low-income households who do not have su�cient savings for a conventional loan. Given ourprevious discussion on the income disparities across races, it is unsurprising that black and Hispanic ap-plicants, unlike white and Asian, are more likely to apply for an FHA loan. Over half of the applicationsfrom black applicants (��.� percent) and ��.� percent from Hispanic applicants, are for HUD-backed FHAloans. In comparison, only ��.� percent of white applicants and ��.� percent of Asian applicants turn to FHAmortgages to �nance their home purchase. Because of this, and the large di�erences in the distributions ofincome reported between FHA and conventional loan applications, even within each racial/ethnic group[�],it is useful to consider the loan types to be two separate tracks when analyzing the success of applicants byrace or ethnicity.
Table �: Breakdown of primary mortgage applications by racial/ethnic group
White Black Asian HispanicPercent of applicant racial/ethnic group by loan type
Conventional loan ��.�% ��.�% ��.�% ��%FHA loan ��.�% ��.�% ��.�% ��.�%
Denial rate (of all complete applications)... for a conventional loan ��.�% ��.�% ��.�% ��%... for an FHA loan ��.�% ��.�% ��.�% ��.�%
Origination rate (of all applications submitted)... for a conventional loan ��% ��.�% ��.�% ��.�%... for an FHA loan ��.�% ��.�% ��.�% ��.�%
Percent of all applications submitted... where funds were originated ��.�% ��.�% ��.�% ��.�%... where the applicant declined funds after approval �.�% �.�% �.�% �%... where funds were denied by �nancial institution ��% ��.�% ��.�% ��.�%... where the application was withdrawn or left un�nished ��.�% ��.�% ��.�% ��.�%
Notes: See notes from Table �. See Appendix Table �� for the full set of results.
[�] Within racial/ethnic groups the median income stated on FHA applications by white, black, Asian, and Hispanic applicants is ��, ��,��, and �� percent lower, respectively, than the median income reported on conventional loan applications, in order, from those samegroups.
A House Divided ��
Conventional
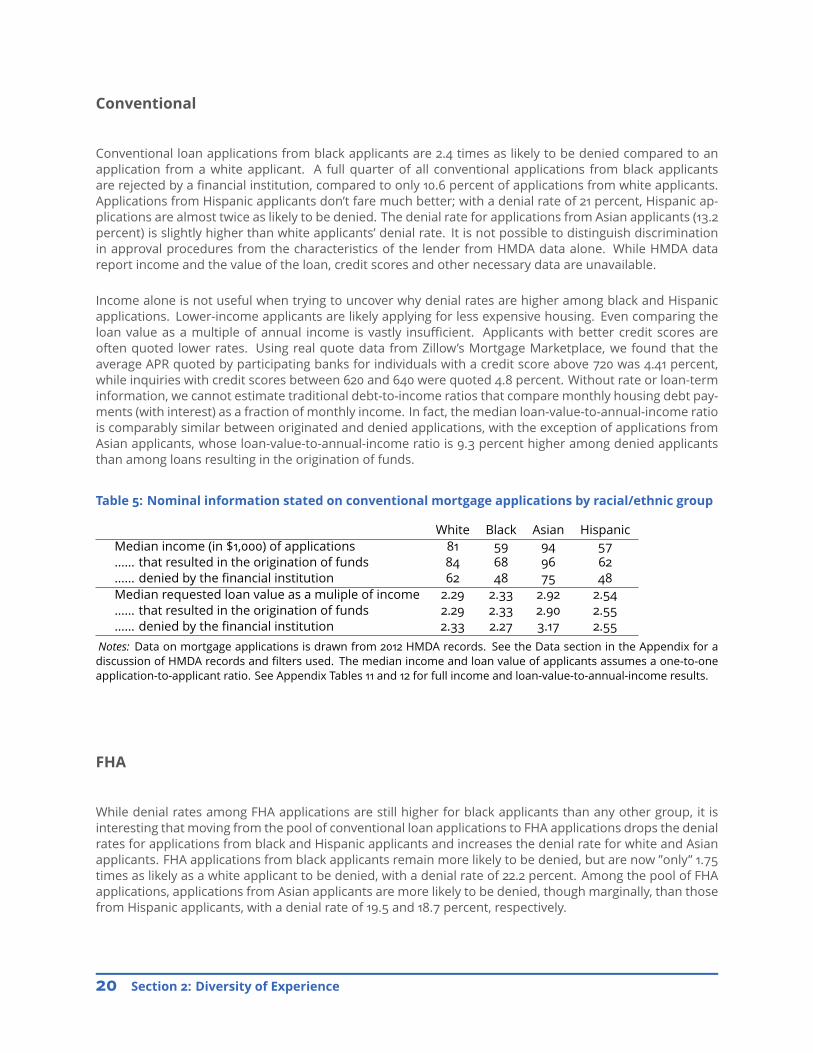
Conventional loan applications from black applicants are �.� times as likely to be denied compared to anapplication from a white applicant. A full quarter of all conventional applications from black applicantsare rejected by a �nancial institution, compared to only ��.� percent of applications from white applicants.Applications from Hispanic applicants don’t fare much better; with a denial rate of �� percent, Hispanic ap-plications are almost twice as likely to be denied. The denial rate for applications from Asian applicants (��.�percent) is slightly higher than white applicants’ denial rate. It is not possible to distinguish discriminationin approval procedures from the characteristics of the lender from HMDA data alone. While HMDA datareport income and the value of the loan, credit scores and other necessary data are unavailable.
Income alone is not useful when trying to uncover why denial rates are higher among black and Hispanicapplications. Lower-income applicants are likely applying for less expensive housing. Even comparing theloan value as a multiple of annual income is vastly insu�cient. Applicants with better credit scores areoften quoted lower rates. Using real quote data from Zillow’s Mortgage Marketplace, we found that theaverage APR quoted by participating banks for individuals with a credit score above ��� was �.�� percent,while inquiries with credit scores between ��� and ��� were quoted �.� percent. Without rate or loan-terminformation, we cannot estimate traditional debt-to-income ratios that compare monthly housing debt pay-ments (with interest) as a fraction of monthly income. In fact, the median loan-value-to-annual-income ratiois comparably similar between originated and denied applications, with the exception of applications fromAsian applicants, whose loan-value-to-annual-income ratio is �.� percent higher among denied applicantsthan among loans resulting in the origination of funds.
Table �: Nominal information stated on conventional mortgage applications by racial/ethnic group
White Black Asian HispanicMedian income (in $�,���) of applications �� �� �� ��...... that resulted in the origination of funds �� �� �� ��...... denied by the �nancial institution �� �� �� ��Median requested loan value as a muliple of income �.�� �.�� �.�� �.��...... that resulted in the origination of funds �.�� �.�� �.�� �.��...... denied by the �nancial institution �.�� �.�� �.�� �.��
Notes: Data on mortgage applications is drawn from ���� HMDA records. See the Data section in the Appendix for adiscussion of HMDA records and �lters used. The median income and loan value of applicants assumes a one-to-oneapplication-to-applicant ratio. See Appendix Tables �� and �� for full income and loan-value-to-annual-income results.
FHA
While denial rates among FHA applications are still higher for black applicants than any other group, it isinteresting that moving from the pool of conventional loan applications to FHA applications drops the denialrates for applications from black and Hispanic applicants and increases the denial rate for white and Asianapplicants. FHA applications from black applicants remain more likely to be denied, but are now ”only” �.��times as likely as a white applicant to be denied, with a denial rate of ��.� percent. Among the pool of FHAapplications, applications from Asian applicants are more likely to be denied, though marginally, than thosefrom Hispanic applicants, with a denial rate of ��.� and ��.� percent, respectively.
�� Section �: Diversity of Experience
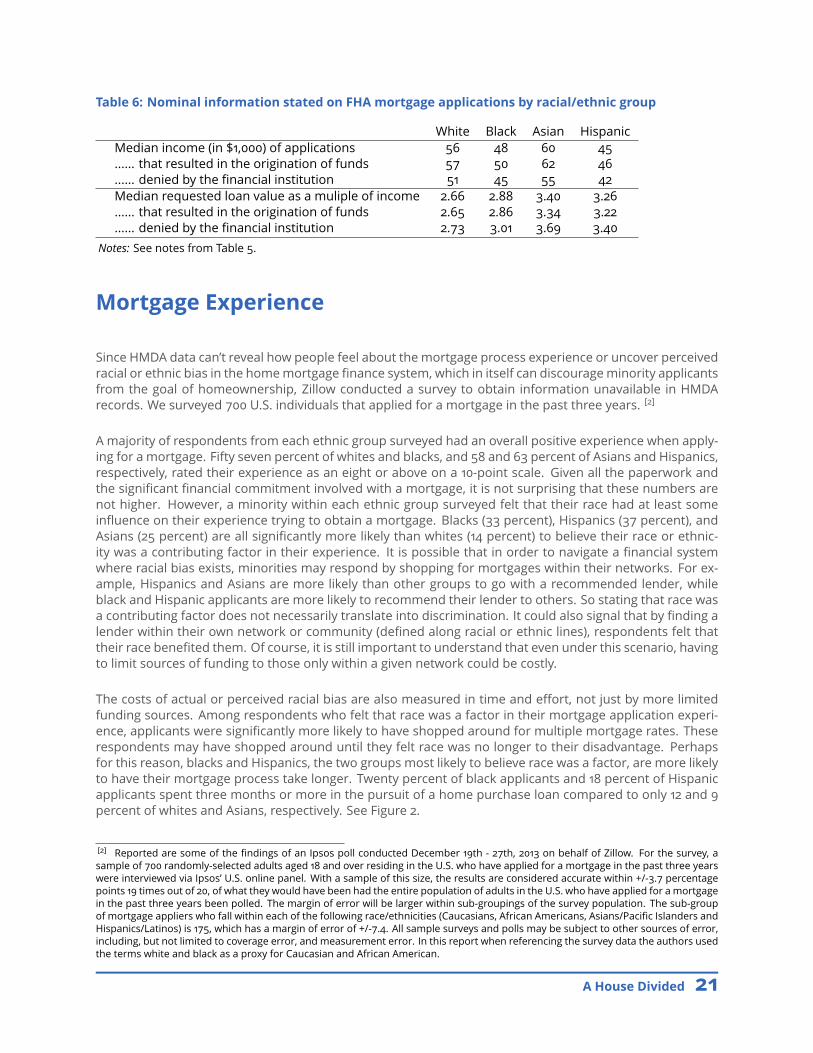
Table �: Nominal information stated on FHA mortgage applications by racial/ethnic group
White Black Asian HispanicMedian income (in $�,���) of applications �� �� �� ��...... that resulted in the origination of funds �� �� �� ��...... denied by the �nancial institution �� �� �� ��Median requested loan value as a muliple of income �.�� �.�� �.�� �.��...... that resulted in the origination of funds �.�� �.�� �.�� �.��...... denied by the �nancial institution �.�� �.�� �.�� �.��
Notes: See notes from Table �.
Mortgage Experience
Since HMDA data can’t reveal how people feel about the mortgage process experience or uncover perceivedracial or ethnic bias in the home mortgage �nance system, which in itself can discourage minority applicantsfrom the goal of homeownership, Zillow conducted a survey to obtain information unavailable in HMDArecords. We surveyed ��� U.S. individuals that applied for a mortgage in the past three years. [�]
A majority of respondents from each ethnic group surveyed had an overall positive experience when apply-ing for a mortgage. Fifty seven percent of whites and blacks, and �� and �� percent of Asians and Hispanics,respectively, rated their experience as an eight or above on a ��-point scale. Given all the paperwork andthe signi�cant �nancial commitment involved with a mortgage, it is not surprising that these numbers arenot higher. However, a minority within each ethnic group surveyed felt that their race had at least somein�uence on their experience trying to obtain a mortgage. Blacks (�� percent), Hispanics (�� percent), andAsians (�� percent) are all signi�cantly more likely than whites (�� percent) to believe their race or ethnic-ity was a contributing factor in their experience. It is possible that in order to navigate a �nancial systemwhere racial bias exists, minorities may respond by shopping for mortgages within their networks. For ex-ample, Hispanics and Asians are more likely than other groups to go with a recommended lender, whileblack and Hispanic applicants are more likely to recommend their lender to others. So stating that race wasa contributing factor does not necessarily translate into discrimination. It could also signal that by �nding alender within their own network or community (de�ned along racial or ethnic lines), respondents felt thattheir race bene�ted them. Of course, it is still important to understand that even under this scenario, havingto limit sources of funding to those only within a given network could be costly.
The costs of actual or perceived racial bias are also measured in time and e�ort, not just by more limitedfunding sources. Among respondents who felt that race was a factor in their mortgage application experi-ence, applicants were signi�cantly more likely to have shopped around for multiple mortgage rates. Theserespondents may have shopped around until they felt race was no longer to their disadvantage. Perhapsfor this reason, blacks and Hispanics, the two groups most likely to believe race was a factor, are more likelyto have their mortgage process take longer. Twenty percent of black applicants and �� percent of Hispanicapplicants spent three months or more in the pursuit of a home purchase loan compared to only �� and �percent of whites and Asians, respectively. See Figure �.
[�] Reported are some of the �ndings of an Ipsos poll conducted December ��th - ��th, ���� on behalf of Zillow. For the survey, asample of ��� randomly-selected adults aged �� and over residing in the U.S. who have applied for a mortgage in the past three yearswere interviewed via Ipsos’ U.S. online panel. With a sample of this size, the results are considered accurate within +/-�.� percentagepoints �� times out of ��, of what they would have been had the entire population of adults in the U.S. who have applied for a mortgagein the past three years been polled. The margin of error will be larger within sub-groupings of the survey population. The sub-groupof mortgage appliers who fall within each of the following race/ethnicities (Caucasians, African Americans, Asians/Paci�c Islanders andHispanics/Latinos) is ���, which has a margin of error of +/-�.�. All sample surveys and polls may be subject to other sources of error,including, but not limited to coverage error, and measurement error. In this report when referencing the survey data the authors usedthe terms white and black as a proxy for Caucasian and African American.
A House Divided ��

In this same vein, Asians and Hispanics in general are more likely to have considered multiple loans frommultiple lenders, and are more likely to submit more than one application. Twenty seven percent of Asianand �� percent of Hispanic respondents claimed to have submitted two or more applications in their pursuitof home �nancing, whereas this share is �� and �� percent among black and white respondents, respectively.This coincides with our �ndings from ���� HMDA records: applications submitted by Asians and Hispanicsand approved by the �nancial institution are declined by the applicants �.� and �.� percent of the time,respectively, whereas this share is �.� among white and �.� percent among black applications. Surveyresults also suggest that blacks are more likely to have considered multiple loans from the same lender.Whether this translates into separate applications through the same lender is not clear or discernable usingHMDA data.
We discussed earlier that Asian and white applicants are far more likely than black or Hispanic applicants toapply for conventional loans over FHA loans. Commiserate with this result, Asian and white applicants aremore likely to put at least �� percent down on their mortgage, whereas Hispanic and black applicants aremore likely to have down payments of less than �� percent. Over forty percent of black survey respondentsreported applying for down payments of � percent or less. See Figure �.
Figure �: Key Survey Results: Time spent seeking a mortgage
�� Section �: Diversity of Experience

Figure �: Key Survey Results: Downpayment as a proportion of home value
A House Divided ��

SECTION �. DIFFERENTIAL IMPACTS OFTHE HOUSING RECESSION
From ���� until the beginning of ����, national housing values grew at an unsustainable pace. Over thosesix years, home values appreciated �� percent, translating to an average annual appreciation rate of �.�percent. In comparison, over the �� years before the bubble (���� through ����) annual appreciation aver-aged only �.� percent[�]. It soon became clear that home values were �ying too close to the sun, and likeIcarus, began to plummet. By January ����, national home values hit bottom, having fallen ��.� percentfrom their peak in April ����. During the �rst quarter of ����, ��.�% of U.S. homeowners with a mortgagewere underwater, owing more than their homes were worth.
As painful as the national story sounds, it hides the di�erential impacts to di�erent groups across thecountry. The housing bubble and its bust were by far a bigger roller coaster for popular supply-constrainedurban areas (like the cities of Los Angeles and San Jose, where home values fell �� and �� percent frompeak to trough, respectively) and in speculative markets with high rates of construction during the bubble(like the cities of Las Vegas, Phoenix and Miami, where home values fell ��, �� and �� percent, respectively).Figure � maps the fall in county median home values from their peak level to their troughs.
Figure �: Drop in home values from peak to trough for U.S. counties
Fall in Home Values
less than 5% drop
between 5 and 15%
between 15 and 30%
between 30 and 45%
drop more than 45%
[�] Historical appreciation is estimated using data from the Federal Housing Finance Agency (FHFA) House Price Index.
�� Section �: Di�erential impacts of the housing recession

Figure �: Zipcodes by racial or ethnic pluralities
Alaskan Archipelago
Hawaii
Black
Hispanic
Asian
Dots are placed above
zipcodes where the
racial/ethnic group
indicated makes up
a larger share of the
total population than
any other group.
The size of the dots
(small, median, large)
indicate the percent
of the total population
composed of the group
(under 50%, between
50% and 75%, and over
75%, respectively).
A House Divided ��

Minority groups su�ered a one-two punch over the course of the housing bubble and bust. Not only werethey predominately located in many of the hardest hit metros (See Figure �), low-income and minoritygroups were also often the target of predatory lending for subprime mortgages[�]. A report by the U.S.Department of Housing and Urban Development (HUD) found that in the years leading up to the bubble,subprime loans were three times more likely to be written for applicants in low-income neighborhoods thanhigh-income, and �ve times more likely in black neighborhoods than white[�]. By late ����, delinquencyrates among subprime loans topped �� percent, but remained below �� percent among FHA and primeloans [�]
An ideal measure to capture the di�erential experiences of white, black, Hispanic, and Asian homeownersin the U.S. housing market over the course of the bubble and bust would be to track the value of homesowned by members of each group. Because this option is unavailable, we instead used median home valueswithin ZIP codes where the given group composes a larger share of the total population than any othergroup to estimate the time path of home values within racial or ethnic communities. The national medianhome value associated with a given group in a given month is then the weighted average of these ZIP codemedians, where the weights used are the ZIP codes’ group member counts. (See the methodology sectionon page �� for a discussion of our methodology, the di�erent speci�cations explored, and our argumentsfor this particular choice.) This way, when analyzing the time path of home values for black Americans, onlyZIP codes with a strong black presence are considered and the largest weight is given to the ZIP code withthe greatest black population.
Figure �: Home values within racial or ethnic communities
Level
$200,000
$400,000
$600,000
2000 2002 2004 2006 2008 2010 2012 2014
White Black Hispanic Asian
Indexed to January ����
1.0
1.5
2.0
2.5
2000 2002 2004 2006 2008 2010 2012 2014
White Black Hispanic Asian
Notes: These national race based time series were formed from the Zillow Home Value Index at the zipcode level. We categorize thezipcodes by race according to the racial or ethinic group with the largest share of the population. For each month, we then estimate theweighted average home value within these ZIP code subsets, where each ZIP code is weighted by number of group members withinits boundaries.
Figure � presents these di�erent time paths. The graph to the left gives the median home value over timewithin di�erent racial/ethnic communities. The graph on the right provides home values relative to theirlevel in January ����. It is this indexed graph that is most useful when analyzing the impact of the housing[�] Gerardi and Willen (����) review the academic literature looking at trends in minority home ownership and the role of subprimemortgages. Gerardi, K. & Willen, P. (����). Subprime Mortgages, Foreclosures. and Urban Neighborhoods. The B.E. Journal of EconomicAnalysis & Policy, �(�).[�]US Department of Housing and Development. (����). Unequal Burden: Income and Racial Disparities in SubPrime Lending in America.Washington, DC: Department of Housing and Urban Development.[�] Apgar, W. C. (����). Getting on the Right Track: Improving Low-Income and Minority Access to Mortgage Credit after the Housing Bust.Working paper. Cambridge, MA: Joint Center for Housing Studies, Harvard University.
�� Section �: Di�erential impacts of the housing recession

recession. For instance, home values in Hispanic communities, located predominantly in areas stronglya�ected by the bubble and its bust including California, Arizona, and Florida, were more than �.� timeswhat they had been in January of ���� by the time they peaked in mid-����. Hit hardest among all thegroups in this study, home values in Hispanic communities dropped ��.� percent from the height of thebubble to the trough in January ����. Black communities were the second-most a�ected group, losing ��.�percent of their peak home values when the bubble burst. Comparatively, a drop of ��.� percent and ��.�percent was observed within white and Asian communities, respectively.
While home values in Hispanic communities were harder hit, they’ve also been faster to recover. Fromtrough values in early ���� to November ����, home values in black communities increased by ��.� percent,but are still ��.� percent below their peak levels. In Hispanic communities, the growth since bottominghas been greater, at ��.� percent, but with further to go, home values in these communities are still down��.�% from peak. White communities have been appreciating at about the same pace as black communities,despite not having fallen as far, and are currently only ��.� percent below their peak home value levels. Incommunities where Asians make up the largest share of the population, it is as if the bubble had neverburst - home values are currently only �.� percent o� their peak levels.
The forecasted growth in home values follows a similar pattern as the recent growth for each group. Homevalues in Hispanic communities are forecasted to grow by ��.� percent, Asian communities by ��.� percent,black communities by �.� percent, and white communities by �.� percent. With the more moderate growthexpected for black communities and the longer way to go before returning to peak levels, black communitiesmay end up to be the hardest hit from the housing recession.
Table �: Zillow housing market metrics for racial/ethnic communities
White Black Hispanic AsianPeak to trough -��.�% -��.�% -��.�% -��.�%Trough to current ��.�% ��.�% ��.�% ��.�%Current down from peak -��.�% -��.�% -��.�% -�.�%ZHVI ($k) ���.� ���.� ���.� ���.��-year forecast �.�% �.�% ��.�% ��.�%Notes: These numbers accompany Figure �.
The Housing Recession by Race: Methodology
Our primary goal is to model the experiences of white, black, Asian, and Hispanic homeowners throughthe housing bubble, bust and recovery thus far. Because homeowners’ race and ethnicity information isgenerally unavailable in public record data from which home value indices are created, we must turn toaggregated measures to model the path of home values within communities de�ned by a given race. Inorder to be as accurate as possible, we use the Zillow Home Value Index (ZHVI) at the ZIP code level, thesmallest geographical unit available with maximal home value coverage across the United States.
Using population data from the ���� �ve-year American Community Survey (ACS), a natural �rst pass for thisanalysis is to create a simple race-weighted national ZHVI time series. Here, the national median home valueassociated with a given racial or ethnic group is a weighted average of the ZIP codes’ median home values,where the weights applied are the ZIP code population counts of the targeted group. Figure � presentsthe home value paths for di�erent minority groups according to this �rst approach, a race-weighted ZHVIusing all U.S. ZIP codes. In this �gure, Hispanic home values are down �� percent from their peak levels,black home values are down ��.� percent, white home values are down ��.� percent and Asian values aredown ��.� percent. Relative to the results presented in the main body of the report, these values are all
A House Divided ��

attenuated towards each other; the experiences of the di�erent groups are more similar to each other thanwhen broken out by racial or ethnic communities.
Figure �: Simple race weighted home values (not narrowed to racial/ethnic communities)
Level
$100,000
$200,000
$300,000
$400,000
2000 2002 2004 2006 2008 2010 2012 2014
White Black Hispanic Asian
Indexed to Jan ����
1.2
1.6
2.0
2000 2002 2004 2006 2008 2010 2012 2014
White Black Hispanic Asian
Notes: These national race based time series were formed from the Zillow Home Value Index at the zipcode level. For each month, weestimate the weighted average home value using all ZIP codes, where each ZIP code is weighted by number of group members withinits boundaries.
Note that for this �rst approach, the ZIP code with the greatest number of blacks, for example, is weightedthe most heavily, regardless if blacks constitute only a very small minority of the total population within theZIP code. This could present a problem if certain groups are systematically (dis)advantaged within certainZIP codes. In such cases, the median home value of the ZIP codes could re�ect the median home value ofthe majority group, and not the median home values of, say, local black homeowners. Our strategy to bettertarget the di�erent experiences of racial or ethnic groups is to limit the set of ZIP codes to those where themedian home value is more likely to re�ect the median home value of homes owned by the targeted group.
Our �rst iteration of this approach is to include only those ZIP codes where the racial or ethnic group is ofthe majority. The weights used to aggregate the ZIP codes to a national level remain population counts ofthe targeted group within each ZIP code. Under an assumption of racial or ethnic clustering, this method-ology is desirable. Limiting the set of ZIP codes in this way emphasizes the di�ering home value paths ofthe communities of each of the racial or ethnic groups. Note, however, that not all members of the selectedracial or ethnic group in the U.S. are accounted for. Speci�cally, ��.� percent of whites live in ZIP codeswhere they are of the majority, whereas this share is only ��.�, ��.�, and �.� percent for Hispanic, black, andAsian populations, respectively. Figure � explores the results using this approach and indicates home valuesin Hispanic communities are currently down ��.� percent from their peak values. In black and white com-munities, home values are down �� percent and �� percent, respectively, from peak. In Asian communities,de�ned by ZIP codes with a majority Asian population, home values are �.� percent above peak.
Our second iteration of this racial clustering approach is to include only those ZIP codes where the racialor ethnic group is of the plurality versus majority, (i.e., they compose the greatest share of the total popu-lation of all other racial/ethnic groups). The weights applied in the weighted average are still the ZIP codes’population counts of the targeted group. Relative to the majority approach in the �rst iteration above,this approach improves the coverage of the U.S. population while producing similar overall results for eachgroup. Speci�cally, whites living in ZIP codes where they are the plurality compose �� percent of the totalU.S. white population and ��.�, ��.�, and ��.� percent for the black, Hispanic, and Asian populations, respec-tively. Given the similarity of the majority and plurality approaches but the better population coverage ofthe latter, the results from the plurality approach are presented in the body of the paper above.
�� Section �: Di�erential impacts of the housing recession

Figure �: Home values within racial or ethnic communities de�ned by a majority
Level
$100,000
$200,000
$300,000
$400,000
$500,000
$600,000
2000 2002 2004 2006 2008 2010 2012 2014
White Black Hispanic Asian
Indexed to Jan ����
1.0
1.5
2.0
2.5
2000 2002 2004 2006 2008 2010 2012 2014
White Black Hispanic Asian
Notes: These national race based time series were formed from the Zillow Home Value Index at the zipcode level. We categorize thezipcodes by race according to the racial or ethinic group with a majority share of the population. For each month, we then estimate theweighted average home value within these ZIP code subsets, where each ZIP code is weighted by number of group members withinits boundaries.
A House Divided ��

Appendix

APPENDIX
Data
Data covering the entire population was drawn from the ���� �ve-year American Community Survey (ACS) atthe ZIP code level. This includes population counts, median income, and ownership rates by race and eth-nicity. Ownership rates by race and ethnicity were also pulled from the ���� decennial census to estimatechanges over time in this important metric.
With the exception of survey results (see footnote on page ��), all information covering mortgage applica-tions and applicants is drawn from Home Mortgage Disclosure Act (HMDA) data. In our analysis, we excludeloan applications to the Farm Service Agency or Rural Housing Service; loans requested for the purposeof home improvement or for a second lien on the property; and loans for the purchase or re�nancingof manufactured housing units. We only retain those records where the loan applicant will be occupyingthe property, in order to avoid purchases made exclusively for the purposes of investment. We also excludethose loan records corresponding to approved pre-approval requests that were subsequently not accepted.That category is subject to optional reporting and so is not a national sample.
Throughout the analysis, both when analyzing census or HMDA data, when race is speci�ed, mixed-raceindividuals and mixed-race couples are excluded, though they are included in any ”All” category. In the caseof a co-signer on the loan application, application records are excluded if the co-signer has a di�erent raceor ethnicity than the primary applicant.
A House Divided ��

Tables
Table �: Racial composition by various populations
Percent of White Black Asian Hispanic... total population ��% ��.�% �.�% ��.�%... all mortgage applications ��.�% �.�% �.�% �.�%........ for home purchase ��.�% �% �.�% �.�%............. that are successful ��.�% �.�% �.�% �.�%........ for re�nancing ��.�% �.�% �.�% �.�%............. that are successful ��.�% �.�% �.�% �.�%... conventional loan applications ��.�% �.�% �.�% �.�%........ for home purchase ��.�% �.�% �.�% �.�%............. that are successful ��.�% �% �% �.�%........ for re�nancing ��.�% �.�% �.�% �.�%............. that are successful ��.�% �.�% �.�% �.�%... FHA loan applications ��% �% �.�% ��.�%........ for home purchase ��.�% ��.�% �.�% ��.�%............. that are successful ��.�% �.�% �% ��.�%........ for re�nancing ��.�% �.�% �.�% �.�%............. that are successful ��.�% �.�% �.�% �.�%... VA loan applicants ��.�% ��.�% �.�% �.�%Notes:Data for the total population is drawn from the ���� �-year American Community Survey (ACS). Data on mortgageapplications is drawn from ���� HMDA records. Successful applications for this table are considered those that resultedin the loan being originated. See the Data section in the Appendix for a discussion of HMDA records and �lters used.
�� Appendix

Table �: The pattern of applications through the housing recovery
(a) Applications for primary mortgages to secure home purchase
All White Black Asian HispanicNumber of applications in ���� �,���,��� �,���,��� ���,��� ���,��� ���,���Change between ���� and ���� ��.�% ��.�% �.�% ��.�% �.�%Change between ���� and ���� -�.�% -�.�% -��.�% -��.�% -�.�%
Subset: Conventional loan applications
All White Black Asian HispanicNumber of applications in ���� �,���,��� �,���,��� ��,��� ���,��� ��,���Change between ���� and ���� ��.�% ��.�% ��.�% ��.�% ��.�%Change between ���� and ���� -�.�% �.�% �.�% -��.�% �.�%
Subset: FHA loan applications
All White Black Asian HispanicNumber of applications in ���� ���,��� ���,��� ��,��� ��,��� ���,���Change between ���� and ���� -�.�% �% �.�% -�.�% -�.�%Change between ���� and ���� -��.�% -��.�% -��.�% -��.�% -��.�%
Subset: VA loan applications
All White Black Asian HispanicNumber of applications in ���� ���,��� ���,��� ��,��� �,��� ��,���Change between ���� and ���� ��.�% ��% ��% ��% ��%Change between ���� and ���� ��% ��% �.�% ��.�% ��.�%
(b) Applications to re�nance a primary mortgage
All White Black Asian HispanicNumber of applications in ���� �,���,��� �,���,��� ���,��� ���,��� ���,���Change between ���� and ���� ��.�% ��.�% ��% ��.�% ��%Change between ���� and ���� -��.�% -��% -��.�% -��.�% -�.�%
Subset: Conventional loan applications
All White Black Asian HispanicNumber of applications in ���� �,���,��� �,���,��� ���,��� ���,��� ���,���Change between ���� and ���� ��.�% ��.�% ��.�% ��.�% ��.�%Change between ���� and ���� -��.�% -��.�% -�.�% -��.�% -�.�%
Subset: Conventional loan applications
All White Black Asian HispanicNumber of applications in ���� ���,��� ���,��� ��,��� ��,��� ��,���Change between ���� and ���� �.�% �.�% -�.�% ��.�% ��%Change between ���� and ���� -��.�% -��.�% -��.�% -��.�% -��.�%
Subset: VA loan applications
All White Black Asian HispanicNumber of applications in ���� ���,��� ���,��� ��,��� �,��� ��,���Change between ���� and ���� ��% ��.�% ��.�% ��.�% ��.�%Change between ���� and ���� ��.�% ��.�% ��.�% ��.�% ��.�%
Notes: Mortgage application counts are drawn from ����, ����, and ���� HMDA records.
A House Divided ��

Tabl
e�:
Brea
kdow
nof
appl
icat
ions
byra
cial
/eth
nic
grou
pan
dlo
anpu
rpos
e
Prim
ary
mor
tgag
eap
plic
atio
nsfo
rho
me
purc
hase
Appl
icat
ions
tore
�nan
ceth
epr
imar
ym
ortg
age
Whi
teBl
ack
Asia
nH
ispa
nic
Whi
teBl
ack
Asia
nH
ispa
nic
Perc
ento
fapp
licat
ion
subg
roup
bylo
anty
peCo
nven
tiona
lloa
n��
.�%
��.�
%��
.�%
��%
��.�
%��
.�%
��.�
%��
.�%
FHA
loan
��.�%
��.�
%��
.�%
��.�
%�.
�%��
.�%
�.�%
��.�
%VA
loan
�.�%
��.�
%�.
�%�.
�%�.
�%�.
�%�.
�%�.
�%Pe
rcen
tofa
pplic
atio
nsu
bgro
upby
acti
onFu
nds
succ
essf
ully
rece
ived
(orig
inat
ed)
��.�
%��
.�%
��.�
%��
.�%
��.�
%��
.�%
��.�
%��
.�%
Appl
ican
tdec
lined
fund
saf
tera
ppro
val
�.�%
�.�%
�.�%
�%�.
�%�.
�%�.
�%�.
�%Fu
nds
deni
edby
�nan
cial
inst
itutio
n��
%��
.�%
��.�
%��
.�%
��.�%
��.�
%��
.�%
��.�
%Ap
plic
atio
nw
asw
ithdr
awn
orle
ftun
�nis
hed
��.�
%��
.�%
��.�
%��
.�%
��.�
%��
.�%
��.�%
��.�
%Lo
anap
prov
alra
te...
fora
conv
entio
nall
oan
��%
��.�
%��
.�%
��.�%
��.�
%��
.�%
��.�
%��
%...
fora
nFH
Alo
an��
.�%
��.�
%��
.�%
��.�
%��
.�%��
.�%
��.�
%��
.�%
...fo
ran
VAlo
an��
.�%
��.�
%��
.�%
��.�
%��
.�%
��.�%
��.�
%��
.�%
Ori
gina
tion
rate
...fo
raco
nven
tiona
lloa
n��
%��
.�%
��.�%
��.�
%��
.�%
��.�%
��.�
%��
.�%
...fo
ran
FHA
loan
��.�
%��
.�%
��.�
%��
.�%
��.�
%��
.�%
��.�
%��
.�%
...fo
ran
VAlo
an��
.�%
��.�
%��
.�%
��.�%
��.�
%��
.�%
��.�
%��
.�%
Den
ialr
ate
...fo
raco
nven
tiona
lloa
n��
.�%
��.�
%��
.�%
��%
��.�
%��
.�%
��.�
%��
%...
fora
nFH
Alo
an��
.�%
��.�
%��
.�%
��.�
%��
.�%
��.�
%��
.�%
��.�
%...
fora
nVA
loan
��.�
%��
.�%
��.�
%��
.�%
��.�
%��
.�%
��.�
%��
.�%
Notes:D
ata
onm
ortg
age
appl
icat
ions
isdr
awn
from
����
HM
DA
reco
rds.
Succ
essf
ulap
plic
atio
nsfo
rth
ista
ble
are
cons
ider
edth
ose
that
resu
lted
inth
elo
anbe
ing
orig
inat
ed.S
eeth
eD
ata
sect
ion
inth
eAp
pend
ixfo
radi
scus
sion
ofH
MD
Are
cord
san
d�l
ters
used
.
�� Appendix

Table �: Median Income by Category
All White Black Asian HispanicMedian Income ($����) �� �� �� �� ��... of all mortgage applicants �� �� �� �� ��... of successful applicants �� �� �� ��� ��... of denied applicants �� �� �� �� ��... of conventional loan applicants �� �� �� ��� ��... of FHA loan applicants �� �� �� �� ��... of VA loan applicants �� �� �� �� ��... of purchase applicants �� �� �� �� ��...... for a conventional loan �� �� �� �� ��...... for a FHA loan �� �� �� �� ��...... for a VA loan �� �� �� �� ��... of successful purchase applicants �� �� �� �� ��...... for a conventional loan �� �� �� �� ��...... for a FHA loan �� �� �� �� ��...... for a VA loan �� �� �� �� ��... of denied purchase applicants �� �� �� �� ��...... for a conventional loan �� �� �� �� ��...... for a FHA loan �� �� �� �� ��...... for a VA loan �� �� �� �� ��... of re�nance applicants �� �� �� ��� ��...... for a conventional loan �� �� �� ��� ��...... for a FHA loan �� �� �� �� ��...... for a VA loan �� �� �� �� ��... of successful re�nance applicants �� �� �� ��� ��...... for a conventional loan �� �� �� ��� ��...... for a FHA loan �� �� �� �� ��...... for a VA loan �� �� �� �� ��... of denied re�nance applicants �� �� �� �� ��...... for a conventional loan �� �� �� �� ��...... for a FHA loan �� �� �� �� ��...... for a VA loan �� �� �� �� ��Notes: The median income in the �rst row, the national median, is pulled from the ���� ACS �-year survey at the ZIP codelevel. The ZIP code median incomes are accumulated to form a national median via averages weighted by the populationcounts of the given groups. Data on mortgage applications is drawn from ���� HMDA records. Applicants are assignedto home value tiers via their ZIP code. Home value tier cuto�s were set by dividing all estimated home values within ametro area into three ordered groups. ZIP codes were then assigned to tiers according to the relative position of theZIP code median to the metro home value tier cuto�s. Successful applications for this table are considered those thatresulted in the loan being originated. See the Data section in the Appendix for a discussion of HMDA records and �ltersused. The median income of applicants assumes a one-to-one application-to-applicant ratio.
A House Divided ��

Table �: Loan-value-to-annual-income ratio by sub-population
Debt
AnnualIncome
All White Black Asian Hispanic... of all applicants �.�� �.�� �.�� �.�� �.��... of successful applicants �.�� �.�� �.�� �.�� �.��... of denied applicants �.�� �.�� �.�� �.�� �.��... of conventional loan applicants �.�� �.�� �.�� �.�� �.��... of FHA loan applicants �.�� �.�� �.�� �.�� �.��... of VA loan applicants �.�� �.�� �.�� �.�� �.��... of purchase applicants �.�� �.�� �.�� �.�� �.��...... for a conventional loan �.�� �.�� �.�� �.�� �.��...... for a FHA loan �.�� �.�� �.�� �.�� �.��...... for a VA loan �.�� �.�� �.�� �.�� �.��... of successful purchase applicants �.�� �.�� �.�� �.�� �.��...... for a conventional loan �.�� �.�� �.�� �.�� �.��...... for a FHA loan �.�� �.�� �.�� �.�� �.��...... for a VA loan �.�� �.�� �.�� �.�� �.��... of denied purchase applicants �.�� �.�� �.�� �.�� �.��...... for a conventional loan �.�� �.�� �.�� �.�� �.��...... for a FHA loan �.�� �.�� �.�� �.�� �.��...... for a VA loan �.�� �.�� �.�� �.�� �.��... of re�nance applicants �.�� �.�� �.�� �.�� �.��...... for a conventional loan �.�� �.�� �.�� �.�� �.��...... for a FHA loan �.�� �.�� �.�� �.�� �.��...... for a VA loan �.�� �.�� �.�� �.�� �.��... of successful re�nance applicants �.�� �.�� �.�� �.�� �.��...... for a conventional loan �.�� �.�� �.�� �.�� �.��...... for a FHA loan �.�� �.�� �.�� �.�� �.��...... for a VA loan �.�� �.�� �.�� �.�� �.��... of denied re�nance applicants �.�� �.�� �.�� �.�� �.��...... for a conventional loan �.�� �.�� �.�� �.�� �.��...... for a FHA loan �.�� �.�� �.�� �.�� �.��...... for a VA loan �.�� �.�� �.�� �.�� �.��Notes: Data on mortgage applications is drawn from ���� HMDA records. Applicants are assigned to home value tiersvia their ZIP code. Home value tier cuto�s were set by dividing all estimated home values within a metro area into threeordered groups. ZIP codes were then assigned to tiers according to the relative position of the ZIP code median to themetro home value tier cuto�s. Successful applications for this table are considered those that resulted in the loan beingoriginated. See the Data section in the Appendix for a discussion of HMDA records and �lters used. The median incomeof applicants assumes a one-to-one application-to-applicant ratio.
�� Appendix

Table �: Zillow Housing Metrics By Racial/Ethnic Group
The Fall: Peak home values to trough values
Peak to Trough All White Black Asian Hispanic... race weighted ��.�% -��.�% -��.�% -��.�% -��.�%... in zips where given race is the plurality -��.�% -��.�% -��.�% -��.�%... in zips where given race is the majority -��.�% -��.�% -��.�% -��.�%
The Recovery: Trough value to current (November ����)
Trough to Current All White Black Asian Hispanic... race weighted ��.�% ��.�% ��.�% ��.�% ��.�%... in zips where given race is the plurality ��.�% ��.�% ��.�% ��.�%... in zips where given race is the majority ��.�% ��.�% ��.�% ��.�%
Current State: Zillow Home Value Index ($k), Nov ����
Zillow Home Value Index (ZHVI; $�,���s) All White Black Asian Hispanic... race weighted ���.� ���.� ���.� ���.� ���.�... in zips where given race is the plurality ���.� ���.� ���.� ���.�... in zips where given race is the majority ���.� ���.� ���.� ���.�
Current State: Percent of current value down from peak
Current Fall from Peak All White Black Asian Hispanic... race weighted -��.�% -��.�% -��.�% -��.�% -��.�%... in zips where given race is the plurality -��.�% -��.�% -�.�% -��.�%... in zips where given race is the majority -��.�% -��.�% �.�% -��.�%
The Future: Zillow �-year forecast
One-year Forecast All White Black Asian Hispanic... race weighted �.�% �.�% �.�% ��.�% ��.�%... in zips where given race is the plurality �.�% �.�% ��.�% ��.�%Notes: See the Methodology subsection in Section � for a discussion of the use of the Zillow Home Value Index toestimate these metrics. Home value tier cuto�s were set by dividing all estimated home values within a metro area intothree ordered groups. ZIP codes were then assigned to tiers according to the relative position of the ZIP code medianto the metro home value tier cuto�s.
A House Divided ��