a holistic supply chain management solution
TRANSCRIPT

A Holistic Supply Chain
Management Solution
Don Walker
SVP Distribution Operations
McKesson
Bob Gooby
VP Process Redesign
McKesson
Kaan Katircioglu
Research Scientist
IBM Research
INFORMS Edelman Prize Presentation • April 8, 2013
1 Copyright © 2013 McKesson and IBM

2
OR helped us save over $1 Billion
The Opportunity
McKesson
The O.R. Innovation
IBM Research
$1 BILLION
The Business Impact
and growing…
2 Copyright © 2013 McKesson and IBM

McKesson: Oldest and Largest Healthcare
Service Provider
• America’s oldest and largest
healthcare services company
• Celebrating 180 years
• Ranked 14th on Fortune’s list
with $122.7 billion in revenues
• Headquartered in San Francisco
• More than 37,000 employees
• Two segments: Distribution Solutions
and Technology Solutions
• #1 pharmaceutical distributor in U.S.
and Canada
• #1 generics distributor
• #2 in specialty distribution and
services
• #1 in medical-surgical distribution to
alternate care sites
• 2,900+ Health Mart® retail pharmacy
franchisees
• Comprehensive retail information
systems and automation offerings
McKesson At-A-Glance Distribution Solutions
3 Copyright © 2013 McKesson and IBM

A Look Inside McKesson Distribution

Distribution is McKesson’s Core Business The right product to the right customer at the right time
5
Midnight
Shipping
26,000 Deliveries per Day
1/3 of all Rxs in U.S.
delivered by McKesson
Customer Ordering
29,000 orders
received per day
$32B In Web Orders
Receive product daily
from Manufacturers &
Redistribution Center
43,000 SKUs
Picking
1.2 million lines per night
across the network
2,200 SKUs 80% of Volume
Sunset
6pm
Sunrise
6am
12 midday
Receiving,
Putaway,
Replenishment
A Day in the Life:
Distribution Operations
5 Copyright © 2013 McKesson and IBM

McKesson’s Supply Chain
2,500 Vendors
43,000 Items
30 Distribution centers
250 Cross-docks
26,000 Customer locations
$8 Billion inventory
Cross-Dock
Vendors
Strategic Distribution Center
Customer locations
Regional Distribution Center
Local Distribution Center Local Distribution Center Local Distribution Center
Cross-Dock Cross-Dock Cross-Dock Cross-Dock Cross-Dock Cross-Dock
National Whole Sale
Warehouses
Others Independent Retailer
Large Customers
National Whole Sale
Stores
6 Copyright © 2013 McKesson and IBM

McKesson and IBM Research:
The ingredients of our innovation partnership
IBM Research had
– The IBM First of A Kind (FOAK) program
– Detailed supply chain sustainability modeling
– Innovative supply chain models and research
McKesson needed
– A holistic, cross-functional supply chain model for analysis
– The ability to view results through a financial lens
– To explore ideas we could not explore without integrated modeling
– To identify opportunities for improved service and savings
– A repeatable process for analysis
7 7 Copyright © 2013 McKesson and IBM

Opening Remarks
Mark Walchirk
President, U.S. Pharmaceutical
McKesson

The O.R. Innovation

A solution to optimize policies, connect all
metrics and answer questions fast!
How do we impact each others’ metrics?
Supply Chain CFO Office
How can
I increase
inventory turns?
Procurement
What are the
best contract
terms?
Corporate
Citizenship
How can we
reduce our cost-
to-serve?
How can I
reduce carbon
emissions?
10 Copyright © 2013 McKesson and IBM
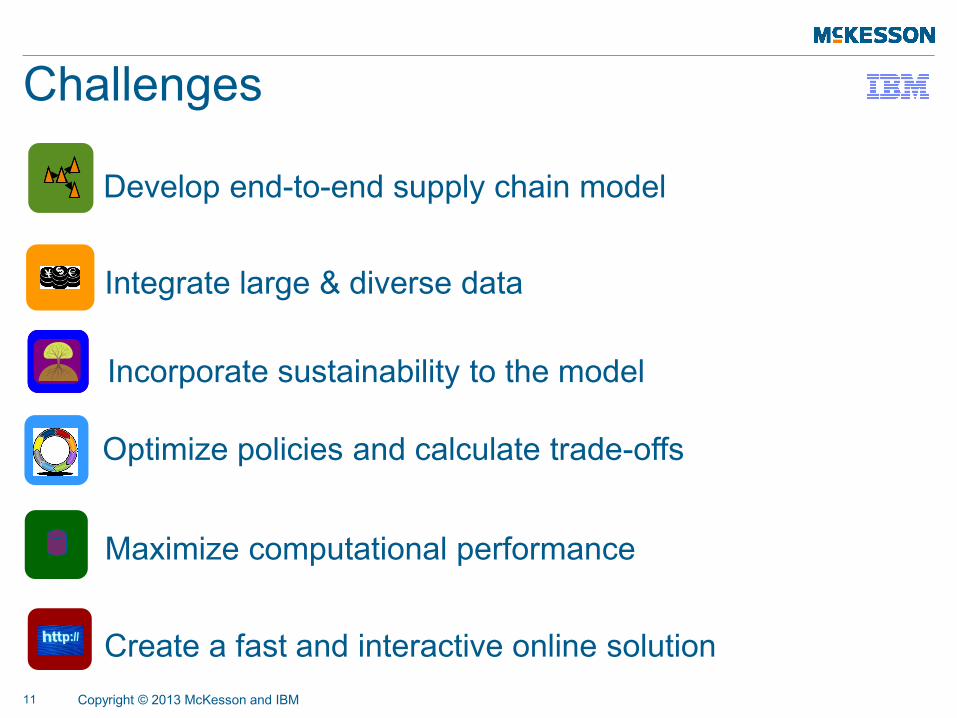
Challenges
Develop end-to-end supply chain model
Integrate large & diverse data
Incorporate sustainability to the model
Optimize policies and calculate trade-offs
Create a fast and interactive online solution
Maximize computational performance
11 Copyright © 2013 McKesson and IBM

Solution Management Layer
Data Model
Scenario Manager
Analytics Reports
Security Services
VRP Network Inventory Supply Flow Profit & Loss
We developed and integrated many components
to build the solution Sustainability
12 Copyright © 2013 McKesson and IBM
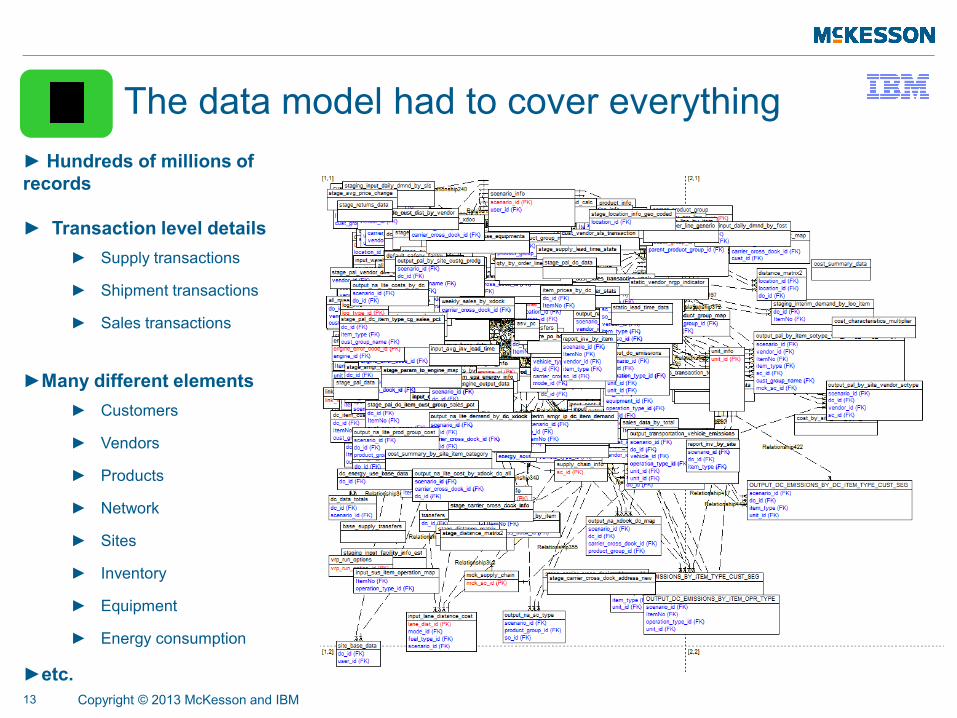
The data model had to cover everything
► Hundreds of millions of
records
► Transaction level details
► Supply transactions
► Shipment transactions
► Sales transactions
►Many different elements
► Customers
► Vendors
► Products
► Network
► Sites
► Inventory
► Equipment
► Energy consumption
►etc.
13 Copyright © 2013 McKesson and IBM

Supply Flow & Inventory Optimization
Network Assignment
optimization
Vehicle Routing
Problem
Integrated OR models for a problem too complex
to solve as a single optimization
Vendors
Strategic Distribution Center
Customers
Regional Distribution Center
Local Distribution Center Local Distribution Center Local Distribution Center
Cross-Dock Cross-Dock Cross-Dock Cross-Dock Cross-Dock Cross-Dock Cross-Dock
26,000+ Customer Locations
250+ Cross-Docks
2,500+ Vendors
43,000+ Items (SKUs)
30 Distribution centers
14 Copyright © 2013 McKesson and IBM
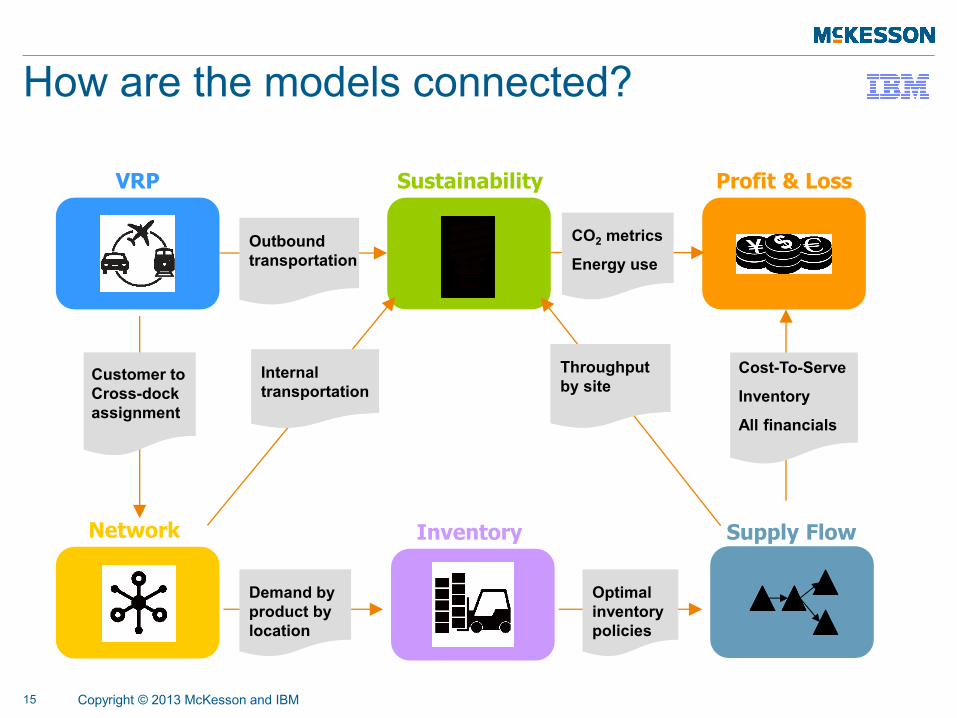
How are the models connected?
VRP Profit & Loss
Network
Sustainability
Cost-To-Serve
Inventory
All financials
CO2 metrics
Energy use
Inventory
Demand by
product by
location
Supply Flow
Optimal
inventory
policies
Customer to
Cross-dock
assignment
Customer to
Cross-dock
assignment
Outbound
transportation
Internal
transportation
Throughput
by site
Internal
transportation
Throughput
by site
15 Copyright © 2013 McKesson and IBM

Vehicle Routing
Problem
Vehicle Routing Problem
Customers
Cross-Dock Cross-Dock Cross-Dock Cross-Dock Cross-Dock Cross-Dock Cross-Dock
26,000+ Customer Locations
26,000 customer locations
Over half a billion distance
calculations
Delivery time windows
Need to compute in a few minutes
Challenges Challenges
Assign customers to cross-docks by
business rules
Optimize routes separately for each
cross-dock
Develop a regression model to
estimate VRP costs
Solution Approach
16 Copyright © 2013 McKesson and IBM
Copyright © 2013 McKesson and IBM
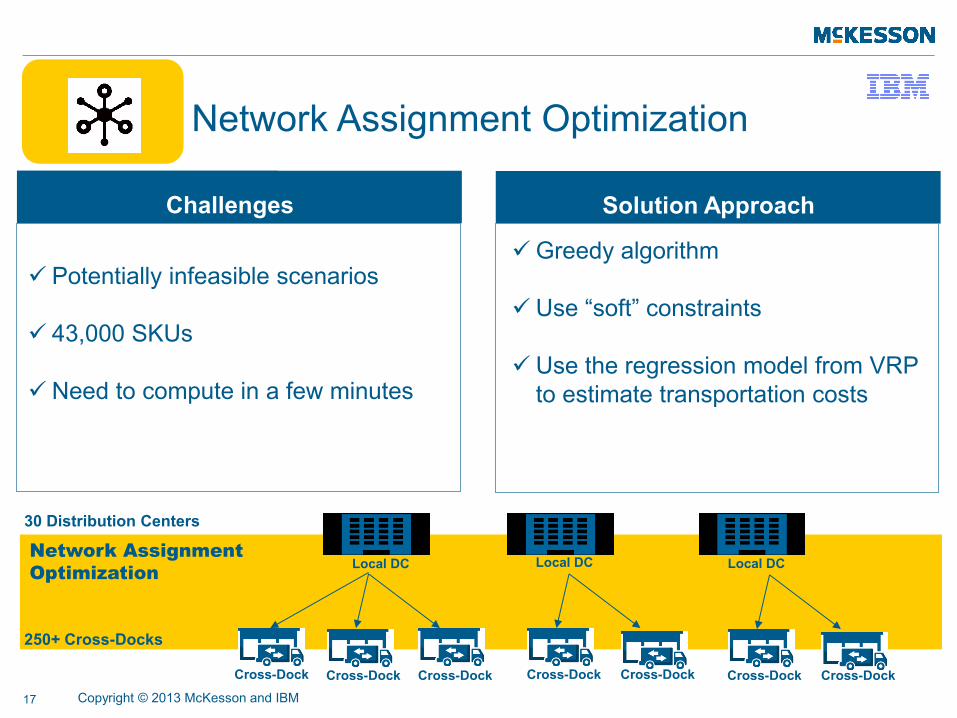
Network Assignment
Optimization
Network Assignment Optimization
Local DC Local DC Local DC
Cross-Dock Cross-Dock Cross-Dock Cross-Dock Cross-Dock Cross-Dock Cross-Dock
250+ Cross-Docks
30 Distribution Centers
Potentially infeasible scenarios
43,000 SKUs
Need to compute in a few minutes
Challenges Challenges
Greedy algorithm
Use “soft” constraints
Use the regression model from VRP
to estimate transportation costs
Solution Approach
17

Vendor Regional DC Local DC
Customer
Vendor
Vendor Regional DC
Supply Chain Type 1
Hub & Spoke Local DC
Local DC
Customer
Customer
Customer
Local DC
Customer
Local DC
Local DC
Customer
Customer
Customer
Customer
Customer
Customer
Customer
Supply Chain Type 2
Direct Ship
Supply Chain Type 3
Centralized Inventory
Air-ship
Inventory & Supply Flow
Optimization
43,000 SKUs
2-echelon
Lost sales
Service constraints
Stochastic demand & lead
times
Need to solve in a few minutes
Challenges
EOQ for lot-size
Use regression to estimate re-
order point at regional DC
Approximate optimal re-order
points at local DCs
Independent items (SKUs)
Solution Approach
18 Copyright © 2013 McKesson and IBM

Start at equipment level
Aggregate to operations and sites
Calibrate to match utility bills
Allocate to SKUs by their characteristics
Evaluate “what-if” scenarios
Equipment data
Energy characteristics
Throughput
Emission factors, etc.
Sustainability Model
Energy Cost
Emission
Factors
Equipment
Calibration
Emissions Energy
Consumption
Compute sustainability metrics
Evaluate sustainability actions
Quantify impacts of operational
changes
Objectives
Inputs
Energy Use/Cost/Efficiency
CO2 Emissions/Cost/Efficiency
By Site, By Operation, By SKU
Outputs
Methodology
19 Copyright © 2013 McKesson and IBM

43,000 P&Ls
Need all metrics at SKU level
Match the official P&L
Equipment data
Outputs of OR models
Transactions
Sales & supply terms
Income sources
Cost sources
Profit & Loss Model
Connect operational and
financial metrics
Compare scenarios
Objectives
Inputs
Revenue
Cost of operations, SG&A
Working capital
Cost of capital, PBT, etc.
Outputs
Challenges
Use SKU characteristics to allocate metrics to SKUs
Calibrate to match P&L
Methodology
20 Copyright © 2013 McKesson and IBM
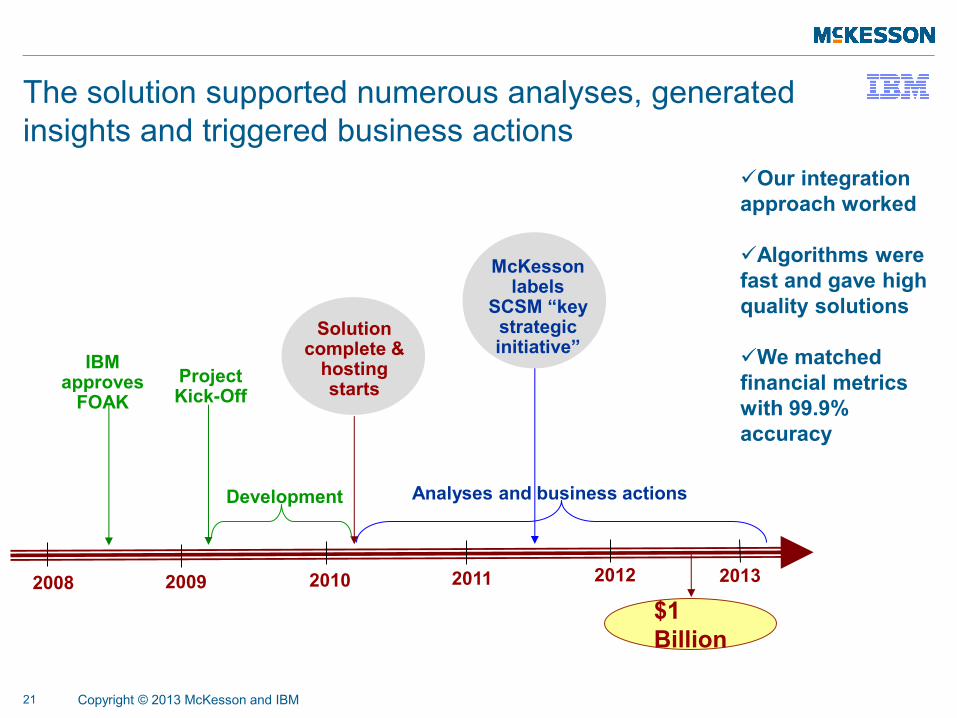
The solution supported numerous analyses, generated
insights and triggered business actions
2008 2011
Project Kick-Off
2010
Development
McKesson labels
SCSM “key strategic initiative”
2012 2009
IBM approves
FOAK
Analyses and business actions
2013
Our integration
approach worked
Algorithms were
fast and gave high
quality solutions
We matched
financial metrics
with 99.9%
accuracy
Solution complete &
hosting starts
$1
Billion
21 Copyright © 2013 McKesson and IBM

Insider Perspectives
Implementation & Business Impact

Challenges and Acceptance
Data Collection
– Too much data - Right balance between detail and summary
– Relate un-related data
– Original financial data
Model Credibility
– Baseline reports needed to match P&L at the detail level
Managerial Considerations
24 Copyright © 2013 McKesson and IBM

The model recommended shifting 35% of items to
a different supply chain
15,104
705 1,030
Centralized
Inventory
& Air-ship
436
Hub
&
Spoke
Direct
Ship
25 Copyright © 2013 McKesson and IBM

The model showed opportunity for air-freight, cut
inventory by half and improved service to 99%
0.0
10.0
20.0
30.0
40.0
50.0
60.0
70.0
1/29 2/12 2/26 3/12 3/26 4/9 4/23 5/7 5/21 6/4 6/18 7/2 7/16 7/30 8/13 8/27 9/10 9/24 10/8
Week
Air Freight Inventory DSI The SCSM solution:
Provided the total
financial impact
of air-freight
Recommended products
for air-shipment
26 Copyright © 2013 McKesson and IBM
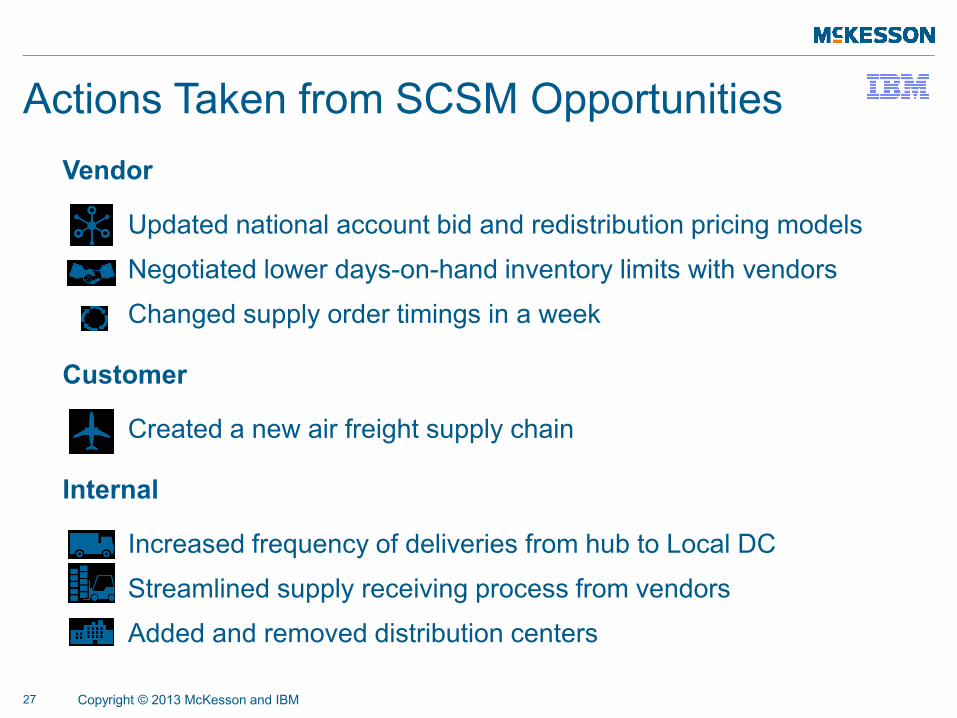
Vendor
Updated national account bid and redistribution pricing models Negotiated lower days-on-hand inventory limits with vendors Changed supply order timings in a week
Customer
Created a new air freight supply chain
Internal
Increased frequency of deliveries from hub to Local DC Streamlined supply receiving process from vendors Added and removed distribution centers
Actions Taken from SCSM Opportunities
27 Copyright © 2013 McKesson and IBM

SCSM identified new in-transit working capital by
individual vendor
ACTIONS
created vendor in-transit
database
provided detailed reports
to key vendors
28 Copyright © 2013 McKesson and IBM

By Eliminating Variation in Delivery Times
In-Transit Project: Took over specific vendor
shipping
0.00
0.50
1.00
1.50
2.00
2.50
3.00
Jul Aug Sep Oct Nov Dec
-1 0 1 2 3 4 5 6 7 8
$500
$450
$400
$350
$300
$250
$200
$150
$100
$50
$0
Reduced Average In-Transit Days
(mill
ions)
Q2 Q3
29 Copyright © 2013 McKesson and IBM

Overall Financial Impact
Branded Rx Capital Reduction
($million)
Total 1,091
Vendor Transit 318
Internal Transit 50
Inventory Savings 723
30 Copyright © 2013 McKesson and IBM
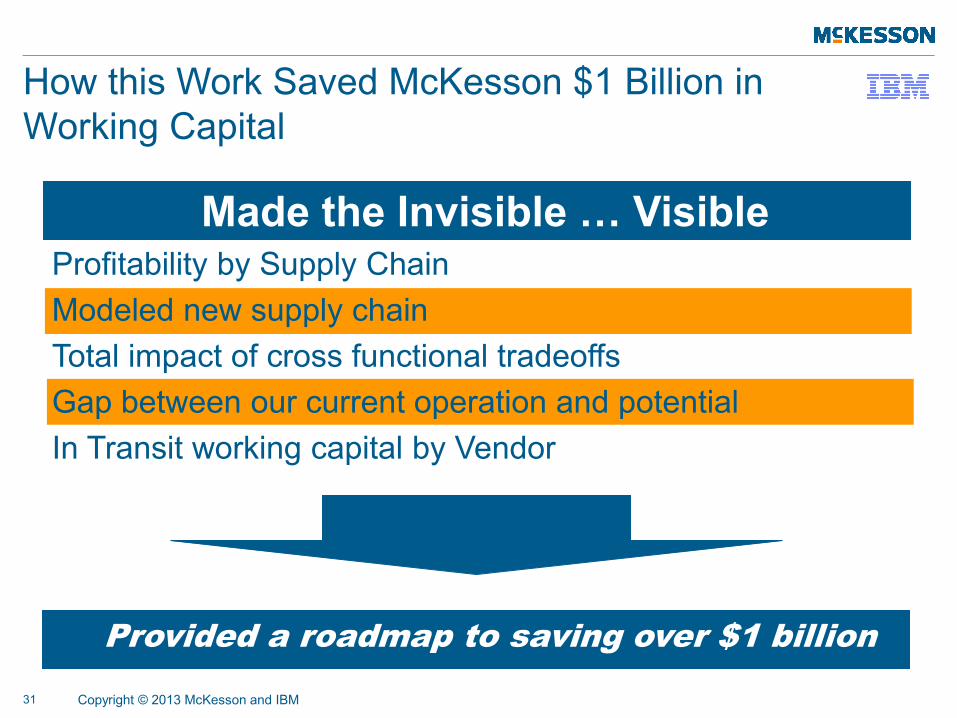
How this Work Saved McKesson $1 Billion in
Working Capital
Made the Invisible … Visible Profitability by Supply Chain
Modeled new supply chain
Total impact of cross functional tradeoffs
Gap between our current operation and potential
In Transit working capital by Vendor
Provided a roadmap to saving over $1 billion
31 Copyright © 2013 McKesson and IBM

Closing Remarks
Mark Walchirk
President, U.S. Pharmaceutical
McKesson

The Team
McKesson
Bob Gooby
Graeme Case
Matt Johnson
Nathan Mott
David Wagnon
Don Walker
IBM Kaan Katircioglu Pawan Chowdhary Youssef Drissi Mary Helander Jim Kalina Lin Li Karthik Sourirajan Howard Smith Karthik Subbian Takashi Yonezawa


Q & A