a highly sensitive printed humidity sensor based on a
TRANSCRIPT

NanoscaleAdvances
PAPER
Ope
n A
cces
s A
rtic
le. P
ublis
hed
on 1
5 A
pril
2019
. Dow
nloa
ded
on 1
0/5/
2021
4:3
5:53
AM
. T
his
artic
le is
lice
nsed
und
er a
Cre
ativ
e C
omm
ons
Attr
ibut
ion
3.0
Unp
orte
d L
icen
ce.
View Article OnlineView Journal | View Issue
A highly sensitive
aDepartment of Electrical and Computer En
4601 Campus Drive, Kalamazoo, Michigan
[email protected]; Tel: +1 269 276 3148bDepartment of Chemistry, Western Michi
Avenue, Kalamazoo, Michigan-49008, USA
† Electronic supplementary informationrelated to the functionalization of MWCN
Cite this: Nanoscale Adv., 2019, 1, 2311
Received 22nd March 2019Accepted 12th April 2019
DOI: 10.1039/c9na00179d
rsc.li/nanoscale-advances
This journal is © The Royal Society of C
printed humidity sensor based ona functionalized MWCNT/HEC composite forflexible electronics application†
Vikram S. Turkani, *a Dinesh Maddipatla, a Binu B. Narakathu,a Tahseen S. Saeed,b
Sherine O. Obare,b Bradley J. Bazuina and Massood Z. Atashbara
A novel functionalized multi-walled carbon nanotube (FMWCNT)/hydroxyethyl cellulose (HEC) composite-
based humidity sensor was successfully developed for humidity monitoring applications. FMWCNTs were
synthesized by covalently functionalizing multi-walled carbon nanotubes (MWCNTs) in a mixture of
sulfuric and nitric acid to enhance their hydrophilicity. The FMWCNTs were characterized using
transmission electron microscopy, Raman spectroscopy, Fourier transform infrared spectroscopy and
dispersion analysis to verify the presence of functional hydroxyl and carboxyl groups. A FMWCNT/HEC
(1 : 6 w/w) composite ink was formulated using the solution blending technique with 2.5 wt% FMWCNTs.
A multi-layered humidity sensor was fabricated using additive print manufacturing processes on a flexible
polyethylene terephthalate (PET) substrate. Screen printing and gravure printing processes were used to
deposit the bottom silver (Ag) electrode and FWMCNT/HEC sensing layers, respectively. The capability of
the fabricated humidity sensor was investigated by measuring its resistive response towards relative
humidity (RH) varying from 20% RH to 80% RH. As the RH was increased from 20% RH to 80% RH in
steps of 10% RH at 25 �C, it was observed that the resistance of the printed sensor increased linearly.
The printed sensor demonstrated resistance changes as high as z290% at 80% RH, when compared to
its base resistance at 20% RH. A sensitivity and a response time of 0.048/%RH and z20 s were obtained
for the printed sensor, respectively. The results thus demonstrated the feasibility of employing additive
print manufacturing processes to develop a highly sensitive sensor for humidity monitoring applications.
1. Introduction
Over the years, the need for monitoring humidity in the auto-mobile, medical and food industries has become a growingrequirement.1–4 Further, the maintenance of ambient condi-tions within human habitats for optimum comfort has oenbeen inuenced by humidity, thus making it one of the vitalparameters that needs to be monitored.5 Owing to this impor-tance, humidity measurement has been extensively studiedand, accordingly many researchers have developed varioustypes of humidity sensors based on different sensing principlesand diverse hygroscopic materials.6,7 Humidity is measured asabsolute humidity (AH) and relative humidity (RH) whichprovide the true value and relative value (in terms of pressure) ofwater vapor content in a given volume of air, respectively.6 RH
gineering, Western Michigan University,
-49008, USA. E-mail: vikramshreeshail.
gan University, 1903 Western Michigan
(ESI) available: Experimental detailsTs. See DOI: 10.1039/c9na00179d
hemistry 2019
based sensors are more commonly used for monitoringhumidity due to their ease-of-use and cost-efficiency.6 They havebeen extensively used in applications involving indoor airquality, human comfort issues and research laboratories.6
Therefore, the development of humidity sensing systems thatemploy novel RH sensors is of utmost importance.
Resistive type RH humidity sensors are the most commonlyimplemented type in the industry, as they are much easier tointegrate and use relatively simpler electronics to monitor andcontrol ambient humidity.8 Most of the resistive type humiditysensors are fabricated by coating hygroscopic polymersincluding polyimide,8–10 co-polymerized PMMA/PMAPTAC12 andpolyelectrolyte13 as the humidity sensitive lms.12 However,these devices are typically slow and suffer from a relativelylonger response time (105 s).14 Moreover, these sensors havelower humidity detection limits (30–42% RH), making themimpractical for use in many industrial and domestic applica-tions.8,15 Therefore, research has been focused on the develop-ment of novel materials for resistive type humidity sensors toovercome the drawbacks associated with polymeric basedresistive type humidity sensors. Owing to their large surfacearea to volume ratio and hollow cylindrical nanostructure,16
multiwalled carbon nanotubes (MWCNTs) have been
Nanoscale Adv., 2019, 1, 2311–2322 | 2311

Nanoscale Advances Paper
Ope
n A
cces
s A
rtic
le. P
ublis
hed
on 1
5 A
pril
2019
. Dow
nloa
ded
on 1
0/5/
2021
4:3
5:53
AM
. T
his
artic
le is
lice
nsed
und
er a
Cre
ativ
e C
omm
ons
Attr
ibut
ion
3.0
Unp
orte
d L
icen
ce.
View Article Online
extensively employed for sensing various molecules adsorbedon their surface.17,18 Research has been reported on MWCNTbased resistive type humidity sensors. Liu et al. reporteda resistive type humidity sensor based on pristine MWCNTnetworks and demonstrated its capability to sense a broadrange of relative humidities (25% RH to 85% RH) with goodlinearity and an excellent response time of 3 s.19 However, thisdevice suffered from a low sensitivity of 0.5%/%RH towardshumidity sensing.19 To improve the sensitivity of the MWCNTbased humidity sensor, Cao et al.20 chemically treated thesurface of MWCNTs and compared the humidity sensingcharacteristics of both chemically treated and untreatedMWCNTs. It was observed that the former had greater sensi-tivity than the latter due to the presence of hydrophilic func-tional groups on the surface of the chemically treatedMWCNTs.20 Thus, MWCNTs are promising as humidity sensi-tive materials. However, more efforts are needed towards thedevelopment of novel MWCNT based, highly sensitive, resistivetype humidity sensors.
Conventionally, humidity sensors have beenmanufactured onrigid structures like glass or ceramics using techniques such asphotolithography and sputtering.21,22 These techniques are rela-tively expensive and time consuming as they require highvacuum, large power density, and a high temperature environ-ment. Moreover, the rigid nature of the substrates prevents theiruse in applications which require mechanical exibility andconformal form factors. To overcome these limitations, additiveprint manufacturing processes such as screen, inkjet, gravureand exography can be used for the development of cost efficient,exible and conformal humidity sensors. These additive printmanufacturing processes have already enabled an emerging eldcalled exible hybrid electronics to develop novel, cost-efficientelectronic devices for applications that demand exibility andconformability. Accordingly, many researchers have activelyemployed these processes for the development of RFID tags,23,24
sensors,25–34 solar cells,35,36 antennas37 and circuits.38,39 In a recentstudy, a CNT based humidity sensor fabricated using twoprinting processes, screen and gravure printing, was reported.40
In addition, Xie et al. also reported an inkjet printed MWCNTbased humidity sensor.41 Although the printed sensors in boththe cases responded towards ambient humidity, there is stilla need to improve their sensitivity. Therefore, the use of additiveprint manufacturing processes to develop highly sensitivehumidity sensors employingMWCNTs and/orMWCNTs/polymercomposites is envisioned to advance the eld of humiditysensing.
In this work, a multi-layered functionalized multi-walledcarbon nanotube (FMWCNT)/hydroxyethyl cellulose (HEC)composite-based humidity sensor was developed using additiveprint manufacturing processes on a exible polyethylene tere-phthalate (PET) substrate. MWCNTs were subjected to acidfunctionalization in a mixture of sulfuric and nitric acid.Transmission electron microscopy, Raman spectroscopy andFourier transform infrared spectroscopy were performed toverify the functionalization of MWCNTs. Screen printing,a push through process was employed to deposit the electrodesin an interdigitated structure. The FMWCNT/HEC composite
2312 | Nanoscale Adv., 2019, 1, 2311–2322
ink was formulated and deposited on the electrodes as thehumidity sensing layer using gravure printing. The perfor-mance of the printed humidity sensor was investigated bymeasuring its resistive response towards relative humidity (RH)varying from 20% RH to 80% RH at a constant temperature of25 �C.
2. Experimental2.1 Chemicals and materials
A exible PET lm (MELINEX® ST730) from DuPont TeijinFilms was used as the substrate. Conductive Ag ink (AG-800)from Applied Ink Solutions was used for the electrodes. Theconductive ller for the sensing layer was MWCNTs, withdiameters and lengths of 20–30 nm and 10–30 nm, respectively(US Research Nanomaterials, Inc., US4039, purity > 95 wt%).Analytical grade 95% sulfuric acid (H2SO4) and 70% nitric acid(HNO3) from Sigma-Aldrich Chemical Company were used forthe functionalization of the MWCNTs via acid treatment.Hygroscopic HEC (Cellosize™ Hydroxyethyl Cellulose EP-09,DOW chemical company) and polyvinylpolypyrrolidone (PVPP)polymer (ViViPrint™ 540, Ashland Performance Materials) wereused as the polymer matrix and binder in the FMWCNT/HECink, respectively. Acetone, from Sigma-Aldrich ChemicalCompany, and de-ionized (DI) water were used as the cleaningsolvents for the Ag and FMWCNT/HEC inks, respectively. Theelectrical connections for the printed sensor were made usingcontact at ex interconnects (Model no. 1-88997-2) from TEConnectivity AMP Connectors. The headers of these intercon-nects were connected usingmale to female jumper wires (Modelno. 1568-1511-ND) from SparkFun Electronics.
2.2 Functionalization of MWCNTs
The MWCNTs were subjected to a covalent functionalizationprocess which involves surface modication of the MWCNTs byincorporating hydrophilic substituents onto the exteriorMWCNT sidewalls42 (Fig. S1†). The aim of the functionalizationprocess was to improve the hydrophilicity of MWCNTs besidesaiding their dispersion in aqueous medium.43,44 2 g of MWCNTswere added to a 3 : 1 (v/v) mixture of H2SO4 and HNO3,respectively and the mixture was reuxed at 140 �C usingcontinuous magnetic stirring for 1 hour.11 The mixture wasallowed to cool down to room temperature aer the reux.Then, the obtained mixture was titrated against NH3OH untila pH of 5.5 was attained.44 The neutralized solution was thenvacuum ltered to separate the FMWCNTs using 0.2 mm poresize polytetrauoroethylene membrane lters. Finally, theFMWCNTs were washed with DI water several times and driedfor 12 hours at 140 �C.
2.3 Characterization of the FMWCNTs
Transmission electron microscopy (TEM) and Raman spec-troscopy were used to obtain morphological information andto determine the degree of functionalization, respectively, ofthe MWCNTs before and aer acid treatment. A JEOL 100 CXIITEM with an accelerated voltage of 200 kV was used to record
This journal is © The Royal Society of Chemistry 2019
Paper Nanoscale Advances
Ope
n A
cces
s A
rtic
le. P
ublis
hed
on 1
5 A
pril
2019
. Dow
nloa
ded
on 1
0/5/
2021
4:3
5:53
AM
. T
his
artic
le is
lice
nsed
und
er a
Cre
ativ
e C
omm
ons
Attr
ibut
ion
3.0
Unp
orte
d L
icen
ce.
View Article Online
the TEM micrographs and analyze the morphology ofMWCNTs. Two samples were prepared by dispersing theMWCNTs in ethanol and the FMWCNTs in DI water. Theprepared samples were dropped on a carbon coated 200-meshcopper grid for imaging.
The experimental setup for Raman spectroscopy is shownin Fig. S2.† The MWCNT and FMWCNT samples were placedin a sample holder (PA-SH02, Inphotonics Inc). A laser sourcein the near infrared region with a wavelength of 785 nm wasused to excite the samples using a Raman probe fromInphotonics Inc. with an integration time of 3 seconds at 300mW. Raman analysis was performed for both the MWCNTsand the FMWCNTs, and a comparison was made to obtain thedegree of functionalization of the MWCNTs aer acid treat-ment.44 A spectrometer (QE 6500) from Ocean Optics Inc. wasused to obtain the Raman spectra. The Raman spectra werethen analyzed using Spectra Suite Soware from Ocean OpticsInc.
Fourier transform infrared spectroscopy (FT-IR) was per-formed to verify the presence of hydrophilic constituents onthe surface of the FMWCNTs. Two samples, one with MWCNTsand another with the FMWCNTs, were prepared by mechan-ically mixing them with potassium bromide powder. Themixtures were pressed into discs and were placed in a Ther-moFisher Nicolet iS5 spectrometer. The FT-IR spectra wereanalyzed using OriginPro soware.
The dispersion analysis was performed on both MWCNTsand FMWCNTs to compare their suspension stability in DIwater, thereby demonstrating the efficiency of functionaliza-tion.44 0.125 g (0.5 wt%) of MWCNTs and FMWCNTs weredispersed in 25 mL of DI water. The solutions were stirredvigorously for 60 minutes and held for 5 days, which isa sufficient duration required to formulate the ink and fabri-cate the sensor.
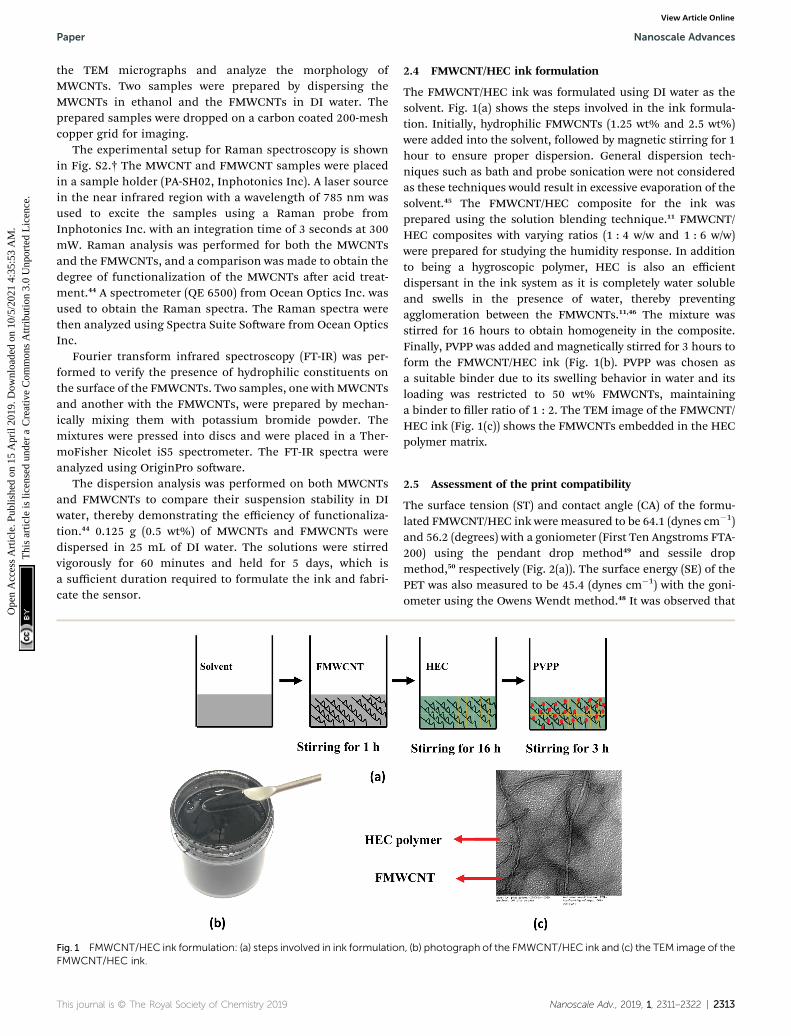
Fig. 1 FMWCNT/HEC ink formulation: (a) steps involved in ink formulationFMWCNT/HEC ink.
This journal is © The Royal Society of Chemistry 2019
2.4 FMWCNT/HEC ink formulation
The FMWCNT/HEC ink was formulated using DI water as thesolvent. Fig. 1(a) shows the steps involved in the ink formula-tion. Initially, hydrophilic FMWCNTs (1.25 wt% and 2.5 wt%)were added into the solvent, followed by magnetic stirring for 1hour to ensure proper dispersion. General dispersion tech-niques such as bath and probe sonication were not consideredas these techniques would result in excessive evaporation of thesolvent.45 The FMWCNT/HEC composite for the ink wasprepared using the solution blending technique.11 FMWCNT/HEC composites with varying ratios (1 : 4 w/w and 1 : 6 w/w)were prepared for studying the humidity response. In additionto being a hygroscopic polymer, HEC is also an efficientdispersant in the ink system as it is completely water solubleand swells in the presence of water, thereby preventingagglomeration between the FMWCNTs.11,46 The mixture wasstirred for 16 hours to obtain homogeneity in the composite.Finally, PVPP was added and magnetically stirred for 3 hours toform the FMWCNT/HEC ink (Fig. 1(b). PVPP was chosen asa suitable binder due to its swelling behavior in water and itsloading was restricted to 50 wt% FMWCNTs, maintaininga binder to ller ratio of 1 : 2. The TEM image of the FMWCNT/HEC ink (Fig. 1(c)) shows the FMWCNTs embedded in the HECpolymer matrix.
2.5 Assessment of the print compatibility
The surface tension (ST) and contact angle (CA) of the formu-lated FMWCNT/HEC ink weremeasured to be 64.1 (dynes cm�1)and 56.2 (degrees) with a goniometer (First Ten Angstroms FTA-200) using the pendant drop method49 and sessile dropmethod,50 respectively (Fig. 2(a)). The surface energy (SE) of thePET was also measured to be 45.4 (dynes cm�1) with the goni-ometer using the Owens Wendt method.48 It was observed that
, (b) photograph of the FMWCNT/HEC ink and (c) the TEM image of the
Nanoscale Adv., 2019, 1, 2311–2322 | 2313

Fig. 2 Surface tension of the FMWCNT/HEC ink (a) before and (b) after adding the surfactant.
Nanoscale Advances Paper
Ope
n A
cces
s A
rtic
le. P
ublis
hed
on 1
5 A
pril
2019
. Dow
nloa
ded
on 1
0/5/
2021
4:3
5:53
AM
. T
his
artic
le is
lice
nsed
und
er a
Cre
ativ
e C
omm
ons
Attr
ibut
ion
3.0
Unp
orte
d L
icen
ce.
View Article Online
the ST of the ink was 18.7 units greater than the SE of thesubstrate. However, a good print compatibility between theprinted layer and the substrate is obtained when the SE of thesubstrate is greater than the ST of the ink.47 This is because theSE of the substrate, which is the energy due to the intermolec-ular forces, should be able to break the resistance of the ink andto deform it into a new surface.47 The resistance offered by theink, due to attractive intermolecular forces formed on itsinterfacial surface, is the ST of the ink.47 Therefore, 1 wt%Ecosurf™ (Dow Chemical Company) surfactant was added tothe prepared FMWCNT/HEC ink and was magnetically stirredfor 3 hours for reducing its ST. It was observed that the STdecreased to 23.8 (dynes cm�1), which is 21.6 units less than theSE of the substrate (Fig. 2(b)). Thus, it was concluded that theFMWCNT/HEC ink was print compatible with the PETsubstrate.
2.6 Humidity sensor fabrication
Fig. 3 shows the schematic of the humidity sensor. It consistsof three layers: substrate, electrodes and a sensing layer. Thesensor was designed with an overall dimension of 22 mm �
Fig. 3 Schematic of the humidity sensor (not to scale).
2314 | Nanoscale Adv., 2019, 1, 2311–2322
12 mm in Adobe Illustrator® design soware. The sensorconsists of a pair of electrodes, with 24 interdigitated (IDT)ngers that are 5200 mm long and 200 mm wide, with a pitch of400 mm. The sensing layer was designed to be 14 mm � 12mm.
The fabrication of the MWCNT/HEC based humiditysensor was performed on the exible PET substrate usingscreen and gravure printing processes. Fig. 4 shows thefabrication steps of the humidity sensor. Initially, the surfaceof the PET substrate was cleaned with isopropyl alcohol (IPA)and was heated at a temperature of 80 �C for 2 hours ona VWR® Signature 810 hot plate to remove any organicimpurities present on the surface of the substrate. Then,a semi-automatic screen printer (AMI MSP 485) was used todeposit Ag ink on the PET. A stainless steel screen, fabricatedat Microscreen®, with 325 mesh count, wire diameter 28 mm,mesh angle 22.5� and 12.7 mm thick MS-22 emulsion wasused for screen printing. The printed Ag ink was thermallycured in a VWR 1320 temperature controlled oven at 135 �Cfor 5 minutes to form the Ag based IDTs. Finally, a laboratoryscale gravure press (K-Printing Proofer) was used to depositthe FMWCNT/HEC ink on the IDTs as a humidity sensitivelayer. An electromechanically engraved gravure plate, fromIR Engraving LLC, with a 200-line screen (LS) and 45� cellangle was used for gravure printing. The printed FMWCNT/HEC ink was thermally cured at 110 �C for 3 minutes. Aphotograph of the fabricated humidity sensor is shown inFig. 5.
2.7 Surface characterization of the printed layers
A Bruker Contour GT-K vertical scanning interferometer wasused to characterize the thickness and roughness of the printedlayers (Fig. 6). An average thickness (DZ) of 1.49 � 0.05 mm and0.94 � 0.03 mm and an average surface roughness (Sa) of 0.52 �0.04 mm and 0.28 � 0.05 mmwere obtained for the Ag electrodesand FMWCNT/HEC sensing layer, respectively.
This journal is © The Royal Society of Chemistry 2019
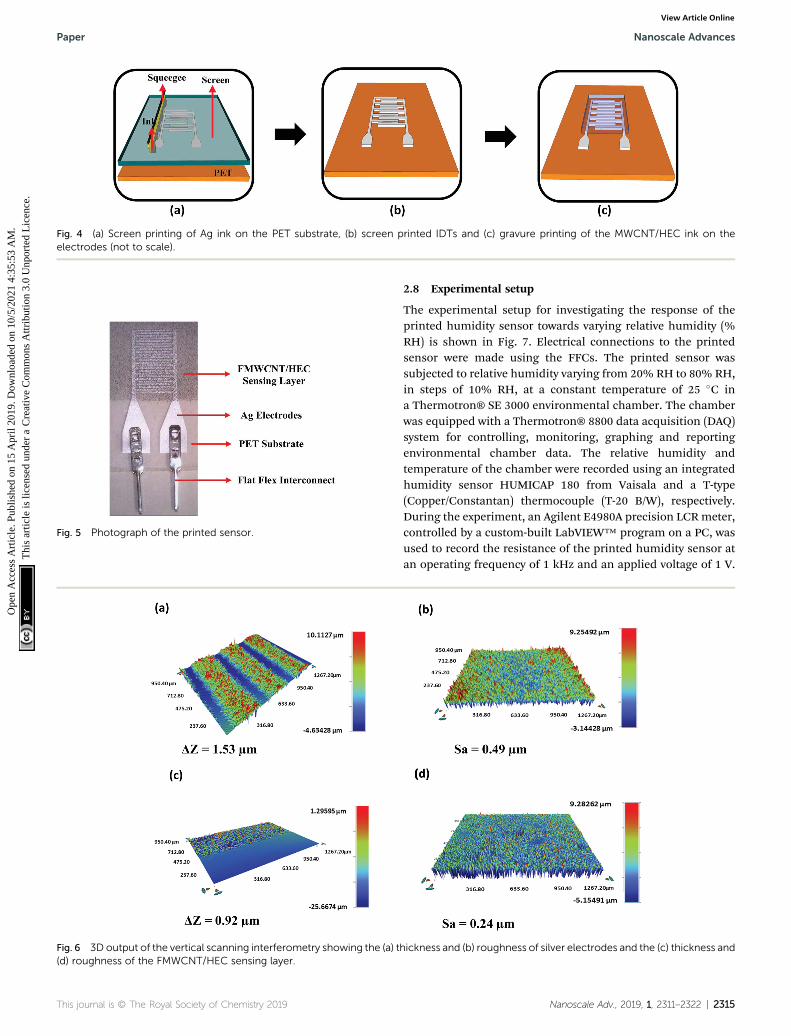
Fig. 4 (a) Screen printing of Ag ink on the PET substrate, (b) screen printed IDTs and (c) gravure printing of the MWCNT/HEC ink on theelectrodes (not to scale).
Fig. 5 Photograph of the printed sensor.
Fig. 6 3D output of the vertical scanning interferometry showing the (a) t(d) roughness of the FMWCNT/HEC sensing layer.
This journal is © The Royal Society of Chemistry 2019
Paper Nanoscale Advances
Ope
n A
cces
s A
rtic
le. P
ublis
hed
on 1
5 A
pril
2019
. Dow
nloa
ded
on 1
0/5/
2021
4:3
5:53
AM
. T
his
artic
le is
lice
nsed
und
er a
Cre
ativ
e C
omm
ons
Attr
ibut
ion
3.0
Unp
orte
d L
icen
ce.
View Article Online
2.8 Experimental setup
The experimental setup for investigating the response of theprinted humidity sensor towards varying relative humidity (%RH) is shown in Fig. 7. Electrical connections to the printedsensor were made using the FFCs. The printed sensor wassubjected to relative humidity varying from 20% RH to 80% RH,in steps of 10% RH, at a constant temperature of 25 �C ina Thermotron® SE 3000 environmental chamber. The chamberwas equipped with a Thermotron® 8800 data acquisition (DAQ)system for controlling, monitoring, graphing and reportingenvironmental chamber data. The relative humidity andtemperature of the chamber were recorded using an integratedhumidity sensor HUMICAP 180 from Vaisala and a T-type(Copper/Constantan) thermocouple (T-20 B/W), respectively.During the experiment, an Agilent E4980A precision LCRmeter,controlled by a custom-built LabVIEW™ program on a PC, wasused to record the resistance of the printed humidity sensor atan operating frequency of 1 kHz and an applied voltage of 1 V.
hickness and (b) roughness of silver electrodes and the (c) thickness and
Nanoscale Adv., 2019, 1, 2311–2322 | 2315
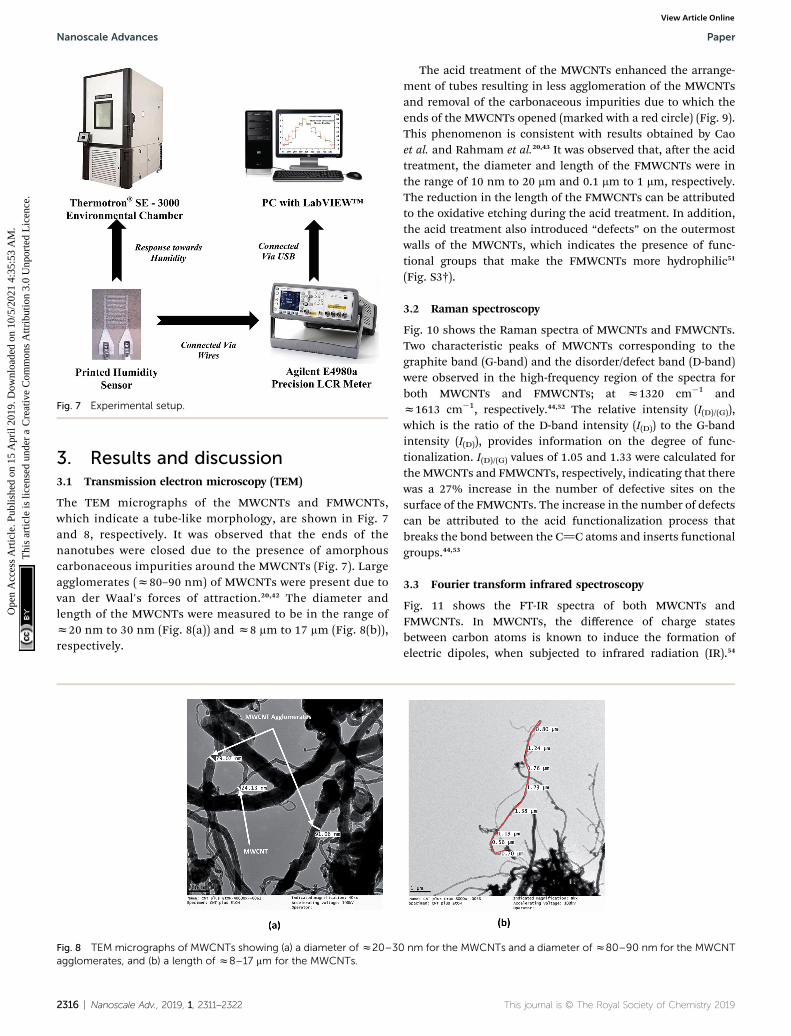
Fig. 7 Experimental setup.
Nanoscale Advances Paper
Ope
n A
cces
s A
rtic
le. P
ublis
hed
on 1
5 A
pril
2019
. Dow
nloa
ded
on 1
0/5/
2021
4:3
5:53
AM
. T
his
artic
le is
lice
nsed
und
er a
Cre
ativ
e C
omm
ons
Attr
ibut
ion
3.0
Unp
orte
d L
icen
ce.
View Article Online
3. Results and discussion3.1 Transmission electron microscopy (TEM)
The TEM micrographs of the MWCNTs and FMWCNTs,which indicate a tube-like morphology, are shown in Fig. 7and 8, respectively. It was observed that the ends of thenanotubes were closed due to the presence of amorphouscarbonaceous impurities around the MWCNTs (Fig. 7). Largeagglomerates (z80–90 nm) of MWCNTs were present due tovan der Waal's forces of attraction.20,42 The diameter andlength of the MWCNTs were measured to be in the range ofz20 nm to 30 nm (Fig. 8(a)) and z8 mm to 17 mm (Fig. 8(b)),respectively.
Fig. 8 TEM micrographs of MWCNTs showing (a) a diameter of z20–30agglomerates, and (b) a length of z8–17 mm for the MWCNTs.
2316 | Nanoscale Adv., 2019, 1, 2311–2322
The acid treatment of the MWCNTs enhanced the arrange-ment of tubes resulting in less agglomeration of the MWCNTsand removal of the carbonaceous impurities due to which theends of the MWCNTs opened (marked with a red circle) (Fig. 9).This phenomenon is consistent with results obtained by Caoet al. and Rahmam et al.20,43 It was observed that, aer the acidtreatment, the diameter and length of the FMWCNTs were inthe range of 10 nm to 20 mm and 0.1 mm to 1 mm, respectively.The reduction in the length of the FMWCNTs can be attributedto the oxidative etching during the acid treatment. In addition,the acid treatment also introduced “defects” on the outermostwalls of the MWCNTs, which indicates the presence of func-tional groups that make the FMWCNTs more hydrophilic51
(Fig. S3†).
3.2 Raman spectroscopy
Fig. 10 shows the Raman spectra of MWCNTs and FMWCNTs.Two characteristic peaks of MWCNTs corresponding to thegraphite band (G-band) and the disorder/defect band (D-band)were observed in the high-frequency region of the spectra forboth MWCNTs and FMWCNTs; at z1320 cm�1 andz1613 cm�1, respectively.44,52 The relative intensity (I(D)/(G)),which is the ratio of the D-band intensity (I(D)) to the G-bandintensity (I(D)), provides information on the degree of func-tionalization. I(D)/(G) values of 1.05 and 1.33 were calculated forthe MWCNTs and FMWCNTs, respectively, indicating that therewas a 27% increase in the number of defective sites on thesurface of the FMWCNTs. The increase in the number of defectscan be attributed to the acid functionalization process thatbreaks the bond between the C]C atoms and inserts functionalgroups.44,53
3.3 Fourier transform infrared spectroscopy
Fig. 11 shows the FT-IR spectra of both MWCNTs andFMWCNTs. In MWCNTs, the difference of charge statesbetween carbon atoms is known to induce the formation ofelectric dipoles, when subjected to infrared radiation (IR).54
nm for the MWCNTs and a diameter of z80–90 nm for the MWCNT
This journal is © The Royal Society of Chemistry 2019

Fig. 9 TEM micrographs of FMWCNTs showing (a) a diameter of 10–20 nm (marked in red circles) and (b) a length of 0.1–1 mm.
Fig. 10 Raman spectra of MWCNTs and FMWCNTs.
Paper Nanoscale Advances
Ope
n A
cces
s A
rtic
le. P
ublis
hed
on 1
5 A
pril
2019
. Dow
nloa
ded
on 1
0/5/
2021
4:3
5:53
AM
. T
his
artic
le is
lice
nsed
und
er a
Cre
ativ
e C
omm
ons
Attr
ibut
ion
3.0
Unp
orte
d L
icen
ce.
View Article Online
These dipoles can be detected as the IR spectra during the FT-IRanalysis.44,54 In MWCNTs, the symmetrical structure results ina relatively silent spectrum as weak infrared signals are detecteddue to the weak difference of charge states between thesymmetrical carbon atoms.44 However, in the FMWCNTs,multiple characteristic peaks were observed in the FT-IR spectraindicating the presence of functional groups that are
Fig. 11 FT-IR spectra of the MWCNTs and FMWCNTs.
This journal is © The Royal Society of Chemistry 2019
introduced due to the acid treatment. Broad peaks between3000 cm�1 and 3500 cm�1 were obtained indicating the char-acteristic stretching vibrations of hydroxyl (O–H) bonds.44
Further, the FT-IR spectrum of the FMWCNTs showed the peaksof carboxyl (C]O) and carbonyl (O–C]O) groups atz1650 cm�1 and z1450 cm�1, respectively.44,55,56 Thus, thesepeaks from the FT-IR indicated the presence of functionalgroups on the surface of FMWCNTs aer covalent acidfunctionalization.
3.4 Dispersion analysis
The results of the dispersion analysis for the MWCNTs andFMWCNTs are shown in Fig. S4.† Vigorously stirred solutions ofthe MWCNTs and FMWCNTs (0.5 wt%) in DI water were heldfor up to 5 days to investigate their suspension stability. Sedi-mentation of the MWCNTs was observed, within 60 seconds,which demonstrated poor suspension stability. This sedimen-tation occurred due to the agglomeration of the MWCNTs,caused by van der Waal's forces of attraction.44 On the otherhand, the FMWCNTs showed better suspension stability for upto 5 days, as no sedimentation was observed. This stability isdue to the presence of the equally charged functional hydroxyland carboxyl groups which enable the MWCNTs to repel eachother and, thus, keep the solution dispersed.44
3.5 Humidity sensor characterization
Before subjecting the humidity sensors to varying humiditylevels, the sensors were pre-heated on a VWR 810 ceramic hotplate at 90 �C for 1 hour to remove the water molecules trappedaround the FMWCNTs and in between the electrodes. Fig. 12shows the relative resistive response of printed humiditysensors fabricated using different ink compositions. Thecontent of the FMWCNTs was varied from 1.25 wt% to 2.5 wt%in the ink, with respect to the solvent and the weight ratiobetween FMWCNTs and HEC was varied from 1 : 4 to 1 : 6. Itwas observed that the printed humidity sensor fabricated with1.25 wt% FMWCNTs (FMWCNTs : HEC: 1 : 6) yieldeda maximum relative resistive response of 0.82, at 80% RH. Bymaintaining the content of the FMWCNTs at 1.25 wt% and
Nanoscale Adv., 2019, 1, 2311–2322 | 2317

Fig. 12 Response of the humidity sensor with different compositionsof the FMWCNT/HEC ink.
Fig. 13 (a) Dynamic and (b) static response of the printed humiditysensor.
Nanoscale Advances Paper
Ope
n A
cces
s A
rtic
le. P
ublis
hed
on 1
5 A
pril
2019
. Dow
nloa
ded
on 1
0/5/
2021
4:3
5:53
AM
. T
his
artic
le is
lice
nsed
und
er a
Cre
ativ
e C
omm
ons
Attr
ibut
ion
3.0
Unp
orte
d L
icen
ce.
View Article Online
decreasing the ratio between the FMWCNTs and HEC to 1 : 4,the maximum relative resistive response of the sensordecreased to 0.71, at 80% RH. This decrease in maximumrelative resistive response can be attributed to the lower HECcontent. Further, with increasing the content of the FMWCNTsto 2.5 wt% and maintaining the ratio of FMWCNTs and HEC at1 : 4, the maximum relative resistive response of the printedsensor increased to 1.37, at 80% RH. This is due to the avail-ability of more FMWCNTs for the adsorption of water moleculeson their surface. By elevating the ratio of the FMWCNTs andHEC to 1 : 6, the maximum relative resistive response of theprinted sensor increased to a relatively higher value of 2.91,indicating that the relative resistive response of the printedhumidity sensor can be tunable by varying the ink composition.The ink with 2.5 wt% FMWCNTs (FMWCNTs : HEC: 1 : 6),which had the highest maximum relative resistive response,was chosen for further evaluation in this study.
Fig. 13(a) shows the dynamic resistive response of the prin-ted sensor towards varying relative humidity. The humidity ofthe chamber was varied form 20% RH to 80% RH during thehumidication process and from 80%RH to 20%RH during thede-humidication process, in steps of 10% RH at a constanttemperature of 25 �C. Accordingly, the resistance of thehumidity sensor increased during the humidication processand recovered back during the de-humidication process, overtime. The humidity sensing mechanism of the FMWCNT/HECis based on the electron donation model of the MWCNTs andswelling behavior of the HEC. The MWCNT network exhibits p-type semiconducting characteristics, where the electricalconduction is dominated by holes.57 When exposed to humidityin the environment, the resistance changes in the MWCNTsdepend on their interaction with water molecules. These watermolecules are adsorbed onto the surface of the MWCNTsthrough physisorption, and tend to transfer electrons toMWCNTs due to the difference in electrical potential betweenthem.19,58 This charge transfer mechanism decreases thenumber of holes and consequently increases the electricalresistance of MWCNTs. The RH level of the environmentdirectly dictates the amount of water molecules to be adsorbed
2318 | Nanoscale Adv., 2019, 1, 2311–2322
on the MWCNTs. As the RH level increases, more water mole-cules are adsorbed, and more electrons will be transferred,leading to a further increase in the resistance value.11 In addi-tion, the hydroxyl and carboxyl groups present on the defectivesites of the FMWCNTs show increased affinity towards watermolecules (hydrophilicity). This improved hydrophilicity notonly enhances the interaction between FMWCNTs and watermolecules, but also aids in increasing the number of electronstransferred, contributing to a much higher resistance change.11
Further, the HEC consists of abundant hydroxyl groups andexhibits physical swelling upon exposure to humidity due to theadsorption of a large number of water molecules.59 Thisswelling property of HEC can effectively increase the contact gapof the FMWCNT intertube junction in the composite, therebycontributing to the increase in the resistance with humidica-tion.11 However, during de-humidication the number ofeffective charge carriers (holes) in the FMWCNTs increases asthe water molecules desorb from their surface.64 This increasein the number of effective charge carriers results in a decreasein the resistance values. In addition, HEC starts to physically
This journal is © The Royal Society of Chemistry 2019

Fig. 14 Reproducibility of the humidity sensor.
Paper Nanoscale Advances
Ope
n A
cces
s A
rtic
le. P
ublis
hed
on 1
5 A
pril
2019
. Dow
nloa
ded
on 1
0/5/
2021
4:3
5:53
AM
. T
his
artic
le is
lice
nsed
und
er a
Cre
ativ
e C
omm
ons
Attr
ibut
ion
3.0
Unp
orte
d L
icen
ce.
View Article Online
shrink as the water molecules desorb from its surface.65 Thisphenomenon decreases the contact gap of the FMWCNTintertube junction in the composite, hence resulting ina decrease in the resistance during dehumidication.
Fig. 13(b) shows the average static resistive response of theprinted humidity sensor. It was observed that during thehumidication process, the resistance of the sensors increasedfrom 1.6 kU to 6.3 kU, when the relative humidity in thechamber was varied from 20% RH to 80% RH. This resulted inan overall resistance change of z290% at 80% RH, whencompared to the base resistance at 20% RH. A sensitivity (S) of0.0485/%RH was mathematically calculated for the fabricatedhumidity sensor using eqn (1).
S ¼�
1
ðRTiÞ� �
RTi� RTf
��RHi �RHf
� (1)
where RTiand RTf
are the resistance values obtained at initialrelative humidity RHi and nal temperature RHf. The resultsobtained for the printed humidity sensor demonstrateda sensitivity which is an order of magnitude greater than thesensitivity of a MWCNT network-based humidity sensor(0.005/%RH) reported by Liu et al.19 In addition, the sensitivityof the printed FMWCNT/HEC based humidity sensor was betterthan those of several other MWCNT and MWCNT/polymer-based humidity sensors reported15,19,20,60–62 and a comparisonis shown in Table 1. It was observed that the printed humiditysensor exhibited a hysteresis effect at lowmoisture levels duringhumidication/de-humidication. This hysteresis can beattributed to the charge trapping by water molecules presentaround FMWCNTs, especially with their improved hydrophi-licity.66 The trapped charge contributes to a comparativelyhigher resistance, during de-humidication when compared tothe resistance, during humidication.
The reproducibility of the sensor performance was investi-gated by analyzing the resistive response of three differentsensors printed using the FMWCNT/HEC ink, formulatedseparately for each sensor (Fig. 14). It was observed that all threefabricated sensors demonstrated a similar response towardsrelative humidity varying from 20% RH to 80% RH, yielding anaverage maximum resistance change of 273% � 21% at 80%RH, when compared to base resistance at 20% RH. The ob-tained results prove the reproducibility of both the FMWCNT/HEC ink and the printed humidity sensor.
The response curve of the printed humidity sensor is shownin Fig. 15(a). It was observed that the resistive response of the
Table 1 Comparison of sensitivity between the printed FMWCNT/HEC h
Author Materials Sens
Liu et al. (2009) MWCNT network 0.00Yu et al. (2006) PEI/MWCNT lm 0.00Cao et al. (2011) Acid treated MWCNT lm 0.01Yoo et al. (2010) O2 plasma-treated PI/MWCNT lm 0.00Tang et al. (2011) PI/MWCNT lm 0.00Chu et al. (2013) Carbon nanosheet based sensor 0.02Turkani et al. (2018) Functionalized MWCNT/HEC 0.04
This journal is © The Royal Society of Chemistry 2019
printed sensor followed the response of the integrated humiditysensor (HUMICAP 180, Vaisala) in the environmental chamber,when the relative humidity of the chamber was varied from 50%RH to 60% RH. Since the response time of the integratedhumidity sensor is less than 20 seconds, the response time ofthe printed humidity sensor was estimated to be z20 secondsand is comparable with the performance of conventionalimpedance type humidity sensors, which typically ranges from10 seconds to 30 seconds.6,63 The recovery curve of the printedhumidity sensor when the relative humidity of the chamber wasvaried from 60 %RH to 50 %RH is shown in Fig. 15(b). Therecovery time of the printed humidity sensor was estimated tobe z35 seconds and is also comparable with those of conven-tional impedance type humidity sensors, which typically rangefrom 15 seconds to 35 seconds.6
Fig. 16(a) shows the transient response of the printedhumidity sensor demonstrating dynamic humidication andde-humidication cycles. The relative humidity in the chamberwas interchanged between 20% RH and 80% RH, at a constantrelative temperature of 25 �C, and the response of the printedsensor followed the interchangeability with increase anddecrease in the resistance values. Throughout this experiment,the printed sensor yielded a consistent maximum resistivechange of z290%, thus demonstrating the repeatability of theprinted sensor. In addition, the stability of the printed humiditysensor, over time, was investigated by recording its resistive
umidity sensor and other reported printed sensors
itivity Response time Recovery time Ref.
56/% RH 3 s 25 s 1999/% RH 2 s 30 s 6054/% RH 50 s 140 s 2047/% RH Not reported Not reported 1518/% RH Less than 5 s Not reported 6168/% RH 30 s 90 s 6285/% RH z20 s z35 s Present work
Nanoscale Adv., 2019, 1, 2311–2322 | 2319

Fig. 15 (a) Response curve and (b) recovery curve of the printed humidity sensor.
Fig. 16 (a) Transient response of the printed humidity sensor and (b)stability of the printed humidity sensor.
Nanoscale Advances Paper
Ope
n A
cces
s A
rtic
le. P
ublis
hed
on 1
5 A
pril
2019
. Dow
nloa
ded
on 1
0/5/
2021
4:3
5:53
AM
. T
his
artic
le is
lice
nsed
und
er a
Cre
ativ
e C
omm
ons
Attr
ibut
ion
3.0
Unp
orte
d L
icen
ce.
View Article Online
response at different relative humidities (20% RH, 40% RH,60% RH, and 80% RH), for a period of 10 hours (Fig. 16(b)), ata constant chamber temperature of 25 �C. A dri of 0.10%,0.16%, 25%, 0.28% and 0.21% in the resistance was observedfor a constant relative humidity of 20% RH, 40% RH, 60% RH,
2320 | Nanoscale Adv., 2019, 1, 2311–2322
and 80% RH, respectively. It was observed that the printedhumidity sensor was capable of sensing a broad range of rela-tive humidities (20% RH to 80% RH) while demonstrating goodstability over time. From the results obtained, it is evident thatthe printed humidity sensor has the capability to be employedfor humidity sensing applications in the automobile, laboratoryand food industries.
4. Conclusion
In this work, a fully printed, highly sensitive, humidity sensorbased on a FMWCNT and HEC composite was successfullydeveloped for humidity monitoring applications. To enhancethe hydrophilicity, MWCNTs were treated in a mixture ofsulfuric and nitric acid. Transmission electron microscopy,Raman spectroscopy, Fourier transform infrared spectroscopyand dispersion analysis were performed to conrm the func-tionalization and the presence of functional groups on thesurface of the MWCNTs. A FMWCNT/HEC composite ink wasformulated with 2.5 wt% MWCNTs and the ratio betweenFMWCNTs and HEC was maintained at 1 : 6. A pair of elec-trodes with 24 ngers in an interdigitated geometry weredeposited using the screen printing process. The formulatedFMWCNT/HEC ink was deposited on the electrodes as thesensing layer using the gravure printing process. The perfor-mance of the printed humidity sensor was investigated bymeasuring its resistive response towards relative humidityvarying from 20% RH to 80% RH, in steps of 10% RH, ata constant temperature of 25 �C. The printed sensor exhibitedresistive changes as high as 290% at 80% RH, when comparedto its base resistance at 20% RHwith a sensitivity of 0.048/%RH.The obtained sensitivity of the sensor was greater than those ofseveral other MWCNT and MWCNT/polymer based humiditysensors reported. The reproducibility in terms of ink formula-tion and fabrication of sensors was also investigated. In addi-tion, the printed humidity sensor demonstrated a goodresponse time of z20 s when measured against a commercialhumidity sensor equipped in the environmental chamber.
These results demonstrate that humidity sensors fabricatedusing additive print manufacturing processes on exiblesubstrates, with the FMWCNT/HEC composite as the sensing
This journal is © The Royal Society of Chemistry 2019

Paper Nanoscale Advances
Ope
n A
cces
s A
rtic
le. P
ublis
hed
on 1
5 A
pril
2019
. Dow
nloa
ded
on 1
0/5/
2021
4:3
5:53
AM
. T
his
artic
le is
lice
nsed
und
er a
Cre
ativ
e C
omm
ons
Attr
ibut
ion
3.0
Unp
orte
d L
icen
ce.
View Article Online
material, have a signicant potential in humidity sensingapplications. Moreover, the printed humidity sensor canpotentially be implemented in applications where its light-weight and conformal features along with large scalemanufacturing capabilities are paramount for improved user–device interactions. Further research is underway to investigatethe performance of the printed humidity sensor for varyingtemperatures along with the compensation strategies. Researchis also being focused on the monolithic integration of a printedmicro-heater with the humidity sensor and, thereby, theimprovement of the reliability of the sensor by reducing thehysteresis. Finally, the effect of mechanical stresses such asbending, twisting, and stretching on the performance of thesensor is also under investigation to determine appropriateoutput compensation required, before implementing the prin-ted humidity sensor into a eld deployable sensing system.
Conflicts of interest
There are no conicts to declare.
Acknowledgements
V. S. Turkani acknowledges the Graduate Research Grant Awardfrom the Graduate College, Western Michigan University(WMU). We acknowledge the Center for Advanced SmartSensors and Structures, WMU for letting us use the screen andgravure printers to fabricate the sensors. We also acknowledgethe CAViDS Hybrid Electric Applied Research Lab and DrClaudia Fajardo for letting us use their Thermotron® environ-mental chamber. We acknowledge Mathew Stoops for hiscontribution to this study.
References
1 B. Patissier, Sens. Actuators, B, 1999, 59, 231–234.2 W. Vautz, J. I. Baumbach, M. Westhoff, K. Zuchner,E. T. H. Carstens and T. Perl, Int. J. Ion Mobility Spectrom.,2010, 13, 41–46.
3 E. Abad, F. Palacio, M. Nuin, A. G. D. Zarate, A. Juarros,J. Gomez and S. Marco, J. Food Eng., 2009, 93, 394–399.
4 E. Tan, W. Ng, R. Shao, B. Pereles and K. Ong, Sensors, 2007,7, 1747–1756.
5 B. M. Kulwicki, J. Am. Ceram. Soc., 1991, 74, 697–708.6 H. Farahani, R. Wagiran and M. Hamidon, Sensors, 2014, 14,7881–7939.
7 N. Yamazoe and Y. Shimizu, Sens. Actuators, 1986, 10, 379–398.
8 M. Packirisamy, I. Stiharu, X. Li and G. Rinaldi, Sens. Rev.,2005, 25, 271–276.
9 M. Matsuguchi, T. Kuroiwa, T. Miyagishi, S. Suzuki, T. Oguraand Y. Sakai, Sens. Actuators, B, 1998, 52, 53–57.
10 J.-H. Kim, S.-M. Hong, J.-S. Lee, B.-M. Moon and K. Kim,2009 4th IEEE International Conference on Nano/MicroEngineered and Molecular Systems, 2009.
11 D. Wang, Y. Huang, Y. Ma, P. Liu, C. Liu and Y. Zhang, J.Mater. Res., 2014, 29, 2845–2853.
This journal is © The Royal Society of Chemistry 2019
12 P.-G. Su and C.-S. Wang, Sens. Actuators, B, 2007, 123, 1071–1076.
13 D.-I. Lim, J.-R. Cha and M.-S. Gong, Sens. Actuators, B, 2013,183, 574–582.
14 M. Ueda, K. Nakamura, K. Tanaka, H. Kita andK.-I. Okamoto, Sens. Actuators, B, 2007, 127, 463–470.
15 K.-P. Yoo, L.-T. Lim, N.-K. Min, M. J. Lee, C. J. Lee andC.-W. Park, Sens. Actuators, B, 2010, 145, 120–125.
16 S. Iijima, Nature, 1991, 354, 56–58.17 J. Suehiro, G. Zhou and M. Hara, J. Phys. D: Appl. Phys., 2003,
36, L109.18 M. Atashbar, B. Bejcek and S. Singamaneni, IEEE Sens. J.,
2006, 6, 524–528.19 L. Liu, X. Ye, K. Wu, R. Han, Z. Zhou and T. Cui, Sensors,
2009, 9, 1714–1721.20 C. L. Cao, C. G. Hu, L. Fang, S. X. Wang, Y. S. Tian and
C. Y. Pan, J. Nanomater., 2011, 2011, 1–5.21 Z. Imran, S. Batool, H. Jamil, M. Usman, M. Israr-Qadir,
S. Shah, S. Jamil-Rana, M. Raq, M. Hasan andM. Willander, Ceram. Int., 2013, 39, 457–462.
22 P. K. Kannan, R. Saraswathi and J. B. B. Rayappan, Sens.Actuators, A, 2010, 164, 8–14.
23 J. Gao, J. Siden, H.-E. Nilsson and M. Gulliksson, IEEE Sens.J., 2013, 13, 1824–1834.
24 V. Sanchez-Romaguera, S. Wunscher, B. M. Turki, R. Abbel,S. Barbosa, D. J. Tate, D. Oyeka, J. C. Batchelor, E. A. Parker,U. S. Schubert and S. G. Yeates, J. Mater. Chem. C, 2015, 3,2141–2142.
25 T. Vuorinen, M.-M. Laurila, R. Mangayil, M. Karp andM. Mantysalo, EMBEC & NBC 2017 IFMBE Proceedings,2017, pp. 839–842.
26 S. Yao and Y. Zhu, Nanoscale, 2014, 6, 2345.27 A. S. G. Reddy, B. B. Narakathu, M. Z. Atashbar, M. Rebros,
E. Rebrosova, B. J. Bazuin, M. K. Joyce, P. D. Fleming andA. Pekarovicova, Sens. Lett., 2011, 9, 869–871.
28 S. Emamian, B. B. Narakathu, A. A. Chlaihawi, B. J. Bazuinand M. Z. Atashbar, Sens. Actuators, A, 2017, 263, 639–647.
29 A. A. Chlaihawi, S. Emamian, B. B. Narakathu, M. M. Ali,D. Maddipatla, B. J. Bazuin and M. Z. Atashbar, Sens.Actuators, A, 2017, 268, 1–8.
30 S. G. R. Avuthu, J. T. Wabeke, B. B. Narakathu,D. Maddipatla, J. S. Arachchilage, S. O. Obare andM. Z. Atashbar, IEEE Sens. J., 2016, 16, 8678–8684.
31 B. B. Narakathu, S. G. R. Avuthu, A. Eshkeiti, S. Emamianand M. Z. Atashbar, IEEE Sens. J., 2015, 15, 6374–6380.
32 S. Emamian, A. Eshkeiti, B. B. Narakathu, S. G. R. Avuthuand M. Z. Atashbar, Sens. Actuators, B, 2015, 217, 129–135.
33 B. B. Narakathu, M. S. Devadas, A. S. G. Reddy, A. Eshkeiti,A. Moorthi, I. R. Fernando, B. P. Miller, G. Ramakrishna,E. Sinn, M. Joyce, M. Rebros, E. Rebrosova, G. Mezei andM. Z. Atashbar, Sens. Actuators, B, 2013, 176, 768–774.
34 A. Eshkeiti, B. B. Narakathu, A. S. G. Reddy, A. Moorthi andM. Z. Atashbar, Sens. Actuators, B, 2012, 171, 705–711.
35 G. A. D. R. Benatto, B. Roth, M. Corazza, R. R. Søndergaard,S. A. Gevorgyan, M. Jørgensen and F. C. Krebs, Nanoscale,2016, 8, 318–326.
Nanoscale Adv., 2019, 1, 2311–2322 | 2321
Nanoscale Advances Paper
Ope
n A
cces
s A
rtic
le. P
ublis
hed
on 1
5 A
pril
2019
. Dow
nloa
ded
on 1
0/5/
2021
4:3
5:53
AM
. T
his
artic
le is
lice
nsed
und
er a
Cre
ativ
e C
omm
ons
Attr
ibut
ion
3.0
Unp
orte
d L
icen
ce.
View Article Online
36 D. Angmo, T. R. Andersen, J. J. Bentzen, M. Helgesen,R. R. Søndergaard, M. Jørgensen, J. E. Carle, E. Bundgaardand F. C. Krebs, Adv. Funct. Mater., 2015, 25, 4539–4547.
37 H. Zhu, B. B. Narakathu, Z. Fang, A. T. Aijazi, M. Joyce,M. Atashbar and L. Hu, Nanoscale, 2014, 6, 9110.
38 K.-S. Kim, K.-H. Jung and S.-B. Jung, Microelectron. Eng.,2014, 120, 216–220.
39 A. Eshkeiti, A. S. G. Reddy, S. Emamian, B. B. Narakathu,M. Joyce, M. Joyce, P. D. Fleming, B. J. Bazuin andM. Z. Atashbar, IEEE Trans. Compon., Packag., Manuf.Technol., 2015, 5, 415–421.
40 V. S. Turkani, D. Maddipatla, B. B. Narakathu, B. J. Bazuinand M. Z. Atashbar, in 17th International Meeting onChemical Sensors, IMCS Proceedings, 2018, pp. 519–520,DOI: 10.5162/imcs2018/p1fw.5.
41 L. Xie, Y. Feng, M. Mantysalo, Q. Chen and L. R. Zheng, IEEESens. J., 2013, 13(10), 3948–3956.
42 K. A. Wepasnick, B. A. Smith, K. E. Schrote, H. K. Wilson,S. R. Diegelmann and D. H. Fairbrother, Carbon, 2011, 49,24–36.
43 S. Rahmam, N. M. Mohamed and S. Suan, Mater. Res.Innovations, 2014, 18, S6–S196.
44 A. Osorio, I. Silveira, V. Bueno and C. Bergmann, Appl. Surf.Sci., 2008, 255, 2485–2489.
45 H. Menon, R. Aiswarya and K. P. Surendran, RSC Adv., 2017,7, 44076–44081.
46 W. Wang, J. Wang, Y. Kang and A. Wang, Composites, Part B,2011, 42, 809–818.
47 J. N. Israelachvili, Intermolecular and Surface Forces,Academic press, 2011, pp. 415–438.
48 A. Rudawska and J. Elzbieta, Int. J. Adhes. Adhes., 2009, 29(4),451–457.
49 C. E. Stauffer, J. Phys. Chem., 1965, 69, 1933–1938.
2322 | Nanoscale Adv., 2019, 1, 2311–2322
50 Y. Yuan and T. R. Lee, Surface Science Techniques SpringerSeries in Surface Sciences, 2013, pp. 3–34.
51 M. Farbod, A. Zilaie and I. Kazeminezhad, Journal of Science:Advanced Materials and Devices, 2017, 2, 99–104.
52 M. Dresselhaus, G. Dresselhaus, A. Jorio, A. S. Filho andR. Saito, Carbon, 2002, 40, 2043–2061.
53 S. D. Kim, J. W. Kim, J. S. Im, Y. H. Kim and Y. S. Lee, J.Fluorine Chem., 2007, 128, 60–64.
54 A. Loiseau, P. Launois, P. Petit, S. Roche and J. P. Salvetat,Lect. Notes Phys., 2006, 677, 495–543.
55 M. Wongaree, S. Chiarakorn and S. Chuangchote, J.Nanomater., 2015, 2015, 1–10.
56 W. O. G., J. Mol. Struct., 1995, 372, 285.57 O. Varghese, P. Kichambre, D. Gong, K. Ong, E. Dickey and
C. Grimes, Sens. Actuators, B, 2001, 81, 32–41.58 R. Pati, Y. Zhang, S. K. Nayak and P. M. Ajayan, Appl. Phys.
Lett., 2002, 81, 2638–2640.59 S. Muto, O. Suzuki, T. Amano and M. Morisawa, Meas. Sci.
Technol., 2003, 14, 746–750.60 H. Yu, T. Cao, L. Zhou, E. Gu, D. Yu and D. Jiang, Sens.
Actuators, B, 2006, 119, 512–515.61 Q.-Y. Tang, Y. Chan and K. Zhang, Sens. Actuators, B, 2011,
152, 99–106.62 J. Chu, X. Peng, P. Feng, Y. Sheng and J. Zhang, Sens.
Actuators, B, 2013, 178, 508–513.63 Y. Sakai, Y. Sadaoka and M. Matsuguchi, Sens. Actuators, B,
1996, 35, 85–90.64 Suspended carbon nanotubes for humidity sensing.65 T. Fei, H. Zhao, K. Jiang, X. Zhou and T. Zhang, J. Appl.
Polym. Sci., 2013, 130, 2056–2061.66 W. Kim, A. Javey, O. Vermesh, Q. Wang, Y. Li and H. Dai,
Nano Lett., 2003, 3, 193–198.
This journal is © The Royal Society of Chemistry 2019